Embed Size (px)
Citation preview

Pertanika J. Soc. Sci. & Hum. 26 (T): 181 - 192 (2018)
ISSN: 0128-7702 © Universiti Putra Malaysia Press
SOCIAL SCIENCES & HUMANITIESJournal homepage: http://www.pertanika.upm.edu.my/
E-mail addresses: [email protected] (Adryan Rachman)[email protected] (Ratih Hurriyati)[email protected] (Lili Adi Wibowo)[email protected] (Vanessa Gaffar) * Corresponding author
Article history:Received: 18 September 2017Accepted: 12 March 2018
ARTICLE INFO
Analysis of Users’ Satisfaction with Website Service of STIE Inaba Bandung
Adryan Rachman*, Ratih Hurriyati, Lili Adi Wibowo and Vanessa Gaffar Universitas Pendidikan Indonesia, Jl. Dr. Setiabudi no 229, Bandung 40154, Indonesia
ABSTRACT
This study discusses the importance of the internet to improve the competitive edge of Sekolah Tinggi Ilmu Ekonomi Inaba (Inaba School of Business) Bandung compared with other universities. The STIE Inaba Bandung’s website www.inaba.ac.id serves as a communication medium to provide information for students, lecturers, and the general public. This research adopted a survey method to analyse the effects of website design and information quality on user satisfaction. A total of 39 questionnaires were distributed to 2016 first-semester postgraduate students from Management Studies. A quantitative method by using structural equation model, partial least square SEM – PLS, was used to analyse the data. Findings showed that website design and quality of information had a positive effect on user satisfaction.
Keywords: Communication medium, information quality, user satisfaction, website service, web design
INTRODUCTION
The Internet has become a popular medium of communication and the website of Sekolah Tinggi Ilmu Ekonomi Inaba (STIE), www.inaba.ac.id, serves as a medium of
communication that provides information for students, faculty, and the general public.
Many factors affect user satisfaction (students) of a website, namely web design, quality of information, speed, web navigation, personalisation, and others. Satisfaction refers to student expectations of the website service in terms of its design and quality of information. A website design that has good quality of information will impact positively on users’ satisfaction. Thus, STIE Inaba should focus on increasing user satisfaction.

Adryan Rachman, Ratih Hurriyati, Lili Adi Wibowo and Vanessa Gaffar
182 Pertanika J. Soc. Sci. & Hum. 26 (T): 181 - 192 (2018)
Al-Kasasbeh, Dasgupta and Al-Faouri (2011) examine users satisfaction pertaining to the online system of University of Petra. The dimensions were website design, navigation, and personalisation. The results showed that all three dimensions affected the users’ satisfaction of the online system at the University of Petra, Jordan. Subsequent research by Al-Manasra, Zaid and TaherQutaishat (2013) investigated customer satisfaction in the telecommunication sector in Jordan from the perspective of website quality, namely quality of information, interaction and service quality, and ease of use. The results showed all these had a positive and significant effect on the telecommunication users’ satisfaction. Maditinos, Chatzoudes, Tsairidis and Theriou (2011) found that some website’s attributes contribute to user satisfaction. User satisfaction refers to how satisfied the users are to a website. The results showed that each attribute influenced information quality, system quality, security, privacy, and ultimately affected user satisfaction.
Ranjbarian, Sanayei, Kaboli and Hadadian (2012) s tudied customer satisfaction of online booking. Five variables of customers’ satisfaction were examined, namely convenience, merchandising, web design, security, and service. The results showed four variables significantly influenced customer satisfaction: convenience, merchandising, security, and service. On the other hand, web design does not have a significant impact on the customer satisfaction. However, it is different from the results of research
conducted by Al-Kasasbeh et al. (2011), who reported that web design has a significant influence on the satisfaction level of internet users.
Sanjaya (2012) on the website service of the Communication and Information Technology Ministry (Kemenkominfo) showed that from the 3-dimensional WebQual 4.0, only the dimensions of usability and interaction quality are considered influential to the users’ satisfaction, while the dimension of information quality is considered to be influential for users’ satisfaction of websites service.
In this study, the authors discuss the quality of a website from two-dimensions: web design and information quality. Web design can be in the form of the website’s visual display, the use of images, colours, photos, and the type of text that is used to make the website attractive. The information quality refers to the presence of information on the website that provides a high level of usefulness to the users. Based on the above explanation, the present authors conducted research on “Analysis of Users’ Satisfaction with the Service Website of STIE INABA Bandung”.
Formulation of the Problems
1. Are there any significant effects between the web designs and users’ satisfaction with the service website of STIE Inaba Bandung?
2. Are there any significant influences of the information quality to users’ satisfaction with the service website of STIE Inaba Bandung?
Analysis of Users’ Satisfaction with Website
183Pertanika J. Soc. Sci. & Hum. 26 (T): 181 - 192 (2018)
LITERATURE REVIEW
Satisfaction
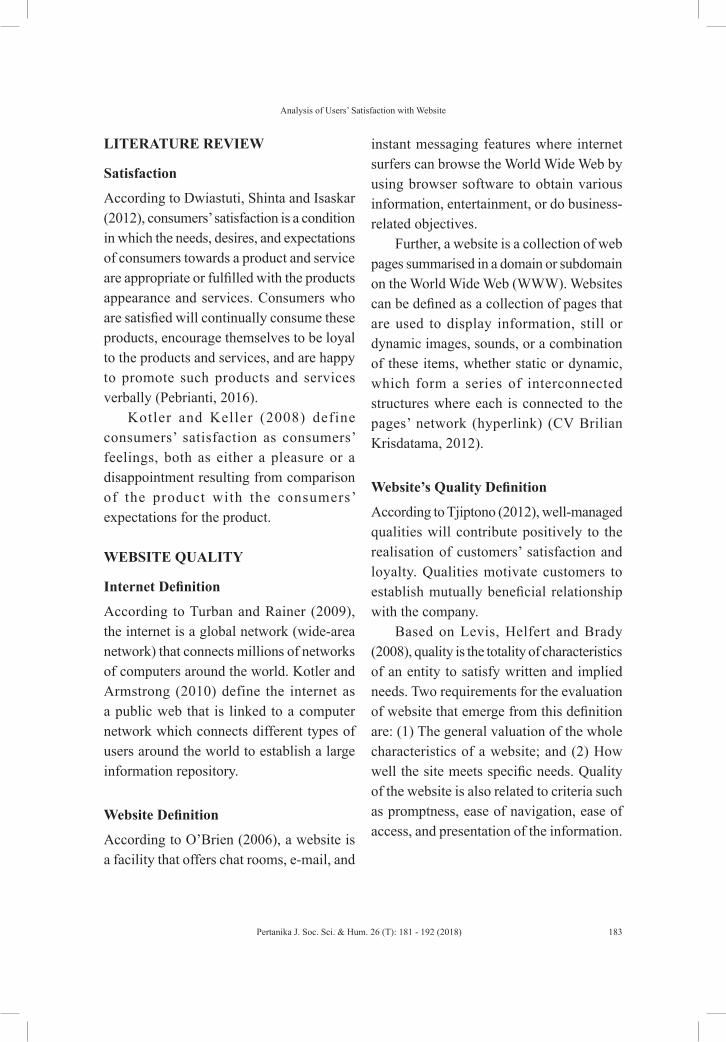
According to Dwiastuti, Shinta and Isaskar (2012), consumers’ satisfaction is a condition in which the needs, desires, and expectations of consumers towards a product and service are appropriate or fulfilled with the products appearance and services. Consumers who are satisfied will continually consume these products, encourage themselves to be loyal to the products and services, and are happy to promote such products and services verbally (Pebrianti, 2016).
Kotler and Keller (2008) define consumers’ satisfaction as consumers’ feelings, both as either a pleasure or a disappointment resulting from comparison of the product with the consumers’ expectations for the product.
WEBSITE QUALITY
Internet Definition
According to Turban and Rainer (2009), the internet is a global network (wide-area network) that connects millions of networks of computers around the world. Kotler and Armstrong (2010) define the internet as a public web that is linked to a computer network which connects different types of users around the world to establish a large information repository.
Website Definition
According to O’Brien (2006), a website is a facility that offers chat rooms, e-mail, and
instant messaging features where internet surfers can browse the World Wide Web by using browser software to obtain various information, entertainment, or do business-related objectives.
Further, a website is a collection of web pages summarised in a domain or subdomain on the World Wide Web (WWW). Websites can be defined as a collection of pages that are used to display information, still or dynamic images, sounds, or a combination of these items, whether static or dynamic, which form a series of interconnected structures where each is connected to the pages’ network (hyperlink) (CV Brilian Krisdatama, 2012).
Website’s Quality Definition
According to Tjiptono (2012), well-managed qualities will contribute positively to the realisation of customers’ satisfaction and loyalty. Qualities motivate customers to establish mutually beneficial relationship with the company.
Based on Levis, Helfert and Brady (2008), quality is the totality of characteristics of an entity to satisfy written and implied needs. Two requirements for the evaluation of website that emerge from this definition are: (1) The general valuation of the whole characteristics of a website; and (2) How well the site meets specific needs. Quality of the website is also related to criteria such as promptness, ease of navigation, ease of access, and presentation of the information.

Adryan Rachman, Ratih Hurriyati, Lili Adi Wibowo and Vanessa Gaffar
184 Pertanika J. Soc. Sci. & Hum. 26 (T): 181 - 192 (2018)
Dimensions of Website Qualities
Al-Kasasbeh et al. (2011) tested the online system users’ satisfaction at the University of Petra, Jordan based on the following dimensions, such as website design, navigation, and personalisation. Jasur Hasanov (2015) revealed the dimensions of service qualities that consist of ease of access, information quality, and service quality of the interaction. In this study, two (2) dimensions that will be examined are web design and information quality.
1) Web Design Quality
According to Al-Kasasbeh et al. (2011), web design is measured by the visual presentation, use of graphics, colours and images, and the diversity of fonts used in the website.
2) Information Quality
According to Yaghoubi (2011), information qualify refers to the website’s quality of content and information relevancy to the user’s purpose, for example, the level of accuracy, context, form/display, and the relevance of the information.
Therefore, it can be concluded that information quality refers to the quality of information both in terms of accuracy, relevance, context, and form of presentation.
Maditinos et al. (2011), McKinney, Yoon and Zahedi (2002) found understandability, reliability, and usefulness of information as a key dimension of information quality.
• Understandability is the extent to which the information can be easily understood by users. It measures how well a website presents information so that it is clear, meaningful, and can be interpreted and understood. Thus, it depends on the information format or the form, conciseness, and consistency.
• Reliable information means that the information is valid. Reliability can be ensured only if several conditions are met. For example, if the information is accurate, up-to-date, objective, and came from a legitimate source, it should be considered as reliable. Xiao and Dasgupta (2002) found that the promptness and accuracy of information play an important role in the satisfaction development.
• Useful information means that the information can be used effectively for a particular purpose. In other words, usefulness enables the website users to use the information for their respective purposes. Therefore, it is important that the information is complete, relevant, and includes all the necessary details.

Analysis of Users’ Satisfaction with Website
185Pertanika J. Soc. Sci. & Hum. 26 (T): 181 - 192 (2018)
Hypothesis
Based on the theoretical and conceptual framework, the hypotheses proposed are: 1) Web design has a positive and significant
influence on users’ satisfaction with the website service of STIE Inaba Bandung; 2) Information quality has a positive and significant impact on users’ satisfaction with the website service of STIE Inaba Bandung.
Figure 1. Conceptual framework of the research
7Analysis of Users’ Satisfaction with the Website
7
play an important role in the satisfaction development.
● Useful information means that the information can be used effectively
for a particular purpose. In other words, usefulness enables the website
users to use the information for their respective purposes. Therefore, it
is important that the information is complete, relevant, and includes all
the necessary details.
Figure 1. Conceptual Framework of the Research
Table 1
Variables and indicators Variable
Users’ satisfaction on the website
service
(Adapted from Al-Kasasbeh, 2011)
I am satisfied with the web services provided of STIE Inaba Bandung
I am satisfied with the quality of STIE Inaba Bandung website design
I am satisfied with the quality of information of the website of STIE
Inaba Bandung
I am satisfied with the ease of use of the website of STIE Inaba Bandung
Website design
(Adapted from Al-Kasasbeh, 2011)
Visual presentation on the website of STIE Inaba Bandung
The use of colour on the website of STIE Inaba Bandung
The use of graphics and photos website STIE Inaba Bandung
Diversity of texts in the website of STIE Inaba Bandung
The speed of access of STIE Inaba Bandung website
Information quality
(Adapted from Al-Manasra et al,
The website of STIE Inaba Bandung provides accurate information
The website of STIE Inaba Bandung provides reliable information
The website provides useful information to users
Table 1 Variables and indicators
VariableUsers’ satisfaction on the website service(Adapted from Al-Kasasbeh, 2011)
I am satisfied with the web services provided of STIE Inaba BandungI am satisfied with the quality of STIE Inaba Bandung website designI am satisfied with the quality of information of the website of STIE Inaba BandungI am satisfied with the ease of use of the website of STIE Inaba Bandung
Website design (Adapted from Al-Kasasbeh, 2011)
Visual presentation on the website of STIE Inaba Bandung The use of colour on the website of STIE Inaba Bandung The use of graphics and photos website STIE Inaba Bandung Diversity of texts in the website of STIE Inaba Bandung The speed of access of STIE Inaba Bandung website
Information quality(Adapted from Al-Manasra et al, 2013)
The website of STIE Inaba Bandung provides accurate informationThe website of STIE Inaba Bandung provides reliable informationThe website provides useful information to usersThe website provides information that can be easily understood by usersThe website provides information that is relevant to users
Adryan Rachman, Ratih Hurriyati, Lili Adi Wibowo and Vanessa Gaffar
186 Pertanika J. Soc. Sci. & Hum. 26 (T): 181 - 192 (2018)
MATERIALS AND METHODS
Study Research Object
Population and sample
According to Sugiyono (2012), population refers to subjects in a region that have certain qualities and characteristics defined by the researchers to be studied and then concluded. Husein Umar (2008) states that population is a collection of elements that has certain characteristics in common and equal opportunities to be selected into the sample.
The population of this study is 39 first-semester postgraduate Management Studies students. According to Sugiyono (2012), sample is a part of the population’s number and characteristics. The sampling technique used in this research is total sampling technique. Total sampling technique refers to the sampling technique where all members of the population are used as the sample.
The sampling collection was done using total sampling technique, meaning that all of the population are the sample of this study.
Operational Definition of the Variables
Dependent variables
Satisfaction with the website service
• Satisfaction with web service
• Satisfaction on the web design
• Satisfaction with the information quality
• Satisfaction on the web accessibility
Independent variables
Website Quality
• Visual
• Colour
• Graphics
• Text
• Speed
Information quality
• Accuracy
• Reliability
• Usefulness
• Relevancy to the users
Data Analysis Techniques
Data analysis technique used in this research is the track/path analysis using software Smart PLS (Partial Least Square) 3.0. The evaluation model of Partial Least Square (PLS) is based on non-parametric predictions measurement (Ghozali, 2008).
1. The measurement or outer model with reflexive indicators was analysed by the convergent and discriminant validity of the indicators and composite reliability for the block indicators.
2. The structural or inner model are analysed by observing the variance percentage explained by the values of R2.

Analysis of Users’ Satisfaction with Website
187Pertanika J. Soc. Sci. & Hum. 26 (T): 181 - 192 (2018)
3. Dai stability estimation was analysed by using the statistics of the t test obtained through bootstrapping procedure.
Descriptive analysis is used to describe the respondents in this study which is based on the percentage value of the respondents’ answers. The frequency of the descriptive analysis is used to present and describe the obtained data. Data is then shown separately which consists of one variable only.
RESULTS AND DISCUSSIONS
Respondents’ Profile
The following table is a descriptive profile of the 39 respondents in this study.
Table 2 Descriptive profile of the respondents
Category Description Percentage<20 021-30 1531-40 6541-50 8
Age> 50 2Male - male 28Female 72
Source: Data processed (2016)
Validity and Reliability Test of the Research Variables
Reliability test
Reliability test relates to the consistency of the variables used in the study. The variables should have an alpha value Cronbach > 0.6. Table 3 shows that all variables used are reliable.
Validity test
Validity test is used to measure the accuracy of the indicators and variables used in the study. Each indicator must have a Pearson r values above 0.197. It can be seen from Table 4 all the indicators used are valid and eligible.
Table 3 Reliability test
Variable Cronbach Alpha
Description
Web users’ experience web
0.834 Reliable
Web design 0.812 ReliableInformation quality 0881 ReliableSource: Data processed, 2016
Table 4 Validity test
Variable Indicator Pearson NoteWebsite users’ satisfaction
Y1 0.624 ValidY2 0.796 InvalidY3 0.797 InvalidY4 0.798 Valid
Web design X1.1 0.799 ValidX1.2 0.800 ValidX1.3 0.801 ValidX1.4 0.802 ValidX1.5 0.803 Valid
Information quality
X2.1 0.804 ValidX2 2 0.805 ValidX2.3 0.806 ValidX2.4 0.807 ValidX2.5 0.721 Valid
Source: Data processed, 2016

Adryan Rachman, Ratih Hurriyati, Lili Adi Wibowo and Vanessa Gaffar
188 Pertanika J. Soc. Sci. & Hum. 26 (T): 181 - 192 (2018)
Research Variables Description
The questionnaire administered to the respondents concerned website users’
satisfaction, website design, and information quality. Table 5 below contains results of the survey:
Table 5 Website users’ satisfaction
Variable Indicator Score Total Total % AverageWeb users’ satisfaction value %
Satisfaction with the web service 152 95.5% 91.5%Satisfaction with the web design 144 91.5%Satisfaction with the quality of information 146 92.5%Satisfaction with the web’s ease of use 137 88%
Source: Data processed, 2016
Based on Table 5, the average users’ satisfaction for the website is 91.5%. It means the students’ satisfaction as users
of STIE INABA Bandung website can be classified in the category of “good”.
Table 6 Website design
Variable Indicator Score Total Total % AverageWeb design value % Visual presentation on the web 149 94% 92%
Use of colour on the web 151 95%The use of graphics and photos 145 92%The diversity of text 145 92%Free access to the web 140 89.5%
Source: Data processed, 2016
Table 6 shows average percentage of variables of the web design is 92%. The value of web design is classified in the category of “good” which means the website design of STIE INABA Bandung website is
appealing for the students and prospective students to obtain more information and to increase the number of students in the new academic year.
Analysis of Users’ Satisfaction with Website
189Pertanika J. Soc. Sci. & Hum. 26 (T): 181 - 192 (2018)
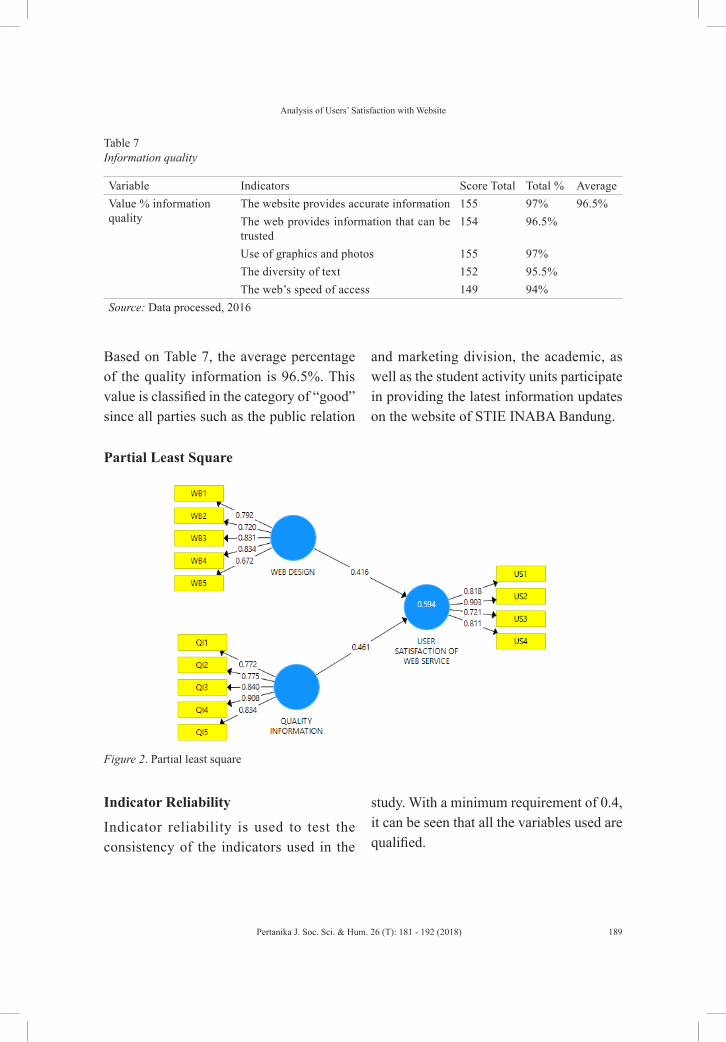
Based on Table 7, the average percentage of the quality information is 96.5%. This value is classified in the category of “good” since all parties such as the public relation
and marketing division, the academic, as well as the student activity units participate in providing the latest information updates on the website of STIE INABA Bandung.
Table 7 Information quality
Variable Indicators Score Total Total % AverageValue % information quality
The website provides accurate information 155 97% 96.5%The web provides information that can be trusted
154 96.5%
Use of graphics and photos 155 97%The diversity of text 152 95.5%The web’s speed of access 149 94%
Source: Data processed, 2016
Figure 2. Partial least square
15Analysis of Users’ Satisfaction with the Website
15
Partial Least Square
Figure 2. Partial least square
Indicator Reliability
Indicator reliability is used to test the consistency of the indicators
used in the study. With a minimum requirement of 0.4, it can be seen that all
the variables used are qualified.
Table 8
Reliability test Variable Indicator Reliability
Satisfaction with the web services 0.818
Satisfaction with the web design 0.903
Website users’
satisfaction Satisfaction with the quality of information 0.721
Satisfaction with the web’s ease of use .811
Visual presentation of the web 0.792
The use of colour in the web 0.720
Design web Use of graphics and photos 0.831
Diversity of the text .834
Indicator Reliability
Indicator reliability is used to test the consistency of the indicators used in the
study. With a minimum requirement of 0.4, it can be seen that all the variables used are qualified.
Partial Least Square

Adryan Rachman, Ratih Hurriyati, Lili Adi Wibowo and Vanessa Gaffar
190 Pertanika J. Soc. Sci. & Hum. 26 (T): 181 - 192 (2018)
Internal Consistency Reliability
Internal consistency reliability is used to measure the consistency of the variables used in the study. With the composite reliability above 0.6, it can be seen that all variables are eligible.
Table 8 Reliability test
Variable Indicator ReliabilityWebsite users’ satisfaction
Satisfaction with the web services 0.818Satisfaction with the web design 0.903Satisfaction with the quality of information 0.721Satisfaction with the web’s ease of use .811
Design web Visual presentation of the web 0.792The use of colour in the web 0.720Use of graphics and photos 0.831Diversity of the text .834Access speed of the web 0.672
Qualityinformation
The website provides accurate information 0.772The web provides information that can be trusted 0.775Use of graphics and photos .840Diversity of the text used 0.908Speed access to the web 0.834
Source: Data processed, 2016
Table 9 Composite reliability
Variable Composite Reliability
Description
Web user experience 0.915 ReliableWeb design 0.888 ReliableInformation quality 0.88 ReliableSource: Data processing, 2016
Validity Convergent
Validity Convergent is used to measure the accuracy of the variables used in the study. With the requisite values above 0.5 ave, it can be seen that all the variables used are valid.
Table 10 Validity convergent
Variable AVE DescriptionWeb user experience 0.685 ValidWeb design 0.666 ValidInformation quality 0597 ValidSource: Data processing, 2016

Analysis of Users’ Satisfaction with Website
191Pertanika J. Soc. Sci. & Hum. 26 (T): 181 - 192 (2018)
R-Square and Q-Square Values
Based on the table below, the website design’s influence and information quality on users’ satisfaction with its service is 59.4%.
Table 11 R-square
Variable R – SquareWeb users’ satisfaction -Web design -Information quality 0594Source: Data processing, 2016
Value Q2
= 1 - (1 - 0.594)= 1-0406= 0.594
The value of Q-Square showed the goodness of fit of the model used was 59.4% and thus, it was seemed suitable.
Hypothesis Testing
Hypothesis testing is used to see the value of each hypothesis with a minimum value of 5% that can be expressed as significant. Every hypothesis proposed in the study had a path coefficient value above 5%.
Table 12 Path coefficientt
Effect of path coefficients
t statistics
Web design -> Web users’ satisfaction
0.461 3.355
Information quality ->Web users’ satisfaction
0.416 2819
Source: Data processing, 2016
CONCLUSION
The results of the research conducted by Al-Manasra et al. (2013) who studied the impact of website quality on customers’ satisfaction to telecommunication companies in Jordan showed that website’s quality influences users’ satisfaction. The results show that there is a positive and significant correlation between the information quality and customer satisfaction in Jordan. This finding is corroborated by Al-Kasasbeh et al. (2011) who studied the factors affecting users’ satisfaction of University of Petra website. The results showed that web design has a positive and significant influence on the internet users’ satisfaction.
Based on the foregoing following conclusions were drawn in relation to the service website of STIE Inaba Bandung: 1) Web design has a positive and significant influence on user satisfaction 2) The quality of information has a positive and significant influence on user satisfaction 3) The information quality has the most dominant influence on users’ satisfaction.
REFERENCESAl-Kasasbeh, M., Dasgupta, S., & Al-Faouri, A.
(2011). Factors affecting e-service satisfaction. Communications of the IBIMA, 1-12. http://dx.doi.org/10.5171/2011.547937
Al-Manasra, E., A., Zaid, M. S. A., & TaherQutaishat, F. (2013). Investigating the impact of website quality on consumers’ satisfaction in Jordanian telecommunication sector. Arab Economic and Business Journal, 8(1-2), 31-37. http://dx.doi.org/10.1016/j.aebj.2013.11.004

Adryan Rachman, Ratih Hurriyati, Lili Adi Wibowo and Vanessa Gaffar
192 Pertanika J. Soc. Sci. & Hum. 26 (T): 181 - 192 (2018)
CV Brilian Krisdatama. (2012). Operasionalisasi dan pengembangan data sistem web Smecda.com. Jakarta: Deputi Bidang Pengkajian Sumber daya UKMK Kementerian Koperasi dan UKM Republik Indonesia.
Dwiastuti, R., Shinta, A., & Isaskar, R. (2012). Ilmu perilaku konsumen. Malang: Universitas Brawijaya Press (UB Press).
Ghozali, I. (2008). Structural equation modeling metode alternatif dengan PLS (2nd ed.). Semarang: Badan Penerbit Undip.
Hasanov, J., & Khalid, H. (2015). The impact of website quality on online purchase intention of organic food in Malaysia: A WebQual Model approach. Procedia Computer Science, 72, 382-389. https://doi.org/10.1016/j.procs.2015.12.153
Kotler, P., & Armstrong, G. (2010). Principles of marketing. USA: Pearson.
Kotler, P., & Keller, K. L. (2008). Manajemen pemasaran (Vol. 1). Jakarta: Penerbit Erlangga.
Levis, M., Helfert, M., & Brady, M. (2008). Website design quality and form input validation: An empirical study on irish corporate websites. Journal of Service Science and Management, 1, 91-100. https://doi.org/10.4236/jssm.2008.11009
Maditinos, D., Chatzoudes, D., Tsairidis, C., & Theriou, G. (2011). The impact of intellectual capital on firms’ market value and financial performance. Journal of Intellectual Capital, 12(1), 132-151. https://doi.org/10.1108/14691931111097944
McKinney, V., Yoon, K., & Zahedi, F. M. (2002). The measurement of web-customer satisfaction: An expectation and disconfirmation approach. Information Systems Research, 13(3), 296-315.
O’Brien, G., O’Keefe, P., Rose, J., & Wisner, B. (2006). Climate change and disaster management. Disasters, 30(1), 64-80. http://dx.doi.org/10.1111/j.1467-9523.2006.00307.x
Pebrianti, W. (2016). Web attractiveness, hedonic shopping value and online buying decision. International Journal of Economics and Management, 10(S1), 123-134.
Ranjbarian, B., Sanayei, A., Kaboli, M., & Hadadian, A. (2012). An analysis of brand image, perceived quality, customer satisfaction and re-purchase intention in Iranian department stores. International Journal of Business and Management, 7(6). http://dx.doi.org/10.5539/ijbm.v7n6p40
Sanjaya, F. (2012). Website service quality measurement method using ministry of communications with WebQual 4.0. Centre for Research and Development of Resources and Equipment of Post and Information Human Resources Research and Development Agency, KemkominfoRI, 14(1).
Sugiyono. (2012). This method business research. Bandung: Alfabeta
Tjiptono, F. (2012). Service management delivering excellent service. Yogyakarta: CV Andi Offset
Turban, E., & Rainer, R. K. (2009). Introduction to information systems: Enabling and transforming business (2nd ed.). John Wiley & Sons, Inc.
Umar, H. (2008). Research methods for thesis and thesis business. Jakarta: PT. Raja Grafindo Persada.
Xiao, L., & Dasgupta, S. (2002). Measurement of user satisfaction with web-based information systems: An empirical study. Eighth Americas Conference on Information Systems.
Yaghoubi, N. M. (2011). Internet bookstore quality assessment: Iranian evidence. African Journal of Business Management, 5(30), 12031-12039. http://dx.doi.org/10.5897/ajbm11.1152