Embed Size (px)
Citation preview

ANALYSIS OF TREMOR ACTIVITY AT Mt. EREBUSVOLCANO, ANTARCTICA
by Mario C. Ruiz Romero
Thesis
Submitted in partial fulfillment of the requirements for the degree of
Master of Science in Geophysics
Department of Earth and Environmental Science,
New Mexico Institute of Mining and Technology
May 2004

This work is dedicated to all people that strength and enlighten my life:
my wife Zammya, my children Mario and Carlos, my parents and all my family.
Also dedicated to the memory of Diego Viracucha, Victor Hugo Perez, and
Alvaro Sanchez, appreciated friends and colleagues,who died in Guagua Pichincha Volcano

ACKNOWLEDGMENTS:
This work was done on the base of the support of many people and institutions. I extendmy gratitude to Dr. Rick Aster and Dr. Phil Kyle for their guidance and teachings, to
Dave Wilson for his continuous help and friendship, to all people of Erebus field teams,because without their effort, nothing of this could be done.
NSF Office of Polar Programs grants OPP-9814291, OPP-0116577, OPP0229305,FUNDACYT, Leo Row Fund, and the Escuela Politecnica Nacional supported for thisresearch. Instrumentation assistance was provided by the IRIS PASSCAL Instrument
Center. We thank Doug Wiens for access to TAMESEIS data.

ABSTRACT In this study, more than 322 tremor -like signals recorded by the Mount Erebus
Volcano Observatory since June 2000 to July 2003 were analyzed. These events
occurred in three main periods: 2000-2001, 2002 and 2003, with the second
period containing the largest number of tremor episodes and also the largest
amplitude one. According to spectral characteristics, these events are classified as
harmonic (91%), chaotic (6%) and rapid-fire episodes (3%). Those tremor
episodes with small amplitudes and small amplitude ratio between E1S/BOM
originate at the outer flanks of the volcano, possibly related to the activity of large
and young icebergs. Tremor episodes with large amplitudes have large E1S/BOM
amplitude ratios, suggesting that they have a volcanic origin. These events were
located using amplitude distribution, semblance, and cross-correlations of
envelopes and spectrograms. Their hypocenters were found just beneath the
summit plateau or upper flanks of Erebus, several kilometers (3-9 km) deep.
Location of episodes with volcanic origin and their apparent disconnection with
surface activity, could be related to magmatic recharge processes due to a more
mafic and less viscous component than the phonolitic lava observed in the summit
crater system. Additional instrumentation (e.g. iceberg-based GPS and seismic
recorders) or different location techniques (e.g., array processing) may be useful
for locating and discriminating tremor-like signals generated at the outer flanks of
Erebus volcano.
TABLE OF CONTENTS
1 INTRODUCTION 1
2 GENERAL CHARACTERISTICS OF MT. EREBUS VOLCANO 3
2.1 Regional Geology 3
2.2 Description of Erebus Activity 4
2.3 Previous seismic studies 5
2.4 Reports of previous tremor activity 7
3 SEISMIC INSTRUMENTATION 9
3.1 Description of the Erebus Seismic Network 9
3.2 Additional instrumentation 13
3.3 Determination of response of seismic stations 14
3.4 Validation of empirical gain factors 19
3.5 Seismic velocity models for Erebus volcano 20
4 DESCRIPTION OF TREMOR ACTIVITY 23
4.1 Data presentation 25
4.2 Time distribution of recent tremor activity 25
4.2.1 First period of activity (June 2000 - October 2001) 25
4.2.2 Second period of activity (January 2002 - December 2002) 25
4.2.3 Third period of activity (January2003 - July 2003) 27
4.3 Frequency distribution of tremor episodes 28
4.3.1 First period of activity (June 2000 - October 2001) 29
4.3.2 Second period of activity (January 2002 - December 2002) 30
4.3.3 Third period of activity (January2003 - July 2003) 30
4.4 General classification of tremor episodes 32
4.4.1 Harmonic Tremor 34
4.4.2 Chaotic Tremor 39
4.4.3 Rapid-fire Tremor 40
4.5 Correlation with explosive activity inside the crater 47

5 LOCATION OF TREMOR SOURCES 51
5.1 Importance of source location 51
5.2 Description of methods for locating tremor sources at Erebus 53
5.2.1 General assumptions for locating tremor episodes 53
5.2.2 Iso-seismals distribution method 53
5.2.3 Semblance method 54
5.2.4 Cross correlation of signal envelopes 56
5.2.5 Spectral Cross-correlation 57
5.3 Validation of tremor location methods 58
5.3.1 Semblance method 60
5.3.2 Method of cross correlation of envelopes 61
5.3.3 Method of cross-correlation of spectrograms 63
5.3.4 Summary 64
5.4 Location of Tremor Episodes 65
5.4.1 Location of 02/02/03 Harmonic Tremor Episode 66
5.4.2 Location of 04/12/03 Harmonic Tremor Episode 73
5.4.3 Location of 01/18/03 Rapid-Fire Tremor Episode 81
5.4.4 Location of 02/01/03 Rapid-Fire Tremor Episode 88
5.5 Identification of tremor sources at Erebus volcano 96
5.5.1 Data preparation 96
5.5.2 Distribution of epicentral locations 97
5.5.3 Depth Distribution of Tremor Episodes 105
6 MODELLING OF TREMOR SOURCE 107
6.1 Summary of existing source models 107
6.1.1 Resonance models 108
6.1.1.1 Resonance by propagation of cracks 108
6.1.1.2 Resonance by disturbance of fluid 108
6.1.2 Models based on conduit oscillations 110
6.1.2.1 Slug Flow 110
6.1.2.2 Choked flow 110
6.2 Characteristics of tremor at Erebus 113
6.2.1 Amplitude 114
6.2.2 Location 115
6.2.3 Duration 116

6.2.4 Frequency content 116
6.2.5 Q value 117
6.3 Discussion of applicable models 119
7 SEISMIC SIGNALS FROM ICEBERGS 123
7.1 Introduction 123
7.2 Ross Sea Icebergs 123
7.3 Location of hydro-acoustic signals between 2000 and 2001 126
7.4 Amplitude distribution of tremor signals 132
8 CONCLUSIONS 136

TABLE OF FIGURES
3 SEISMIC INSTRUMENTATION
3.1 Description of the Erebus Seismic Network 12
3.2 Seismograms of the March 25, 2003 Teleseismic Event 13
3.3 Envelopes of the March 25, 2003 Teleseismic Event 13
3.4 Validation of empirical gain factors 20
4 DESCRIPTION OF TREMOR ACTIVITY
4.1 Tremor Activity and Number of Explosions 26
4.2 Duration of tremor episodes 28
4.3 Distribution of fundamental frequencies 31
4.4 Number of overtones 32
4.5 Distribution of types of tremor episodes 34
4.6 Harmonic tremor episode: Feb. 23, 2001 35
4.7 Upward gliding: Feb. 9, 2001 Tremor Episode 36
4.8 Downward gliding: Feb. 2, 2001 Tremor Episode 37
4.9 Period doubling: July 17, 2002 Tremor Episode 38
4.10 Chaotic tremor episode: March 27, 2003 40
4.11 Rapid fire tremor episode: Feb. 1, 2003 43
4.12 Rapid fire tremor episode: June 19, 2003 44
4.13 Amplitude comparison of June 19, 2003 Rapid Fire Tremor Episode 45
4.14 Rapid fire tremor episode: July 2, 2003 46
4.15 Power spectrum of the July 2, 2003 Rapid Fire Tremor Episode 47
4.16 Video observations of crater activity during 2001 and 2002 50
5 LOCATION OF TREMOR SOURCES
5.1 Seismograms of synthetic tremor 59
5.2 Location of synthetic tremor using the semblance method 61
5.3 Location of synthetic tremor using the cross correlation of envelopes 62
5.4 Location of synthetic tremor using the cross correlation of specgrams 65
5.5 Seismograms of the 2/ 2/03 Tremor Episode 67

5.6 Amplitude distribution of the 2/2/03 Tremor Episode 68
5.7 Amplitude ratios for the 2/2/03 Tremor Episode 69
5.8 Location of the 2/ 2/03 using the semblance method 70
5.9 Location of the 2/2/03 using cross-correlation of envelopes 71
5.10 Location of the 2/2/03 using cross-correlation of specgrams 72
5.11 Seismograms of the 4/12/03 Tremor Episode 74
5.12 Amplitude distribution of the 4/12/03 Tremor Episode 75
5.13 Amplitude ratios for the 4/12/03 Tremor Episode 76
5.14 Location of the 4/1 2/03 using the semblance method 77
5.15 Location of the 4/12/03 using cross-correlation of envelopes 78
5.16 Location of the 4/12/03 using cross-correlation of specgrams 80
5.17 Seismograms of the 1/17/03 Tremor Episode 82
5.18 Amplitude distribution of the 1/17/03 Tremor Episode 83
5.19 Amplitude ratios for the 1/17/03 Tremor Episode 84
5.20 Location of the 1/17/03 using the semblance method 85
5.21 Location of the 1/17/03 using cross-correlation of envelopes 86
5.22 Location of the 1/17/03 using cross-correlation of specgrams 87
5.23 Seismograms of the 2/1/03 Tremor Episode 89
5.24 Amplitude distribution of the 2/1/03 Tremor Episode 90
5.25 Amplitude ratios for the 2/1/03 Tremor Episode 91
5.26 Location of the 2/1/03 using the semblance method 92
5.27 Location of the 2/1/03 using cross-correlation of envelopes 93
5.28 Location of the 2/1/03 using cross-correlation of specgrams 95
5.29 Location of tremor episodes in 2000 using the semblance method 99
5.30 Location of tremor episodes in 2001 using the semblance method 100
5.31 Location of tremor episodes in 2002 using the semblance method 101
5.32 Location of tremor episodes in 2003 A using the semblance method 102
5.32 Location of tremor episodes in 2003 B using the semblance method 103
5.33 Location of rapid-fire tremor using the semblance method 104
5.34 Depth distribution of tremor episodes 106
6 MODELLING OF TREMOR SOURCE
6.1 Sketch of constricted flow (Julian) model 111
6.2 Synthetic signals generated with Julian model 112
6.3 Spectra of synthetic tremor generated with Julian model 113

7 SEISMIC SIGNALS FROM ICEBERGS
7.1 Satellite image of Ross Sea on 12/27/01 124
7.2 Satellite image of Ross Sea Icebergs on 10/9/03 125
7.3 Satellite image of Ross Sea Icebergs on 11/28/03 125
7.4 Spectrograms of 11/21/00 T-phase signal 129
7.5 Seismic signals and specgrams of 11/21/00 iceberg event 130
7.6 Spectrograms of 12/12/00 T-phase signal 131
7.7 Seismic signals and specgrams atHOO and ABB of 11/21/00 event 131
7.8 Amplitude decay from geometrical spreading 133
7.9 Distribution of amplitude ratios of tremor episodes 134
7.10 Distribution of amplitude ratios according to tremor amplitude 135
LIST OF TABLES
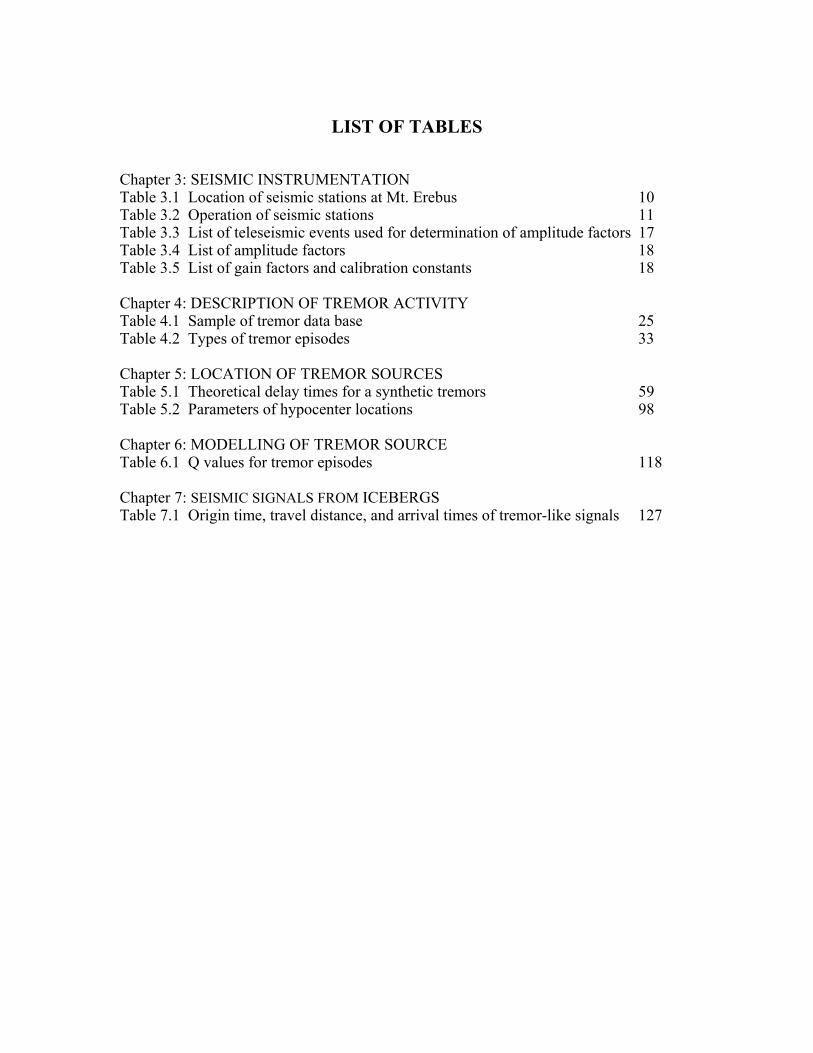
Chapter 3: SEISMIC INSTRUMENTATION Table 3.1 Location of seismic stations at Mt. Erebus 10 Table 3.2 Operation of seismic stations 11 Table 3.3 List of teleseismic events used for determination of amplitude factors 17 Table 3.4 List of amplitude factors 18 Table 3.5 List of gain factors and calibration constants 18 Chapter 4: DESCRIPTION OF TREMOR ACTIVITY Table 4.1 Sample of tremor data base 25 Table 4.2 Types of tremor episodes 33 Chapter 5: LOCATION OF TREMOR SOURCES Table 5.1 Theoretical delay times for a synthetic tremors 59 Table 5.2 Parameters of hypocenter locations 98 Chapter 6: MODELLING OF TREMOR SOURCE Table 6.1 Q values for tremor episodes 118 Chapter 7: SEISMIC SIGNALS FROM ICEBERGS Table 7.1 Origin time, travel distance, and arrival times of tremor-like signals 127

1
ANALYSIS OF TREMOR ACTIVITY AT Mt. EREBUS VOLCANO,ANTARCTICA
1. INTRODUCTION
Volcanic tremor is a long duration seismic signal generated inside an active
volcano or geothermal field due to internal volcanic processes. Tremor differs from
discrete seismic events in having a very emergent initiation, and its largest amplitudes
can be located at any part of the episode. One of the more distinctive common
characteristics of volcanic tremor is the concentration of seismic energy in narrow
frequency bands. When the spacing between these frequency peaks is constant, the
signal is called harmonic tremor.
Since the early days of instrumental seismology, tremor episodes have been
recorded in active volcanoes (Palmieri recorded tremor signals from Vesuvius in 1856-
1873, and Omori recorded Usu eruption' signals in 1911-1912; Davidson, 1927).
Nowadays, tremor is one of the most important parameters used in volcano monitoring
because it is recognized as the most common short-term precursor of impending
eruptions of calderas (Newhall and Dzurisin, 1988) and phreatic eruptions (Barberi et al.,
1992). McNutt (1994) documented that 65% of tremor episodes accompany eruptions
and 20% precede eruptions in a time frame of minutes to hours. Furthermore, analysis of
tremor episodes can bring important information about the type of activity occurring
inside the volcano, the location and extension of the magmatic plumbing system, and the

2
type of fluids that are being transported in it.
Tremor activity has been recorded from 2000 to 2003 at Mt. Erebus volcano by
the Mt. Erebus Volcanic Observatory (MEVO) seismic network installed by New Mexico
Tech. The objectives of this study are to characterize the tremor activity observed at Mt.
Erebus and to examine its implications to the source, and for the structure and dynamics
of the volcano. These objectives are intended to be reached based on a description, a
classification and a location of the tremor signals. The following activities are addressed
here:
Identify tremor episodes in analog and digital seismic records
Obtain parameters of tremor activity and define tremor families
Locate sources of tremor families, and
Discuss models for tremor generation.
In Chapter 2, I present a geological description of Erebus volcano and a review of
previous studies of seismicity from Erebus and from icebergs in the Ross Sea area.
Chapter 3 contains a description of the seismic network and the instrument responses.
An analysis of the temporal evolution of seismic activity and a classification of the
different types of tremor episodes is discussed in Chapter 4, and the location of tremor in
Chapter 5. Chapter 6 contains a discussion about the different models of tremor
generation and their applicability to Erebus episodes. The possibility that some tremor-
like signals are generated by the activity of nearby icebergs is discussed on Chapter 7.
Finally Chapter 8 contains general conclusions from this research.
3
2. GENERAL CHARACTERISTICS OF Mt. EREBUS VOLCANO
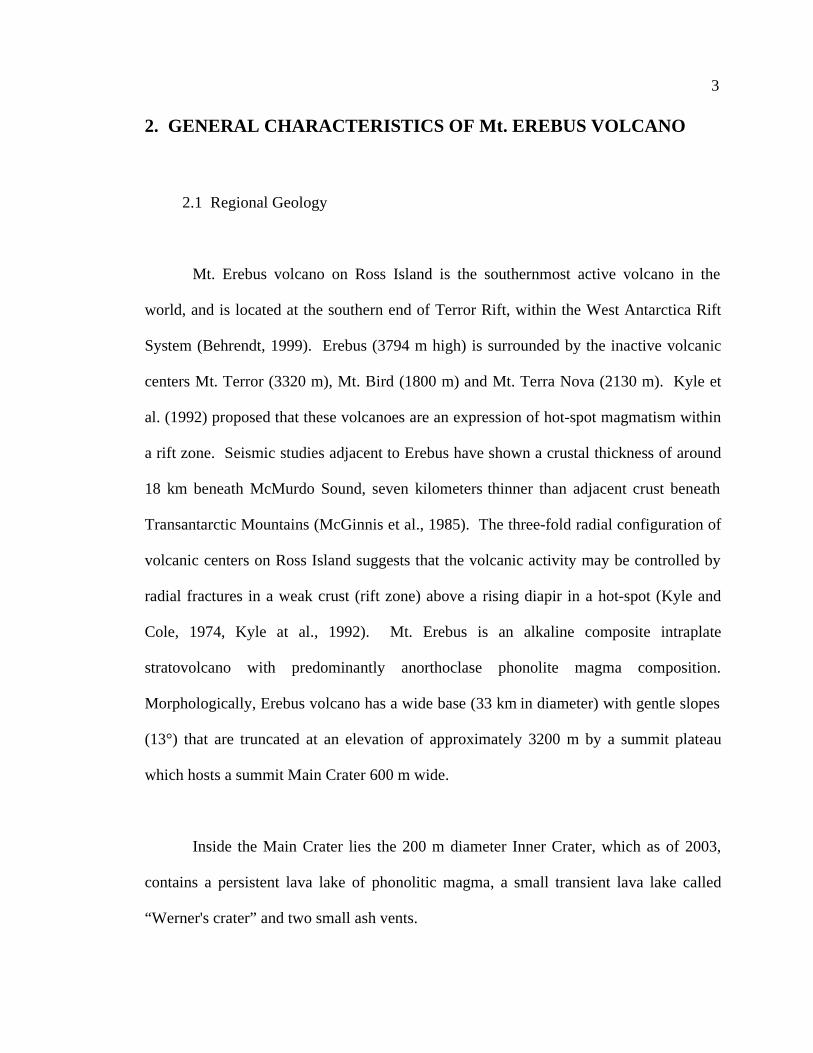
2.1 Regional Geology
Mt. Erebus volcano on Ross Island is the southernmost active volcano in the
world, and is located at the southern end of Terror Rift, within the West Antarctica Rift
System (Behrendt, 1999). Erebus (3794 m high) is surrounded by the inactive volcanic
centers Mt. Terror (3320 m), Mt. Bird (1800 m) and Mt. Terra Nova (2130 m). Kyle et
al. (1992) proposed that these volcanoes are an expression of hot-spot magmatism within
a rift zone. Seismic studies adjacent to Erebus have shown a crustal thickness of around
18 km beneath McMurdo Sound, seven kilometers thinner than adjacent crust beneath
Transantarctic Mountains (McGinnis et al., 1985). The three-fold radial configuration of
volcanic centers on Ross Island suggests that the volcanic activity may be controlled by
radial fractures in a weak crust (rift zone) above a rising diapir in a hot-spot (Kyle and
Cole, 1974, Kyle at al., 1992). Mt. Erebus is an alkaline composite intraplate
stratovolcano with predominantly anorthoclase phonolite magma composition.
Morphologically, Erebus volcano has a wide base (33 km in diameter) with gentle slopes
(13°) that are truncated at an elevation of approximately 3200 m by a summit plateau
which hosts a summit Main Crater 600 m wide.
Inside the Main Crater lies the 200 m diameter Inner Crater, which as of 2003,
contains a persistent lava lake of phonolitic magma, a small transient lava lake called
“Werner's crater” and two small ash vents.
4
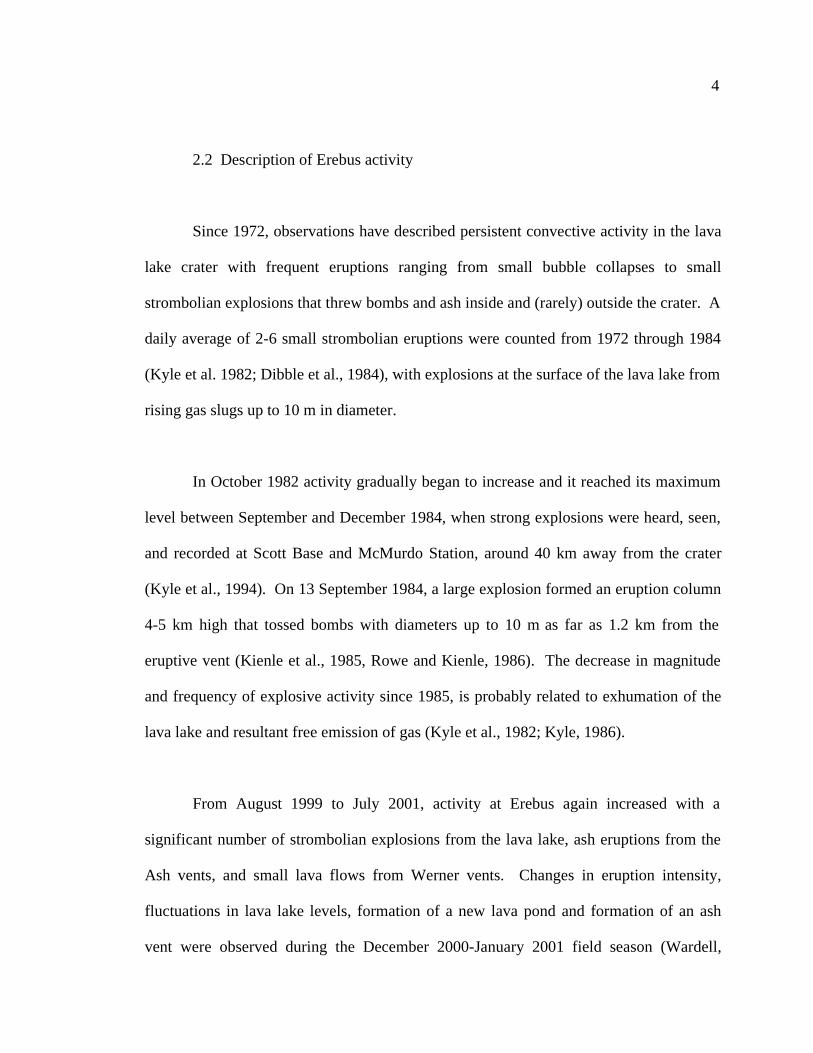
2.2 Description of Erebus activity
Since 1972, observations have described persistent convective activity in the lava
lake crater with frequent eruptions ranging from small bubble collapses to small
strombolian explosions that threw bombs and ash inside and (rarely) outside the crater. A
daily average of 2-6 small strombolian eruptions were counted from 1972 through 1984
(Kyle et al. 1982; Dibble et al., 1984), with explosions at the surface of the lava lake from
rising gas slugs up to 10 m in diameter.
In October 1982 activity gradually began to increase and it reached its maximum
level between September and December 1984, when strong explosions were heard, seen,
and recorded at Scott Base and McMurdo Station, around 40 km away from the crater
(Kyle et al., 1994). On 13 September 1984, a large explosion formed an eruption column
4-5 km high that tossed bombs with diameters up to 10 m as far as 1.2 km from the
eruptive vent (Kienle et al., 1985, Rowe and Kienle, 1986). The decrease in magnitude
and frequency of explosive activity since 1985, is probably related to exhumation of the
lava lake and resultant free emission of gas (Kyle et al., 1982; Kyle, 1986).
From August 1999 to July 2001, activity at Erebus again increased with a
significant number of strombolian explosions from the lava lake, ash eruptions from the
Ash vents, and small lava flows from Werner vents. Changes in eruption intensity,
fluctuations in lava lake levels, formation of a new lava pond and formation of an ash
vent were observed during the December 2000-January 2001 field season (Wardell,

5
2002). Wardell (2002) also reported larger and more frequent strombolian eruptions
compared to prior years. Tiltmeters on Erebus recorded a change of over 60 µrad,
coinciding with a rise in the level of the lava lake which resulted in overflow of the new
lava pond and the emplacement of a small lava flow across the floor of the Inner Crater
(Kyle et al., 2001). In 2000, a decrease in the As/S ratio measured in gases was
consistent with a magma composition richer in sulfur (Wardell, 2002), probably related to
a magma injection at depth.
Finally, after a few months of low-level activity, a new period of explosive and
seismic activity began in January 2002. It reached its maximum in May 2002 declining
afterwards with sporadic and bursts of activity. Eruptive activity has ceased since late
Nov. 2002 and continues to be quiescent through to the present day (Oct. 2003).
2.3 Previous seismic studies
The first evidence of seismic activity in the region of Erebus volcano came from
seismic records at Scott Base seismic station. Between June 1, 1957 and December 31,
1958, Hatherton (1961) counted in a single station close to McMurdo 76 earthquakes
with S-P times of 4 to 6 s, which possibly originated at the volcano.
Systematic observations of the seismicity of Erebus volcano have been reported
since December 1980, when a permanent seismic network consisting of four short-period
stations with telemetry was installed by the International Mount Erebus Seismic Study
(IMESS) project (Dibble et al., 1994). During the field season of 1981-1982, Shibuya et

6
al. (1983) located 162 seismic events. On 8-9 October 1982, more than 700
microearthquakes were recorded with sources located several km beneath the north-
western flank. This activity is likely related to a fresh magma injection that preceded the
explosive activity which occurred between September 1984 and January 1985 (Rowe,
1988). Between 15-20 explosions a day were recorded at Scott Base station through
November, 1984. After March 1985, seismic activity returned to the levels observed
between 1980 to 1984.
Dibble et al. (1984) used seismic records from 1975/76 to identify six types of
volcanic signals at Erebus: Explosive, B-type, A-type, Harmonic-type, Emergent-
harmonic-type and Microearthquake Swarms. Harmonic-type events are characterized by
a sinusoidal motion and an extended duration, and Emergent-harmonic-type events have
characteristics similar to the Harmonic type but with an extended low-amplitude onset of
several seconds.
Knight (1996) carried out a study which provided a description, classification and
location of the source of seismic signals recorded digitally by the seismic network of the
Mount Erebus Volcano Observatory (MEVO) between November 1994 and June 1996.
Long-period, volcano-tectonic, explosive and icequake/tornillo events were studied.
Only one tremor episode (January 31, 1995) was reported in this study.
Based on studies using temporary deployment of broadband seismometers at
Erebus, very long period (VLP) signals were analyzed by Rowe et al. (2000) and recently
by Aster et al. (2003a). VLP signals usually are seen 5 s or more before strombolian

7
explosions at Inner Crater and contain strong spectral peaks at 8, 11 and 21 s. They are
polarized in a radial-vertical plane with somewhat retrograde particle motions. The
repeatability of VLP observations indicates a non-destructive or self-reconstructing
source mechanism.
2.4 Reports of previous tremor activity
Observations of volcanic tremor in Erebus have been rare in the past. Despite
ongoing strombolian activity, Kaminuma (1994) did not report tremor episodes in the
1982-1990 period. Ueki et al. (1984) reported a harmonic tremor episode of 1.1 Hz over
a period of one hour in October 8, 1982 during an earthquake swarm, probably related to
a dike injection episode beneath Abbott Peak (Kienle et al., 1982; Knight et al., 1996;
Rowe, 1998).
A subsequent inspection of analog and digital records from the Erebus seismic
network (ABB, FANG and HOO stations) made in this study, revealed an active period
of tremor between April to November, 1984, with seven harmonic episodes (April 1,
April 10, April 18, May 23, Nov. 14, Nov. 16, and Nov. 18), and one high frequency
event (May 16). While harmonic episodes had very short durations (less than 6 min), the
high frequency episode lasted about 3 hours. In 1985, four tremor episodes were
recorded by the stations E1S, BOM, CON, SIS and HOO, between May 7 and September
21. Events on May 7, June 9 and September 21 have high frequencies and long duration
(2-4 hours). The episode recorded on June 10 was of short duration (6 min) and
harmonic. No tremor events were identified between 1986 and 1995 despite continued

8
monitoring.
Between 1995 and June 1999, few tremor episodes were recorded. One harmonic
tremor episode was recorded at 8 seismic stations on January 31, 1995 (Knight et al.,
1996). This event had a maximum amplitude about 5 m/s at E1S and CON (Rowe et
al., 2000), and lasted more than 5 min. Its single fundamental frequency decrease slightly
from approximately 5 Hz at the beginning of the record to 2 Hz several minutes later
(Knight et al., 1996). This signal was seen ~37 km from the volcano at station MCM at
McMurdo, suggesting that it was caused by a deep, energetic event (Rowe et al., 2000).
Tremor episodes with a single frequency peak were recorded on April 4, April 5,
and August 2, 1998 (Rowe et al., 2000). On May 11, 1998 a tremor episode with 12
harmonics and gliding (frequency-shifting) effect was recorded with a maximum
amplitude of 0.6 m/s at E1S (Rowe et al., 2000). Another episode of tremor with
similar amplitudes and alternating harmonic and chaotic behavior was recorded on
September 2, 1998.

9
3. SEISMIC INSTRUMENTATION
3.1 Description of the Erebus Seismic Network
Currently, the seismic activity at Mt. Erebus is being recorded with a permanent
network of twelve seismic stations, which includes 6 short period and 6 broadband
stations. A complete description of seismic and additional instrumentation installed at
Erebus is given by Aster et al. (2003b). Stations coordinates and distance to crater are
presented in Table 3.1. Station locations are plotted in Figure 3.1.
The six vertical-component short-period instruments (ABB, MAC, CON, HEL,
HOO, BOM) are denoted as S.P.Z in Table 3.1. Two other short-period stations, SIS
(short-period, 3 components) and ICE (short-period vertical) were marginally operating
between January and March, 2001.
There are five permanent broadband stations on the volcano (with code B.B.3C in
Table 3.1). E1S station was installed in December 2000 (Aster et al., 2003a; url:
www.ees.nmt.edu/Geop/mevo/seismic/seismicity). Stations NKB, LEH, CON and HOO
were installed in January 2003 as part of the Integrated Surveillance Instrumentation
package (ISI) that upgraded the capabilities of the monitoring instrumentation at Erebus.
CON and HOO have both short period and broadband stations with the same name. An
additional broadband station is located 38 km from the volcano at Scott Base (SBA) and
belongs to the Global Seismic Network (GSN).

10
Table 3.1 Location of permanent short period (S.P.Z) and broadband (B.B.3C)seismic stations at Mt. Erebus volcano with distances between stations and theinner crater.
STATION TYPE LAT. S LONG. E ALT. (m) DIST (km)
MAC S.P.Z 77.53247 167.24639 3332 2.07
CON S.P.Z 77.53463 167.08515 3453 2.09
HEL S.P.Z 77.50538 167.17394 3362 2.41
HOO S.P.Z 77.53159 166.93236 2121 5.62
BOM S.P.Z 77.50894 167.44018 2014 6.95
ABB S.P.Z 77.45699 166.90908 1789 9.96
E1S B.B.3C 77.53053 167.14070 3708 0.69
NKB B.B.3C 77.52200 167.14710 3501 0.70
LEH B.B.3C 77.51070 167.14110 3295 1.90
CON B.B.3C 77.53463 167.08515 3453 2.09
HOO B.B.3C 77.53159 166.93236 2121 5.62
SBA B.B.3C 77.84890 166.75740 20 37.96
Several problems, such as low temperatures, strong winds, and the accumulation
of hoarfrost affected the normal operation of seismic stations, especially during the
austral winter, resulting in power shortages, disorientation of the antennas and damage to
electronic components. For these reasons, only few stations have been operating through
the extreme winter season at Erebus. Table 3.2 summarizes the operating times of
stations in the Erebus Network.

11
Table 3.2 Operation of seismic stations (Jan. 00 – June 03)
STAT ABB BOM CON HEL HOO MAC E1S.B CON.B HOO.B LEH.B NKB.B SBA.B
Ja00
Fe00
Mr00
Ap00
Ma00
Jn00
Jl00
Au00
Se00
Oc00
No00
De00
Ja01
Fe01
Mr01
Ap01
Ma01
Jn01
Jl01
Au01
Se01
Oc01
No01
De01
Ja02
Fe02
Mr02
Ap02
Ma02
Jn02
Jl02
Au02
Se02
Oc02
No02
De02
Ja03
Fe03
Ma03
Ap03
My03
Jn03
12
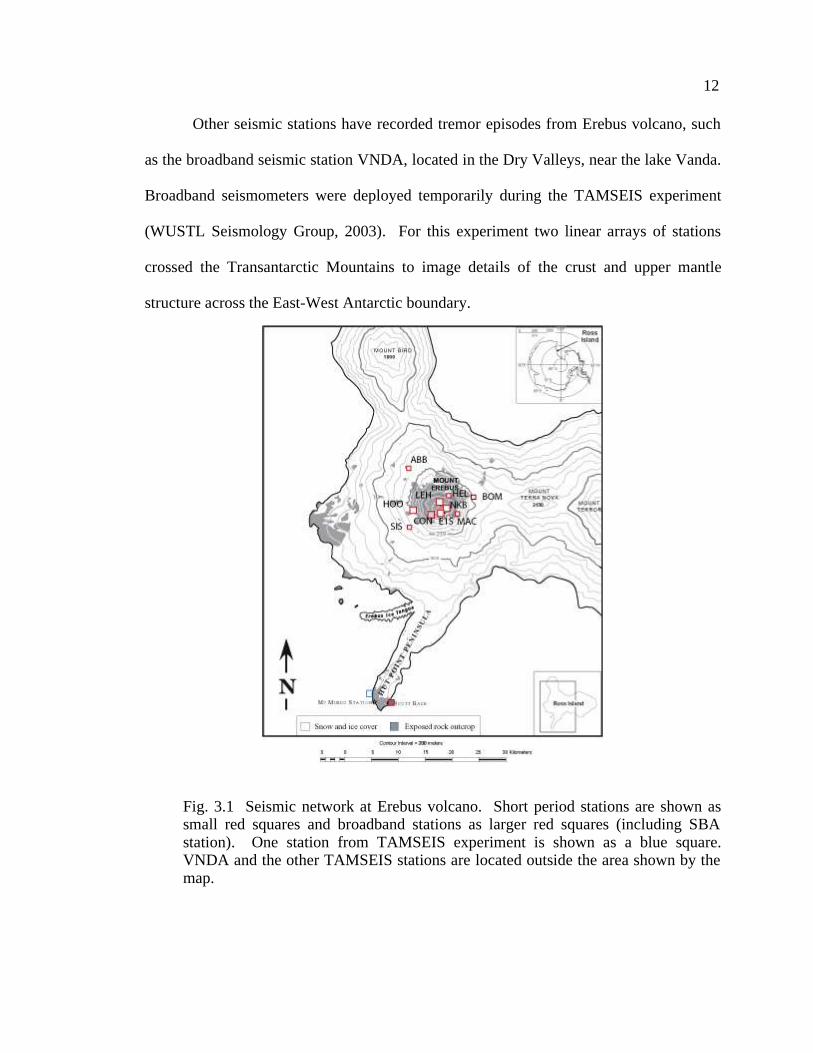
Other seismic stations have recorded tremor episodes from Erebus volcano, such
as the broadband seismic station VNDA, located in the Dry Valleys, near the lake Vanda.
Broadband seismometers were deployed temporarily during the TAMSEIS experiment
(WUSTL Seismology Group, 2003). For this experiment two linear arrays of stations
crossed the Transantarctic Mountains to image details of the crust and upper mantle
structure across the East-West Antarctic boundary.
Fig. 3.1 Seismic network at Erebus volcano. Short period stations are shown assmall red squares and broadband stations as larger red squares (including SBAstation). One station from TAMSEIS experiment is shown as a blue square.VNDA and the other TAMSEIS stations are located outside the area shown by themap.

13
3.2 Additional instrumentation
Seismic observations at Erebus volcano are complemented by visual, infrasound,
infrared, geodetic, geochemical and environmental observations providing valuable data
for a better description of Erebus activity. Most of the additional instrumentation
operates intermittently due to power availability. It includes:
North crater rim: A video camera located at 400 m from the lava lake providing
GPS time-stamped observations of the vents within the Erebus crater.
E1S: The broadband seismic station at E1S is complemented with a biaxial (radial
and tangential) tiltmeter and dual-frequency GPS receiver for geodetic monitoring, two
infrasound microphones for detecting the strong degassing and explosive activity, and
finally sensors that monitor temperature, wind speed and wind direction.
NKB: This station was upgraded with two infrared sensors, an infrasound
microphone, geodetic instruments (GPS, radial and tangential tilt) and a temperature
sensor.
LEH: In addition to the broadband station, a GPS receiver, a tiltmeter and sensors
to monitor temperature, wind speed, wind direction, pressure, and humidity were
installed.
CON: Short period and broadband seismic instruments are complemented with

14
GPS and environmental sensors: temperature, wind speed and direction sensors.
HOO: Short period and broadband seismic instruments are complemented with
temperature, wind speed and direction sensors.
3.3 Determination of in-situ response of seismic stations
We investigated the in-situ response of the seismic network using teleseismic
signals. This was done because the older short-period stations may differ significantly
from their specifications due to aging, and because there may be strong site effects at
some stations in the short period band. Seismic signals from nine teleseismic events
listed in Table 3.3 were analyzed in order to determine the gain factors of the short period
stations. These teleseismic events are recorded both by the short period and broadband
stations and represent an approximately plane-wave excitation of the network from a
distant source. Records for Scott Base station (SBA) were provided by the Data
Management Center of IRIS. This set of teleseismic events was selected because they
were recorded at all short-period stations without clipping. Figure 3.2 shows seismic
signals of the teleseismic event recorded on March 25, 2003 without correction for
magnification.
A matlab code TELECALIB.M written by R. Aster was used to get amplitude
ratios for the seismic stations for each teleseismic event. This code takes a portion of the
seismogram containing the teleseismic event between two signal-marks, T1 and T2,
filters the signals into the 0.8 to 5.0 Hz band, calculates the Hilbert Transform, and shifts

15
and scales the envelopes in order to achieve the best match (Figure 3.3).
Fig. 3.2 Teleseismic event recorded on March 25, 2003 at all seismic stations ofErebus network. Vertical scale is given in counts and none of the traces is clipped.A 0.8 to 5.0 Hz Butterworth bandpass filter was applied to all signals.
Fig. 3.3 Envelopes of the March 25, 2003 event , which were calculated using theHilbert transform. All seismic traces have been aligned using time lags found withcross-correlation analysis. Amplitude ratios are calculated using these signalenvelopes.

16
Once all signals are aligned, amplitude factors aij of the signal envelopes are
computed for each of the ith station and jth teleseismic event (Table 3.4). Sets of
normalized amplitude factors a'i were computed using the 2-norm of the ai factors
corresponding to this event. This calculation was repeated for all jth events.
(a'i )j= (a i ) j / ∥(a i ) j ∥ (3.1)
The amplification factor for each ith station was calculated with the median value
of all corresponding factors.
afi = median(a'1)j (3.2)
An average of the amplification factors and gains for the broadband stations with
well known gain constants (E1S, CON, NKB, LEH and HOO) were used as reference
afref. Then gain factors for each short period station were calculated using the following
expression:
Gain i = afref * Gainref / afi (3.3)
Considering the theoretical values of gain constant of short period stations and
these empirical gains obtained with Eq. 3.3, a gain calibration constant was found for
each seismic station. Gain factor and calibration constant for each station are given in

17
Table 3.5. The amplitude of ground motion in m/s for each seismic station can be
obtained using the product of the signal amplitude (in counts) with the corresponding
gain factor (m/s/count).
Table 3.3 List of teleseismic events used for determination of amplitude factors.
EVENTDATE
HOUR LAT LONG DEPTH(km)
Mw Epicentral region
2003-01-271 17:56:26 46.048 S 35.057 E 10 6.5 Prince Edward Is.
2003-02-122 22:34:03 1.4 S 142.5 E 33 NR New Guinea
2003-02-102 04:49:30 6.1 S 149.8 E 33 6.3 New Britain Is.
2003-03-102 02:09:32 1.9 N 127.0 E 93 6.4 Molucca
2003-03-111 07:27:33 4.694 S 153.24 E 40 6.8 New Guinea
2003-03-143 02:55:00 62.10 S 161.73 E 33 5.9 Balleny Is.
2003-03-251 02:53:25 8.294 S 120.743 E 33 6.5 Flores Is.
1 Data from NEIC: Significant Earthquake List,http://www.neic.cr.usgs.gov/neis/eqlist/sig_2003 2 Data from BGR: Local and Teleseismic Bulletinshttp://www.szgrf.bgr.de/bulletins3 Data from IRIS: WilberIIhttp://www.iris.edu/cgi-bin/wilberII

18
Table 3.4 List of amplitude factors aij obtained from teleseismic events
Station/TS ts30127 ts30210 ts30212 ts30310 ts30311 ts30314 ts30325
ABB.EHZ 1.994 1.933 1.989 2.427 2.578 2.487 2.608
BOM.EHZ 3.555 3.423 3.508 3.620 3.831 4.171 4.407
CON.EHZ 0.976 0.834 0.971 0.890 0.944 1.018 0.859
HEL.EHZ 1.129 2.191 1.507 1.389 1.808 1.391 1.502
HOO.EHZ 2.835 3.516 3.742 3.586 3.289 3.285 3.565
MAC.EHZ 1.024 0.865 0.933 1.110 1.056 0.953 1.111
E1S.BHZ 0.487 0.985 0.812 0.667 0.681 0.639 0.641
CON.BHZ 0.608 0.934 0.889 0.619 0.616 0.736 0.571
HOO.BHZ 0.650 0.993 1.029 0.858 0.801 0.960 0.889
LEH.BHZ 0.479 1.007 0.842 0.603 0.676 0.982 0.594
NKB.BHZ 0.416 0.694 0.645 0.553 0.633 0.575 0.798
SBA.BHZ 3.506 5.739 5.293 3.624 4.560 7.676 3.921
Table 3.5 Gain factors Gaini and calibration constants afi
Station Theoretical Gain 10-4(um/s/count)
Empirical Gain10-4(um/s/count)
Calibration constant
ABB.EHZ 1.2589 2.6895 2.1365
BOM.EHZ 1.2589 1.6864 1.3396
CON.EHZ 10.0708 6.9493 0.6901
HEL .EHZ 10.0708 4.3235 0.4293
HOO.EHZ 2.5177 1.8917 0.7513
MAC.EHZ 5.0354 6.1173 1.2149
SBA.BHZ 1.1936 1.4200 1.1896
E1S.BHZ 0.0000 10.8906 1.0000
CON.BHZ 0.0000 8.0176 1.0000
HOO.BHZ 0.0000 7.9912 1.0000
LEH.BHZ 0.0000 7.9687 1.0000
NKB.BHZ 10.8781 10.8781 1.0000

19
3.4 Validation of empirical gain factors
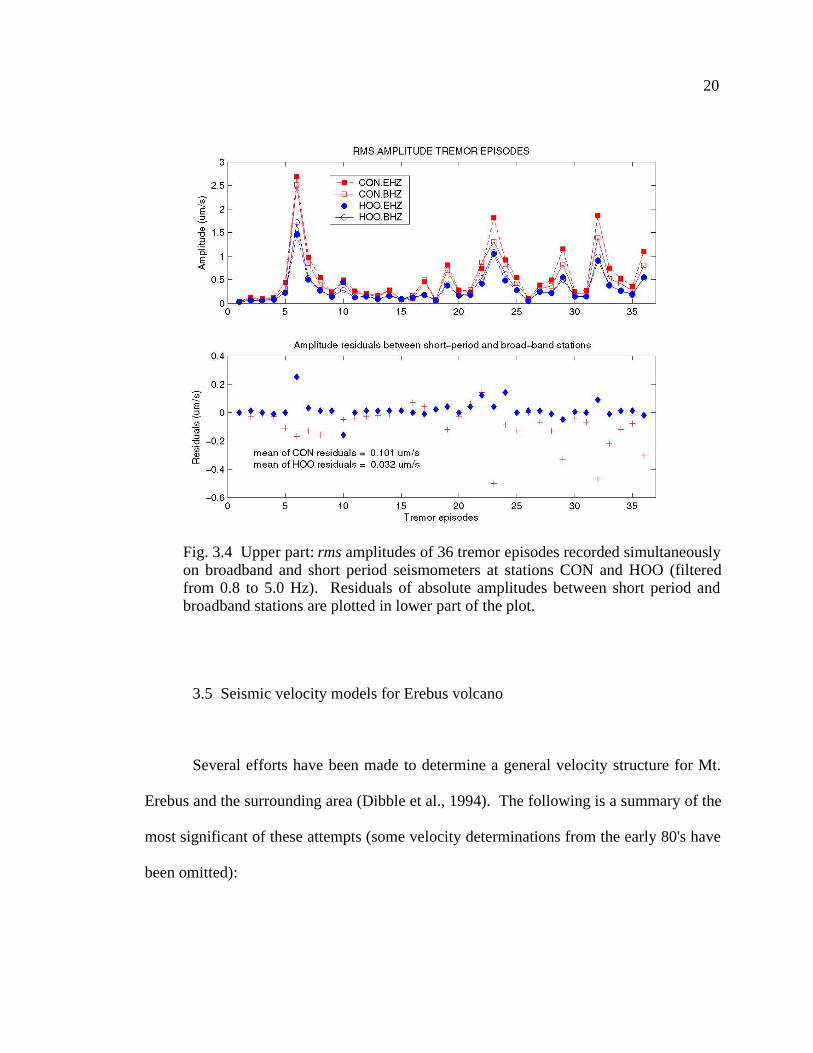
Ground motion amplitude ratios for 36 tremor episodes were evaluated for
simultaneous recordings of the short period seismometers at CON.EHZ and HOO.EHZ
and the corresponding broad band components (CON.BHZ and HOO.BHZ). All these
signals were filtered in the band from 0.8 to 5.0 Hz to remove microseisms and high
frequency contamination and so that the data samples would be homogeneous.
Considering that these events were recorded at the same locations, signal differences
should be attributable only to instrument response of each seismometer. Assuming that
the response function for the broad band station is exact, it was possible to calculate the
instrumental response of short period station in the range of 0.8 to 5.0 Hz. Figure 3.4
shows amplitude parameters for recordings from the stations CON and HOO with
broadband and short period seismometers.
Small residuals between short-period and broad-band stations (CON and HOO)
validate the gain factors found in this chapter. In further applications, these empirical
gain factors will be used.
20
Fig. 3.4 Upper part: rms amplitudes of 36 tremor episodes recorded simultaneouslyon broadband and short period seismometers at stations CON and HOO (filteredfrom 0.8 to 5.0 Hz). Residuals of absolute amplitudes between short period andbroadband stations are plotted in lower part of the plot.
3.5 Seismic velocity models for Erebus volcano
Several efforts have been made to determine a general velocity structure for Mt.
Erebus and the surrounding area (Dibble et al., 1994). The following is a summary of the
most significant of these attempts (some velocity determinations from the early 80's have
been omitted):

21
a) Using teleseismic events:
Dibble et al. (1984) found an average velocity of 4.5 ± 1.3 km/s for the volcano
using variations in the arrival times versus station altitude for six selected teleseismic
events with nearly vertical incidence angles.
b) Refraction experiments:
Dibble et al. (1994) using a 330 m-long refraction experiment conducted in 1989
between the Upper Hut and NKB stations, found a shallow velocity of 3.0 ± 0.3 km/s for
this area. A larger survey carried out along a 1.4 km line (from crater to CON station)
found a permafrost layer 90 m thick with a velocity range of 1.0 to 1.9 km/s was
overlying a reflector with velocities up to 4.0 km/s.
c) Arrival times of explosion events:
Dibble et al. (1988) determined a mean vp=4.07 km/s using a stack of nine strong
explosion events from December 1989. They were recorded on six stations at distances
from 0.7 to 10.1 km from the crater. Inside a radius of 0.7 km around the magmatic
conduit, they also found a low velocity zone of scoria with vp=1.5 km/s. Outside this
area, the p-wave velocity in the surface permafrost is about 3 km/s. This is underlain to
average depths of about 360 m by regions with low velocities of 1.0 to 2.4 km/s. Below
this level, velocities of 4.1 to 4.3 km/s are observed between 1 and at least 10.1 km

22
distance from the explosions. 5.5 km below the crater, the Mt. Erebus edifice is thought
to be underlain by a low velocity layer of sediments and by an igneous basement with a
velocity of 6.5 km/s (Dibble et al., 1994).
Using a set of 28 explosions, Rowe (1998) found that the minimum residuals for
those events were obtained using velocities of 3.44 to 3.54 km/s.
Johnson et al. (2003) estimated an apparent p-wave velocity of 3.3 ± 0.3 km/s for
the northern summit plateau region using the first arrivals of explosion signals.
d) Induced blasts
Using the arrival times for nine induced blasts recorded at distances between 3.95
and 13.5 km, Dibble et al. (1994) found a value of 4.3 km/s for a horizontal layer
between 0.58 km to 6.1 km depth. Rowe (1988) found a velocity gradient with its
minimum at the volcano summit (vp = 3.55 km/s) and a maximum of 4.6 km/s at 7 km
depth beneath the summit.
In this study, a homogeneous and isotropic half space with a velocity of 4.07 km/s
(Dibble et al., 1988) will be used, considering that this velocity was obtained through a
large array and covers the interest range of depth for tremor episodes (from summit to 5.5
km deep).

23
4. DESCRIPTION OF TREMOR ACTIVITY
4.1 Data presentation
A systematic search for tremor episodes in the digital and analog records from the
Erebus seismic network found 323 tremor events between 03/20/1999 and 07/26/2003.
For each tremor episode, onset time, end time, maximum velocity (m/s) and the root-
mean-square (rms) of velocities in each seismic station are stored in a database, as well as
the fundamental frequency (fo) and number of overtones (n). Maximum ground motion
displacements (m), and reduced displacements (RD) in cm2 for each station were also
computed. Durations of events and releases of energy in arbitrary units have also been
obtained from previous parameters. All this information is recorded in a database that
contains files /raid/data/Erebus/Tremor/DR-harm3.SDC and /raid/data/Erebus/Tremor/
FRQ-harm2.SDC.
A matlab code pretrem2.m was used to convert velocity series into displacements
and compute the rms and maximum velocity. Reduced displacements for body waves
(RDbw) were calculated using the following expression adapted from Aki and Koyanagi
(1981):
RD bw = 10 umax r / 2 √ 2 (4.1)
umax is the largest displacement (in m) after correction for the instrument magnification,

24
r is the hypocentral distance (in km) considering that tremor source is located 4 km
beneath Erebus summit. Reduced displacements are given in cm2.
Seismic energy released by tremor episodes was calculated as
Ei = [(1/n) ∑ vj2 ]ti, (4.2)
where vj is the jth value of ground motion velocity in µm/s, n is the length of data
series, ti is the episode duration and is an arbitrary factor. Ei is a relative energy for
ith episode. The monthly release of energy was computed as the sum of the energy
released by individual tremor episodes.
Table 4.1 gives a small sample of the main signal characteristics stored in the
database. It contains nine large amplitude harmonic events or harmonic events with a
large number of overtones, two rapid-fire and, and one chaotic event.

25
Date
m/d/y
Onsettime
Endtime
Num.stations
umax
(um/s)RD
(cm2)E (arb.units)
Fo
(Hz)
Num.
Harm.
Type
2/3/01 00:31 02:52 6 48.5 52.4 30033 1.25 6 Harm
2/23/01 12:14 12:29 6 35 52.9 31928 2.1 14 Harm
6/26/01 23:15 00:27 5 23.3 54.8 14781 1.3 30 Harm
5/21/02 06:08 07:45 3 97.8 92.6 621286 1.8 10 Harm
7/17/02 10:05 10:37 1 1.96 1.5 111 1.05 52 Harm
1/30/03 10:35 11:57 10 3 4.4 1133 0.24 30 Harm
2/2/03 15:10 15:50 11 4.9 3.5 166 1.3 5 Harm
4/10/03 00:15 01:30 11 64.7 55.3 7090 0.6 1 Harm
4/12/03 06:48 08:08 11 8.2 9.7 2171 0.55 5 Harm
3/27/03 05:35 06:26 11 10.5 8.5 851 - - Chao
1/18/03 10:55 11:23 11 7.3 6.4 740 1.5 - RF
2/1/03 11:00 11:39 11 12.9 12.2 2043 1.5 - RFTable 4.1 Data base of selected tremor events containing main parameters oftremor episodes (date (month/day/year), onset time (hh:mm), end time (hh:mm),number of stations, maximum ground motion amplitude (umax), reduceddisplacement (RD in cm2), relative released energy (E), fundamental frequency (foin Hz), number of harmonics or overtones (n) and the type of tremor (Harm=harmonic, Chao= chaotic, RF= rapid-fire), for twelve of the tremor events.
4.2 Time distribution of recent tremor activity
Tremor activity started to become conspicuous in June 2000, although sporadic
episodes were recorded between April 1999 and April 2000. Based on the distribution of
the number of tremor episodes (Fig. 4.1), three apparent periods can be distinguished:
June 2000- October 2001, January - December 2002, and January - July 2003.
4.2.1 First period of activity (June 2000 - October 2001)
The first period contains 68 tremor episodes with a maximum ground movement
of 48.6 um/s at E1S (52.4 cm2), the closest station (02/03/01). The monthly average of

26
tremor episodes during this period is 4.0. February 2001 has 18 tremor episodes and also
the largest energy release in the period. From June 2000 to January 2001, tremor
episodes typically have short durations (less than 10 min). However, after February 2001
there is a marked increase in duration of tremor episodes, reaching a maximum of 177
min. The median of the duration during this period is 18 min (Fig. 4.2).
Fig. 4.1 Monthly number of tremor episodes recorded on Erebus volcano (in bars) in theperiod Jan. 1984 -Dec. 1985 and Jan. 1995 -Oct. 2003. No minimum magnitude criteriawas established to consider them. The red dashed line shows the tremor relative energyreleases. Some discrepancies between the number of events and energy release areexplained as months with large amount of tremor with small amplitudes, for instancebetween Jun.-Dec. 2000, Jul. 2001 or Jul.- Dec. 2002. The monthly number of explosions(blue line) is scaled on the right side. Data for Oct-Dec. 1984 was obtained from digitalrecords provided by R. Dibble. 1984-1985 period was completed with the number of localshocks counted by Kaminuma (1984), using an explosions/shocks ratio found in Oct.-Dec.1984 period. Information for 1995-1996 period was taken from Knight (1996). First (1),second (2) and third (3) periods are bounded by vertical dashed lines. On a long-termscale, there is a roughly inverse relationship between explosion occurrence and the numberand energy release by tremor episodes.

27
4.2.2 Second period of activity (January 2002 - December 2002)
The second period, with 160 tremor episodes, began on January 2002 and lasted
until December 2002. During this period, the monthly average of episodes was 13.0.
The largest number occurred in June 2002 (50 episodes). Compared with the first period,
there is a large increase of duration of tremor episodes (Fig. 4.2). The median of the
tremor duration is 50 min, with 21 events lasting more than 2 hours and one lasting 5
hours (Sept. 19, 2002). The increase in the number and the durations of episodes results
in an increase in the energy release. The largest energy release was during May, when 45
tremor episodes were recorded. The largest tremor amplitude reached 97.8 m/s at E1S
(DR=92.6 cm2) on May 21, 2002.
4.2.3 Third period of activity (January2003 - July 2003)
The monthly average number of tremor episodes during the last period of activity
is 13.4. The largest episode occurred on April 10, with an amplitude reaching 64.7 m/s
at E1S. April and June 2003 had the largest number of tremor episodes (19) in this
period. The duration of tremor episodes has the same distribution observed during the
second period although with smaller values: seven episodes had durations longer than 2
hours (Fig. 4.2), and an episode on March 28, 2003 had the longest duration of 221 min.
The largest amount of energy was released during January 2003.

28
Fig. 4.2 Duration of tremor episodes at Erebus volcano for the three periods ofactivity and a summary which contains the duration from January 2000 to June2003.
4.3 Frequency distribution of tremor episodes
The data file /raid/data/Erebus/Tremor/FREQ-harm2.SDC contains information
about the fundamental frequency f0 (the lowest frequency associated with a harmonic),
number of harmonics (n), spacing between harmonics at the period of the largest
amplitudes and frequency associated with the maximum amplitude, also called peak
frequency).

29
Spectra were calculated using the FFT algorithm from Passcal Quick Look PQL.
Linear scale on frequency axes and logarithmic scale on amplitudes of signal spectra
were useful for recognizing harmonics (equally frequency-spaced spectral peaks). In
special cases, power spectra were calculated using the multitaper pmtm code in Matlab to
enhance the spectral peaks.
No evidence of very long period components were found in the tremor episodes at
Erebus volcano, as such has been observed at Popocatepetl volcano (Arciniega-Ceballos
et al., 2003).
4.3.1 First period of tremor activity (Jun. 2000 to Dec. 2001)
During the first period, fundamental frequencies are distributed between 0.35 and
4.0 Hz, with a median value of 1.25 Hz and standard deviation of 0.81 Hz (Fig. 4.3).
Most of the fundamental frequencies are in the band between 0.5 and 1.5 Hz, especially
due to the frequencies associated to tremor swarms of February and July 2001. There are
small peaks around 2.2 Hz and 3.5 Hz, present from June 2000 up to February 2001.
Most of the events have fewer than 8 overtones, with a median value of 3 overtones per
event with a standard deviation of 4.6 (See Fig. 4.4). Only three episodes do not have
harmonics and one tremor episode, occurring on June 26 at 23:40, exhibited 30
harmonics.

30
4.3.2 Second period of tremor activity (Jan. to Dec. 2002)
As shown in Fig. 4.3, the second period exhibits a small decrease in the median of
f0 (1.05 Hz ) with also a smaller standard deviation (0.69 Hz ). Most of the events (83%)
have frequencies in the range 0.5 to 1.5 Hz. Most of the episodes of the big tremor
swarm of May-June 2002 have fundamental frequencies in this range. Seven episodes
have frequencies smaller than 0.5 Hz in October 2002. Nine events during the May
swarm present frequencies larger than 2.5 Hz (Fig. 4.3). Most of the tremor episodes
have fewer than 9 overtones with few exceptions, with the largest one, occurring on July
17, 2002, having 51 overtones (Fig. 4.4). The high number of overtones is related to the
presence of sub-harmonics in between of each pair of principal spectral peaks.
Occurrence of these multi-harmonics appears to be unrelated to signal to noise ratio or
amplitude of the signal.
4.3.3.- Third period of tremor activity (Jan. 2003 to present)
The third period shows a clear decrease in the median value of the fundamental
frequency distribution (0.80 Hz) with a standard deviation of 1.24 Hz (Fig. 4.3).
Frequencies are distributed between 0.24 to 7.7 Hz, with 5 episodes around 4.0 Hz. As
was seen in previous periods, tremor episodes commonly have fewer than 9 harmonics
(Fig. 4.4). The median of the number of overtones is 2.0 with a standard deviation of 3.9.
One tremor episode on Jan. 30, 2003 at 10:35 had 30 overtones and it is also related to a
period-doubling effect.

31
Fig. 4.3 Distribution of fundamental frequencies (frequencies associated withlarger amplitudes on tremor episodes). Upper panels and lower-left panel showsthe frequency distribution during the three activity periods. Data in lower-rightpanel considers the total number of events.

32
Fig. 4.4 Number of overtones observed in tremor episodes of Erebus volcano.Upper-left panel corresponds to the first period of activity (June 2000 to October2001). Upper-right panel shows distribution of number of harmonics during thesecond period (January to December 2002). Lower-right panel corresponds to thethird activity period (January to June 2003). Lower-right panel summarizes thedistribution of the number of overtones throughout the entire activity period (June2000-June 2003).
4.4 General classification of tremor episodes
An empirical classification of tremor episodes recorded at Erebus has been carried
out based on some features of waveforms or spectral characteristics (number of
overtones, gliding effect, etc.). Three types of tremor have been recognized: harmonic,

33
chaotic, and rapid-fire (Table 4.2, Figure 4.5). We have to consider also the fact that
even a single tremor episode could share two types of oscillation. Harmonic episodes
tend to have a chaotic part in 42% of the cases. All of these cases have been counted
only as harmonic episodes. Rapid-fire tremors are usually preceded by chaotic events.
These episodes have been counted only as rapid-fire episodes.
Table 4.2 Types of tremor episodes
Tremor type Characteristics
Harmonic Energy seen in one spectral peak
(fundamental frequency fo). Generally with
one or more overtones located at exact
multiples of fo (Hellweg, 2000).
Rapid fire Sequence of very similar, but independent,
impulsive events (Hellweg, 2000). The
term spasmodic tremor refers a sequence of
pulses of high frequency, usually 5-0 Hz or
more (McNutt, 1994), often associated
with fractures.
Chaotic Broad spectrum without overtones.

34
Fig. 4.5 Distribution of types of tremor episodes on Erebus volcano during theperiod 1999-2003.
4.4.1 Harmonic Tremor
Harmonic tremor episodes (Fig. 4.6) are characterized by spectra with at least one
distinctive spectral peak. Harmonics are all distributed at constant frequency spacing.
Fundamental frequency, f0, is the spectral peak located at the lowest frequency, which
usually corresponds to the highest amplitude peak. Monochromatic tremors have most of
the energy concentrated on one small frequency band. Spectra of these episodes have a
single narrow peak with no overtones or very low amplitude.

35
Fig 4.6 Harmonic tremor at Erebus volcano. The fundamental frequency is almostconstant along this episode at 2.0 Hz. At least six overtones are recognized keepingthe same frequency interval. At the beginning of the episode, a higher frequencymonochromatic trigger event is observed with a duration of 3 min.
Some harmonic tremor episodes exhibit a series of special characteristics such as
gliding, frequency shifts, period doubling and trigger phases.
4.4.1.1 Gliding.- Changes in the value of f0 are commonly observed in tremor episodes.
These variations are reflected proportionately in the frequencies of the overtones fn. These
frequency changes occur in all stations at the same time, indicating that such changes
must be generated at the source, as could be expected for linear wave propagation.
Around 11% of the tremor episodes recorded on Erebus volcano have a general upward

36
gliding (Fig. 4.7), and 39% show a downward trend (Fig. 4.8). Near half of the harmonic
tremors (49%) show stable spectral peaks frequencies or small variations of the
fundamental frequency f0 and fn overtones along the episode, as seen in Figure 4.6.
Fig. 4.7 Upward gliding observed after time 2200 s on the tremor episode on Feb.9, 2001 from 13:24 to 14:10 by the vertical component of E1S broad-band seismicstation. In 8 min, the fundamental frequency fo changes from 1.9 Hz to 5 Hz(more than 160% of variation with respect to initial value of fo). An icequake isrecorded at time 2150 s with impulsive onset, short duration and broad spectralcontent.

37
Fig. 4.8 Harmonic tremor of Erebus volcano showing downward gliding. Upperpanel shows the seismic signal recorded on Feb. 2, 2001 since 05:41 by the verticalcomponent of E1S station (0.7 km from crater). Fundamental frequency decreasesfrom 1.8 Hz to 0.7 Hz where it merges in a chaotic tremor. All overtones maintainthe same proportional pattern.
4.4.1.2 Frequency shifts.- Sharp frequency shifts are also observed in fundamental
frequency of tremor episodes recorded in different stations. A frequency shift from 3 Hz
to 4 Hz is observed on E1S record of February 9, 2001 at time 2700 s (Fig. 4.7). A rapid
change in spectral frequencies is denoting drastic changes in the properties of the
harmonic tremor source. Spectra of time series containing frequency shifts may produce
apparent "multiple" oscillation modes.

38
4.4.1.3 Period doubling.- In few cases, spectra of tremor episodes at Erebus show the
presence of short-duration secondary spectral peaks between two larger spectral peaks
observed in the spectrum for longer time (Fig. 4.8). Julian (2000) explained the presence
of subharmonic frequencies in non-linear constricted flow oscillations as period doubling,
where at a certain critical value of the control parameter a new frequency appears which
is half of the previous repetition frequency. Spectra of seismic signals with doubling
period effects show an increase in the number of overtones and an apparent decrease the
value of f0.
Fig. 4.9 Upper panel: 1 min-window signal of tremor episode recorded on July 17,2002. A band-pass 0.3 to 15 Hz filter was applied. Lower panel shows a powerspectra density computed using pmtm.m code. The fundamental frequency islocated at 1.05 Hz, has the largest amplitude. Harmonic spectral peaks are locatedfrequencies nfo. Between main harmonics, two low-amplitude pulses are clearlyseen. They are equally spaced at 0.35 Hz.

39
4.4.1.4 Trigger phase.- Some tremor episodes, either harmonic or chaotic, exhibit a
short-duration trigger phase. This phase has usually small amplitudes and higher
frequencies values compared to the fundamental frequency of the main episode. In the
February 23, 2001 episode, a trigger phase with a frequency around 9 Hz lasts 160 s (Fig.
4.6). The tremor episode recorded on February 2, 2001 has a trigger phase at 4.6 Hz with
one overtone at 9.2 Hz (Fig. 4.8).
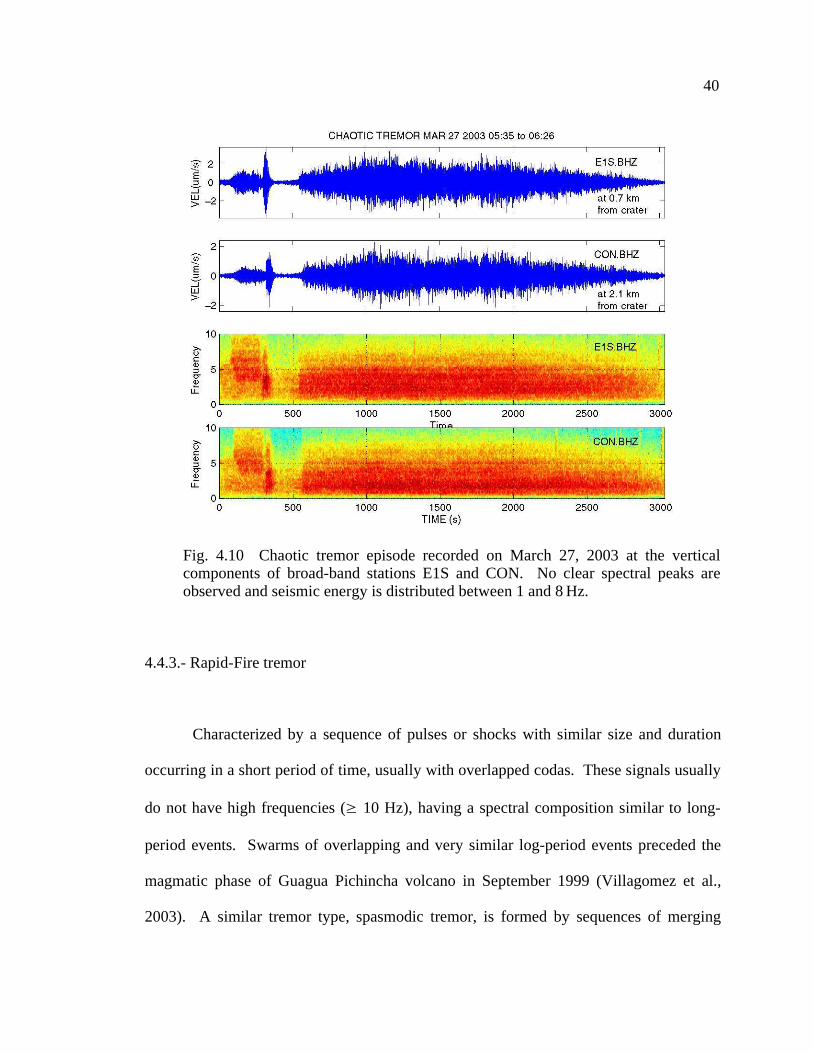
4.4.2.- Chaotic Tremor
Chaotic tremor episodes are characterized by broad spectra without a predominant
frequency peak. Usually tremor episodes with chaotic spectral patterns show a spindle-
shaped waveform. An example of chaotic tremor is shown in figure 4.10.
40
Fig. 4.10 Chaotic tremor episode recorded on March 27, 2003 at the verticalcomponents of broad-band stations E1S and CON. No clear spectral peaks areobserved and seismic energy is distributed between 1 and 8 Hz.
4.4.3.- Rapid-Fire tremor
Characterized by a sequence of pulses or shocks with similar size and duration
occurring in a short period of time, usually with overlapped codas. These signals usually
do not have high frequencies (≥ 10 Hz), having a spectral composition similar to long-
period events. Swarms of overlapping and very similar log-period events preceded the
magmatic phase of Guagua Pichincha volcano in September 1999 (Villagomez et al.,
2003). A similar tremor type, spasmodic tremor, is formed by sequences of merging

41
volcano-tectonic events such as occurred before Kelut eruption in 1990 (Lesage and
Surono, 1995). Time lags between pulses are fairly constant in each episode with some
spacing increase usually at the end of the episode. The tremor episode of May 6, 2002
shows an increase of the spacing from 13 s along most of the episode to 36 s at the end of
the episode.
Different rapid-fire tremors show a large range of separation between pulses,
taking into account only the more constant part. Larger spacing was observed on June 4,
2003 with 330 s between pulses. The shortest spacing was observed during the episode
of July 2, 2003 with 0.7 s at the beginning of the episode to 1.4 s at the end.
The very repetitive and periodic character of these events suggests that they are
related to a repeating non-destructive process. Duration of these sequences are variable.
The tremor episode of June 7, 2003 has the shortest duration (160 s). No infrasonic
signal accompanies or follows tremor episodes in areas with rapid-fire. This
characteristic suggests a tremor episode not linked to explosions in the crater interior.
Some comments on the more interesting rapid-fire episodes are :
May 06, 2002 15:12 Episode
Observed at the tremor episode of 2002 05 06 from 15:12 to 15:22 after two
pulses of tremor with larger amplitudes and two gliding spectral lines. Repetitive pulses
have the same spectral lines with peaks at 1.5 and 3.0 Hz.

42
January 18, 2003 11:06 Episode
An harmonic tremor episode with chaotic spectral pattern was followed by a
sequence of 6 pulses of tremor. These pulses are spaced about 90 s apart. Duration of
each pulse is around 60 s. Frequency content of these pulses is similar to the tremor
suggesting that these events are long-period events originated in the same source that
precedes a tremor episode. No acoustic signal was observed with this event.
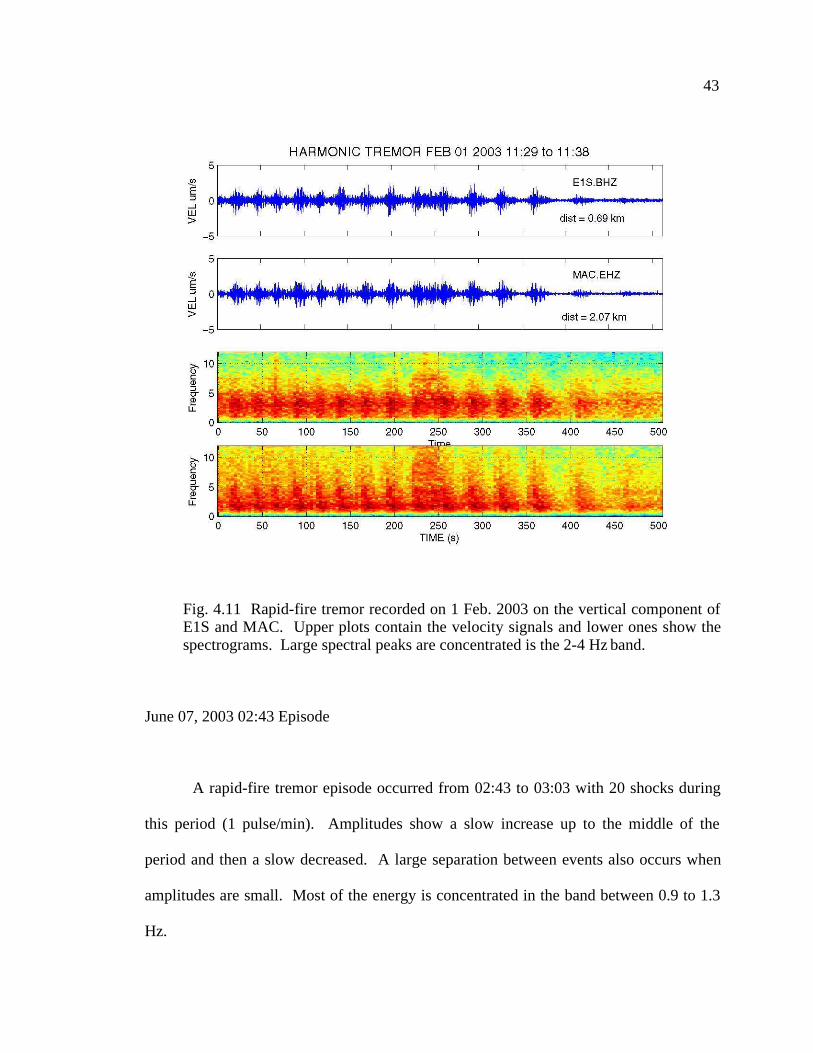
February 01, 2003 Episode
An episode of rapid-fire tremor composed of 15 pulses was recorded at 11:28
following a tremor with a wide spectral content. Pulses occur at intervals of 30 s and
show similar amplitudes and waveforms (Fig. 4.11). Spectral content seems to be similar
to the tremor. No acoustic signal was observed with this event.
43
Fig. 4.11 Rapid-fire tremor recorded on 1 Feb. 2003 on the vertical component ofE1S and MAC. Upper plots contain the velocity signals and lower ones show thespectrograms. Large spectral peaks are concentrated is the 2-4 Hz band.
June 07, 2003 02:43 Episode
A rapid-fire tremor episode occurred from 02:43 to 03:03 with 20 shocks during
this period (1 pulse/min). Amplitudes show a slow increase up to the middle of the
period and then a slow decreased. A large separation between events also occurs when
amplitudes are small. Most of the energy is concentrated in the band between 0.9 to 1.3
Hz.

44
June 19, 2003 02:30 Episode
This rapid-fire tremor follows a low-frequency and small-duration tremor. It is
composed by two parts with different amplitudes. This first one lasts 15 min and has 47
pulses (around 1 pulse / 20 s). All pulses are equally spaced and has the same order of
amplitude. The second part with a duration of 18 min, has smaller amplitudes but the
spacing remains very similar (1 pulse / 19 s). Both parts have the same spectral pattern
with the main peak at 1.3 Hz and two very small overtones at 9.0 and 11.0 Hz (Figs. 4.12
and 4.13).
Fig. 4.12 Seismic signals recorded on MAC (2.1 km from crater) and BOM (6.95km from crater) showing a rapid-fire tremor with 47 pulses distributed in two parts,the first one with higher amplitudes and the second part with smaller amplitudes.At time 515 and 1800 s there are two impulsive and short duration seismic signal,likely related to icequakes.

45
Fig. 4.13 Close-up of seismic signals of rapid-fire tremor recorded on June 19,
2003 on BOM and MAC (Upper panel). Amplitudes are corrected for instrumentmagnification. A band pass filter was applied in order to remove aliasing effects(low-pass: 15 Hz) and microseismic noise (high-pass: 0.8 Hz). Power spectraldensity of both signals was computed using Thomson multitaper method.
July 02, 2003 16:02 Episode
This is the longest rapid-fire tremor recorded on Erebus with a total duration of
210 min. (Fig. 4.14). Pulses have similar waveforms, again suggesting a very repetitive
mechanism. Spectrograms show all overtones equally spaced, and looking like harmonic
tremor rather than rapid-fire tremor (Fig. 4.14). Very slight gliding is also observed.
Detailed spectral analysis shows up to 40 overtones in some portions of the episode (Fig.

46
4.15), with an apparent fundamental frequency of 0.25 Hz, although along most of the
signal, a more consistent fundamental frequency around 0.5-0.6 Hz is observed. Despite
their different distances to crater, the same spectral peaks are observed both at ABB (9.6
km to crater) and SBA (40 km to crater), with only changes in the amplitudes due to
attenuation of high frequency overtones. During this episode, the number of shocks per
time changes from 43 pulses per minute to 84 pulses per minute. Sometimes these pulses
merge in a chaotic tremor type and also there are subtle changes in amplitudes along the
episode.
Fig. 4.14 One-minute window time of rapid-fire tremor recorded on July 2, 2003by vertical components of ABB short-period station and SBA broad-band station.Upper panels show the velocity time series and lower panels show thecorresponding spectrograms.

47
Fig. 4.15 Multitaper pmtm power spectra of the rapid_fire tremor of July 2, 2003since 16:37 to 16:38 at ABB short-period station. Forty one equally-spacedspectral peaks are recognized.
4.5 Correlation with explosive activity inside the crater
Commonly, it is accepted that there is a direct relationship between eruptive
activity and tremor amplitude or duration. Some volcanoes, such as Etna (Alparone et al,
2003), show a drastic increase of tremor activity at the same time as there is an increase
of eruptive activity. However, other volcanoes may have different behavior. At least at
this level of activity, Erebus volcano shows a month-scale inverse relation between
tremor occurrence and number of explosion-like events (Fig. 4.1). Tremor episodes are

48
more likely to occur when the volcanic conduits and vents are sealed or partially sealed.
Meanwhile Erebus, an open-vent system, has a almost continuous degassing with
sequestration, ascent and decompression of gas slugs with radii up to 5 m and the
subsequent generation of strombolian explosions mainly through the lava-lake crater
(Aster et al, 2003a). Williams-Jones et al. (2001) point out that Arenal volcano, another
open-vent system, also exhibits an inverse correlation between frequency and magnitude
of the explosive eruptions on the one hand, and occurrence of tremor on the other.
In order to confirm this relationship between tremor and crater activity, we
examine video-records obtained by an infra-red camera located on the northern rim of
Erebus from two time periods: January 25 to February 25, 2001, and January 11 to 27,
2002 (Fig. 4.16). During the first period, there was a burst in tremor activity with 16
events from February 2 to February 11. A low-level of tremor activity was observed
during the second period with 4 episodes. Video observations allow us to discriminate
the source vent of explosions as well as qualitatively assess of explosion size, based upon
an estimation of the radii of swollen bubbles associated with explosions. Three vents
were active during both periods, namely: Inner Crater, Ash-vent and Werner's craters.
New vents became active during the second period: D-vent associated with ash-type
explosions and B-vent with steam columns. Fig. 4.16 shows the largest size of volcanic
explosions for each vent as well as the daily number of tremor episodes and the
maximum velocity recorded on the vertical component of the nearest station to the crater
(E1S). The upper-left panel shows a slight decrease in the size of lava-lake explosions
which occurred since day 33 (Feb. 2, 2001) and an increase of the number of bubble
bursts from Werner's crater and sporadic explosions from Ash-vent. At the same time, in

49
the lower-left panel, there is a sharp increase in number and amplitude of tremor episodes
that begins on day 33 (Feb. 2, 2001). On the other hand, during the second period, there
is a steady decrease in the size of explosions (upper-right panel) with a small increase of
tremor occurrence at the end of this period (lower-right panel).
From these observations, we should note that tremor activity at Erebus is not
directly related to shallow processes, such as strombolian explosions or degassing.
Tremor does not follow explosions on a time scale of minutes as was observed at Arenal
(Williams-Jones, 2001). Post-eruptive tremor at Arenal was noted by Benoit and McNutt
(1997), Garces et al. (1998) and also at Karymsky (Johnson et al. 1998). In those
volcanoes emissions are followed by harmonic tremor and a sequence of repetitive
acoustic pulses called chugs.
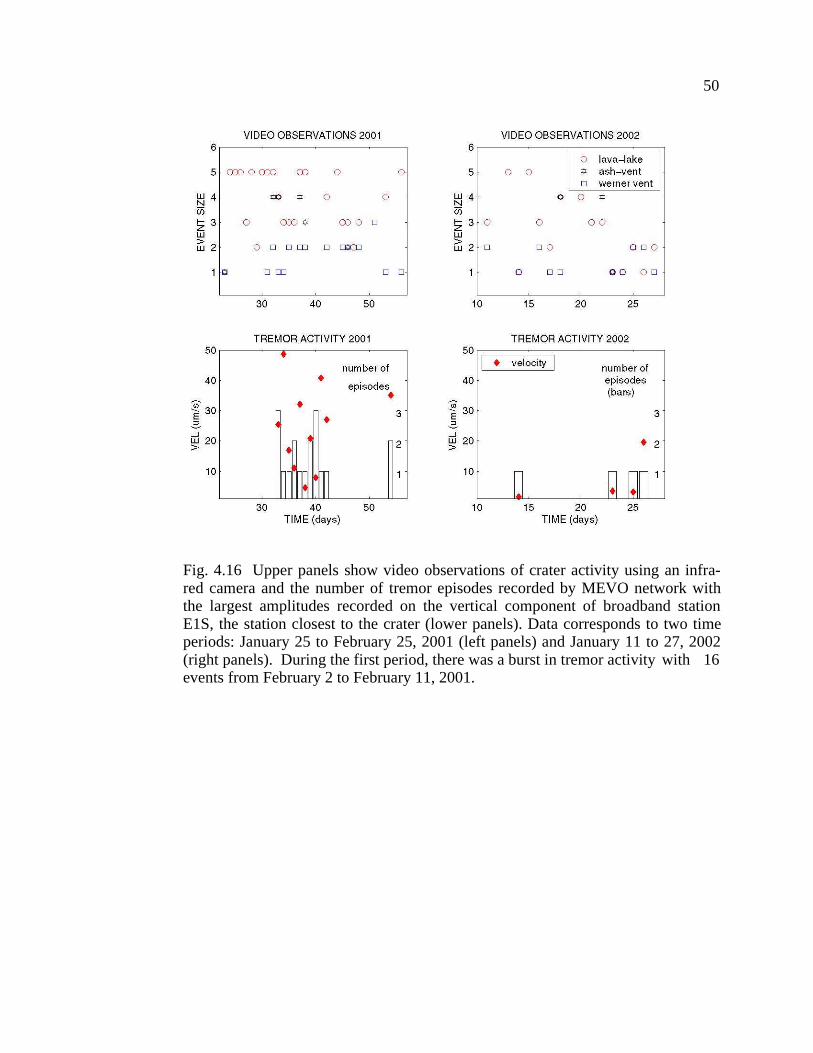
50
Fig. 4.16 Upper panels show video observations of crater activity using an infra-red camera and the number of tremor episodes recorded by MEVO network withthe largest amplitudes recorded on the vertical component of broadband stationE1S, the station closest to the crater (lower panels). Data corresponds to two timeperiods: January 25 to February 25, 2001 (left panels) and January 11 to 27, 2002(right panels). During the first period, there was a burst in tremor activity with 16events from February 2 to February 11, 2001.

51
5. LOCATION OF TREMOR SOURCES
5.1 Importance of source location
Location of tremor source is very important in volcano seismology. Epicentral
solutions help us to identify active areas or active vents. Source depth might allow us to
discriminate the processes occurring inside a volcano. Shallow source close or just on
the vent are associated with magma degassing (Benoit and McNutt, 1997, Jonhson and
Lees, 2000, Ripepe et al., 2001) or lava fountaining (Swanson et al., 1979, Dvorak and
Okamura, 1985, Alparone et al., 2003). However, deep source tremors are likely related
to magma/fluid transport processes without clear or direct manifestation on the surface.
In all these mechanisms, seismic vibrations are radiated as elastic seismic waves. In this
sense, tremor offers important information about the volcano's structure and dynamics.
Tremor source location could be useful for mapping the extension and geometry of the
underlying magma, conduits, or reservoirs, and also for quantifying pressure transients
caused by resonance or movement of fluids along those conduits.
Tremor location faces problems from unclear onset times due to emergent arrivals
and quasi-stationary character, making the use of classical seismic methods based on
inversion of sets of arrival times inadequate (Hofstetter and Malone, 1986). Furthermore,
high heterogeneity of volcanoes, and strong local effects (site and topography) may add
significant non-source features to the seismogram. Here, several non-traditional seismic
methods have been carried out.

52
Many previous attempts have been made using amplitude and phase
characteristics of tremor signals. Battaglia el al. (2001) located tremor events under Piton
de la Fournaise using the coherency of the spatial amplitude distributions. Jolly et al.
(2001) used rms amplitude distribution for locating tremor episodes on Monserrate
volcano. Other methods are related to small time shifts of tremor waveforms using
semblance or cross-correlation. Kawakatsu et al. (2000), Yamamoto et al. (2002), and
Almendros et al. (2002), among others, used the semblance technique to locate tremor
and LP events by measuring the coherency among seismograms. Cross-spectral methods
may alternatively be used to find a relative location of multiplets (Poupinet et al.,1985,
Fremont and Malone, 1987, and Lesage and Surono, 1995). Legrand et al. (2000) located
long-period signals at Aso volcano computing waveform linear inversions of
seismograms with 10 broadband stations. Most of these methods require extensive
seismic arrays with high dynamic broadband instruments, and only few attempts have
been made for locating volcanic tremors using permanent monitoring-based seismic
networks (Wassermann and Ohrnberger, 2001).
In this study non-traditional techniques such as semblance, envelope-based and
spectral cross-correlation, and iso-seismal distribution have been applied in order to
constrain the source location of tremor episodes recorded at Erebus volcano using the
MEVO seismic network.

53
5.2 Description of methods for locating tremor sources at Erebus
Four methods were applied for locating tremor sources at Erebus volcano:
Analysis of iso-seismal surfaces, semblance, cross-correlation of signal envelopes, and
cross-correlation of signal spectrograms.
5.2.1 General assumptions for locating tremor episodes at Mt. Erebus
Several assumptions were applied for locating tremor episodes at Mt. Erebus:
1) Tremor wavefield is composed of p-waves with a velocity of (3.80-4.07) km/s
propagating through a homogeneous medium.
2) Waves are radiated from the source in the same way in all directions (isotropic
radiation).
3) Attenuation is controlled by geometric spreading.
4) Site and topographic effects are neglected.
5.2.2 Iso-seismals distribution method
Seismic signals lose energy along their travel path due to geometric spreading and
intrinsic attenuation. It is thus expected that signal amplitude decays with greater
distance from the source. High amplitude signals indicate that the source is nearby while
lower amplitude signals indicate that the source is more distant. The far-field P-wave

54
attenuates according to the inverse of the distance r (Aki and Richards, 1980). Near-
field oscillations have stronger attenuation coefficients.
Amplitude distribution has been used in a trial location, where Ao is calculated for
each grid-node and for each station. The minimum residual of rms corresponds to the
best agreement between the amplitude data from all stations (Jolly et al., 2001).
Gottschammer and Surono (2000) applied a grid based method in order to locate the
tremor source at Bromo volcano using as the distance-dependent parameter the power of
the velocity signal. Kanamori (1993) postulated a method using known acceleration-
distance relations.
In this study we plot the rms amplitude values of velocity recorded in each station
for selected portions of tremor time series, and we contour the amplitude distributions
using Surfer 7.0 software.
5.2.3 Semblance method
The semblance technique (Neidel and Taner, 1971) is a coherence measurement
between different pairs of seismic signals. Semblance denotes the ratio of the total energy
of the stack within a gate of length (1+L∆ ) to the sum of the energy of the component
traces within the same time gate (Sheriff and Geldart, 1995).
L N L N
Sk = ∑ [ ∑ (vi,ji) ]2 / {N ∑ [ ∑ (v 2
i,ji)] } (5.1) j=1 i=1 j=1 i=1
55
where N is the number of stations, vi,j(i) is a seismogram recorded at the ith station in the
jth time sample and L is the number of samples that defines a sliding time window. This
method considers that the largest coherence corresponds to the arrival of common phases
at different stations with different time delays. These time delays can be found by
changing the source location in a 3-dimensional grid of nodes. Larger semblance values
are found where the time shifts produce the best coherence between seismic signals.
A Matlab code semblance.m was written by myself and D. Wilson in order to find
the largest semblance values in a 50x50x90 node grid around the volcano, bounded by
the coordinates -77.7° and -77.3° South, and 166.6° and 167.6° East, with depth steps of
200 m. Shift times are calculated according to each trial position of the source in the
grid-search, assuming direct rays. The total signal is spliced in m windows. The
semblance value is then calculated for each set of the kth window corrected by the
corresponding time shifts. The grid location with the highest semblance Sk will give the
best estimate of the coordinates (latitude, longitude and depth) of the tremor event. A
weighted median value of these partial coordinates is computed using the corresponding
Sk . Error bars were calculated at 95% of confidence using a bootstrap algorithm that
randomly generates a series of latitude, longitude and depth values weighted by Sk.
The semblance method has been used for estimating the tremor source at Izu-
Oshima volcano (Furamoto et al., 1990, 1992) taking advantage of a multichannel array
deployed near the crater (small arrays are adventageous in this technique because they
produce highly coherent seismograms). An expanded version of the semblance technique
that considers the strong rectilinearly exhibited by long-period signals, has been adapted

56
for locating long-period volcanic tremor at Usu (Yamamoto et al., 2002), at Aso
(Kawakatsu et al., 2000), at Arenal (Hagerty et al., 2000 ) and at Kilauea (Almendros et
al., 2002).
5.2.4 Cross correlation of signal envelopes
Some harmonic tremors present amplitude modulated envelopes (beating effects)
in all stations around Erebus, suggesting that this effect is a source-process. Envelopes of
signals showing beating effect will offer a smooth representation of these episodes.
These envelopes are calculated using the absolute value of the Hilbert transform of the
corresponding time-series. A smoothing function was applied to the envelope curve in
order to reduce the effect of spikes. The complete time window was divided in 20
windows with 80% overlap and each of these windows were cross-correlated with
corresponding windows of other stations.
Since the cross-correlation function can be used as a measure of the coherence
between different seismic signals, we compute an average of cross-correlation of all sub-
windows for each pair of stations in order to find the delay time matrix for the arrivals
delays.
Predicted time delays were calculated using straight rays in an isotropic media
from each point of a dense grid to the seismic stations. Tremor source location was
determined minimizing the residual between the delay times found with cross-correlation
and the calculated delays using the grid search (difference between observed and

57
predicted travel times).
Each grid point is assigned a value corresponding to the reciprocal of the residual
of the observed minus the predicted travel time for that grid point, so that the maximum
value is the grid location with the smallest residual. This approach works well in signals
with variations in amplitude.
A high pass (0.5 Hz) filter was applied in order to remove the effect of micro-
seismic noise from the signal. A low pass filter was used above the fundamental
frequency. In case of chaotic signals (without a spectral peak), a 10 Hz low pass filter
was applied in order to prevent aliasing effect. Stronger filters around the fundamental
frequency were occasionally applied.
A grid search was performed in order to find the location that best fits the
observed time lags. A matlab code xcorr_search.m written by myself and D. Wilson
computes time lags for each pair of stations, then performs the grid search. Travel times
from each grid node to each station are computed using a uniform velocity of 3.8 km/s.
In the following grid searches, we have used a 50x50 node grid bounded by the
coordinates -77.7° and -77.3° S, and 166.6° and 167.6° E, with depth steps of 100 m.
5.2.5 Spectral Cross-correlation
Spectrograms are a 3-D visualization of tremor episodes. Time is plotted in the
abscissa, frequency in the ordinate, while amplitude is plotted with a color scale.

58
Spectrograms are calculated for moving windows of 256 points of each seismic signal
with an overlap of 255 data points. For each point of the time series, a matrix containing
the spectrogram of each moving window is computed. Each jth column of signal
spectrogram is composed of i frequency values. A cross correlation between the
correspondent frequency values of each pair of spectrograms is computed. The time lags
between different stations are considered the observed delay times. We will also apply a
grid search to find the location of the source of selected tremor episodes.
5.3 Validation of tremor location methods
Tremor location methods were validated using a synthetic signal of 100 s (Fig.
5.1), that contains a scaled and time-shifted real tremor signal recorded by the vertical
component of broad-band CON station. This tremor signal has a clear onset and a gliding
fundamental frequency. CON.BHZ signal was copied on the rest of the seismic signals
belonging to Erebus network using appropriate arrival times for direct rays from the real
hypocenter (77.5° S - 167.2° E) to each of the stations and a constant velocity of 3.80
km/s. Table 5.1 shows the calculated delay times for the theoretical tremor source.
Tremor amplitudes were also modified in order to match the attenuation pattern of
body waves. The master signal (CON.BHZ) was normalized and a correction factor of
the inverse of the source-station distance (1/r) was introduced for all stations, so the final
signal contains a hypothetical time lag and amplitude (Fig. 5.1).

59
STATION DELAY (s) STATION DELAY (s)
ABB 2.28 HOO 2.01
BOM 1.63 LEH 0.99
CON 1.54 MAC 1.33
E1S 1.38 NKB 1.17
HEL 0.91 SBA 10.59
Table 5.1 Delay time at each seismic station for a synthetic tremor signal. Signal source was located at the sea level with epicentral coordinates: 77.5° S - 167.2° E.A isotropic source that generates p-waves and a homogeneous half-space with avelocity of 3.8 km/s, were considered for this analysis.
Fig. 5.1 Synthetic tremor generated using a master signal with amplitude and timelag corrections according to a source located at 77.5° S, 167.2° E and 3.7 km depth.Time lags are shown in table 5.1. Amplitude corrections follows a 1/r attenuationfactor.

60
5.3.1 Semblance method
The semblance method was applied over a 100-s window of the synthetic signal.
Seismic signals were filtered with a butterworth band-pass filter of 1.0 to 5.0 Hz which
keeps the energy of this type of events. The largest coherence point was located at the
sea level (0 m), at the coordinates 77.50° S and 167.21° E (Fig. 5.2). This point has an
error of 156 m in latitude and 146 m in longitude with respect to the real location of the
synthetic signal. These errors are smaller than half of the grid spacing (519 m in latitude
and 432 m longitude). No errors were found in depth determination.
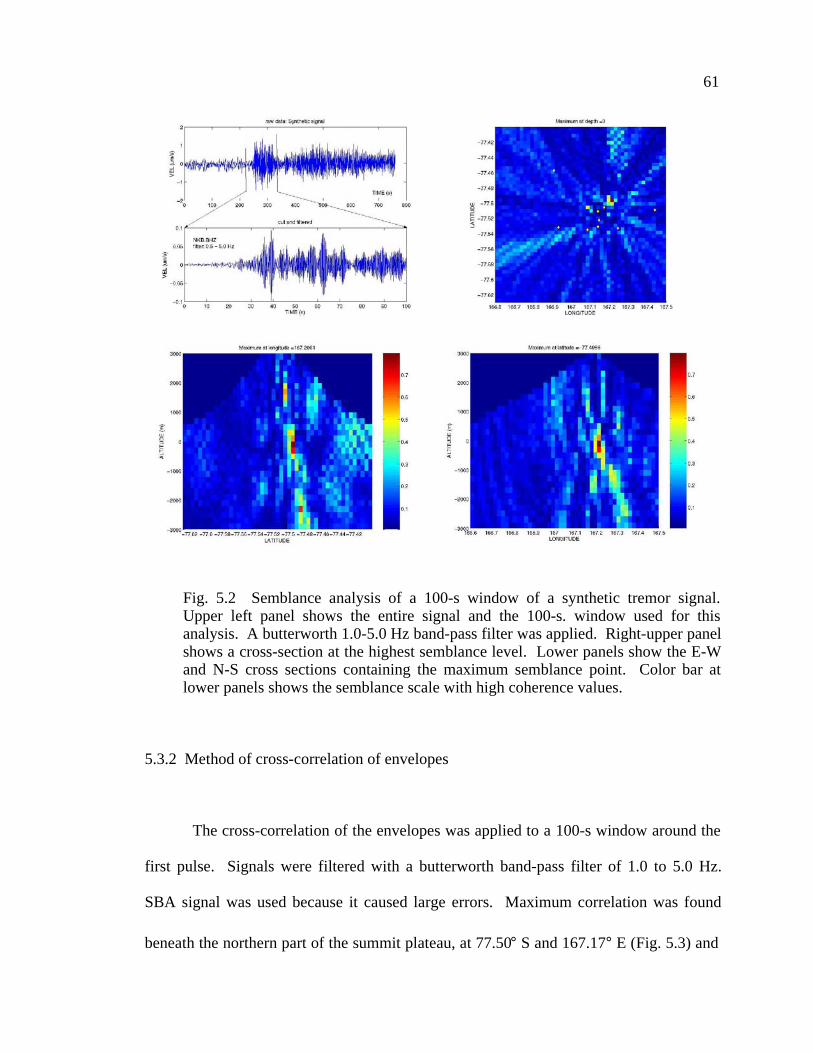
61
Fig. 5.2 Semblance analysis of a 100-s window of a synthetic tremor signal.Upper left panel shows the entire signal and the 100-s. window used for thisanalysis. A butterworth 1.0-5.0 Hz band-pass filter was applied. Right-upper panelshows a cross-section at the highest semblance level. Lower panels show the E-Wand N-S cross sections containing the maximum semblance point. Color bar atlower panels shows the semblance scale with high coherence values.
5.3.2 Method of cross-correlation of envelopes
The cross-correlation of the envelopes was applied to a 100-s window around the
first pulse. Signals were filtered with a butterworth band-pass filter of 1.0 to 5.0 Hz.
SBA signal was used because it caused large errors. Maximum correlation was found
beneath the northern part of the summit plateau, at 77.50° S and 167.17° E (Fig. 5.3) and

62
4,200 m below sea level. This point is inside a narrow high correlation area that extends
from 3 to 6 km below sea level. Small relative arrival times (<0.15 s) explain the deep
location of tremor source. The maximum correlation point has an error of 201 m in
latitude and 686 m in longitude with respect to the real location of the synthetic signal.
The latitude error is smaller than the latitude grid spacing (519 m) but the longitude error
is larger than longitude grid spacing (432 m). Depth error (> 100%) is quite significant in
this method.
Fig. 5.3 Cross-correlation of signal envelopes method applied to a synthetic signalwith origin at 77.5° S and 167.2° E and 3.7 km below crater floor (at sea level).Upper left panel shows envelope signals calculated using the Hilbert transform.Upper right panel shows in color the topographic distribution of Erebus. Diamondsdenote the seismic stations and the star is showing the epicentral location of thehighest correlation value. Lower panels show the N-S and E-W cross section.Color scale in lower section is gives the reciprocal of the residual of the predictedvs. the observed delay times.

63
5.3.3 Method of cross-correlation of spectrograms
Cross-correlation of spectrograms was performed over the synthetic signals with a
window time of 100 s and the same butterworth bandpass filter 0.5-5 Hz. All these
signals contain a clear gliding effect with the fundamental frequency changing from 3 to
5 Hz. A stable solution was located beneath the crater area at the sea level (3,700 m
below the crater floor, Fig. 5.4). Comparing with the coordinates of the hypothetical
signal, errors of around 200 m were found in latitude and longitude. These values are
smaller than the grid resolution (half of the grid spacing) in both cases. No errors were
found in depth. Using synthetic signals without gliding effect, errors larger than grid
spacing were found.

64
Fig. 5.4 Cross-correlation of signal spectrograms of the synthetic tremor. Upperleft panel shows the complete raw signal and the 100 s data window analyzed.Upper right panel shows in color the topographic distribution of Erebus, the seismicstation (diamonds), and the epicentral location of the highest correlation value(star). Lower panels show the N-S and E-W cross section. Color scale in lowersection gives the reciprocal of the residual of the predicted vs. the observed delaytimes.
5.3.4 Summary
A synthetic signal facilitated a validation of three methods for locating tremor
episodes using the seismic network installed at Erebus volcano. These signals contain a
gliding fundamental frequency, scaled amplitudes and onset times according to the
hypocentral distance. This is a summary of the results:

65
– Solution obtained with the semblance method was very close to the source point.
Errors were smaller than the grid resolution (half of node separation) and no error was
found in the depth determination.
– Using the cross-correlation of signal envelopes with nine seismic stations, except
SBA, we found an error smaller than the node spacing in latitude and a larger error in
longitude. A large error was also found in depth determination. Despite these errors,
the hypocentral solution obtained with this method is stable and roughly point the
correct epicentral area.
– Cross-correlation of spectrograms offers a good and stable solution with small errors
in latitude and longitude and no errors in depth determination. This method is
adequate for signals with frequency variations (gliding). Applying this method on
signals with constant frequency may become highly unstable.
5.4 Location of tremor episodes
Four tremor episodes from January 1st to April 12th, 2003 were selected for a
location analysis based upon the following characteristics:
a) Tremor episodes should be recorded by all seismic stations of Erebus network,
including broad-band stations installed on the 2002-2003 field season (NKB, LEH, CON,
and HOO). This consideration bounds the analysis only to tremor episodes occurred

66
during the period between January and April 2003. After April 2003, some seismic
stations faced power supply problems.
b) Signals should have enough energy in order to have high signal-to-noise ratio in all
stations of Erebus volcano, even at SBA station located at 38 km from the crater.
c) No clipping amplitudes in short period stations of Erebus network, which distorts the
waveform and spectrum of the event. Combining the characteristics (b) and (c), the
tremor episode should be large enough in order to be recorded in SBA and small enough
for avoiding the amplitude saturation effect at the short-period stations.
d) Different tremor types (harmonic, chaotic and rapid fire) will be located.
We will define tremor sources locations when there is agreement between
different locating methods. Two harmonic events (02/02/03 and 04/12/03), and two
rapid-fire tremors (01/18/03 and 02/01/03) will be located using the described methods.
5.4.1 Location of 02/02/03 Harmonic Tremor Episode
This episode started at 15:10 UT and has a duration of 2,550 s (Fig. 5.5). It shows
a transition between a first part with very constant fundamental frequency of 1.3 Hz, five
equally-spaced overtones and beating effect and a second part with a diffuse spectra
where the overtones are difficult to identify. The first part lasts about 1,500 s.

67
Fig. 5.5 Harmonic tremor episode recorded on Feb. 2, 2003 by 10 seismic stationsof Erebus network. Only vertical components are plotted. Amplitude are given inm/s. Signals are band-pass filtered in the range 1.0 - 2.0 Hz.
5.4.1.1 Iso-seismal distribution
Signal amplitudes in Fig. 5.5 show larger values for stations HEL, NKB, and
MAC located around the crater. The farther from the crater the stations are located,
amplitudes tend to decrease. An iso-seismal plot using the rms values of signal
amplitude calculated for a 40-s window show also large amplitudes in stations located on
the northern flank (HEL, NKB and MAC) as well as around the crater.
A plot of rms amplitudes of the entire signal filtered around the fundamental

68
frequency 1 Hz <f0<2 Hz shows that the tremor source is likely located beneath the upper
southern flank (Fig. 5.6). Amplitude distributions over time windows of 100 s also have
a consistent a peak of high amplitudes beneath the upper part of the southern flank.
Fig. 5.6 Distribution of rms amplitudes calculated for the complete signals ofharmonic tremor recorded on Feb. 02, 2003. Contouring was performed withradial-based functions of Surfer software. Location of seismic stations is denotedby diamonds and normalized rms amplitude are located close to the stations withvertical numbers. Iso-seismic curves are drawn every 0.1. Despite someinconsistencies, i.e. HEL, station that has the largest rms value, the larger amplitudearea is located on the upper southern flank of the volcano. Color bar shows thescale of normalized amplitudes.

69
The best fit between the theoretical and observed ratios of rms amplitudes of
ABB, BOM and SBA relative to the vertical component of E1S, was found for a
hypothetical hypocenter located at 77.56° S and 167.15° E and 8.6 km beneath the
summit (Fig. 5.7). This point corresponds to a source at intermediate depth below the
upper southern flank.
Fig. 5.7 Observed ratios between rms amplitudes of BOM, ABB and SBA withrespect to E1S for the tremor episode of 02 Feb. 2003 and theoretical curvesshowing the amplitude ratios for different depths. At some depths (marked byarrows), these theoretical curves intercept the observed ratio, constraining the pointwhere the tremor source is likely located.
5.4.1.2 Semblance method
A grid search was performed based on the semblance method over a 100-s
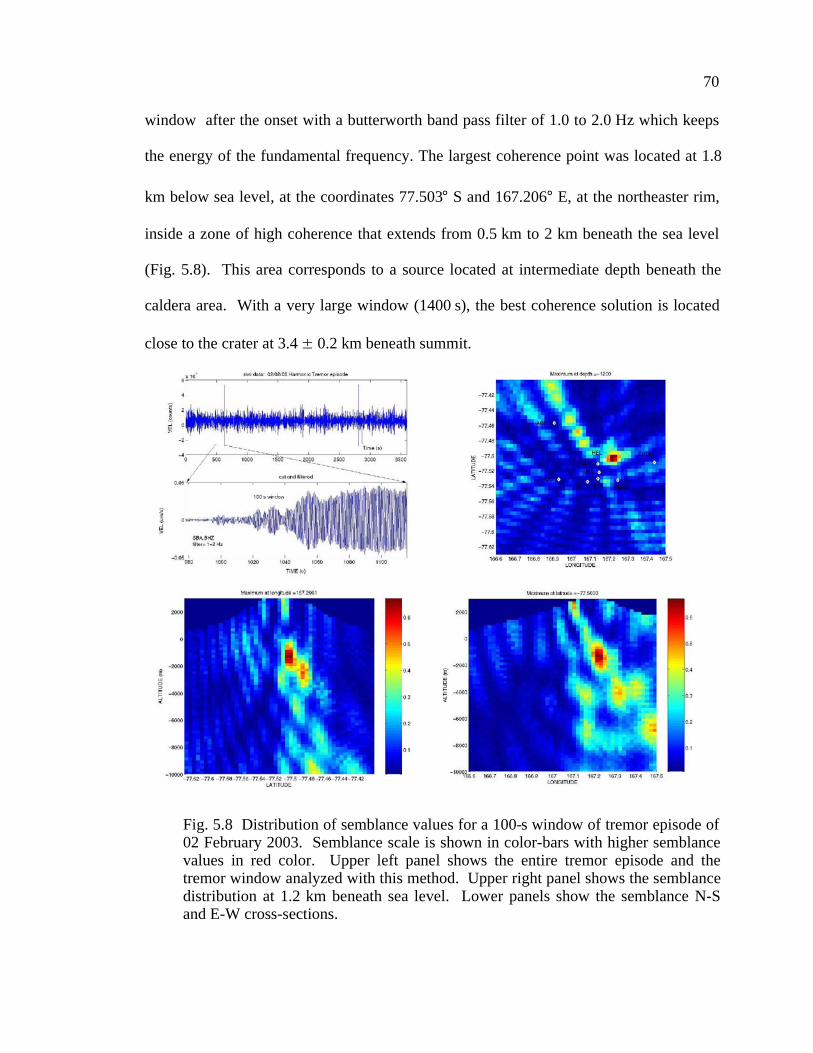
70
window after the onset with a butterworth band pass filter of 1.0 to 2.0 Hz which keeps
the energy of the fundamental frequency. The largest coherence point was located at 1.8
km below sea level, at the coordinates 77.503° S and 167.206° E, at the northeaster rim,
inside a zone of high coherence that extends from 0.5 km to 2 km beneath the sea level
(Fig. 5.8). This area corresponds to a source located at intermediate depth beneath the
caldera area. With a very large window (1400 s), the best coherence solution is located
close to the crater at 3.4 ± 0.2 km beneath summit.
Fig. 5.8 Distribution of semblance values for a 100-s window of tremor episode of02 February 2003. Semblance scale is shown in color-bars with higher semblancevalues in red color. Upper left panel shows the entire tremor episode and thetremor window analyzed with this method. Upper right panel shows the semblancedistribution at 1.2 km beneath sea level. Lower panels show the semblance N-Sand E-W cross-sections.
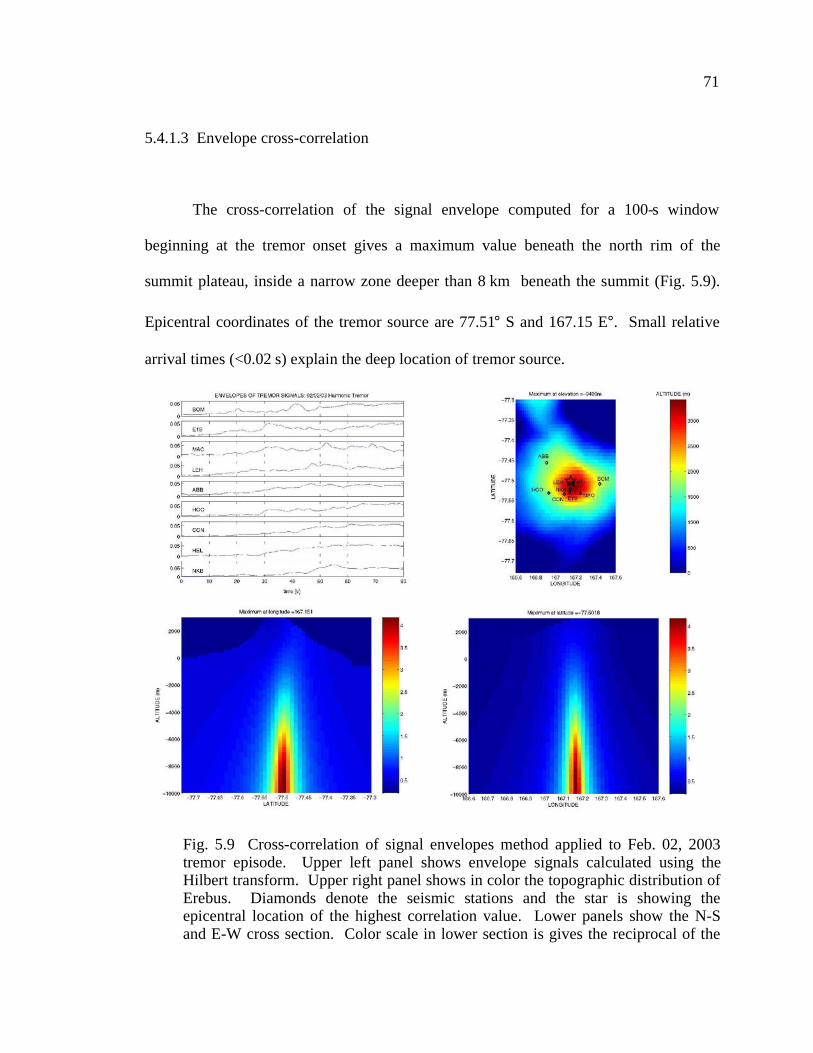
71
5.4.1.3 Envelope cross-correlation
The cross-correlation of the signal envelope computed for a 100-s window
beginning at the tremor onset gives a maximum value beneath the north rim of the
summit plateau, inside a narrow zone deeper than 8 km beneath the summit (Fig. 5.9).
Epicentral coordinates of the tremor source are 77.51° S and 167.15 E°. Small relative
arrival times (<0.02 s) explain the deep location of tremor source.
Fig. 5.9 Cross-correlation of signal envelopes method applied to Feb. 02, 2003tremor episode. Upper left panel shows envelope signals calculated using theHilbert transform. Upper right panel shows in color the topographic distribution ofErebus. Diamonds denote the seismic stations and the star is showing theepicentral location of the highest correlation value. Lower panels show the N-Sand E-W cross section. Color scale in lower section is gives the reciprocal of the

72
residual of the predicted vs. the observed delay times.5.4.1.4 Spectral cross-correlation
Using a window time of 140 s beginning at the onset of the episode and a
butterworth bandpass filter 1-9 Hz, a stable solution was located at 11 km beneath the
upper north flank (Fig. 5.10). Results are unstable if larger time windows are analyzed.
Very high time residuals are found between station with the earliest arrival and the other
ones, meanwhile arrivals between them are almost identical arrivals. The solution
became more stable after excluding the station Bom because its anomalous arrival times.
Fig. 5.10 Cross-correlation of signal spectrograms applied to Feb. 02, 2003 tremorepisode. Upper left panel shows the complete raw signal and the 140 s windowanalyzed. Upper right panel shows in color the topographic distribution of Erebus.Diamonds denote the seismic stations and the star is showing the epicentrallocation of the highest correlation value. Lower panels show the N-S and E-Wcross section. Color scale in lower section gives the reciprocal of the residual ofthe predicted vs. the observed delay times.

73
5.4.1.5 Summary
Amplitude based methods, such as distribution of iso-seismals and attenuation
fitting give a source located around the crater area or upper southern flank at 8 km below
the summit. Semblance and cross correlation methods locate the source beneath the
crater or the upper part of the northern flank, with a 3-4 km depth according to semblance
searches and a deeper (>10 km) source with cross-correlation methods.
5.4.2 Location of 04/12/03 Harmonic Tremor Episode
The tremor episode occurred on April 12, 2003 has basically two parts, the first
one lasts 35 min, and has a fundamental frequency at 0.7 Hz and 5 overtones clearly seen.
The second part has a more chaotic behavior and no overtones are recognized. Location
methods will be applied over the first part which contains the harmonic part the follows
the tremor onset (Fig. 5.11).

74
Fig. 5.11 Harmonic part of the tremor episode recorded on Apr. 12, 2003 with 35min duration (2100 s). This part is followed by a non-harmonic small-amplitudepart (not shown in this figure). Location techniques are applied over a 100-s.window bounded by two vertical bars at the beginning of the episode. Forsemblance method, a data window of 200 s was used. Amplitudes are true velocityground motions in m/s.
5.4.2.1 Iso-seismal distribution
Rms values of amplitudes were computed on a 100-s window shown in Fig. 5.11.
These values were normalize and plotted for all stations. Iso-seismal curves drawn using
radial-based functions of Surfer software show a zone with high amplitudes located
around the station HEL located on the upper part of the northern flank of Erebus edifice
(Fig. 5.12).

75
Fig. 5.12 Distribution of rms amplitudes calculated for a 100-s window ofharmonic tremor recorded on Apr. 12, 2003. Contouring was performed withradial-based functions of Surfer software. Location of seismic stations is denotedby diamonds and normalized rms. amplitude are located close to the stations withvertical numbers. Iso-seismic curves are drawn every 0.1. Larger amplitude area islocated on the upper northern flank of the volcano.
The best fitting between the theoretical and observed ratios of rms amplitudes
ABB, BOM and SBA relative to the vertical component of E1S, was found for a
hypothetical hypocenter located at 77.503° S and 167.206° E and 4.2 km beneath the
summit (Fig. 5.13). This point is 0.5 km below sea level. Its epicenter corresponds to the
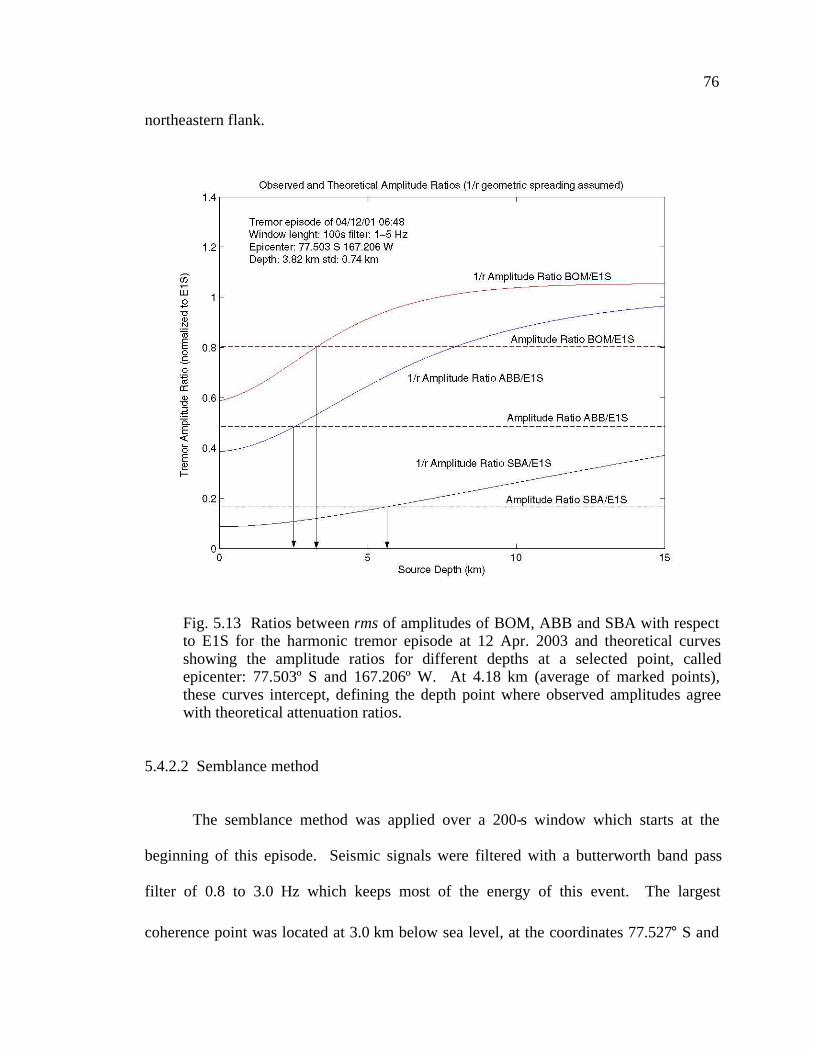
76
northeastern flank.
Fig. 5.13 Ratios between rms of amplitudes of BOM, ABB and SBA with respectto E1S for the harmonic tremor episode at 12 Apr. 2003 and theoretical curvesshowing the amplitude ratios for different depths at a selected point, calledepicenter: 77.503º S and 167.206º W. At 4.18 km (average of marked points),these curves intercept, defining the depth point where observed amplitudes agreewith theoretical attenuation ratios.
5.4.2.2 Semblance method
The semblance method was applied over a 200-s window which starts at the
beginning of this episode. Seismic signals were filtered with a butterworth band pass
filter of 0.8 to 3.0 Hz which keeps most of the energy of this event. The largest
coherence point was located at 3.0 km below sea level, at the coordinates 77.527° S and

77
167.078° E (Fig. 5.14). This area corresponds to a deep source with epicenter close to
CON station, in the SW rim of the sommital caldera. Choosing a window length of 2800
s spliced in 280 windows, the highest coherence is reached at 3200 m deep, below the
northern caldera rim.
Fig. 5.14 Semblance analysis of a 200-s window of the harmonic tremor of Apr.12, 2003. Upper left panel shows the entire raw signal and the data window usedfor this analysis. Signal was filtered with a butterworth 0.8-3.0 Hz band-pass filter.Right-upper panel shows a cross-section at 3,000 mbsl., at the level where thehighest semblance was found (at coordinates 77.527° S and 167.078° E). Lowerpanels show the East-West and North-South cross sections containing themaximum semblance point. Color bar shows the semblance scale.
5.4.2.3 Envelope cross-correlation
The cross-correlation of the signal envelope was computed for a 100-s window
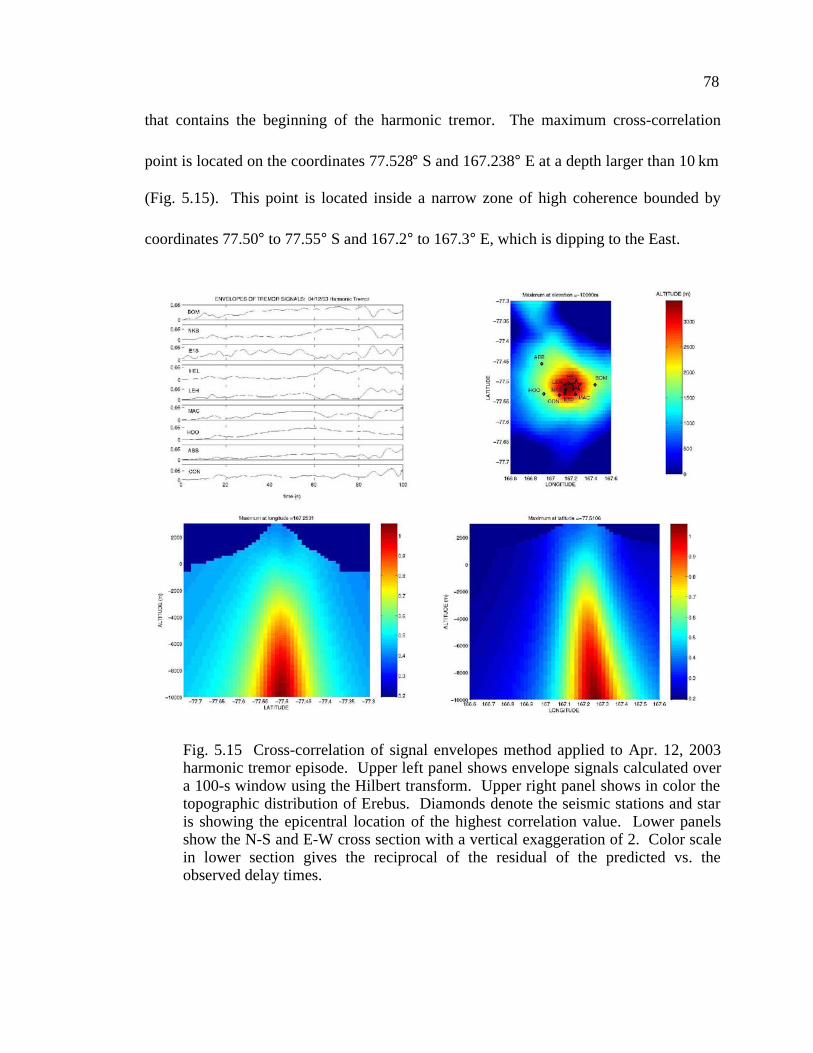
78
that contains the beginning of the harmonic tremor. The maximum cross-correlation
point is located on the coordinates 77.528° S and 167.238° E at a depth larger than 10 km
(Fig. 5.15). This point is located inside a narrow zone of high coherence bounded by
coordinates 77.50° to 77.55° S and 167.2° to 167.3° E, which is dipping to the East.
Fig. 5.15 Cross-correlation of signal envelopes method applied to Apr. 12, 2003harmonic tremor episode. Upper left panel shows envelope signals calculated overa 100-s window using the Hilbert transform. Upper right panel shows in color thetopographic distribution of Erebus. Diamonds denote the seismic stations and staris showing the epicentral location of the highest correlation value. Lower panelsshow the N-S and E-W cross section with a vertical exaggeration of 2. Color scalein lower section gives the reciprocal of the residual of the predicted vs. theobserved delay times.

79
5.4.2.4 Spectral cross-correlation
Cross-correlation of spectrograms was performed over seismic signals with a
window time of 100 s beginning at the onset of the episode and a butterworth bandpass
filter 0.5-4 Hz. All these signals contain at least 4 clearly spaced harmonics. A stable
solution was located beneath the crater area at shallow depth (3,000 m above sea level,
Fig. 5.16). Results are unstable if different time windows are analyzed. Very large time
residuals are found between station with the earliest arrival (BOM) and the other ones,
meanwhile arrivals between them are almost identical arrivals. We relocated the event
excluding the station with an anomalous arrival (BOM) and finally the solution became
more stable but with a smaller number of stations.

80
Fig. 5.16 Cross-correlation of signal spectrograms applied to Apr. 12, 2003harmonic tremor episode. Upper left panel shows the complete raw signal and the100-s window analyzed. Upper right panel shows in color the topographicdistribution of Erebus. Diamond symbols denote the seismic stations and star isshowing the epicentral location of the highest correlation value. Lower panelsshow the N-S and E-W cross section. Color scale in lower section gives thereciprocal of the residual of the predicted vs. the observed delay times.
5.4.2.5 Summary
The cross-correlation of spectrograms locates the Apr. 12, 2003 tremor close to
the crater. Semblance methods applied over the complete signal gives the highest
coherence at 3.2 km below the LEH station (northern caldera rim). Epicenter obtained by
cross-correlation of envelopes is located also in the same area, however solutions have
different depths. Cross-correlation of envelopes gives a deep solution (>14 km beneath

81
summit), cross-correlation of spectrograms, a shallow solution (< 2 km), and semblance
an intermediate one (~3 km). This discrepancy in the depth of the source could be solved
looking at an independent method based on a comparison of attenuation ratios between
amplitude rms of independent station (ABB, BOM. SBA), and a reference station (E1S),
which gives the best fitting solution for a point located at 3.8 km below the summit. This
solution will be also in agreement with the distribution of iso-seismals around a point
close to the NE edge of the summit plateau.
5.4.3 Location of 01/18/03 Rapid-Fire Tremor Episode
Four methods were applied in order to locate the source of 01/18/03 Rapid-Fire
Tremor. As it was mentioned in section 4.4.3, this episode is composed of seismic pulses
with a 90-s separation. Most of the energy is concentrated on a 1 to 2.0 Hz band. Fig.
5.17 shows the seismic signals on vertical components of Erebus network with the rapid-
fire part starting at time 720 s.
5.4.3.1 Iso-seismal distribution
Rms amplitudes were computed for the entire rapid-fire tremor signal in a 1-2 Hz
band and normalized to 1. Largest amplitudes are located at HEL, MAC, NKB and
BOM, and lower amplitudes at ABB, HOO and finally SBA. Contouring these
amplitudes with radial-based functions of Surfer software, gives a bull-eye shape
distribution with a maximum located at the NE part of the summit plateau, close to Fang
Ridge (Fig. 5.18).

82
Fig. 5.17 Rapid-fire tremor of Jan. 18, 2003 following a chaotic tremor episodes.Six pulses are clearly seen in all stations with a 90-s separation between them.Amplitudes are true velocity ground motions in m/s.
Isoseismal solution shows an elongation in NNE-SSW direction and it is very
well constrained in the EW plane. Maximum rms area for a 100-s window remains in the
same area at the NE flank.
The best fitting between the theoretical and observed ratios of rms amplitudes
ABB, BOM and SBA relative to the vertical component of E1S, was found for a
hypothetical hypocenter located at 77.485° S and 167.32° E and 5.2 km beneath the
summit (Fig. 5.19). This point is 0.5 km below sea level. Its epicenter corresponds to the
NE flank.
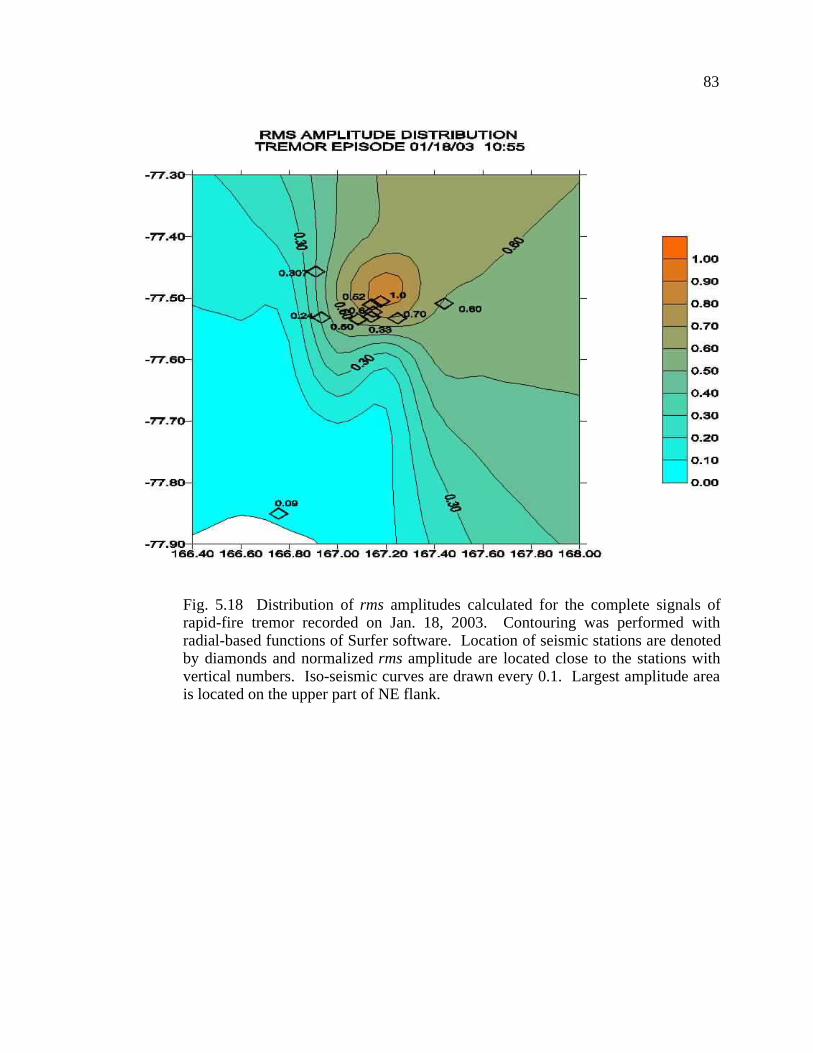
83
Fig. 5.18 Distribution of rms amplitudes calculated for the complete signals ofrapid-fire tremor recorded on Jan. 18, 2003. Contouring was performed withradial-based functions of Surfer software. Location of seismic stations are denotedby diamonds and normalized rms amplitude are located close to the stations withvertical numbers. Iso-seismic curves are drawn every 0.1. Largest amplitude areais located on the upper part of NE flank.

84
Fig. 5.19 Observed ratios between rms amplitudes of BOM, ABB and SBA withrespect to E1S for the rapid-fire tremor 18 Jan. 2003 and theoretical curvesshowing the amplitude ratios for different depths. At some depths (marked byarrows), these curves intercept, constraining the point where observed amplitudesagrees with theoretical attenuation ratios.
5.4.3.2 Semblance method
A grid search was performed based over a 100-s window from time 820 to 920 s
after the tremor onset. Seismic signal was previously filtered with a butterworth band
pass filter of 1.0 to 2.0 Hz which keeps most of the energy of the event. The largest
coherence point was located at 0.4 km above sea level (3.4 km beneath summit, Fig.
5.20), at the coordinates 77.550°S and 167.206°E, inside a zone of high coherence that
extends from 0.5 km above sea level to 0.2 km below sea level. This area corresponds to

85
a source at intermediate depth beneath the SW flank. Semblance method computed over
7 windows of 100 s, each containing a pulse of the rapid-fire tremor, gives the best
coherence at 0.3 km above the sea level beneath the western rim of the caldera.
Fig. 5.20 Semblance analysis of a 100-s window of the rapid-fire tremor of Jan. 18,2003. Upper left panel shows the entire raw signal and the 100-s. window used forthis analysis. Signal was filtered using a butterworth 1-2 Hz band-pass filter.Right-upper panel shows a cross-section at 400 m above sea level, where thehighest semblance was found (coordinates 77.55° S and 167.06° E). Lower panelsshow the E-W and N-S cross sections containing the maximum semblance point.Cross section at 400 m also shows a high semblance area on the northern flank.Color bar shows the semblance scale.
5.4.3.3 Envelope cross-correlation
The cross-correlation of the signal envelope was computed for a 100 s window
that contains a pulse of rapid-fire tremor (from 4050 to 4150 s). The maximum cross-
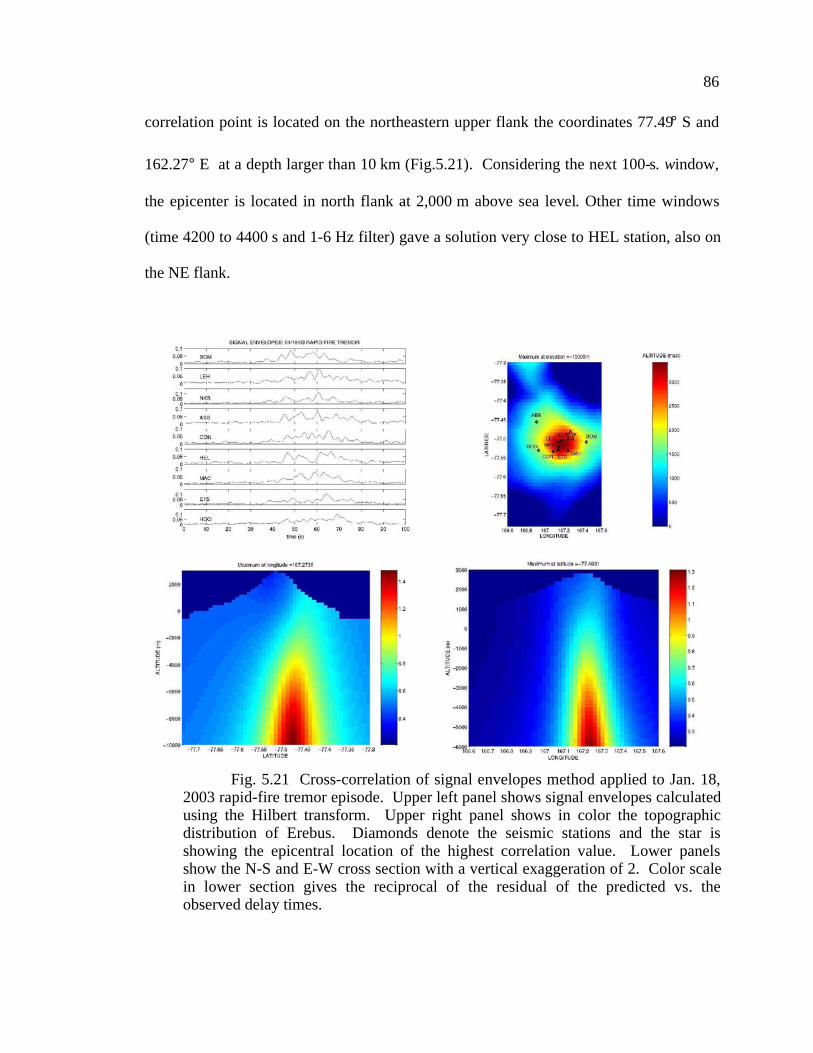
86
correlation point is located on the northeastern upper flank the coordinates 77.49° S and
162.27° E at a depth larger than 10 km (Fig.5.21). Considering the next 100-s. window,
the epicenter is located in north flank at 2,000 m above sea level. Other time windows
(time 4200 to 4400 s and 1-6 Hz filter) gave a solution very close to HEL station, also on
the NE flank.
Fig. 5.21 Cross-correlation of signal envelopes method applied to Jan. 18,2003 rapid-fire tremor episode. Upper left panel shows signal envelopes calculatedusing the Hilbert transform. Upper right panel shows in color the topographicdistribution of Erebus. Diamonds denote the seismic stations and the star isshowing the epicentral location of the highest correlation value. Lower panelsshow the N-S and E-W cross section with a vertical exaggeration of 2. Color scalein lower section gives the reciprocal of the residual of the predicted vs. theobserved delay times.
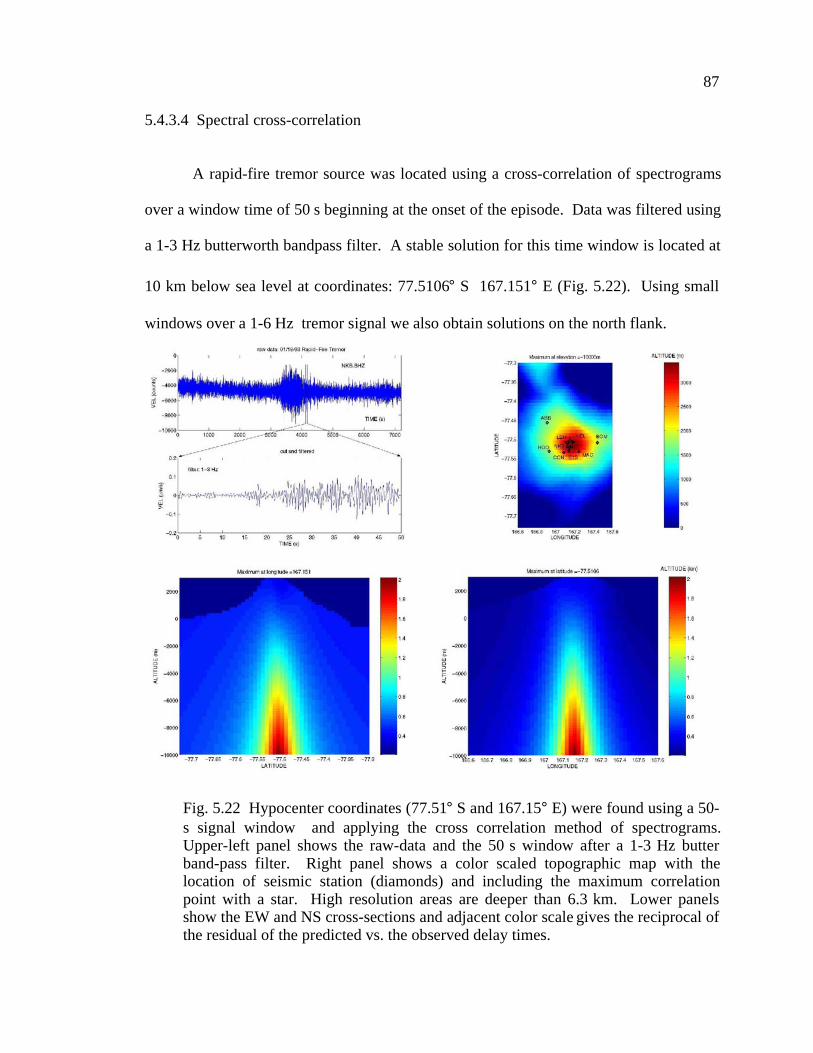
87
5.4.3.4 Spectral cross-correlation
A rapid-fire tremor source was located using a cross-correlation of spectrograms
over a window time of 50 s beginning at the onset of the episode. Data was filtered using
a 1-3 Hz butterworth bandpass filter. A stable solution for this time window is located at
10 km below sea level at coordinates: 77.5106° S 167.151° E (Fig. 5.22). Using small
windows over a 1-6 Hz tremor signal we also obtain solutions on the north flank.
Fig. 5.22 Hypocenter coordinates (77.51° S and 167.15° E) were found using a 50-s signal window and applying the cross correlation method of spectrograms.Upper-left panel shows the raw-data and the 50 s window after a 1-3 Hz butterband-pass filter. Right panel shows a color scaled topographic map with thelocation of seismic station (diamonds) and including the maximum correlationpoint with a star. High resolution areas are deeper than 6.3 km. Lower panelsshow the EW and NS cross-sections and adjacent color scale gives the reciprocal ofthe residual of the predicted vs. the observed delay times.

88
5.4.3.5 Summary
The amplitudes distribution of the 01/18/03 rapid-fire tremor shows a source
located below the NE flank, close to Fang Ridge. This epicenter is close to the points of
maximum cross-correlation using the envelopes of the tremor signals. Source depth is
likely 5 km beneath the summit according to the attenuation curves method. Semblance
method locates this episode at 3.5 km beneath the southwestern rim, probably due to the
difficulty of apply semblance in high-frequency seismic signals of Erebus. Epicentral
location using cross-correlation of spectrograms gives a solution close to the crater at
depth larger than 6.3 km.
5.4.4 Location of 02/01/03 Rapid-Fire Tremor Episode
This episode was briefly described on section 2.2.3. In this section, we apply the
methods already described for locating the onset of the rapid-fire part of the 02/01/03
tremor. Signal spectrum of rapid-fire part shows that this event does not exhibited
harmonics and most of the energy is concentrated on 1-6 Hz band (see Fig. 4.11).

89
Fig. 5.23 Rapid-fire tremor recorded on Feb. 01, 2003 on seismic stations ofErebus network. This episode has a total duration of 2,400 s. This plot containsonly the last part of a chaotic tremor from time 0 to 420 s, and the rapid-fire tremor,composed by 16 shocks is recorded from time 420 to 900 s.
5.4.4.1 Iso-seismal distribution
Amplitude values (rms) calculated for a 100 s window in the 1-6 Hz frequency
band, show values larger than 4 m/s at stations located on the northern flank (HEL,
NKB and E1S) and values smaller than 2 m/s for stations located on the south-western
flank (CON, HOO) or very distant from the crater (SBA). This distribution suggests that
the tremor source is located beneath the northern flank and close to the summit. A plot of
rms amplitudes of the entire signal filtered around the fundamental frequency 1 Hz <f0<2

90
Hz shows that the origin is located beneath the upper southern flank (Fig. 5.24).
Amplitude distributions over time windows of 100 s also have a consistent a peak of high
amplitudes beneath the upper part of the northeastern flank.
Fig. 5.24 Distribution of rms amplitudes calculated for the complete signals ofrapid-fire tremor recorded on Feb. 01, 2003. Contouring was performed withradial-based functions of Surfer software. Location of seismic stations is denotedby diamonds and normalized rms amplitude are located close to the stations withvertical numbers. Iso-seismic curves are drawn every 0.1. Largest amplitude areais located on the upper part of NE flank of the volcano, close to HEL station.
The best fit between the theoretical and observed ratios of rms amplitudes ABB,
BOM and SBA relative to the vertical component of E1S, was found for a hypothetical
hypocenter located at 77.51º S and 167.20º E and 4.2 km beneath the summit (Fig. 5.25).
This point is 0.5 km below sea level. Its epicenter corresponds to the northern part of the

91
summit plateau.
Fig. 5.25 Observed ratios between rms amplitudes of BOM, ABB and SBA withrespect to E1S for the rapid-fire tremor episode at 01 Feb. 2003 and theoreticalcurves showing the amplitude ratios for different depths. At 4.18 km (marked byarrow), these curves intercept, defining the depth point where observed amplitudesagrees with theoretical attenuation ratios.
5.4.4.2 Semblance method
Semblance method was applied over a 100 s window which starts at the beginning
of the rapid-fire part. Seismic signals were filtered with a butterworth band-pass filter of
1.0 to 5.0 Hz which keeps the energy of this type of events. The largest coherence point
was located at 0.6 km above sea level, at the coordinates 77.51° S and 167.19° E (Fig.
5.26). This area corresponds to a source located beneath the northern edge of the summit
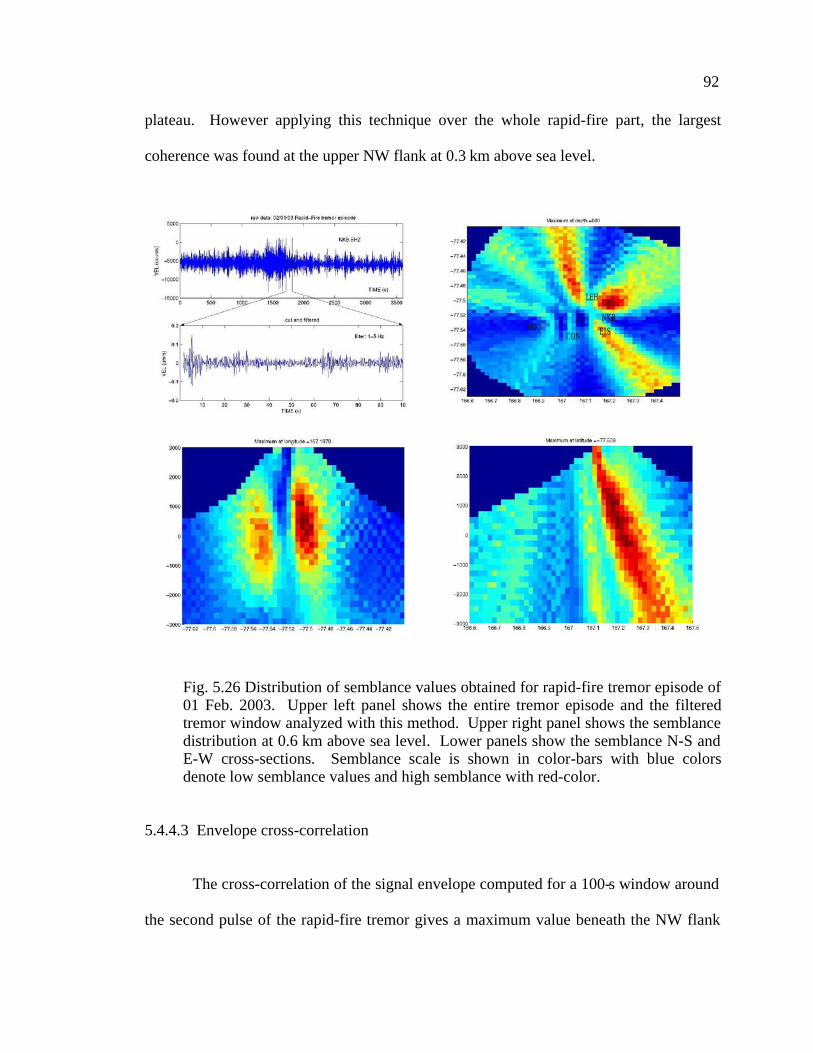
92
plateau. However applying this technique over the whole rapid-fire part, the largest
coherence was found at the upper NW flank at 0.3 km above sea level.
Fig. 5.26 Distribution of semblance values obtained for rapid-fire tremor episode of01 Feb. 2003. Upper left panel shows the entire tremor episode and the filteredtremor window analyzed with this method. Upper right panel shows the semblancedistribution at 0.6 km above sea level. Lower panels show the semblance N-S andE-W cross-sections. Semblance scale is shown in color-bars with blue colorsdenote low semblance values and high semblance with red-color.
5.4.4.3 Envelope cross-correlation
The cross-correlation of the signal envelope computed for a 100-s window around
the second pulse of the rapid-fire tremor gives a maximum value beneath the NW flank
HOOCON E1S
NKB
LEH

93
of the summit plateau, between in a narrow zone deeper than 8 km beneath the summit.
Epicentral coordinates of the tremor source are 77.49° S and 167.11° E (Fig. 5.27). The
high correlation area dips to the East without variation on the N-S plane. Small relative
arrival times (<0.02 s) explain the deep location of tremor source.
Fig. 5.27 Cross-correlation of signal envelopes method applied to Feb. 01, 2003rapid-fire tremor episode. Upper left panel shows envelope signals calculatedusing the Hilbert transform. Upper right panel shows in color the topographicdistribution of Erebus. Diamonds denote the seismic stations and the star isshowing the epicentral location of the highest correlation value. Lower panelsshow the N-S and E-W cross section. Color scale in lower section gives thereciprocal of the residual of the predicted vs. the observed delay times.

94
5.4.4.4 Spectral cross-correlation
Using a window time of 100 s beginning around the first pulse of the rapid fire
tremor filtered with a butterworth bandpass filter 1-9 Hz, a stable solution was located at
10 km depth beneath the upper part of the north flank (Fang ridge). The area with high
correlation is bounded by the coordinates 77.43° to 77.49° S and 167.1° to 167.3° E (Fig.
5.28). Cross sections show a small tilt to the East without variation on N-S plane.
Results are unstable if different time windows are analyzed. Very high time residuals are
found between station with the earliest arrival (BOM) and the other ones, meanwhile
arrivals between them are almost identical arrivals. Excluding BOM the solution became
more stable.
5.4.4.5 Summary
All methods - such as distribution of iso-seismals, semblance and cross-
correlation of envelopes, and cross-correlation of spectrograms - locate the episode on the
northern part of the summit plateau or on the upper NW flank. Solution depth for the
attenuation curve is 0.5 km beneath the sea level (4.2 km beneath the summit) and
semblance gives a depth of 0.3 km above the sea level. Cross-correlation methods have a
solution deeper than 10 km beneath sea level. Given the coincidence shown by
attenuation curves and semblance, we consider that source depth is located around the
base of the volcanic cone.

95
Fig. 5.28 Cross-correlation of signal spectrograms applied to Feb. 01, 2003 rapid-fire tremor episode. Upper left panel shows the complete raw signal and the 60 swindow analyzed (defined by a horizontal bar above the seismic trace). Upperright panel shows in color the topographic distribution of Erebus. Cross denote theseismic stations and diamond is showing the epicentral location of the highestcorrelation value. Lower panels show the N-S and E-W cross section. Color scalein lower section gives the reciprocal of the residual of the predicted vs. theobserved delay times.

96
5.5 Identification of tremor sources at Erebus volcano
The semblance method will be applied to locate tremor episodes recorded at
Erebus in the period 2000-2003. This method was chosen, considering that it can be
applied to any type of tremor events and also because it provides hypocentral solution
with very small errors (section 5.3.1 and 5.3.4).
5.5.1 Data preparation
Twenty six tremor events were selected for location using semblance method,
based upon the same assumptions described in section 5.4. Two harmonic episodes were
recorded in 2000, 5 in 2001, 6 in 2002 and 11 in 2003. Two rapid-fire episodes from
2003 were also located. Signal amplitudes were normalized by the norm of the signal
vector in order to reduce the influence of amplitude variations between different stations.
A spectral normalization of the signal was applied multiplying each signal spectrum by
the mean spectrum of each event. Then the whole signal was spliced in small windows
(10 or 20 s-long). For each window, semblance values were computed at every point of a
20x20x47 search-grid, moving each signal a delay time according to the distance between
the grid point and the recording station. Each window gives a partial solution of
hypocentral coordinates associated with the largest semblance value. A median of these
partial solutions weighted with the corresponding partial semblance value was considered
as the hypocentral location of the tremor episode. Error bars were calculated at 95% of
confidence using a bootstrap algorithm that generates series of 100 partial hypocentral
97
locations inside a range of coordinates with +/- one standard deviation.
5.5.2 Distribution of epicentral locations
Parameters of the epicentral locations of 26 tremor episodes are presented in table
5.2. Figures 5.29 through 5.32 show the location of these episodes (the median value of
the epicentral location of each tremor episode is marked with a red cross, and the
corresponding error ellipses with the 95% of confidence are in red). Partial semblance
solutions (with a black x) are classified in three coherence groups (above 66%, between
33% to 66%, and below 33% of the maximum semblance of the entire episode). Seismic
stations are denoted with green diamonds. Erebus topography is represented using 500
m- spaced contour levels.
Both tremor episodes of 2000 (09/27/00 and 12/15/00) have different epicentral
areas (fig. 5.29). The episode of 09/27/00 has mean of maximum semblance values at the
south-western flank (Group SW), meanwhile the episode of 12/15/00 the maximum
semblance is located on the caldera plateau (Group P). Median value of the partial depth
solutions for both cases is inside the [2800 : 4300 m] range below the crater.

98
Table 5.2 Parameters of hypocentral locations
Occurrence
mm/dd/yy
Num.ofstations
Duration (s)
Num.ofwindows
LatitudeSouth
LongitudeEast
Depth (m)
HT 09/27/00 5 100 10 77.563 ± 0.039 166.876 ± 0.183 -46 ± 990
HT 12/15/00 5 300 30 77.526 ± 0.021 167.172 ± 0.073 -371 ± 1166
HT 01/12/01 6 200 20 77.489 ± 0.029 167.187 ± 0.053 -405 ± 1423
HT 02/03/01 7 240 24 77.509 ± 0.039 167.203 ± 0.120 -2992 ± 1586
HT 02/07/01 7 300 15 77.517 ± 0.042 166.946 ± 0.101 -1748 ± 1667
HT 02/08/01 7 1100 55 77.522 ± 0.028 167.199 ± 0.086 -2313 ± 1219
HT 02/09/01 7 500 25 77.520 ± 0.022 167.048 ± 0.128 -3708 ± 1148
HT 01/25/02 6 1500 75 77.507 ± 0.020 167.106 ± 0.097 -1673 ± 945
HT 01/26/02 6 1800 90 77.512 ± 0.015 167.145 ± 0.075 622 ± 723
HT 02/07/02 6 120 12 77.517 ± 0.023 167.160 ± 0.272 -2050 ± 3336
HT 02/23/02 6 200 20 77.490 ± 0.072 167.200 ± 0.122 -897 ± 641
HT 03/06/02 6 80 8 77.570 ± 0.097 166.892 ± 0.338 -3861 ± 2411
HT 12/24/02 7 500 25 77.533 ± 0.016 166.932 ± 0.200 -1089 ± 1930
HT 01/04/03 6 2100 105 77.528 ± 0.012 167.243 ± 0.065 -2070 ± 719
HT 01/16/03 9h 9 300 30 77.534 ± 0.028 167.182 ± 0.082 -2260 ± 1440
HT 01/16/03 12h 9 900 45 77.525 ± 0.015 167.110 ± 0.092 -946 ± 1486
HT 01/30/03 9 700 35 77.500 ± 0.012 167.103 ± 0.183 -3302 ± 1656
HT 02/02/03 10 1400 70 77.517 ± 0.008 167.169 ± 0.046 -1529 ± 606
HT 02/13/03 10 1200 60 77.522 ± 0.024 167.065 ± 0.094 -2493 ± 1257
HT 02/14/03 9 500 25 77.537 ± 0.019 167.113 ± 0.090 -1492 ± 1138
HT 02/27/03 9 1200 60 77.519 ± 0.018 167.188 ± 0.078 -1454 ± 894
HT 03/31/03 6 480 24 77.512 ± 0.024 167.085 ± 0.170 -957 ± 1892
HT 04/01/03 9 600 30 77.536 ± 0.014 167.044 ± 0.123 -2897 ± 811
HT 04/12/03 9 2200 110 77.498 ± 0.011 167.190 ± 0.055 155 ± 825
RF 01/18/03 9 600 30 77.544 ± 0.019 167.078 ± 0.183 -2369 ± 1493
RF 02/01/03 10 500 25 77.497 ± 0.029 166.955 ± 0.129 552 ± 2043

99
Figure 5.29 Epicentral location and error ellipses at 95% of confidence of tremorepisodes in 2000 (09/27/00 and 12/15/00).
Epicentral locations of tremor episodes from 2001 (Fig. 5.30) can be also
classified in the previous groups. Events of 01/12/01, 02/03/01, and 02/08/01 have the
epicenter close to the summit plateau or in the upper N-NE and E flanks (Group P). Error
ellipses of these events cover the plateau and the upper part of the north flank. On the
other hand, tremor episodes of 02/07/01 and 02/09/01 have epicenters in the upper
western flank and their error ellipses cover this area (Group SW).
Tremor episodes of 01/25/02 and 01/26/02 are located on the NW upper flank,
with error ellipses elongated in the NW-SE direction. These events form an epicenter
group called Group NW. Locations of the episodes 02/07/02 and 02/23/02 are in the
same area of group P, and events of 03/06/02 and 12/24/02 belong to Group B. See
Figure 5.31.

100
Fig. 5.30 Epicentral location and error ellipses at 95% of confidence of tremorepisodes in 2001 (Tremor episodes of 01/12/01, 02/03/01, 02/07/01, 02/08/01, and02/09/01).

101
Fig. 5.31 Epicentral location and error ellipses at 95% of confidence of tremorepisodes in 2002 (Tremor episodes of 01/25/02, 01/26/02, 02/07/02, 02/23/02,03/06/02, and 12/24/02).

102
Fig. 5.32 part A (captions in next page)

103
Fig. 5.32 Part B. Epicentral location and error ellipses at 95% of confidence oftremor episodes in 2003 (Part A: tremor episodes of 01/04/03, 01/16/03, 01/16/03,01/30/03, 02/02/03, and 02/13/03; Part B: tremor episodes of 02/14/03, 02/27/03,03/31/03, 04/01/03, and 04/12/03).

104
Figure 5.32 (part A and part B) shows also that epicentral locations of 2003 can
be classified in three groups: Group P containing epicenters on the summit caldera or
close to the caldera on the upper north flank. Group SW with epicenters close to CON or
HOO stations) on the upper west and southwest flanks. The 01/30/03 episode has the
epicenter close to LEH station and can be considered as part of Group NW.
Epicenters of two rapid-fire episodes are located in different area (Fig. 5.33). The
epicenter of the event of 01/18/03 is located close to Con station, on the upper
southwestern flank, while the epicenter of the episode of 02/01/03 is located on the
northwestern flank. Error ellipses show different orientations and no-overlapping
between them, suggesting a different source location for each event.
Fig. 5.33 Epicentral location and error ellipses at 95% of confidence of Rapid-firetremor episodes (01/18/03 and 02/01/03).

105
5.5.3 Depth Distribution of Tremor Episodes
Figure 5.34 shows the distribution of the mean values of tremor depths and the
corresponding error estimations. Focal depths for 24 harmonic tremor episodes have an
average of -1626 m below sea level (about 5.4 km below the crater) with a standard
deviation of 1245 m. Events with high semblance have small epicenter and depth errors.
Tremor episodes of 01/25/02 and 01/26/02 with maximum semblance values larger than
0.8, have depths of -1673 to 945 and 622 to 723, suggesting that they are generated at
different depth levels. It is important to mention that both events were classified as
Group NW, which means that the even inside a group of epicenters tremor may have
different sources. Similar conclusions can be achieved if we consider the events of
02/02/03 and 04/12/03, both from the same epicentral group, both with high semblance
values, and both with small error estimations.

106
Fig. 5.34 Depth distribution of 24 harmonic tremor episodes recorded between2000 and 2003 at Erebus volcano. Depths were calculated using the semblancemethod. Squares represent the hypocentral coordinates corresponding to themedian value of partial locations calculated in small time windows (10 or 20 s-long). Error bars represent the extension of the 95% confidence range calculatedusing a bootstrap simulation.
107
6. MODELLING OF TREMOR SOURCE Models for generating tectonic events can be effectively explained by a single or
multiple dislocations, which are driven by a coupled-shear forces mechanism; however
modeling volcanic tremor episodes is a very complex problem. Difficulties arise from
almost continuous signals with emergent onsets and energy confined in multiple equally
spaced overtones. Several models for harmonic tremor generation have been proposed in
the past, some are based on resonance of magma chamber or conduits, while others are
based on excitation of elastic waves by repetitive force impulses (Hellweg, 2000). Non-
harmonic tremors have been related to hydrothermal process (Kieffer, 1984; Leet, 1988;
Martinelli, 1990) and also to sequences of fracture earthquakes (McNutt, 1992).
6.1 Summary of existing source models
Early attempts to find a suitable mechanism of volcanic tremor were based on a
self-oscillatory process of the magma chamber (Sassa (1935), Kubotera (1974), Crosson
and Bame(1985), Fujita and Ida (1999)). Schick (1981) and Seidl et al (1981) started to
take account of the role of transport of fluids in tremor generation. Here, I will present a
summary of some of models for generating harmonic tremors based on resonance of
fluid-filled conduits or oscillations caused by fluid transport.

108
6.1.1 Resonance models
Models based on resonance of fluid-filled cracks are characterized by narrow
spectral peaks as the oscillatory response of a fluid/gas filled crack or conduit to some
general forcing function (Hellweg, 2000).
6.1.1.1 Resonance by propagation of cracks.- This model was proposed by Aki et al.
(1977), Aki and Koyanagi, (1981) and Chouet (1981) based upon the deep tremor
observed at Kilauea volcano. According to this model, tremor is generated by the jerky
extension of a chain of cracks caused by a magmatic intrusion. The cracks are connected
by narrow channels that open when magma pressure reaches a critical value, facilitating
the movement of fluid from one crack to the next one. Signal frequency is inversely
proportional to the crack length, and signal amplitude depends on the excess pressure and
the area of extension (Konstantinou and Schlindwein, 2003). Variations in the frequency
content are related to the number of cracks that are vibrating at the same time, as well as
to the length of the cracks (Konstantinou and Schlindwein, 2003).
6.1.1.2 Resonance by disturbance of fluid.- The harmonic resonance of a fluid-filled
crack has long been proposed as the source of harmonic oscillatory behavior at many
volcanoes (Chouet, 1986, 1988, 1992, 1996). This resonance is caused by a pressure
disturbance in the fluid which is not accompanied by an inflow or outflow. Depending
on the duration of the disturbance, the generated signals could be a long-period event or a
tremor episode. The resultant wavefield depends on: a) crack geometry, b) position and

109
area where disturbance is applied, c) boundary conditions for the stress on the crack's
surface and the fluid flow at the crack perimeter, and d) crack stiffness C, given by Eq.
6.1, and the fluid-solid impedance contrast Z, given by Eq. 6.2.
C= bL / µ d (6.1)
Z = ρs α /ρf a (6.2)
where b is the bulk modulus of fluid, L and d are the crack length and crack thickness; µ
and ρs are the rigidity and density of solid, ρf is the fluid density and α and a are the p-
wave velocity of solid and fluid, respectively.
A pressure disturbance can generate longitudinal and lateral resonance modes of a
rectangular crack that are given by 2L/n and 2W/n, where n = 1,2,3,4,.... , with W the
crack width. The spectrum of the far-field radiated waves is dominated by sharp peaks
representing the mixing of the longitudinal and lateral modes.
Resonance models have been applied to explain tremor episodes at several
volcanoes. Benoit and McNutt (1997) modeled the source of harmonic tremor at Arenal
volcano as resonances of a 1D vertical conduit. Long Period events recorded in Galeras
volcano were related to resonance of two cracks (L: 240-360 m; W: 130-150 m; d=0.5-
3.5 mm) which are connecting the degassing magma body to the surface (Gil-Cruz and
Chouet, 1997). Saccorotti et al. (2001) attribute the harmonic tremor recorded on
Kilauea to the resonance of a crack with a length of 20-100 m and an aperture of few
110
centimeters, which is filled with bubbly water.
6.1.2 Models based on conduit oscillations
Flow instabilities through magmatic cracks or conduits have been invoked at
several locations to model volcanic tremor where fluids move through conduits in the
subsurface (Julian, 1994; Morrisey and Chouet, 1997; Julian, 2000).
6.1.2.1 Slug Flow.- The cyclic presence of slugs, defined as regions of turbulence in a
pipe flow, which are separated from the other turbulent segments by portions of laminar
flow, can generate pressure differences because the turbulent slug moves through the
pipe at lower velocity than the laminar part (Hellweg, 2000). This process can be
repeated for a long period of time (Hellweg, 2000). This model requires a narrow
channel connecting two reservoirs. Channels with dimension ratios L/d larger than 50
have been observed in dikes of eroded volcanoes (Hellweg, 2000).
6.1.2.2 Constricted flow.- Julian (1994) considered a flow inside a vertically extending
crack connecting an upstream and a downstream reservoir (Fig. 6.1). When the fluid
flows through a constricted channel bounded by a pair of deformable elastic walls, the
velocity of the fluid and pressure of the fluid over the crack walls should be compensated
according to Bernoulli's theorem which states that the quantity (p + ρ ν2) must remain
constant. Bernoulli's theorem explains that at large flow speeds ν, the fluid pressure p in
the conduit decreases and the crack walls move towards each other, constricting the flow
and causing a pressure increase which forces the channel open again. The process could

111
repeat itself. Closing and widening the crack generate oscillations that travel elastically
through the volcano.
Numerical solutions of this model based on a system of third-order ordinary
differential equations can be found assuming that fluids are incompressible, at a constant
density and should consist by only one phase, motions occur in one or two dimensions,
and the conduit behaves elastically, while its thickness can only change as a function of
time. This model considers time t as the independent variable, and the channel thickness,
h, and the flow speed, ν , as dependent variables (Julian, 2000). Considered as a control

112
parameter, the pressure driving the fluid flow through the channel, p1, the solutions show
various kinds of behavior (Fig. 6.2). For small p1, the flow is steady and no vibration
occurs. At a critical pressure value, short-duration vibrations appear, resembling low-
frequency earthquakes. Increasing p1, vibrations are continuous due to a long sequence of
increase and decrease conduit thickness. Finally, at high values of p1, a chaotic vibration
is reached as a result of a period-doubling cascade (Fig. 6.3).

113
In summary, this model offers a single explanation for different characteristics of
volcanic tremors such as episodes with harmonic and chaotic behavior, systematic
changes in tremor amplitude as channel geometry evolves, spectra with period-doubling
effect, and frequency variations as function of amplitude.
6.2 Characteristics of tremor at Erebus
Tremor models must explain amplitude range, duration, spectral content and
spectral variations and location of the tremor source at Erebus.

114
6.2.1 Amplitude
Tremor episodes cover a large range of amplitudes. Largest tremor signal
recorded at SBA (37.96 km from the crater), reached 1.227 µm on Jul. 4, 2003. The
second term of the relationship given by Aki and Richards (1980) between the
displacement wavefield for body waves and a point force in the jth direction, could give a
fair approximation of the magnitude of the excitation force of tremor if it is assumed that
the medium is elastic and there is neither scattering or absorption (Hellweg, 2000). In
this calculation the directional cosines have their largest values (γi, γj = 1), a mean basalt
density ρ= 3000 kg/m3 (Jakosky, 1950), and the wavefield velocity is vp = 4070 m/s.
u(t)i = (1 /4 πρ vp2) γi, γj (1/r)Fo(t-r/vp) (6.3)
from Eq. 6.3, and using the values above and assuming a source 3.8 km beneath
the crater, we get
Fo(t-r/vp)=2.94x1010 N.
If we consider a source with a double couple mechanism, the shear dislocation of
strength Mo can be estimated using the far-field displacement components given by Eq.
6.4 derived from Aki and Richards (1980):
u(t=∞)=Mo(1/4πρr2[½ (3/vs
2 – 1/vp2)sin2θ cosφ r + (1/vs
2)(cos2θ cosφ θ - cosθ sinφ φ)] Eq. (6.4)
assuming θ=45˚ and φ=0 for maximum p values, and the maximum displacement

115
observed at SBA station, the lower bound scalar seismic moment for this tremor episode
is:
Mo= 2.82x10¹⁴ Nm
which using the Eq. 6.5 given by Kanamori (1977) with Mo in dyna cm.
Mw=2/3 log10 Mo - 10.7 (6.5)
is equivalent to a magnitude Mw= 3.6. These values suggest the presence of a strong
tremor at Erebus.
6.2.2 Location
Assuming locations provided by the semblance modeling, tremor episodes at
Erebus have a deep source (~5.4 km) located beneath the crater. This source location is
in agreement with the fact that tremor activity is not accompanied by surface
manifestations of activity. Linear regressions of GPS data collected on 2001, showed
horizontal deformations of 0.1 mm/year for CON-NKB and CON-E1S baselines (Kyle et
al., 2001). Based on GPS data Bartel et al. (2003) found consistent small horizontal
motions in a 3-year period which are consistent with a small volume perturbation around
5 km depth. At this depth, a basaltic magma with a hydrostatic pressure of 147 MPa, has
a solubility of CO2 of 0.075 % in weight and a solubility of 4% of water (Wallace and
Anderson, 2000). The SO2 emission rates of Erebus are extremely low compared to most

116
volcanoes (Zreda-Gostynska, 1997). These values suggest that only CO2 can be present
as a gas free phase at that depth, and magma can be considered at that depth as a single-
phase fluid. For a seismic signal generated by fluids at 5 km depth, Kumagai et al.
(2003) found that the fluid in the resonator should be magma filling a dike.
6.2.3 Duration
Duration of tremor episodes has a mean of about 1 hour between 2000 through
2003. This strongly suggests that the mechanism of generation of tremor has a clearly
non-destructive behavior or is occurring at multiple sites. The persistence of tremor for
about 3 years also supports this consideration.
6.2.4 Frequency content
Frequency content of tremor episodes observed in this study is consistently
located in the range of 1-3 Hz (Fig. 2.14) for all stations. Very few events have the
largest energy concentration at frequencies larger than 5 Hz. These results do not support
a source process based on rock fracture or fault slip because rock-fracture signals should
have broad spectra and high frequencies at least in the stations closest to the source.
Most of the high frequency events are though to be related to shear failure or slip process
(McNutt, 2000).
The majority of the tremor episodes at Erebus have at least one clear harmonic
117
(an amplitude peak located at multiples of the fundamental frequency f0). Almost 5%
have 10 or more overtones. These frequency pattern cannot be explained by
amplifications due to a path effect as was suggested by Gordeev (1992, 1993) and Seidl
et al. (1981), because the same frequency peaks are observed at many different azimuths
and distances. The gliding effect observed in about 50% of the tremor episodes can not
be explained as a path effect. The gliding effect can be explaining by a variation of the
resonator dimensions or by changes in excess pressure in the conduit (Neuberg and
O'Gorman, 2002).
Period-doubling has been also documented on Erebus tremor episodes, with the
presence of sub-multiples of spectral periods. This phenomenon can be clearly seen on
the tremor episodes of July 2, 2003 (Fig. 4.11) and July 17, 2000 (Fig. 4.5).
The main spectral characteristics (low frequency range, number of harmonics,
gliding effect and secondary spectral peaks) should be explained as expressions of a
source process.
6.2.5 Q value
Q values for several tremor episodes were calculated using the relation:
Q=f /∆f (6.4)
where f and ∆f are, respectively, the frequency and the width of the spectral peak at its
half-energy level. Table 6.1 show some of the highest Q-values obtained from tremor

118
signal at Erebus volcano. Aki et al. (1977) found the following relationship for Q and the
impedance contrast Z, in case of a fluid-filled spherical resonator:
Q= π / ln [ ( Z+1)/( Z-1) ] (6.5)
using this expression, we found the expected Z values for Erebus (Table 6.1).
Table 6.1 Q values for tremor episodes at Erebus volcano.
Date f (hz) f2-f1 Q Z
1/4/03 4.200 0.040 105 66.8
1/15/03 1.510 0.020 75.5 48.1
1/17/03 0.717 0.011 65.2 41.5
1/30/30 2.830 0.060 47.7 30.4
2/13/03 4.210 0.060 70.2 44.7
2/15/03 5.320 0.060 88.7 56.5
3/26/03 1.060 0.020 53 33.7
5/30/03 0.510 0.014 36.4 23.2
However in case of a magmatic source located 5 km below the crater, we should
assume a crack filled with magma (perhaps basanite, a phonolite parental magma), with a
vpf= 2320 m/s and a density of δf= 2600 kg/m3 (Dibble, 1994), and a hosting rock with
vpr= 4070 m/s (Dibble et al., 1994) and a rock density of 3000 kg/m3. Applying these
values, values of Zrf = 2.03 and Q= 2.91, were obtained. These results show an important
discrepancy with the impedance contrasts obtained from the signal spectra. If we
consider a fluid-filled crack, Z will also depend on the crack stiffness defined by Eq. 6.1,

119
which introduce more variables in our model. On the other hand, Ferrazini and Aki
(1987) found a very low velocity crack wave that contributed to high Q values in shallow
resonance conduits.
6.3 Discussion of applicable models
Applicability of resonance models (jerky extension of cracks and resonance of
fluid-filled conduits) has several problems in case of Erebus tremor:
- Extension of resonator.- If we consider the shortest frequency observed at Erebus
tremor (f0 = 0.25 Hz), and a p-wave velocity of 2.5 km/s for andesitic magma, we may
obtain a resonator with a length of 10 km, which contradicts the location of tremor
sources.
- The deep location of Erebus tremor discards the possibility of a tremor mechanism
based on resonance of gas in an organ-pipe structure as was suggested by Schlindwein et
al.(1995).
- Number of overtones.- Although these model can explain the low frequency range and
also the presence of a limited number of harmonics as the result of the excitation of
higher resonance modes, however, Hellweg (2000) points out that resonance of a real,
physical structure, can produce neither as many overtones nor exact frequency intervals.
It requires a repetitive and non-destructive forcing mechanism driven by mass transport

120
or pressure fluctuations.
- Impedance contrast.- Very high Q values obtained from some tremor episodes listed on
Table 6.1, imply a high impedance contrast in the resonance system, which is difficult to
obtain for a magmatic-fluid and host rocks of Erebus volcano. However, CO2 bubbles at
these depths might contribute to decreasing the p-wave velocity of the fluid, and thus
increasing the impedance contrast.
- Gliding.- Gliding is observed in 50% of the tremor episodes at Erebus (section 4.2.1.1),
and in some cases gliding is so intense that frequency changes by much as 160% in about
10 min. Resonance models consider that these variations in frequency values are caused
by changes in the conduit dimensions, however the magnitude and speed of frequency
variations of tremor episodes of Erebus are difficult to explain by variations in conduit
dimensions unless the source region is evolving rapidly.
- Transitions between harmonic to chaotic.- Seismic signals generated by resonance
mechanisms should produce harmonic spectra. Coexistence between harmonic and
chaotic parts in the same tremor episode would require a different source or external
noise acting at the same time.
Considering the problems that resonance models face with Erebus data, we will
focus our attention on oscillation models.

121
The model of oscillations generated by slug flow considers that the excitation
force is caused by the pass of slugs of magma in a channel. In case of Erebus data, it
would require fluid velocities close to 100 m/s (Hellweg, 2000) or channels thicker than
0.1 m in order to obtain a suitably large Reynolds number. Conduits are likely thick
enough, however, it is difficult to have very high velocities in the magmatic system. One
problem facing this model is the magnitude of the excitation force, which will be hard to
be achieved by slug flows.
The Julian model (1994) seems to be the more suitable model for Erebus tremor
because it explains satisfactorily some characteristics observed at Erebus:
- Harmonic signals.- Julian model (1994) shows that it not necessary to have a system
with acoustic resonance to generate signals with harmonic spectra (energy concentrated
on evenly separated spectral peaks). This type of spectrum can be modeled by non-linear
systems based on third-order system of differential equations (Julian 1994; 2000).
- Period-doubling.- Julian (2000) points out that this phenomenon occurs only in non-
linear systems. The resultant spectrum has larger number of overtones and frequency
peaks at values smaller than the real fundamental frequency. Changing a control
parameter, new frequencies at half of the previous repetition frequency appear on a
simple periodic oscillation. The output is still periodic but the repetition period is now
half of the original. Further increase in the number of overtones can also transform an
harmonic signal into a chaotic one. Some tremor episodes recorded on Erebus exhibit a

122
period-doubling cascade effect in some Erebus signals, implying that a non-linear
excitation is the responsible of the generation of tremor.
- Transitions between harmonic and chaotic behavior.- Period doubling is the most
common route by which non-linear systems change from harmonic to chaotic behavior
(Julian, 2000). It requires a high sequence of doublings to increase the period without
limit and produce a chaotic signal. The reverse mechanism can also be applied.
- Gliding frequencies.- Variation with time of spectral peaks can also be caused in a non-
linear by changes in the amplitude of oscillations. Tremor episodes of Feb. 9, 2001 (Fig.
4.7) and Feb. 2, 2001 show gliding effect accompanied by a decrease in the amplitude
signal (See section 4.4.1.2).
- Abrupt changes.- Rapid changes in the state of the oscillator can arise from abrupt
changes in oscillator geometry. Such changes could be caused by breakup of a
constriction, for example.

123
7. SEISMIC SIGNALS FROM ICEBERGS
7.1 Introduction
Considering that highly energetic tremor activity recorded at Erebus from 2000
has been concurrent with the formation, drifting, and break-up of very large (10's of km
in length) new icebergs in the Ross Sea, I will discuss the relationship between both
phenomena using the results obtained by Talandier et al. (2002) and an analysis of
amplitude ratios of tremor signals recorded by MEVO seismic stations in this context.
7.2 Ross Sea Icebergs
Large Antarctica icebergs are formed by ruptures of an ice shelf border. As
icebergs drift off-shore, they are broken into smaller pieces, as well as melt, with time.
The life span of an iceberg depends of its size and location, and can vary between months
to years.
The largest iceberg noted to date in Antarctica (called B15), measuring 300 km by
40 km, calved off the Ross Sea ice shelf in March 2000, just few months before tremor
activity started being recorded. The southwestern edge of this iceberg was at 77.3º S and
168º E, approximately 35 km northeast of Erebus crater. By 15 August 2000, B15B
(135x 40 km) had detached from B15, and started drifting towards the center of the Ross
Sea at a velocity of 4 km/day (Talandier et al., 2002). The remanent portion, called

124
B15A, stayed attached to the northern rim of the ice shelf (Fig. 7.1). On October 7, 2003,
at 21:55, B15A broke into two pieces through a discontinuous E-W fracture (Neal
Young, personal communication). The larger piece, and northern one, was called again
B15A and the smaller one was called B15J (Fig. 7.2). Data from a GPS receiver installed
on the iceberg (southern piece) suggest that the separation was caused by a southward
displacement of southern piece by about 15 km during October 7 (Douglas MacAyeal,
personal communication). By October 9, 2003 at 03:28, two pieces were clearly seen in
satellite imagery. On November 28, satellite images show B15J rotating clockwise and
drifting eastward along the shelf border, while B15A started to move toward the north
(Fig. 7.3).
Fig. 7.1 NOAA-12 image of B15A and C16 iceberg calving off Ross Ice Shelfclose to Ross Island, which is also covered by snow and ice. December 27, 2001.Taken from amrc.ssec.wisc.edu/amrc/iceberg.html.

125
Fig. 7.2 Image from the Shortwave Infrared MODIS instrument taken on October09, 2003. Antarctic Meteorological Research Center of University of Wisconsin atMadison. http://amrc.ssec.wisc.edu/amrc/iceberg.html. North is shown by redarrow pointing to left -lower corner.
Fig. 7.3 November 28, 2003 NOOA 16 infrared image showing B15A, B15J, andC16. B15A and B15J are continuously moving apart. Taken fromhttp://amrc .ssec .wisc.edu /amrc/iceberg.html

126
A smaller iceberg C16, located close to the NE part of Mount Bird, does not show
evidence of major movements. Another iceberg, B17 calved off the shelf around 78º S
between 165º to 175º W and drifted northward before colliding to B15B on the central
Ross Sea around latitude 75º S.
7.3 Location of hydro-acoustic signals between 2000 and 2001
Talandier et al. (2002) reported that 13 signals were recorded by T-phase
hydrophone stations located on atolls and coral reefs of French Polynesia between August
15, 2000 to January 14, 2001 (Table 7.1). These signals have prominent spectral peaks in
the 4-7 Hz band, and some of them presented overtones and gliding effects. A
preliminary location using cross-correlation of spectrograms showed that these signals
have epicenters in and around the Ross Sea (Talandier et al., 2002). Considering their
location in the Ross Sea and their spectral configuration, Talandier et al. (2002)
suggested these signals had a volcanic origin, but this hypothesis was discarded because
source locations did not match any of the volcanic centers around the Ross Sea area.
Further analysis showed that epicenters of these signals match with locations of huge
icebergs which at that time were drifting on the Ross Sea (Talandier et al., 2002).
Talandier et al (2002) proposed two mechanisms for generation of tremor-like signals
between November and December 2000, one could be the collision between large
icebergs (B15B and B17), and the second one would be linked to the friction on the sea
floor.
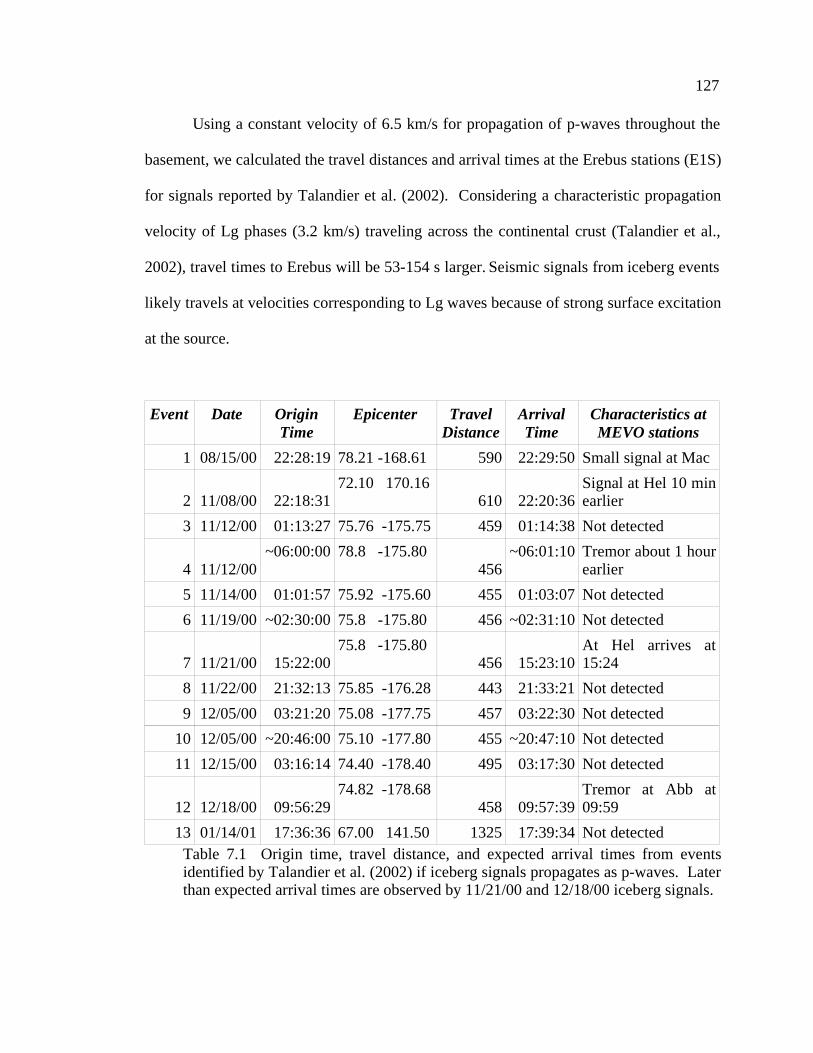
127
Using a constant velocity of 6.5 km/s for propagation of p-waves throughout the
basement, we calculated the travel distances and arrival times at the Erebus stations (E1S)
for signals reported by Talandier et al. (2002). Considering a characteristic propagation
velocity of Lg phases (3.2 km/s) traveling across the continental crust (Talandier et al.,
2002), travel times to Erebus will be 53-154 s larger. Seismic signals from iceberg events
likely travels at velocities corresponding to Lg waves because of strong surface excitation
at the source.
Event Date OriginTime
Epicenter TravelDistance
ArrivalTime
Characteristics atMEVO stations
1 08/15/00 22:28:19 78.21 -168.61 590 22:29:50 Small signal at Mac
2 11/08/00 22:18:3172.10 170.16
610 22:20:36Signal at Hel 10 minearlier
3 11/12/00 01:13:27 75.76 -175.75 459 01:14:38 Not detected
4 11/12/00~06:00:00 78.8 -175.80
456~06:01:10 Tremor about 1 hour
earlier
5 11/14/00 01:01:57 75.92 -175.60 455 01:03:07 Not detected
6 11/19/00 ~02:30:00 75.8 -175.80 456 ~02:31:10 Not detected
7 11/21/00 15:22:0075.8 -175.80
456 15:23:10At Hel arrives at15:24
8 11/22/00 21:32:13 75.85 -176.28 443 21:33:21 Not detected
9 12/05/00 03:21:20 75.08 -177.75 457 03:22:30 Not detected
10 12/05/00 ~20:46:00 75.10 -177.80 455 ~20:47:10 Not detected
11 12/15/00 03:16:14 74.40 -178.40 495 03:17:30 Not detected
12 12/18/00 09:56:2974.82 -178.68
458 09:57:39Tremor at Abb at09:59
13 01/14/01 17:36:36 67.00 141.50 1325 17:39:34 Not detectedTable 7.1 Origin time, travel distance, and expected arrival times from eventsidentified by Talandier et al. (2002) if iceberg signals propagates as p-waves. Laterthan expected arrival times are observed by 11/21/00 and 12/18/00 iceberg signals.

128
These iceberg events were hardly seen on MEVO stations, due to the large
epicentral distances and, perhaps, the intrinsic attenuation in the Erebus region. Figure
7.4 shows the hydro-acoustic signal recorded at VAH (French Polynesia) and the seismic
signal recorded at VNDA (Antarctica) for the Event 7 (11/21/2000), with a tentative
source at 75.8° S and 175.8° E. Figure 7.5 shows the corresponding records for HEL and
MAC. A comparison between these spectrograms shows a snake-shaped peak in the 4-5
Hz band lasting for 3 minutes, and then followed by a lower frequency phase. This
common aspect at different stations indicates a clear and characteristic source effect.
Event 12 (Dec. 18, 2000) has a predicted origin time at 09:56 UT, and epicenter
on the Ross Sea at coordinates: 74.82° S and 178.68° E. Figure 7.6 shows the hydro-
acoustic record at VAH (Polynesia), and Figure 7.7 shows the corresponding seismic
signals at HOO and ABB. Both signals show a sharp onset with high frequency content
and a second phase 180 s later with an emergent initiation. No overtones are observed.
Iceberg delays reported for 11/21/2000 and 02/18/2000 are in agreement with expected
arrival times for Lg waves. The rest of the events were either too small to have clear
arrival times or not detected at all.

129
Fig. 7.4 Spectrograms and time series recorded at VAH station (top) and at VNDA(bottom) of Event 7, Nov. 21, 2000, show an excellent correlation between the twospectra (Taken from Talandier et al., 2002).

130
Fig. 7.5 Seismic signals (top) and spectrograms (bottom) recorded at HEL andMAC stations between 15:21 and 15:31, Nov. 21, 2000. Signals from Event 7(Table 7.1), with origin time at 15:22, are predicted to be arriving at Erebus stationsat 15:24 (marked by vertical arrows), in case of waves with a velocity of 3.7 km/s(Lg phases). Hel record shows a weak 4-5 Hz signal lasting about 3 min (from time200 to 380 s), similar to signals recorded at VNDA and VAH (Figures 7.3 and 7.4).

131
Fig. 7.6 The spectrogram of Event 12, Dec. 12, 2000; recorded on 11:12:30 UT atVAH (hydrophoene) is shown in the main frame. Lower frame shows a 600-s timeseries of this signal with a 2 Hz high-pass-filter. The frame at the right contains theamplitude spectrum of the high-pass filtered amplitude signal (Courtesy of E.Okal).
Fig. 7.7 Seismic signals and spectrograms at HOO and ABB, recording Event 12,(Dec. 12, 2000); which has an origin time at 09:56 UT marked by vertical arrows.Signals were band-pass filtered between 1-15 Hz.

132
7.4 Amplitude distribution of tremor signals
Rms amplitudes of vertical components were computed for all tremor episodes
recorded at Erebus. Signals were previously corrected for magnification and filtered in
the 0.8 – 10.0 Hz band in order to prevent noise contamination (from microseismic noise
and high frequency source). Using these signal corrections, it is expected that rms
amplitudes may reflect a normal attenuation decay with distance for body or surface
waves.
Assuming that these tremor-like signals are generated by the nearby icebergs
(B15A, B5J or C16), the epicenters would be located at the closest epicenter to Erebus
reported by Talandier et al., (2002) or at the southwestern corner of the B15A (before
formation of B15J). Considering both epicenters, corresponding attenuation curves were
calculated for body and surface waves. Figure 7.8 A shows that in case of a distant
source (~45 km) amplitude ratios between stations of Erebus network are close to one.
For surface waves, E1S/BOM is 0.99, and SBA/BOM is 0.97; and for body waves we
have ratios of E1S/BOM = 0.98 and SBA/BOM = 0.93. Figure 7.8 B shows these ratios
for a tremor episode located at the SW corner of B15A finding a E1S/BOM is 0.90 and
SBA/BOM is 0.64; and for body waves we have ratios of E1S/BOM = 0.82 and
SBA/BOM = 0.42.
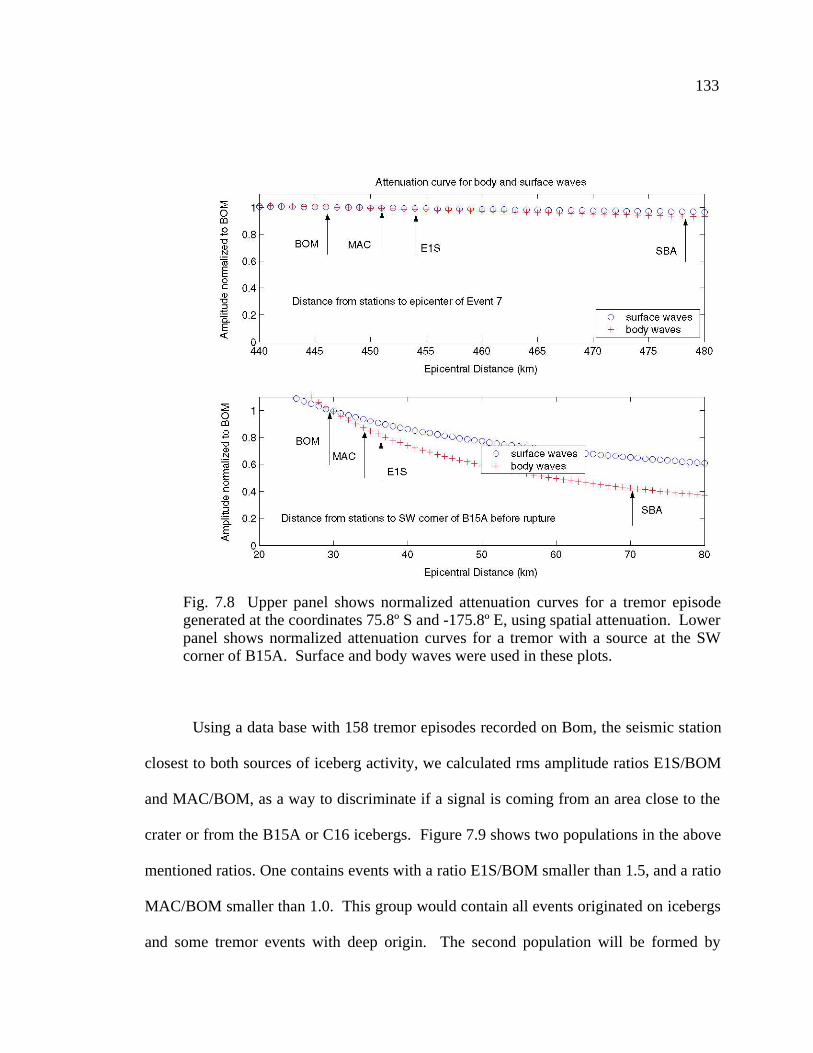
133
Fig. 7.8 Upper panel shows normalized attenuation curves for a tremor episodegenerated at the coordinates 75.8º S and -175.8º E, using spatial attenuation. Lowerpanel shows normalized attenuation curves for a tremor with a source at the SWcorner of B15A. Surface and body waves were used in these plots.
Using a data base with 158 tremor episodes recorded on Bom, the seismic station
closest to both sources of iceberg activity, we calculated rms amplitude ratios E1S/BOM
and MAC/BOM, as a way to discriminate if a signal is coming from an area close to the
crater or from the B15A or C16 icebergs. Figure 7.9 shows two populations in the above
mentioned ratios. One contains events with a ratio E1S/BOM smaller than 1.5, and a ratio
MAC/BOM smaller than 1.0. This group would contain all events originated on icebergs
and some tremor events with deep origin. The second population will be formed by
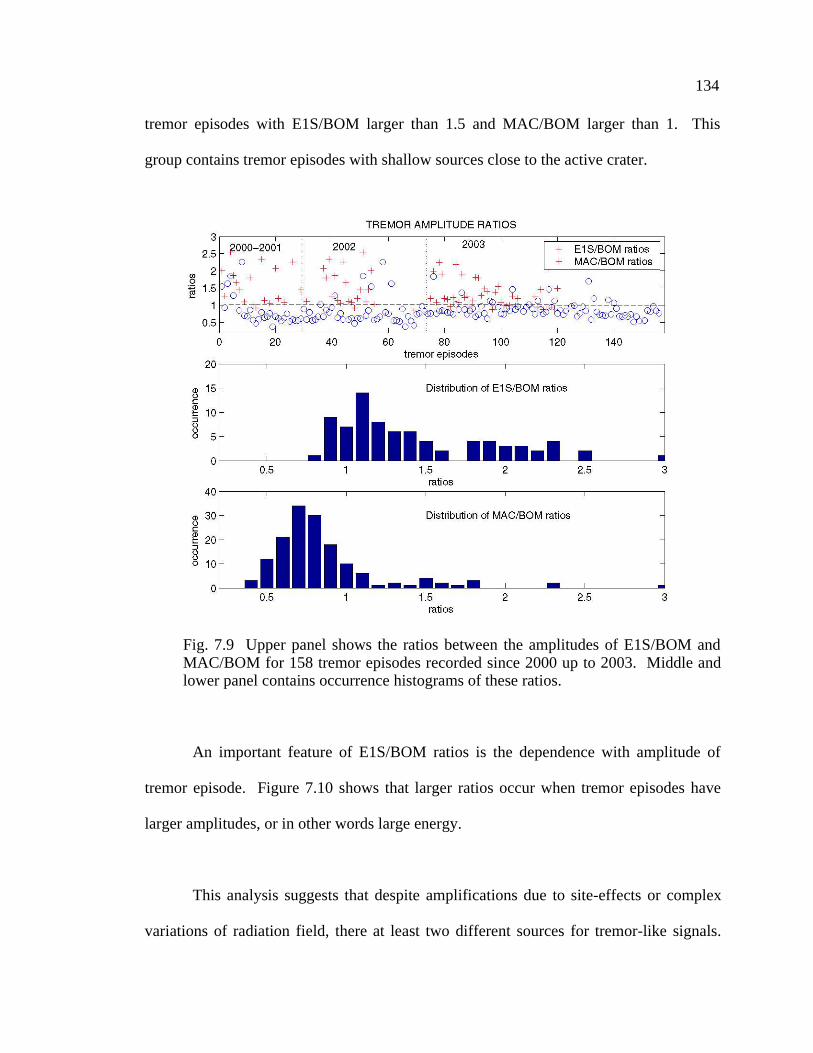
134
tremor episodes with E1S/BOM larger than 1.5 and MAC/BOM larger than 1. This
group contains tremor episodes with shallow sources close to the active crater.
Fig. 7.9 Upper panel shows the ratios between the amplitudes of E1S/BOM andMAC/BOM for 158 tremor episodes recorded since 2000 up to 2003. Middle andlower panel contains occurrence histograms of these ratios.
An important feature of E1S/BOM ratios is the dependence with amplitude of
tremor episode. Figure 7.10 shows that larger ratios occur when tremor episodes have
larger amplitudes, or in other words large energy.
This analysis suggests that despite amplifications due to site-effects or complex
variations of radiation field, there at least two different sources for tremor-like signals.

135
One group of tremor signals, which may be related to magmatic process of Erebus
volcano, shows large energy releases and large E1S/BOM amplitude ratios. The second
group, composed by a larger number of small amplitude signals and small E1S/BOM
ratios, possibly has an origin related to the activity of nearby icebergs.
Fig. 7.10 Distribution of E1S/BOM amplitude ratios of tremor episodes withrespect to the amplitude of the episode. Least mean squares and maximumlikelihood regressions were calculated, showing that larger E1S/BOM areassociated to large events.
136
8. CONCLUSIONS
From June 2000 till July 2003, 322 distinct episodes of tremor activity have been
recorded in three extended periods by the Mt. Erebus Volcano Observatory seismic
network. The first period of activity was characterized by episodes with short duration
(mean=31 min.) and small amplitudes (vmax = 48.6 µm/s, DR= 52.4 cm2 in Feb. 03,
2001). The second period contains the largest amplitudes, reaching a maximum ground
velocity of 97.8 µm/s at 0.7 km from the crater on May 21, 2002 (with a reduced
displacement of 92.6 cm2). The third period of activity lasted from January to July 2003,
and had the maximum velocity (83.4 µm/s). These signals are exceptionally energetic,
some of them reaching values of 2.9x10¹⁰ N if the source is represented by a point force,
or 2.8x10¹⁴ Nm (Mw>3.6) if the source mechanism is represented by a double couple.
Based on spectral characteristics these events are classified in three categories:
harmonic (91%), chaotic (6%) and rapid-fire (3%). However, limits between these event
types are not distinct because almost half of the harmonic episodes have also a chaotic
component. Harmonic tremor episodes may exhibit one or up to 51 overtones in the
signal spectrum. Harmonic components may have constant frequencies or undergo both
gradual gliding that in just few minutes could reach 160% of frequency variation with
respect to the initial frequency. In general, fundamental frequencies are confined to the
1-3 Hz band.

137
The wide distribution of fundamental frequency, amplitudes, and duration as well
as the different source locations suggest that tremor at Erebus, has no a simple, steady
source. Maybe we should considerer that tremor activity at Erebus is caused by different
sources, each of them able to produce different waveforms based on slight variations of
the same mechanism.
Four location methods were considered for locating Erebus tremors using a grid-
search of 50x50x90 points containing the lower and upper flanks of Erebus. The most
simple method for locating non impulsive tremor signals, is based in the distribution of
tremor amplitudes (rms of band-pass filtered tremor signals) and the depth estimation is
based on fitting the observed amplitude ratio with amplitude ratios assuming a 1/r
geometric spreading. In general this method helps to constrain the area and depth range
of the tremor source.
A method based on cross-correlation of signal envelopes offers very stable
epicentral solutions, however depth solutions are usually larger than depths found by
other methods. This method has also problems when the signal has a spectrum formed by
narrow peaks which concentrate most of the energy.
Although the cross-correlation of spectrograms offered good solutions for
locating a synthetic event, its application on real data was unstable. There were also
problems when the tremor signal did not show gliding effect nor when the tremor had a

138
chaotic behavior.
The semblance method showed some instabilities in the epicentral determination,
especially in poor depth determination, however the median value of partial solutions
was a very stable approach. Solutions remain in the same area even if the number of
stations varied or if a different filter was applied.
Applying the semblance method on 26 tremor episodes recorded at Erebus
between Sep. 2000 throughout Apr. 2003, at least three possible source regions were
identified based on differences on location of the median of epicenters and orientation of
error ellipses. All location data support the presence of a complex system of tremor
sources beneath the crater and flanks of Erebus at several kilometers (4-7 km) depth
below the summit, instead of a single source several kilometers long.
Location of sources, several kms below the summit, puts important constrains in
the tremor generation models:
no direct relation is observed between tremor and surface activity at Erebus crater. In
contrast to other volcanoes with an open crater as Masaya or Kilauea that exhibit
permanent degassing of lava fountaining, tremor at Erebus seems to be related to deep
process.
methods based on fluid-driven resonance of cracks need fluids with low velocities of
propagation which are obtained with an increasing amount of free-volatiles in the

139
fluid.
Location of tremor episodes -several kilometers beneath the crater or flanks- favors a
method based on generation of oscillations due to instabilities in mass transport.
Julian general oscillator model (Julian, 1994), based on a non-linear model of
generation of oscillations caused by transient disturbances in channel geometry when
magma is transported through a constriction, seems to be the more suitable for Erebus
tremor episodes. This model offers a general explanation for most characteristic patterns
observed at Erebus:
• generation of submultiples of oscillation modes (doubling-period cascade effect)
• abrupt changes of the tremor character (between highly harmonic to chaotic) even
in the same event.
• absence of high-frequency content.
• sustained character (tremor has been repeatedly produced for more than 3 years,
with more than 300 episodes, some of them with durations of five hours) favors a
non-destructive but self-modifying process of tremor generation
On the other hand, data recorded on seismic stations at Polynesia and Antarctica
show that tremor-type signals can be originated by iceberg break-ups, collisions, or
friction against the sea floor. Few of the signals presented in Talandier et al. (2002) have
been recorded on Erebus stations. This fact opens the possibility that some tremor
episodes may have an origin related to iceberg activity. This hypothesis is supported by

140
the large amplitudes recorded at station BOM, located on the eastern flank, by the high
energy of some episodes, and by the coincidence between the onset of the tremor activity
and the history of iceberg formation since 2000. However, the bulk of tremor episodes
recorded in 2000-2003 may have a volcanic origin as was demonstrated by the locations
of all 26 episodes with a known location and by high E1S/BOM amplitude ratios. More
data (currently being acquired using seismic and GPS stations on icebergs) will provide
important future clues to constraining tremor and tremor like-signal sources from
icebergs.
I have some recommendations for further work. These include:
A detailed review of seismic records before 1999 may reveal more small tremor
episodes that are not noticed in previous studies.
A vector summation of the three components of broadband stations will help to better
reconstruct energy release curves. These composed signals will allow new isoseismals
curves and new seismic envelopes.
Particle motions of tremor signals, especially around the fundamental frequency could
offer an independent method for locating the source of these events and also for
discovering the wave types that are forming the tremor wavefield.
Seismic instrumentation on Erebus should be increased, especially with restoration of
141
seismic stations on the NNE flank (FNG), SE flank (ICE) and SW flank (SIS). These
stations will cover flank areas that may have been hosting tremor epicenters and they
will provide better coverage for more precise locations. These stations will be very
valuable for any of the location methods described above.
Strengthening ongoing collaboration with iceberg researchers, incorporating on-berg
seismometer and GPS deployments, and other observations, will provide important clues
to greatly clarify the relationship between tremor signals in the Ross Island region and
iceberg activity.
REFERENCES Aki K., Fehler M., Das S., 1977. Source Mechanism of Volcanic Tremor: Fluid driven crack models and their application to the 1963 Kilauea eruption. J. Volcanol. Geotherm. Res., v. 2, 259-287. Aki K., Koyanagi R.Y., 1981. Deep volcanic tremor and magma ascent mechanism under Kilauea, Hawaii. J. Geophys. Res., v.87, 7095-7109. Aki K. and Richards P.G., 1980. Quantitative Seismology, W.H. Freeman and Co., San Francisco, 920 p. Almendros J., Chouet B., Dawson P., Bond T., 2002. Identifying elements of a plumbing system beneath Kilauea Volcano, Hawaii, from the source location of very-long-period signals. Geophys. J. Int., 148, 303-312. Alparone S., Andronico D., Lodato L., and Sgroi T., 2003. Relationship between tremor and volcanic activity during the Southeast Crater eruption on Mount Etna in early 2000, J. Geophys. Res., 108, B5 , doi: 10.1029/2002JB001866. Arciniega-Ceballos A., Chouet B., Dawson P., 2003. Long-period events and tremor at Popocatepelt and their broadband charactesistics. Bull. Volcanol., 65, 124-135. Aster R., Mah S., Kyle P., McIntosh W., Dunbar N., Johnson J., Ruiz M., McNamara S., 2003 a. Very Long Period Oscillations of Mount Erebus Volcano. J. Geophys. Res., accepted for publication. Aster R. A., Bartel B., Dunbar N., Esser R., Johns B., Johnson J., Karstens R., Kurnik C., Kyle P., McGowan R., McIntosh W., McNamara S., Meertens C., Pauli B., Richmond M., Ruiz M., 2003 b. New Instrumentation Delivers Multidisciplinary Real-time Data From Mount Erebus, Antarctica. EOS, accepted for publication. Barberi F., Bertagnini A., Landi P., Principe C., 1992. A review on Phreatic Eruptions and their precursors. J, Vol. Geotherm. Res., 52, 4, 231-246. Bartel B., Kyle P.R. Desmarais E., Meertens C., Kurnik C., Johns B., 2003. Campaign and Continuos GPS Measurements of Deformation at Mt. Erebus. Poster. Battaglia J., Ferrazzini V., Okubo P., 2001. Location of Tremor and Long-Period Events Using Seismic Amplitudes . Poster AGU 2001 Fall Meeting, San Francisco. Benoit J.P., McNutt S.R., 1997. New constrains on source process of volcanic tremor at Arenal Volcano, Costa Rica, using broad band seismic data. Geophys. Res. Lett., v. 24 (4), 449-452. Behrendt, J.C., 1999. Crustal and lithospheric structure of the West Antarctica Rift System from geophysical investigations: A review. Global Planet. Change, 23, 25-44. Chouet B., 1981. Ground motion in the near field of a fluid-driven crackand its interpretation in the study of shallow volcanic tremor , J. Geophys. Res., 86, 5985-6016.
Chouet B., 1986. Dynamics of a fluid-driven crack in three dimentions by the finite difference method., J. Geophys. Res., 91, 13967-13992. Chouet B.A, 1988 Resonance of a fluid-driven crack: radiation properties and implications for the source of long-period and harmonic tremor. J. Geophys. Res., 93, 4375-4400. Chouet B., 1992. A seismic model for the source of long-period events and harmonic tremor, in Volcanic Seismology, edited by P. Gasparini, R. Scarpa, and K. Aki, Springer-Verlag, 133-156. Chouet B., 1996. Long-period volcano seismicity: Its source and use in eruption forecasting, Nature, 380, 309-316. Crosson R. S., Bame D.A., 1985. A spherical source model for low frequency volcanic earthquakes, J. Geophys. Res., 90, 10237-10247. Davidson C., 1927. The Founders of Seismology, Cambridge at the University Press, 240 p. Dibble R.R., 1994. Velocity modeling in the erupting magma column of Mount Erebus, Antarctica Dibble R.R., Kienle J., Kyle P.R., and Shibuya K., 1984. Geophysical studies of Erebus volcano, Antarctica, from 1974 December to 1982 January, New Zealand Journal of Geology and Geophysics, 27, 425-455. Antarctica Research Series, American Geophysical Union, v. 66, 17. Dibble R.R., Barret S., Kaminuma K., Miura S., Kienle J., Rowe C., Kyle P., McIntosh W., 1988. Time Comparisons Between Video and Seismic Signals from Explosions in the Lava Lake of Erebus Volcano, Antarctica, Bull. Dis. Prev. Res. Inst. , Kyoto Univ., 38, 147-161. Dibble R.R., O'Brien B., Rowe C.A., 1994. The velocity structure of Mount Erebus, Antarctica and its Lava Lake. Volcanological and Environmental Studies of Mount Erebus, Antarctica. Antarctica Research Series, American Geophysical Union, v. 66, 1-16. Dvorak J.J. and Okamura A. T., 1985. Variations in tilt rates and harmonic tremor amplitude during the January -August 1983 East Rift eruption of Kilauea, volcano, Hawaii. J. Volcanol Geotherm Research, 25-249-258 Ferrazini V., Aki K., 1987. Slow waves trapped in a fluid filled infinite crack: Implication for volcanic tremor. J. Geophys. Res., v. 92, 9,215-9,223. Fremont M.J. and Malone S.D., 1987. High-precision relative locations of Earthquakes at Mount St-Helens, Washington. J. Geophys. Res., 92,B10, 10223-10236. Fujita E., Ida Y., 1999. Low attenuation resonance of a spherical magma chamber: Source mechanism of monotonic volcanic tremor at Asama Volcano, Japan. Geophys. Res. Lett., v. 26, 3221-3224. Furomoto M., Kunimoto T., Inoue H., Yamada I/. Yamaoka K., Akami A., Fukao Y., 1990. Twin sources of high frequency volcanic tremor of Izu-Oshima volcano, Japan. Geophys. Res. Lett. 17, 25-27.

Furamoto M., Kunimoto T., Inoue H., Yamaoka K., 1992. Seismic image of the volcanic tremor source at Izu-Oshima volcano, Japan. In: Gasparini P., Scarpa R., Aki K., (Eds.). Volcanic Seismology. IAVCEI Proc. Volcanol. 3, 201-211. Garces M.A., Hagerty M.T., Schwartz S.Y., 1998. Theory of the airborne sound field generated in a resonant magma conduit. J. Vol. Geotherm. Res., 78, 155-178. Gil-Cruz F., Chouet B., 1997. Long-period events, the most characteristic seismicity accompanying the emplacement and extrusion of a lava dome in Galeras Volcano, Colombia, in 1991. J. Volcanol. Geotherm. Res., 77, 121-158. Gordeev E., 1992. Modelling of volcanic tremor wavefields. J. Vol. Geotherm. Res., 51, 145-160. Gordeev E., 1993. Modeling of volcanic tremor as explosive point sources in a single-layered, elastic half-space. J Geophys. Res., 98, 19687-19703. Gottschammer E., and Surono I., 2000. Locating tremor and shock sources recorded at Bromo volcano. J. Volcanol. Geotherm. Res., 40, 89-101. Hagerty M.T., Schwartz S.Y., Garces M.A., Protti M., 2000. Analysis of seismic and acoustic observations at Arenal Volcan, Costa Rica, 1995-1997, J. Volcanol. Geotherm. Res. 101, 27-65. Hatherton T., 1961. A note on the seismicity of the Ross Sea region. Geophysical J. of the Royal Astron. Soc., 5, 252-253. Hellweg M., 2000. Volcanic Tremor and Physical Source Models: Lascar Volcano, Chile. Thesis for Doctor in Narural Sciences, Universitat Stuttgart, 131 p. Hofstetter A.S., and Malone S.D., 1986. Observations of volcanic tremor at Mt. St Helens in April and May 1980. Bull. Seismol. Soc. Am. 76, 923-938. Jakosky, J.J., 1950. Exploration Geophysics, Trija Publishing Co. 1195 p. Johnson J.B., Lees J.M., Gordeev E.I., 1998. Degassing explosions at Karymsky Volcano, Kamchatka. Geophys. Res. Lett., 25(21), 3999-4042. Johnson J.B., Aster R.C., Ruiz M.C., Malone S.D., McChesney P.J., Lees J.M., Kyle P.R., 2003. Interpretation and utility of infrasonic records from erupting volcanoes. J. Volcanol. Geotherm. Res. 121, 15-63. Johnson J.B., Lees J.M., 2000. Plugs and chugs - seismic and acoustic observations of degassing explosions at Karimsky, Russia and Sangay, Ecuador. J. Volcanol. Geotherm. Res. 101, 67-82. Jolly A.D., Jousser P.G.M., Neuberg J., Thompson, G.E. Norton, 2001. Locating pyroclastic flows on Soufriere Hills Volcano, Monserrate, West Indies, using amplitudes signals from high dynamic range instruments. Poster at 2001 AGU Fall Meeting. Julian B.R., 1994. Volcanic Tremor: Nonlinear excitation by fluid flow. J. Geophys. Res., 99, 11,859-11,877.

Julian B.R., 2000. Period doubling and other nonlinear phenomena in volcanic earthquakes and tremor. J. Volcanol. Geotherm. Res. 101, 19-26. Kaminuma K., 1994. The Seismic activity of Mt. Erebus in 1981-1990, Antarctica Research Series, 66, 35-50. Kanamori, H., 1977. The energy released by great earthquakes. J. Geophys. Res., 82, 2981-2987. Kanamori, H., 1993. Locating earthquakes with amplitude: Application to Real-Time, BSSA, Feb., 264-268 Kawakatsu H., Kaneshima S., Matsubatashi H., Ohminato T., Sudo Y., Tsutsui T., Uhira K., Yamasato H., Legrand D., 2000. Aso94: Aso seismic observation with broad band instruments. J. Volcanol. Geotherm. Res. 1001, 129-154. Kieffer S., 1984. Seismicity of Old Faithful geyser:An isolated source of geothermal noise and possible analogue of volcanic seismicity. J. Volcanol. Geotherm. Res., 22, 59-95. Kienle J., Marshall D.L., Estes S.A., Dibble R.R., Shibuya K., Kyle P.R., 1982. Seismicity of Mount Erebus, 1981-1982. Antarc. J. US 17, 5, 29-31. Kienle J., Rowe C.A., Kyle P.R., McIntosh W.C., Dibble P.R., 1985. Eruption of Mount Erebus and Ross Island seismicity, 1984-1985. Antarct. J. U.S., 20(5), 25-28. Knight R., 1996. Seismicity of Mt.Erebus, Antarctica, Recorded Digitally from November 12, 1994 to July 31, 1996. Independent Study for the degree Master of Sciencein Geophysics. 167 p. Knight R., Dibble P.R., Aster R.C., Kyle P.R., Ameko A.K., 1996. Digital recording of the Seismicity of Mount Erebus Volcano, November 1994-June 1996. Antarct. J. US 31, 2, 41-43. Konstantinou K.I. and Schlindwein V., 2002. Nature, wavefield properties and source mechanism of volcanic tremor: a review. J. Volcanol. Geotherm. Res. 119, 161-187. Kubotera A., 1974. Volcanic tremors at Aso volcano. In Civetta L., Gasparini P., Luongo G., and Rapolla A. (eds), Physical Volcanology, Elsevier, 29-47. Kumagai H., Miyakawa K., Negishi H., Inoue H., Obara K., Suetsugu D., 2003. Magma Dike Resonances infered from Very-Long-Period Seismic Signals, Science, 299, 2058-2060. Kyle, 1986, Volcanic activity of Mount Erebus, Antarctica: 1972-1984. International Volcanological Congress, Auckland-Hamilton-Rotorua, New Zealand, February 1-9, 1986, Abstracts, 250. Kyle P. R., and J.W. Cole, 1974. Structural Control of Volcanism in the McMurdo Volcanic Group, Antarctica. Bull. Volcanol., 38, 16-25. Kyle P.R., Dibble R.R., Giggenbach W.F., and Keys J.R., 1982. Volcanic activity associated with the anorthoclase phonolite lava lake, Mount Erebus, Antarctica. In: C. Cardiac (ed.), Antarctic

Geosciences., Symposium on Antarctic Geology and Geophysics, Madison, Wisconsin, August, 1977, 735-745. Kyle P.R., Moore J.A, Thirlwall M.F., 1992. Petrologic evolution of anorthoclase phonolite lavas at Mt. Erebus, Ross Island, Antarctica, Journal of Petrology, 33:4, 849-875. Kyle P.R., Sybeldon L.M., McIntosh W.C., Meeker K., Symonds R., 1994. Sulphur dioxide emission rates from Mount Erebus, Antarctica, in P. Kyle (ed.), Volcanological and Environmental Studies of Mount Erebus, Antarctica. Antarctica Research Series, American Geophysical Union, v. 66, 69-82. Kyle P.R., Marteens C., Johns B, Desmarais E., Kurnik C., Aster R.C., 2001. The Mount Erebus GPS array: In search of volcanic deformation. In T.J. Wilson (Ed.), Antarctica Neotectonics Workshop, Terra Antarctica, Siena, Italy. Leet R.C., 1988. Sarurated and subcooled hydrothermal boiling in groundwater flow channels as a source of harmonic tremor. J. Geophys. Res., 93, 4835-4849. Legrand D., Kaneshima S., Kawakatsu H., 2000. Moment tensor analysis of near-field broadband waveforms observed at Aso Volcano, Japan. J. Volcanol. Geotherm. Res., 101, 155-169. Lesage P. and Surono, 1995. Seismic Precursors of the February 10, 1990 Eruption of Kelut Volcano, Java. J. Vol. Goeothm. Res., 65, 1-2,135-146. Martinelli B., 1990. Analysis of seismic patterns observed at Nevado del Ruiz volcano, Colombia, during August-September 1985. J. Volcanol. Geotherm. Res., 41, 297-314. McGinnis L.D., Bowen R.H., Erikson J.M., Allred B.J., Kreamer J.L., 1985. East-West Antarctic boundary in McMurdo Sound, Tectonophysics, 114, 341-356. McNutt S. R., 1994. Volcanic tremor from around the world: 1992 update. Acta Vulcanologica, v. 5, 197-200. McNutt S. R., 1992. Volcanic tremor. Encyclopedia of Earth System Science, Volume 4, Ed. Academic Press, 417-425. McNutt S. R., 2000. Volcanic seismicity. Encyclopedia of Volcanoes. Ed. Academic Press, 1015-1033. Morrissey M.M., Chouet B.A., 1997. A numerical investigation of choked flow dynamics and its application to the triggering mechanism of long-period events at Redoubt volcano, Alaska. J. Geophys. Res., 102, 7965-7983. Neidel N. and Taner M.T., 1971. Semblance and other coherency measures for multichannel data. Geophysics 36, 483-497. Neuberg J., O'Gorman C., 2002. A model of the seismic wavefield in gas-charged magma: apllication to Soufriere Hills Volcano, Monserrate, In Druitt T., and Kokelaar, The Eruption of Soufriere Hills Volcano., Monserrate, from 1995 to 1999. Geological Society of London Memoirs, 21,603 -609.

Newhall and Dzurisin, 1988. Historical Unrest of Large Calderas of the World: US Geological Survey Bulletin 1855, 1108 p. Poupinet G., Frechet J., Ellsworth W.L., Fremont M.J., Glangeaud F., 1985. Doublet Analysis - Improved Accuracy for Earthquake Prediction Studies. Earthquake Prediction Research, v.3, no.2, 147-159. Ripepe M., Coltelli M., Privitera E., Gresta S., Moretti M., Piccinini D., 2001. Seismic and infrasonic evidence of the shallow volcanic tremor at Mt. Etna, Italy. Geophys. Res. Lett., 28, N.- 6, 1071-1074. Rowe C. A., and Kienle J., 1986. Seismicity in the vecinity of Ross Island, Antarctica, J. Geodyn., 6, 375-385. Rowe, C., 1988. Seismic Velocity Structure and Seismicity of Mount Erebus Volcano, Ross Island, Antarctica. Thesis for Master of Science. University of Alaska, 156 p. Rowe C.A., Aster R.C., Kyle P.R., Schlue J.R., Dibble R.R., 1998. Broadband recording of Strombolian explosions and associated very-long-period seismic signals on Mount Erebus volcano, Ross Island, Antarctic. Geophys. Res. Lett., 25, 13, 2297-2300. Rowe C.A., Aster R.C., Kyle P.R., Dibble R.R., 2000. Seismic and acoustic observations at Mount Erebus Volcano. J. Volcanol. Geotherm. Res., 105-128. Ruiz M.C., Aster R.C., Mah S., Kyle P.R., 2002. Recent Tremor Activity on Mount Erebus, Antarctica. Poster at 2002 Seismological Society of America Meeting. Victoria, Canada. Saccorotti G., Chouet B., Dawson P., 2001. Wavefield properties of a shallow long-period event and tremor at Kilauea Volcano, Hawaii. J. Volcanol. Geotherm. Res., 109, 163-189. Sassa K., 1935. Volcanic microtremor and eruption earthquakes. Mem. Coll. Sci. Kyoto Univ. ,18, 255-293. SchickR., 1981. Source Mechanism of volcanic tremor. Bull. Volcanol., 44-3,491-497. Schlindwein V., Wasserman J., Scherbaum F., 1995. Spectral analysis of harmonic signals from Mt. Semeru, Indonesia, Geophys. Res. Lett., 22, 1685-1688. Seidl D., Schick R., and Riuscetti M., 1981. Volcanic tremors at Etna: A model for hydraulic origin. Bull. Volcanol. 44, 43-56. Sheriff R.E, Geldart L.P., 1995. Exploration Seismology, 2nd. Edition, Cambridge Press, 592 p. Shibuya K., Baba M., Kienle J., Dibble R. R. Kyle P.R., 1983. Study of seismic and volcanic activity of Mount Erebus, Antarctica, 1981-82, in Proceedings of 3rd Symposium on Antarctic Geoscience, Mem. Natl. Inst. Polar Res. Tokyo Spec. Issue, 28, 54-66, 1983. Swanson D.A., Duffield W.A., Jackson D.B., Peterson D.W., 1979. Chronological narrative of the 1969-71 Mauna - Ulu eruption, Kilauea volcano, Hawaii, US Geol. Surv. Prof. Pap. 1056, 1-

55. Talandier J., Hyvernaud O., Okal E., Piserchia P.F., 2002. Long-range detection of hydroacoustic signals from large icebergs in the Ross Sea, Antarctica. Earth Planet. Sci. Lett., 203, 519-534. Thompson G., McNutt S., Tytgat G., 2002. Three disctint regimes of volcanic tremor associated with the eruption of Shishaldin volcano, Alaska 1999. Bull. Volcanol., 64, 534-547. Ueki S., Kaminuma K., M. Baba, E. Koyama, J. Kienle, 1984. Seismic Activity of Mount Erebus, Antarctica in 1982-1983. In: Nagata T (Ed.), Proceedings of the Fourth Symposium on Antarctic Geoscience, Tokyo, Japan, October 1982. Memoirs of the Institute of Polar Research, Special Issue 33, p. 29-40. Yamamoto M., Kawakatsu H., Yomogida K., and Koyama J., 2002. Long Period (12 sec) volcanic tremor observed at Usu 2000 eruption: Seismological detection of a deep magma plumbing system. Geophys. Res. Lett., v. 29, No. 9, 1, 43-1, 43-4. Villagomez D.R., Ruiz M.R., Yepes H., Hall M.L., 2003. Precursory Activity at Guagua Pichincha Volcano, Ecuador: Implications for the Magmatic System of an Arc Volcano. EOS Trans., AGU, 84(46) Wallace P., Anderson A.T. , 2000. Volatiles in magmas, in Sigurdsson H., (ed.) Encyclopedia of Volcanoes, Academic Press, 149-170. Wardell J.L., 2002. Volcanic Carbon Dioxide and Trace metal emissions from Mt. Erebus, Antarctica and White Island, New Zealand: Contribution and Implicationsto Global Atmospheric Budgets. PhD Thesis. Earth and Environmenatl Sciences, New Mexico Tech, 140 p. Wardell L.J., Kyle P.R, Counce D., (year) Volcanic emissions of metals and halogens from White Island, New Zealand and Mt. Erebus, Antarctica, D1-D30. In Wardell J.L., 2002. Wassermann J., Ohrnberger M., 2001. Automatic hypocenter determination de volcano induced seismic transients based on wavefield coherence - an application to the 1998 eruption of Mt. Merapi, Indonesia. J. Volcanol. Geotherm. Res., 110, 57-77. Williams-Jones G., Stix J., Heiligmann M., Barquero J., Fernandez E., Gonzalez E.D., 2001. A model of degassing and seismicity at Arenal Volcano, Costa Rica. J. Volcanol. Geotherm. Res., 108, 121-139. WUSTL Seismology Group, 2003. Trans-Antarctic Mountains Seismic Experiment (TAMSEIS). Group of Seismology, Department of Earth and Planetary Sciences, Washington University. Url: http://epsc.wustl.edu/seismology/TAMSEIS. Zreda-Gostynska G., Kyle P., Finnegan D., Meeker Prestbo K., 1997. Volcanic gas emissions from Mount Erebus and treir impact on the Antarctic environment. J. Geophys. Res., 102, 15039-15055