Embed Size (px)
Citation preview

Number 4, Volume IX, December 2014
Váňová, Voženílek: Analysis of traffic Capacity using ArgGIS Network Analyst 129
ANALYSIS OF TRAFFIC CAPACITY USING ARCGIS NETWORK ANALYST
Lucie Váňová1, Vít Voženílek2
Abstract: The article is devoted to the analysis of the road capacity through the town Přerov. The program ArcGIS Network Analyst is used for performing the analysis. The results, gained by using this program, were compared with the real figures of the road capacity at the selected routes. The aim is to find the real road capacity through the town Přerov and assess the condition of road transport and get a tool for assessment of various suggested modifications of traffic system ready.
Key words: analysis, road capacity, road network.
INTRODUCTION
In the article the analysis of the road capacity through the town is carried out. Přerov is picked as the representative town. This task is solved with the use of the program ArcGIS Network Analyst made by the company Esri.
1. ROAD CAPACITY THROUGH THE TOWN PŘEROV
The aim of this article is to find the road capacity through the town Přerov. Main routes are chosen for the analysis as the respresentatives. First, the analysis of road capacity through the town Přerov is performed, using the program Network Analyst. Thereafter, the real transfer time of the representative routes is measured, using a car. The measurement is made on the basis of appropriately chosen time intervals. In the last part of the article the comparison of the analysis results is carried out.
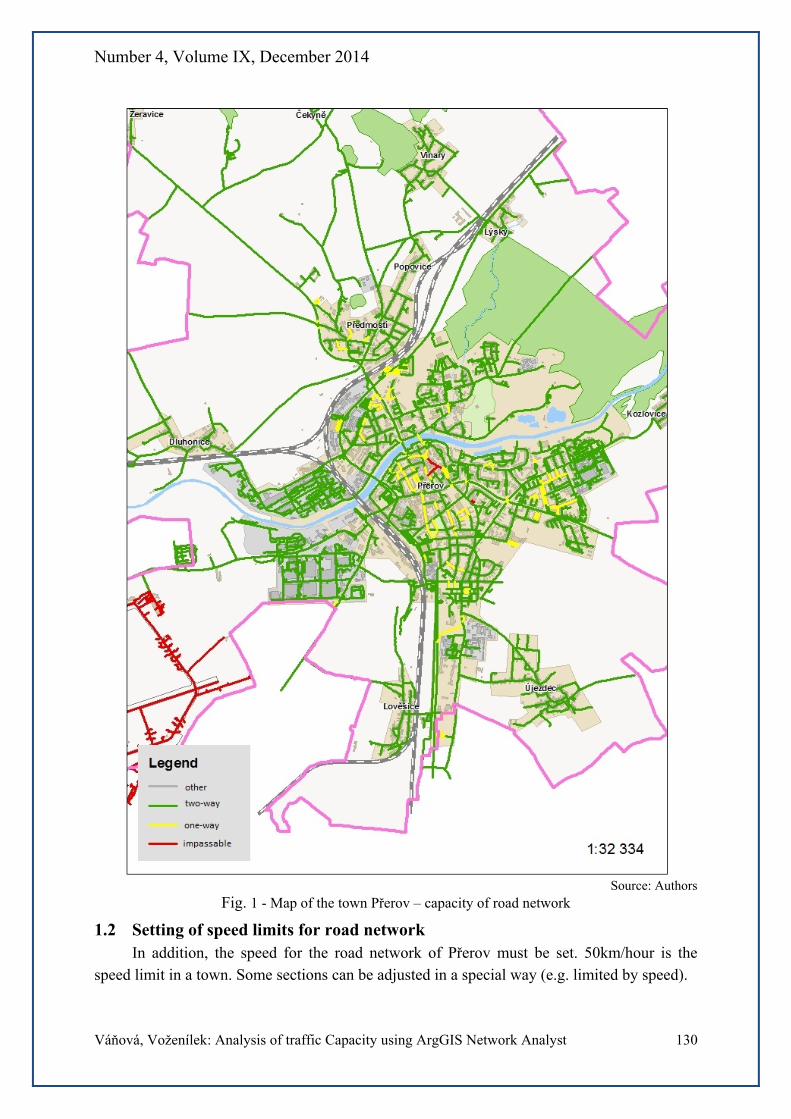
1.1 Topological evaluation of road network If one makes an analysis, it is necessary to get required data. This task is based on the
Přerov road network. First off all, the road network must be evaluated topologically, which means that one-way, two-way or impassable direction have to be defined in every section. The topological evaluation of the road network in the town Přerov is performed with the use of the program Network Analyst. The capacity of Přerov road network is depicted in the figure 1.
1 Ing. Lucie Váňová, MBA, Czech Technical University in Prague, Faculty of Transportation Sciences,
Konviktská 20, 111 00 Prague, Czech Republic, E-mail: [email protected] 2 prof. RNDr. Vít Voženílek, CSc., Univerzita Palackého v Olomouci, Přírodověcká fakulta, 17. Listopadu 50, 771 46 Olomouc, Czech Republic, E-mail: [email protected]
Number 4, Volume IX, December 2014
Váňová, Voženílek: Analysis of traffic Capacity using ArgGIS Network Analyst 130
Source: Authors
Fig. 1 - Map of the town Přerov – capacity of road network
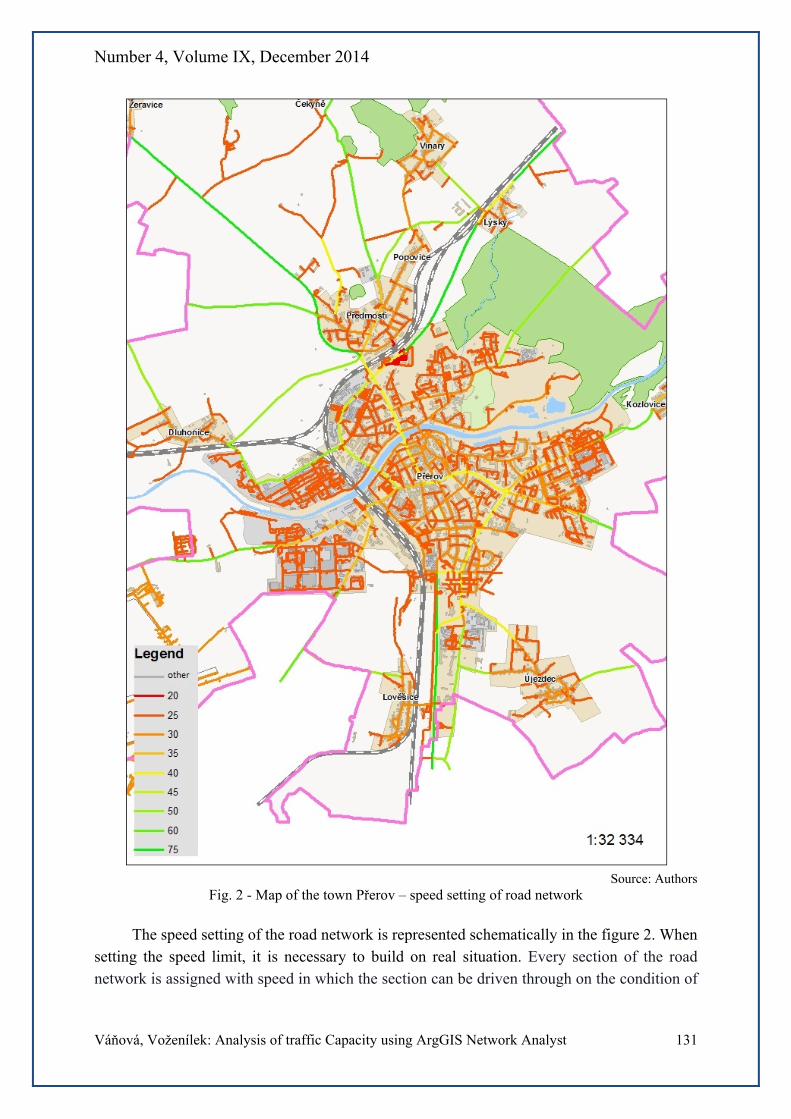
1.2 Setting of speed limits for road network In addition, the speed for the road network of Přerov must be set. 50km/hour is the
speed limit in a town. Some sections can be adjusted in a special way (e.g. limited by speed).
Number 4, Volume IX, December 2014
Váňová, Voženílek: Analysis of traffic Capacity using ArgGIS Network Analyst 131
Source: Authors
Fig. 2 - Map of the town Přerov – speed setting of road network
The speed setting of the road network is represented schematically in the figure 2. When setting the speed limit, it is necessary to build on real situation. Every section of the road network is assigned with speed in which the section can be driven through on the condition of

Number 4, Volume IX, December 2014
Váňová, Voženílek: Analysis of traffic Capacity using ArgGIS Network Analyst 132
flowing traffic and traffic regulation fulfillment. The speed setting is made in ArcCatalog (see figure 3).
Source: Authors
Fig. 3 - ArcCatalog Preview – Speed Setting
Having set the speed, the transfer time must be calculated again, using this mathematical formula:
round([Length]/([Speed]/3.6),1)
In this moment the road network is topologically evaluated and the speed of the road network is set simultaneously. At this stage, main representative routes are to be selected for the capacity measurement.
When having collected the data, the Program Network Analyst is able to calculate which route is optimal from the point 1 to the point 2 when a criterion of optimization is optimal transfer time. Subsequently, the optimal route is driven by a car on Friday in the time between 2pm and 4pm, which is the time when undesirable traffic congestions occur according to the statistics. Based on these data, we find that in this case the extreme is the minimum. The next figure is the average capacity through the town between 7am and 7pm which is acquired from several performed measurements. The last figures were measured in the morning before 6am, and in the evening after 8pm.
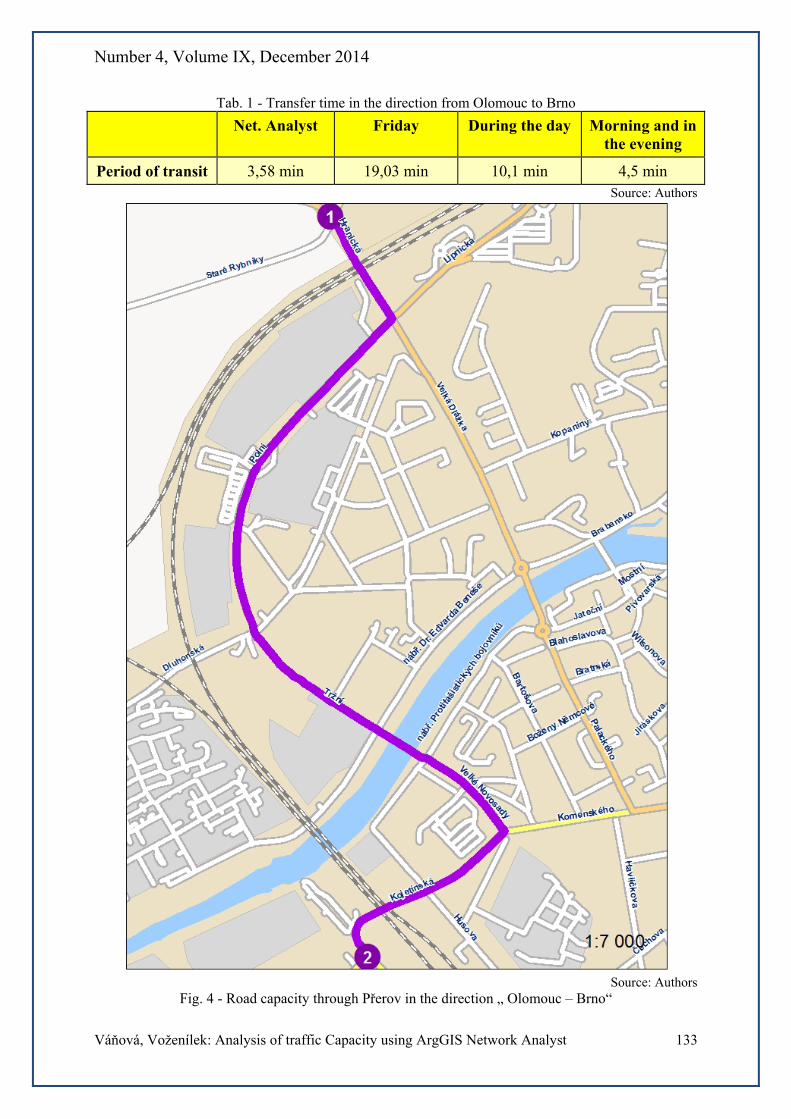
1.3 Transfer time through Přerov in the direction „Olomouc – Brno“ The first representative route will be the route from Olomouc to Brno. First of all, “New
Route” is chosen on a bar of the tool Network Analyst, and the starting point and endpoint are to be set. Then, after having switched the command „Solve“, the calculation process of the optimal route is activated and it is going to be depicted in ArcMap.
The program picked the route Polní, Tržní, Velké Novosady, Tovačovská and Kojetínská as the optimal (see figure 4).
Number 4, Volume IX, December 2014
Váňová, Voženílek: Analysis of traffic Capacity using ArgGIS Network Analyst 133
Tab. 1 - Transfer time in the direction from Olomouc to Brno
Net. Analyst Friday During the day Morning and in the evening
Period of transit 3,58 min 19,03 min 10,1 min 4,5 min Source: Authors
Source: Authors
Fig. 4 - Road capacity through Přerov in the direction „ Olomouc – Brno“
Number 4, Volume IX, December 2014
Váňová, Voženílek: Analysis of traffic Capacity using ArgGIS Network Analyst 134
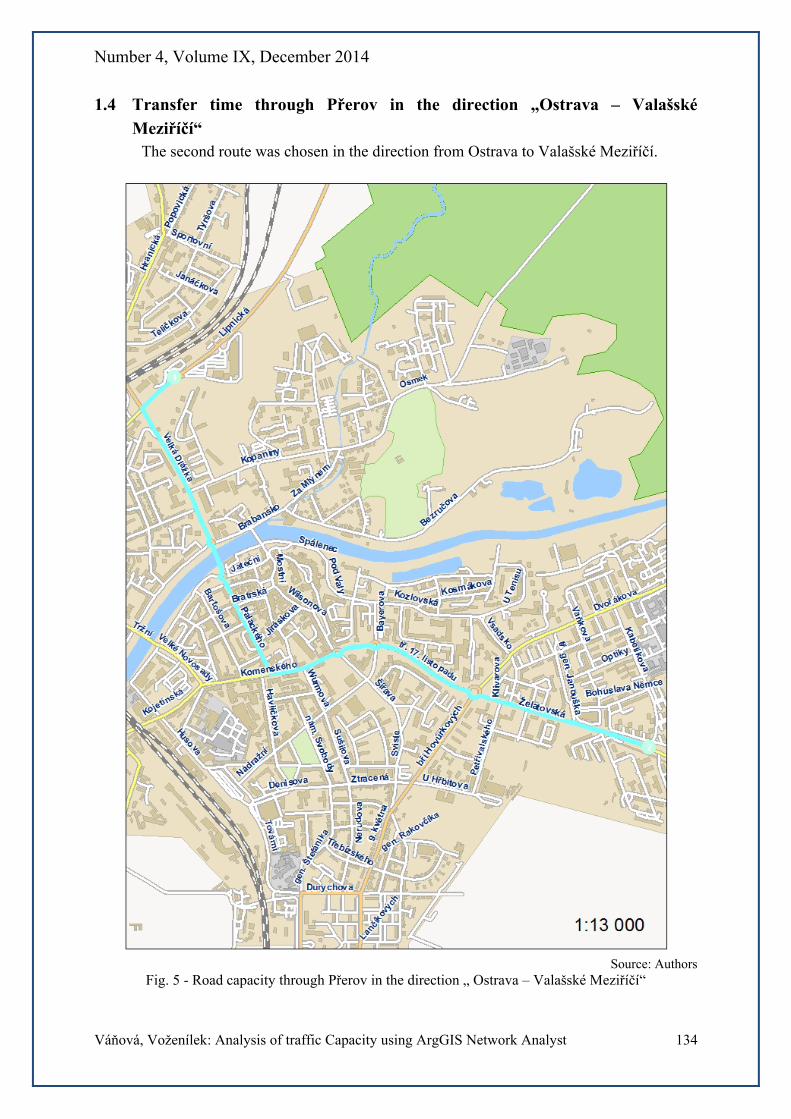
1.4 Transfer time through Přerov in the direction „Ostrava – Valašské Meziříčí“
The second route was chosen in the direction from Ostrava to Valašské Meziříčí.
Source: Authors
Fig. 5 - Road capacity through Přerov in the direction „ Ostrava – Valašské Meziříčí“
Number 4, Volume IX, December 2014
Váňová, Voženílek: Analysis of traffic Capacity using ArgGIS Network Analyst 135
The program found the optimal route which leads across the streets – Lipnická, Velká Dlážka, Palackého, Komenského, tř. 17. Listopadu and Želatovská (see figure 5).
Tab. 2 - Transfer time in the direction from Ostrava to Valašského Meziříčí
Net. Analyst Friday During the day Morning and in the evening
Period of transit 5,38 min 12,8 min 7,8 min 5,6 min Source: Authors
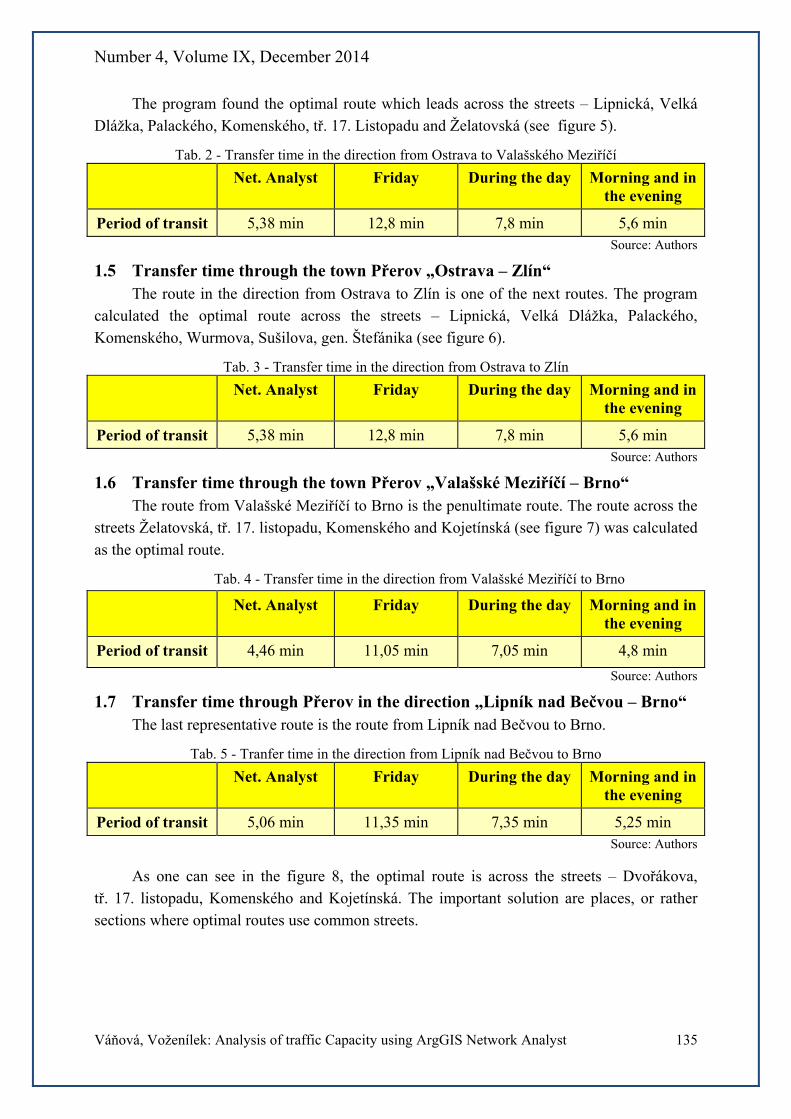
1.5 Transfer time through the town Přerov „Ostrava – Zlín“ The route in the direction from Ostrava to Zlín is one of the next routes. The program
calculated the optimal route across the streets – Lipnická, Velká Dlážka, Palackého, Komenského, Wurmova, Sušilova, gen. Štefánika (see figure 6).
Tab. 3 - Transfer time in the direction from Ostrava to Zlín
Net. Analyst Friday During the day Morning and in the evening
Period of transit 5,38 min 12,8 min 7,8 min 5,6 min Source: Authors
1.6 Transfer time through the town Přerov „Valašské Meziříčí – Brno“ The route from Valašské Meziříčí to Brno is the penultimate route. The route across the
streets Želatovská, tř. 17. listopadu, Komenského and Kojetínská (see figure 7) was calculated as the optimal route.
Tab. 4 - Transfer time in the direction from Valašské Meziříčí to Brno
Net. Analyst Friday During the day Morning and in the evening
Period of transit 4,46 min 11,05 min 7,05 min 4,8 min
Source: Authors
1.7 Transfer time through Přerov in the direction „Lipník nad Bečvou – Brno“ The last representative route is the route from Lipník nad Bečvou to Brno.
Tab. 5 - Tranfer time in the direction from Lipník nad Bečvou to Brno
Net. Analyst Friday During the day Morning and in the evening
Period of transit 5,06 min 11,35 min 7,35 min 5,25 min Source: Authors
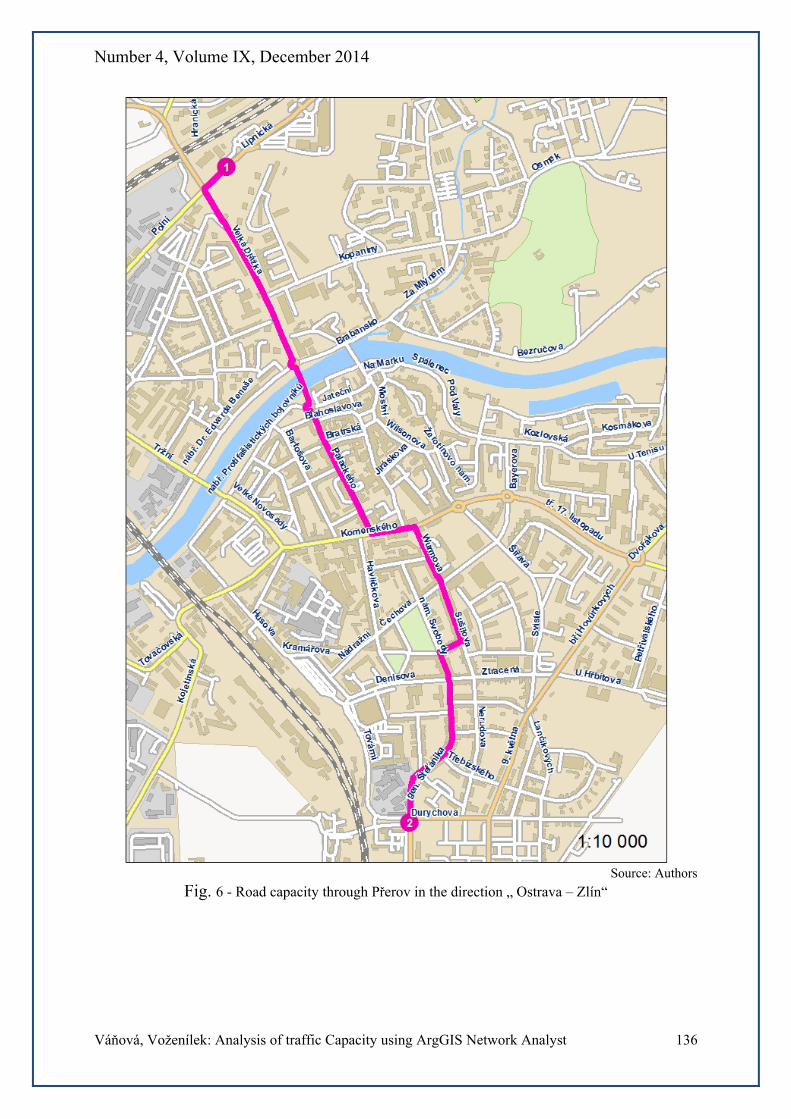
As one can see in the figure 8, the optimal route is across the streets – Dvořákova,
tř. 17. listopadu, Komenského and Kojetínská. The important solution are places, or rather sections where optimal routes use common streets.
Number 4, Volume IX, December 2014
Váňová, Voženílek: Analysis of traffic Capacity using ArgGIS Network Analyst 136
Source: Authors
Fig. 6 - Road capacity through Přerov in the direction „ Ostrava – Zlín“

Number 4, Volume IX, December 2014
Váňová, Voženílek: Analysis of traffic Capacity using ArgGIS Network Analyst 137
Source: Authors
Fig. 7 - Road capacity through Přerov in the direction „Valašské Meziříčí – Brno“
Number 4, Volume IX, December 2014
Váňová, Voženílek: Analysis of traffic Capacity using ArgGIS Network Analyst 138
Source: Authors
Fig. 8 - Road capacity through Přerov in the direction „Lipník nad Bečvou – Brno“
Number 4, Volume IX, December 2014
Váňová, Voženílek: Analysis of traffic Capacity using ArgGIS Network Analyst 139
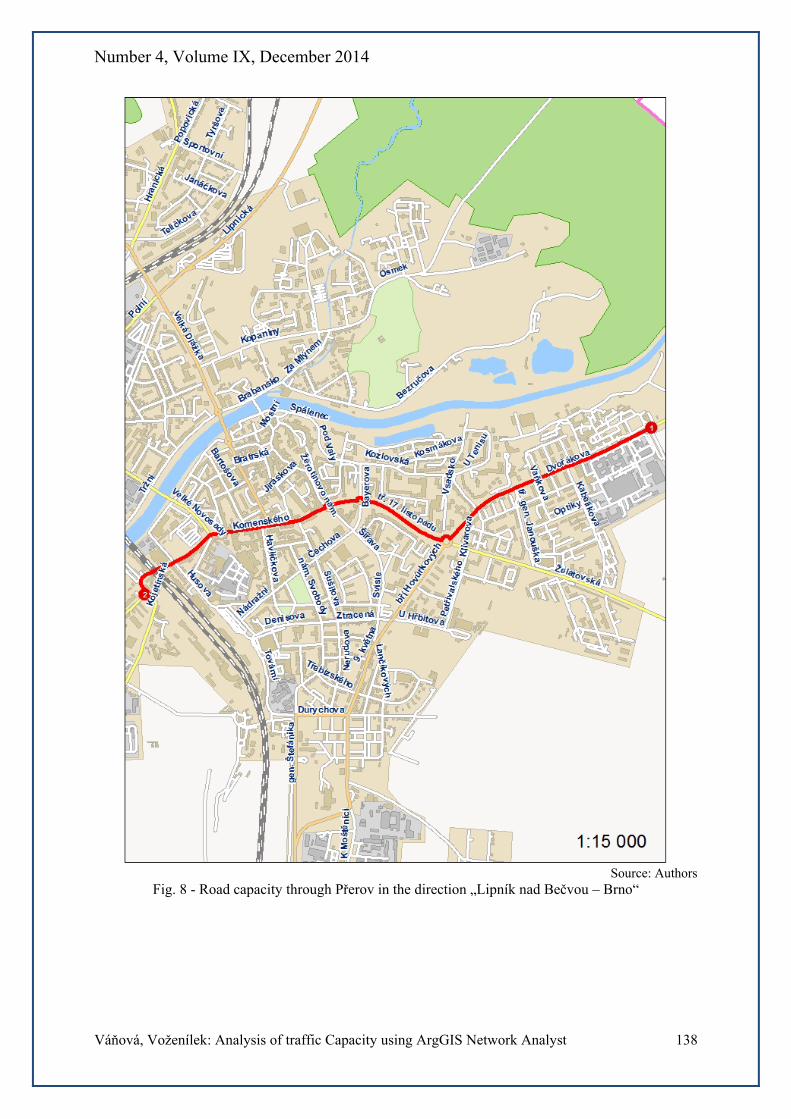
All the main representative routes where the transfer time was measured are depicted in the figure 9.
Source: Authors
Fig. 9 - Main routes used for the transfers in above – mention directions
Number 4, Volume IX, December 2014
Váňová, Voženílek: Analysis of traffic Capacity using ArgGIS Network Analyst 140
2. COMPARISON OF ANALYSIS RESULTS
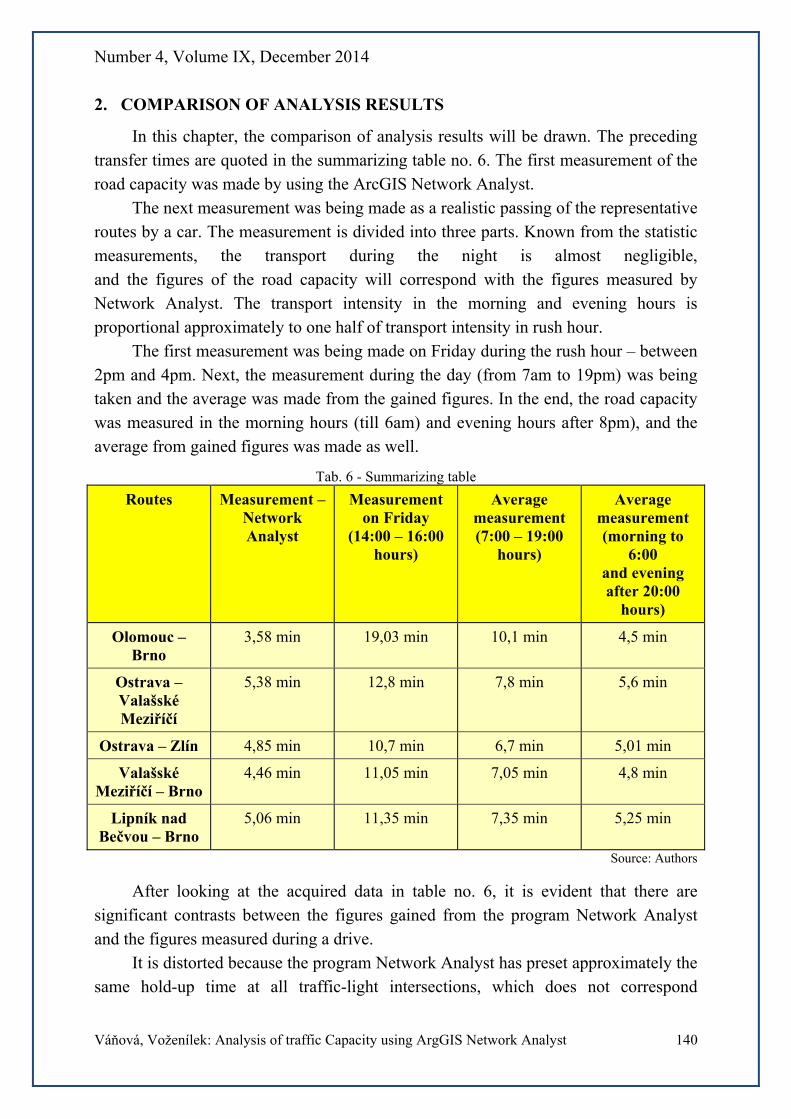
In this chapter, the comparison of analysis results will be drawn. The preceding transfer times are quoted in the summarizing table no. 6. The first measurement of the road capacity was made by using the ArcGIS Network Analyst.
The next measurement was being made as a realistic passing of the representative routes by a car. The measurement is divided into three parts. Known from the statistic measurements, the transport during the night is almost negligible, and the figures of the road capacity will correspond with the figures measured by Network Analyst. The transport intensity in the morning and evening hours is proportional approximately to one half of transport intensity in rush hour.
The first measurement was being made on Friday during the rush hour – between 2pm and 4pm. Next, the measurement during the day (from 7am to 19pm) was being taken and the average was made from the gained figures. In the end, the road capacity was measured in the morning hours (till 6am) and evening hours after 8pm), and the average from gained figures was made as well.
Tab. 6 - Summarizing table
Routes Measurement – Network Analyst
Measurement on Friday
(14:00 – 16:00 hours)
Average measurement (7:00 – 19:00
hours)
Average measurement (morning to
6:00 and evening after 20:00
hours)
Olomouc – Brno
3,58 min 19,03 min 10,1 min 4,5 min
Ostrava – Valašské Meziříčí
5,38 min 12,8 min 7,8 min 5,6 min
Ostrava – Zlín 4,85 min 10,7 min 6,7 min 5,01 min
Valašské Meziříčí – Brno
4,46 min 11,05 min 7,05 min 4,8 min
Lipník nad Bečvou – Brno
5,06 min 11,35 min 7,35 min 5,25 min
Source: Authors
After looking at the acquired data in table no. 6, it is evident that there are significant contrasts between the figures gained from the program Network Analyst and the figures measured during a drive.
It is distorted because the program Network Analyst has preset approximately the same hold-up time at all traffic-light intersections, which does not correspond
Number 4, Volume IX, December 2014
Váňová, Voženílek: Analysis of traffic Capacity using ArgGIS Network Analyst 141
for example with rush hour. The program relies on the speed that was set for given section and that is reduced in some time points substantially.
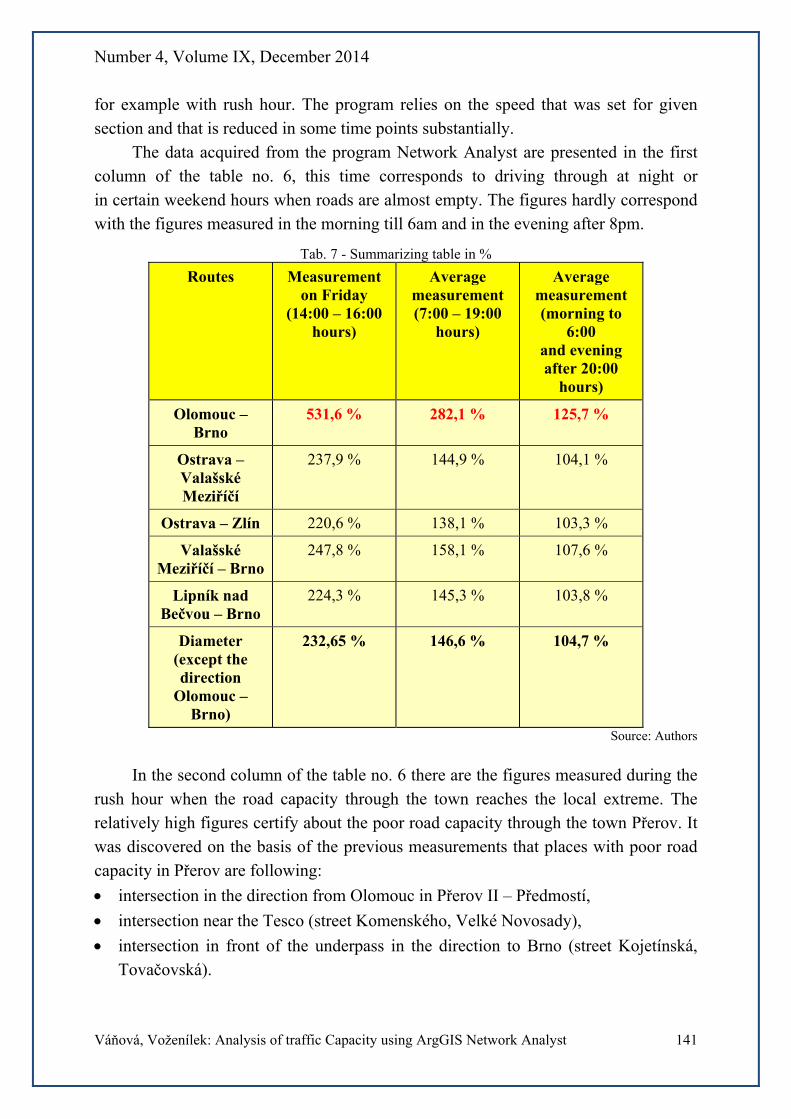
The data acquired from the program Network Analyst are presented in the first column of the table no. 6, this time corresponds to driving through at night or in certain weekend hours when roads are almost empty. The figures hardly correspond with the figures measured in the morning till 6am and in the evening after 8pm.
Tab. 7 - Summarizing table in %
Routes Measurement on Friday
(14:00 – 16:00 hours)
Average measurement (7:00 – 19:00
hours)
Average measurement (morning to
6:00 and evening after 20:00
hours)
Olomouc – Brno
531,6 % 282,1 % 125,7 %
Ostrava – Valašské Meziříčí
237,9 % 144,9 % 104,1 %
Ostrava – Zlín 220,6 % 138,1 % 103,3 %
Valašské Meziříčí – Brno
247,8 % 158,1 % 107,6 %
Lipník nad Bečvou – Brno
224,3 % 145,3 % 103,8 %
Diameter (except the direction
Olomouc – Brno)
232,65 % 146,6 % 104,7 %
Source: Authors
In the second column of the table no. 6 there are the figures measured during the rush hour when the road capacity through the town reaches the local extreme. The relatively high figures certify about the poor road capacity through the town Přerov. It was discovered on the basis of the previous measurements that places with poor road capacity in Přerov are following:
intersection in the direction from Olomouc in Přerov II – Předmostí,
intersection near the Tesco (street Komenského, Velké Novosady),
intersection in front of the underpass in the direction to Brno (street Kojetínská, Tovačovská).

Number 4, Volume IX, December 2014
Váňová, Voženílek: Analysis of traffic Capacity using ArgGIS Network Analyst 142
The average figures of the measurement made between 7am and 7pm are taken down in the penultimate column of the table no. 6.
In the table no.7 you can find the figures comparing how much the transfer time increases unlike from the figures measured with the aid of Network Analyst. The average in the table no. 7 is computed in every column from all directions excluding the direction Olomouc – Brno where the extreme increase of transfer time comes about, for that reason this figure is not included in order not to get a skewed average.
CONCLUSION
The aim of this publication was to find the road capacity through the town Přerov and assess the situation of road transport. The analysis of the road capacity was made with the aid of the program ArcGIS Network Analyst, which is able to calculate and plot the optimal route when having chosen the starting point and endpoint. Thereafter, these routes were passed by a car in various times of the day and the period of transfer was timed through a given section. The transfer times were divided into three groups – the rush hour (2pm – 16pm), the average figures during the day (7am – 7pm), and in the morning and in the evening (till 6am and after 8pm).
The transfer time calculated by the program Network Analyst differs from the time driven during the rush hour when the traffic jams come to the extreme. The figures in the program Network Analyst approximately correspond to the figures that were measured in the morning and in the evening when the traffic intensity is lower than during the day. The traffic intensity reaches the lowest figures at night.
The research shows that the real measured time between 2pm and 4pm is on average 232,65% higher than the data gained from the program Network Analyst. The figures measured between 7am and 7pm are on average 146,6% higher in contrast to results gained from the program. The figures measured in the morning and at night differ very slightly and they are only 104,7% higher. The road capacity between 2pm – 4pm in the direction Olomouc – Brno is unbelievably 531,6% higher unlike the figures taken from the Network Analyst. The figures between 7am and 7pm are in reality also much higher, that is 282,1% higher. The same goes for the period in the morning and evening hours when the real transfer time is 125,7% higher. It follows that the most critical situation of the road capacity is in the direction from Olomouc to Brno.
It was detected from the measurements that the figures during the rush hour reach critical values in some sections. The worst situation is at the intersection in Přerov II – Předmostí, the intersection next to the Tesco and the intersection near the underpass in the direction to Brno.
Although these ascertained results are not surprising for the town council and it is known about these problems, but their great importance is that this method, comparing theoretically and practically acquired data, is possible to use not only in the town

Number 4, Volume IX, December 2014
Váňová, Voženílek: Analysis of traffic Capacity using ArgGIS Network Analyst 143
Přerov but also in various studies about changes in solution of traffic situation generally.
These analysis results will serve as a material for the proposal to adjustments in traffic problems in the town Přerov. On the basis of this analysis, the next study will be focused on the intersection in Předmostí and the importance of controlling its traffic lights, with the aim of increasing traffic fluency in the town Přerov.
REFERENCES
(1) ESRI. ARCDATA PRAHA Geografické informační systémy. [online]. c 2014 [cit. 2014-06-01] Dostupné z: <http://www.arcdata.cz/uvod/>.
(2) Esri. Network Analyst Tutorial. [online]. c 1995 – 2010 [cit. 2014-06-01] Dostupné z: <http://help.arcgis.com/en/arcgisdesktop/10.0/pdf/network-analyst-tutorial.pdf>.
(3) HEISIG, J. Základy práce s ArcGIS 10. Přerov: Vysoká škola logistiky Přerov, 2010. (4) HRUBÝ, M. Geografické Informační Systémy (GIS) Studijní opora. [online]. [cit. 2014-
06-01] Dostupné z: < http://perchta.fit.vutbr.cz/vyuka-gis/uploads/1/GIS-final2.pdf>. (5) KUTTELWASCHER, R. ArcGIS Network Analyst. [online]. [cit. 2014-06-01] Dostupné
z: <http://www.arcdata.cz/Publikace/casopis-arcrevue/arcrevue-2-2012/>. (6) RAPANT, P. Úvod do geografických informačních systémů. [online]. [cit. 2014-06-01]
Dostupné z: <http://homel.vsb.cz/~jan42/gis/Rapant_GIS.pdf>. (7) TUČEK, J. Geografické informační systémy – Principy a praxe. Brno: Computer Press,
1998. ISBN 807226091X. (8) VOŽENÍLEK, V. a STRAKOŠ, V. City logistics dopravní problém města a logistika.
1. vyd. Olomouc: Univerzita Palackého v Olomouci, 2009. ISBN 978-80-244-2317-3.