Embed Size (px)
Citation preview
52 Respiratory Therapy Vol. 12 No. 1 n Winter 2017
IntroductionPrevious studies reporting performance characteristics of Oscillating Positive Expiratory Pressure (OPEP) devices have gathered data using a constant flow source at various ranges of flow.1,2 Other than the standard measured parameters of frequency and mean expiratory pressure, the parameter that seems to get the most attention is pressure amplitude. However, it is actually short bursts of increased expiratory air flow that help move secretions up the airway.3 Just as in a forced cough, peak expiratory flow is a major factor in improving secretion clearance with OPEP devices.
Therefore the primary purpose of this study is to analyze maximum expiratory flow during OPEP therapy by comparing flow-volume loops generated by the vPEP (D R Burton Healthcare, Farmville, NC), the Aerobika (Monaghan Medical, Plattsburg, NY), and the Acapella (DHD Healthcare, Wampsville, NY) during simulated, spontaneous breathing. Frequency, mean expiratory pressure, maximum inspiratory flow, mean pressure amplitude, and mean flow amplitude were also measured. The hypothesis for this evaluation is that the three devices will produce similar values at five different volumes.
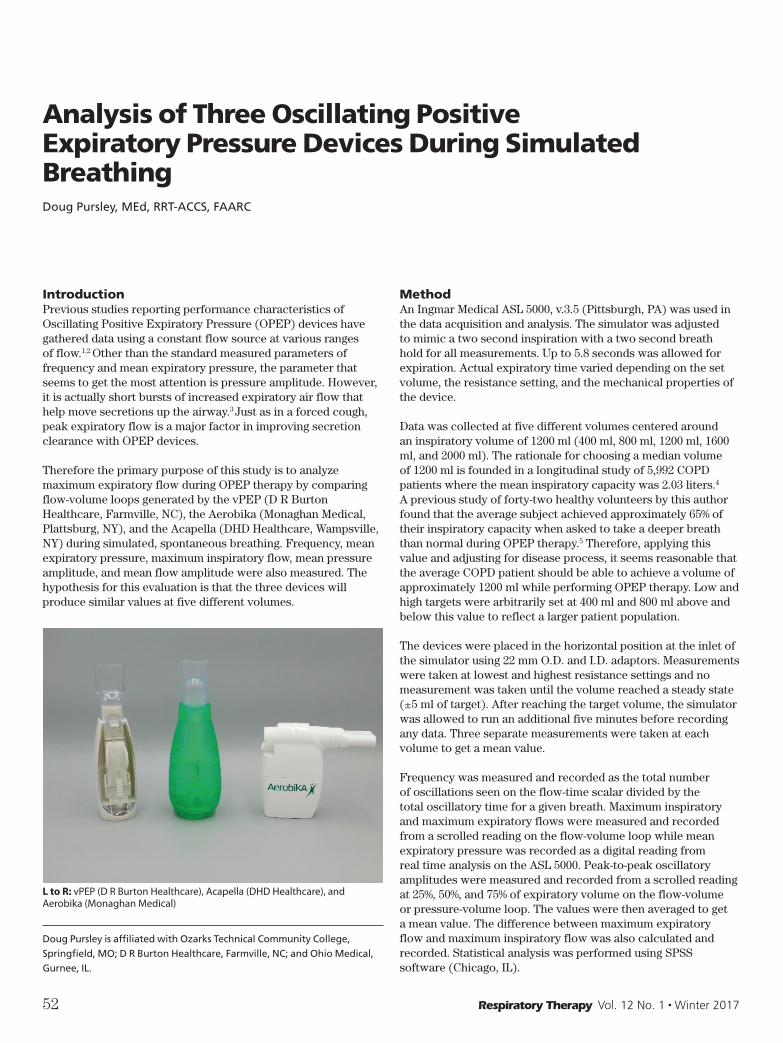
L to R: vPEP (D R Burton Healthcare), Acapella (DHD Healthcare), and Aerobika (Monaghan Medical)
MethodAn Ingmar Medical ASL 5000, v.3.5 (Pittsburgh, PA) was used in the data acquisition and analysis. The simulator was adjusted to mimic a two second inspiration with a two second breath hold for all measurements. Up to 5.8 seconds was allowed for expiration. Actual expiratory time varied depending on the set volume, the resistance setting, and the mechanical properties of the device.
Data was collected at five different volumes centered around an inspiratory volume of 1200 ml (400 ml, 800 ml, 1200 ml, 1600 ml, and 2000 ml). The rationale for choosing a median volume of 1200 ml is founded in a longitudinal study of 5,992 COPD patients where the mean inspiratory capacity was 2.03 liters.4
A previous study of forty-two healthy volunteers by this author found that the average subject achieved approximately 65% of their inspiratory capacity when asked to take a deeper breath than normal during OPEP therapy.5 Therefore, applying this value and adjusting for disease process, it seems reasonable that the average COPD patient should be able to achieve a volume of approximately 1200 ml while performing OPEP therapy. Low and high targets were arbitrarily set at 400 ml and 800 ml above and below this value to reflect a larger patient population.
The devices were placed in the horizontal position at the inlet of the simulator using 22 mm O.D. and I.D. adaptors. Measurements were taken at lowest and highest resistance settings and no measurement was taken until the volume reached a steady state (±5 ml of target). After reaching the target volume, the simulator was allowed to run an additional five minutes before recording any data. Three separate measurements were taken at each volume to get a mean value.
Frequency was measured and recorded as the total number of oscillations seen on the flow-time scalar divided by the total oscillatory time for a given breath. Maximum inspiratory and maximum expiratory flows were measured and recorded from a scrolled reading on the flow-volume loop while mean expiratory pressure was recorded as a digital reading from real time analysis on the ASL 5000. Peak-to-peak oscillatory amplitudes were measured and recorded from a scrolled reading at 25%, 50%, and 75% of expiratory volume on the flow-volume or pressure-volume loop. The values were then averaged to get a mean value. The difference between maximum expiratory flow and maximum inspiratory flow was also calculated and recorded. Statistical analysis was performed using SPSS software (Chicago, IL).
Analysis of Three Oscillating Positive Expiratory Pressure Devices During Simulated BreathingDoug Pursley, MEd, RRT-ACCS, FAARC
Doug Pursley is affiliated with Ozarks Technical Community College, Springfield, MO; D R Burton Healthcare, Farmville, NC; and Ohio Medical, Gurnee, IL.
RT 12-1 Winter 2016 R15.indd 52 1/1/17 1:59 AM

Respiratory Therapy Vol. 12 No. 1 n Winter 2017 53
Chart 3. Maximum inspiratory flow at low and high resistance settings.
Statistical Analysis — Maximum Expiratory and Maximum Inspiratory FlowResistance had a significant effect on expiratory flow (P = < .001), but not on inspiratory flow (P = .648). There was a significant difference in expiratory flow between all three devices when compared to each other (all three P = < .001).
There was a significant difference in inspiratory flows between the vPEP and Aerobika (P = < .001) and the Acapella and Aerobika (P = <.001), however, there was no difference in inspiratory flows between the vPEP and Acapella (P = .51).
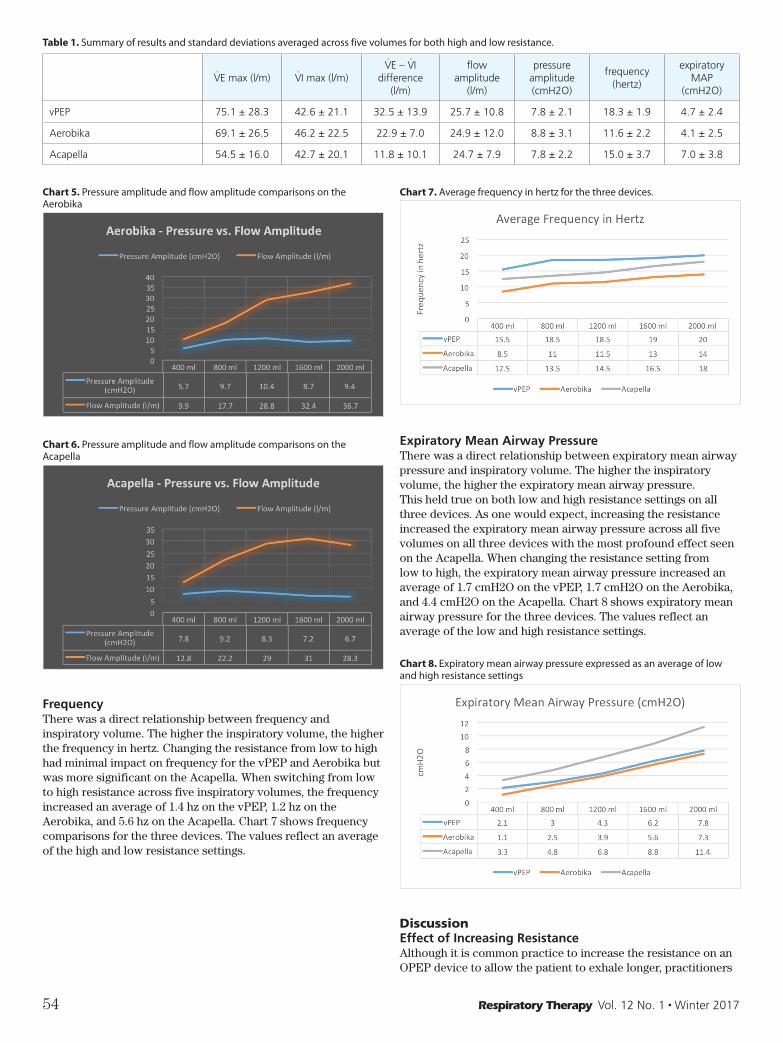
Flow vs Pressure AmplitudePeak-to-peak flow oscillatory amplitude tended to increase progressively or increase and plateau with increases in volume. Peak-to-peak pressure oscillatory amplitude was less predictable and more consistent across the five inspiratory volumes. Charts 4, 5, and 6 compare pressure amplitude to flow amplitude when averaged for both high and low resistance readings.
Chart 4. Pressure amplitude and flow amplitude comparisons on the vPEP
ResultsMaximum Expiratory FlowMaximum expiratory flowrates increased progressively with increases in volume in all three devices. Increasing the resistance from low to high had a negative effect on expiratory flow. In 29 of 30 data points, maximum expiratory flow decreased as resistance was increased. Charts 1 and 2 show the mean values for maximum expiratory flow at the low and high resistance settings for the three devices.
Chart 1. Maximum expiratory flow at the lowest resistance setting.
Chart 2. Maximum expiratory flow at the highest resistance setting.
Maximum Inspiratory FlowMaximum inspiratory flows also increased progressively with increases in volume on all three devices. As one would expect, increasing the resistance had little to no effect on inspiratory flow. Chart 3 shows the maximum inspiratory flow across five inspiratory volumes for the three devices.
RT 12-1 Winter 2016 R15.indd 53 1/1/17 1:59 AM
54 Respiratory Therapy Vol. 12 No. 1 n Winter 2017
Chart 7. Average frequency in hertz for the three devices.
Expiratory Mean Airway PressureThere was a direct relationship between expiratory mean airway pressure and inspiratory volume. The higher the inspiratory volume, the higher the expiratory mean airway pressure. This held true on both low and high resistance settings on all three devices. As one would expect, increasing the resistance increased the expiratory mean airway pressure across all five volumes on all three devices with the most profound effect seen on the Acapella. When changing the resistance setting from low to high, the expiratory mean airway pressure increased an average of 1.7 cmH2O on the vPEP, 1.7 cmH2O on the Aerobika, and 4.4 cmH2O on the Acapella. Chart 8 shows expiratory mean airway pressure for the three devices. The values reflect an average of the low and high resistance settings.
Chart 8. Expiratory mean airway pressure expressed as an average of low and high resistance settings
DiscussionEffect of Increasing Resistance Although it is common practice to increase the resistance on an OPEP device to allow the patient to exhale longer, practitioners
Chart 5. Pressure amplitude and flow amplitude comparisons on the Aerobika
Chart 6. Pressure amplitude and flow amplitude comparisons on the Acapella
FrequencyThere was a direct relationship between frequency and inspiratory volume. The higher the inspiratory volume, the higher the frequency in hertz. Changing the resistance from low to high had minimal impact on frequency for the vPEP and Aerobika but was more significant on the Acapella. When switching from low to high resistance across five inspiratory volumes, the frequency increased an average of 1.4 hz on the vPEP, 1.2 hz on the Aerobika, and 5.6 hz on the Acapella. Chart 7 shows frequency comparisons for the three devices. The values reflect an average of the high and low resistance settings.
Table 1. Summary of results and standard deviations averaged across five volumes for both high and low resistance.
V̇E max (l/m) V̇I max (l/m)V̇E – V̇I
difference (l/m)
flow amplitude
(l/m)
pressure amplitude (cmH2O)
frequency (hertz)
expiratory MAP
(cmH2O)
vPEP 75.1 ± 28.3 42.6 ± 21.1 32.5 ± 13.9 25.7 ± 10.8 7.8 ± 2.1 18.3 ± 1.9 4.7 ± 2.4
Aerobika 69.1 ± 26.5 46.2 ± 22.5 22.9 ± 7.0 24.9 ± 12.0 8.8 ± 3.1 11.6 ± 2.2 4.1 ± 2.5
Acapella 54.5 ± 16.0 42.7 ± 20.1 11.8 ± 10.1 24.7 ± 7.9 7.8 ± 2.2 15.0 ± 3.7 7.0 ± 3.8
RT 12-1 Winter 2016 R15.indd 54 1/1/17 1:59 AM
Respiratory Therapy Vol. 12 No. 1 n Winter 2017 55
In other words, at a given frequency and oscillatory I:E ratio, mucus clearance increases when maximum expiratory flow exceeds maximum inspiratory flow. The OCI will be zero if the oscillatory I:E ratio is 1:1 AND if the inspiratory and expiratory flows are the same. The full formula is written as:
OCI = f x (TI ÷ TE) x (V̇E max ÷ V̇I max) – f
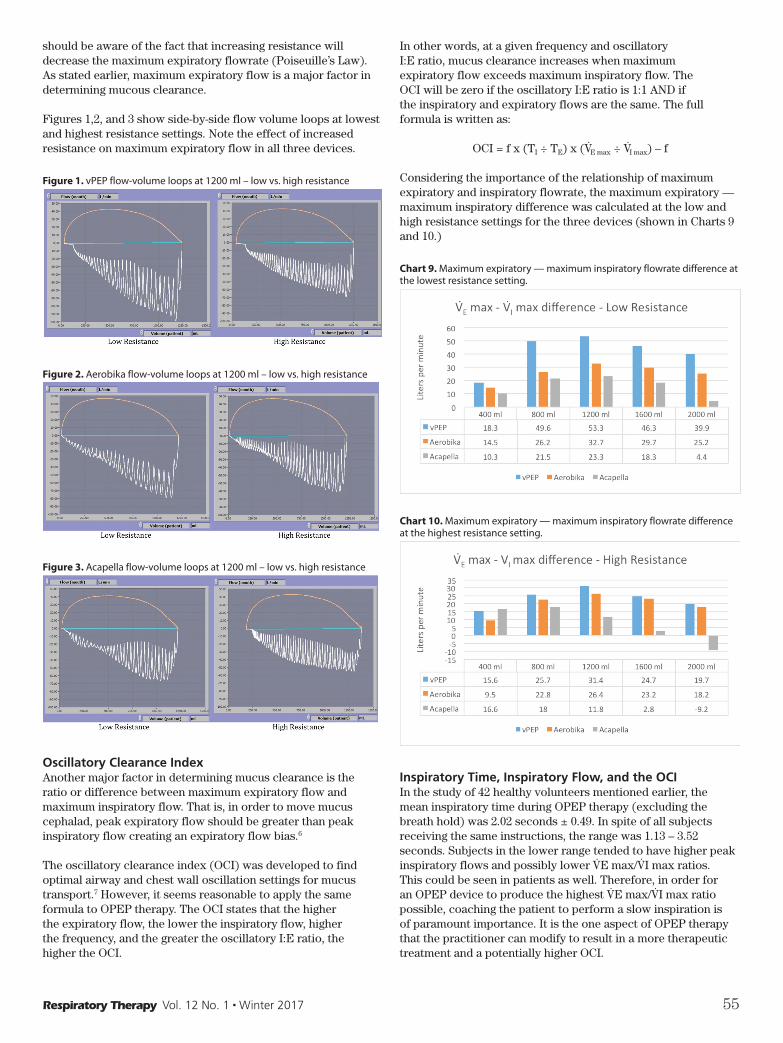
Considering the importance of the relationship of maximum expiratory and inspiratory flowrate, the maximum expiratory — maximum inspiratory difference was calculated at the low and high resistance settings for the three devices (shown in Charts 9 and 10.)
Chart 9. Maximum expiratory — maximum inspiratory flowrate difference at the lowest resistance setting.
Chart 10. Maximum expiratory — maximum inspiratory flowrate difference at the highest resistance setting.
Inspiratory Time, Inspiratory Flow, and the OCIIn the study of 42 healthy volunteers mentioned earlier, the mean inspiratory time during OPEP therapy (excluding the breath hold) was 2.02 seconds ± 0.49. In spite of all subjects receiving the same instructions, the range was 1.13 – 3.52 seconds. Subjects in the lower range tended to have higher peak inspiratory flows and possibly lower V̇E max/V̇I max ratios. This could be seen in patients as well. Therefore, in order for an OPEP device to produce the highest V̇E max/V̇I max ratio possible, coaching the patient to perform a slow inspiration is of paramount importance. It is the one aspect of OPEP therapy that the practitioner can modify to result in a more therapeutic treatment and a potentially higher OCI.
should be aware of the fact that increasing resistance will decrease the maximum expiratory flowrate (Poiseuille’s Law). As stated earlier, maximum expiratory flow is a major factor in determining mucous clearance.
Figures 1,2, and 3 show side-by-side flow volume loops at lowest and highest resistance settings. Note the effect of increased resistance on maximum expiratory flow in all three devices.
Figure 1. vPEP flow-volume loops at 1200 ml – low vs. high resistance
Figure 2. Aerobika flow-volume loops at 1200 ml – low vs. high resistance
Figure 3. Acapella flow-volume loops at 1200 ml – low vs. high resistance
Oscillatory Clearance IndexAnother major factor in determining mucus clearance is the ratio or difference between maximum expiratory flow and maximum inspiratory flow. That is, in order to move mucus cephalad, peak expiratory flow should be greater than peak inspiratory flow creating an expiratory flow bias.6
The oscillatory clearance index (OCI) was developed to find optimal airway and chest wall oscillation settings for mucus transport.7 However, it seems reasonable to apply the same formula to OPEP therapy. The OCI states that the higher the expiratory flow, the lower the inspiratory flow, higher the frequency, and the greater the oscillatory I:E ratio, the higher the OCI.
RT 12-1 Winter 2016 R15.indd 55 1/1/17 2:00 AM
56 Respiratory Therapy Vol. 12 No. 1 n Winter 2017
in chronic obstructive pulmonary disease. Respiratory research, 13(1), 1.
5 Pursley, D.M.. Analysis of Tidal Volume and Expiratory Pressure during Oscillatory PEP Therapy in Healthy Subjects. Respiratory Therapy 2016; Volume 11, Number 2.
6 Volpe, M., Amato, M. Is It Time to Monitor Flow Bias During Mechanical Ventilation? Respiratory Care 2011; 56(12); 1970-1971.
7 Scherer, Thomas A., Jurg Barandun, Elena Martinez, Adam Wanner, and Eben M. Rubin. Effect of High-Frequency Oral Airway and Chest Wall Oscillation and Conventional Chest Physical Therapy on Expectoration in Patients with Stable Cystic Fibrosis. Chest 113.4 (1998): 1019-027.
Flow vs Pressure Oscillatory AmplitudeOne incidental finding of the study is the lack of a direct relationship between pressure and flow when using a simulated breathing model. In all three devices, there was a steady increase in mean flow amplitude as the inspiratory volume was increased in 400 ml increments from 400 ml to 1600 ml. On the other hand, although mean pressure amplitude increased initially, it decreased from at least one previous value across the same range of volume in all three devices.
In contrast, when one evaluates an OPEP device using a constant flow source, there is a direct relationship between pressure and flow — but this is not how the device is used. Simulated breathing produces a more realistic, decelerating flow pattern during exhalation instead of the square wave flow that would be produced from testing a device using continuous flow. The fact that pressure amplitude is less predictable and non-linear in a spontaneous breathing model can be explained by the differences in flow waveforms.
Comparative SummaryWhen averaged across five volumes for both high and low resistance, there were similarities in flow and pressure amplitudes. However, there were differences between at least two out of the three devices for maximum inspiratory flow, maximum expiratory flow, V̇E – V̇I difference, frequency, and expiratory mean airway pressure. The overall results followed by standard deviations are summarized in Table 1.
ConclusionThe three OPEP devices tested each employ a unique operating principle to create positive pressure oscillations. The different mechanisms, including the manner in which resistance is created, cause different outputs in terms of flow, pressure, and frequency.
The importance of expiratory flow cannot be overstated. As detailed earlier, the higher the maximum expiratory flow in relation to the maximum inspiratory flow, the greater the expiratory flow bias and presumably the greater the secretion clearance.
Oscillatory positive expiratory pressure devices are indicated to help patients mobilize secretions and promote the movement of mucus cephalad. In order to achieve this goal and assuming a steady exhalation, the oscillatory clearance index will be maximized when the practitioner adjusts the resistance on the lowest setting and instructs the patient to take the slowest inspiration possible.
References1 Silva, C.E.A., Santos, J.G., Jansen, J.M., de Melo, P.L. (2009).
Laboratory evaluation of the Acapella device: pressure characteristics under different conditions, and a software tool to optimize its practical use. Respiratory Care, 54(11), 1480-1487.
2 Volsko TA, DiFiore J, Chatburn RL. Performance comparison of Two Oscillating Positive Expiratory Pressure Devices: Acapella Versus Flutter. Respiratory Care 2003; 48(2):124-130.
3 Hess, Dean. Respiratory Care: Principles and Practice. Sudbury, MA: Jones & Bartlett Learning, 2016. Print.
4 Celli, B. R., Decramer, M., Lystig, T., Kesten, S., & Tashkin, D. P. (2012). Longitudinal inspiratory capacity changes
RT 12-1 Winter 2016 R15.indd 56 1/1/17 2:00 AM