Embed Size (px)
Citation preview

NOTICE This document is disseminated under the sponsorship of the U.S. Department of Transportation in the interest of information exchange. The United States Government assumes no liability for the contents or use thereof. The United States Government does not endorse products or manufacturers. Trade or manufacturers’ names appear herein solely because they are considered essential to the objective of this report.


Analysis of the Risk of an Airbus A380 Hand-Flown Balked Landing Penetrating the FAA Category I, Code E Obstacle-Free Zone
DOT-FAA-AFS-450-46 October 2008
Technical Report Documentation Page 1. Report No. DOT-FAA-AFS-450-46
2. Government Accession No. 3. Recipient's Catalog No.
4. Title and Subtitle Analysis of the Risk of an Airbus A380 Hand-Flown Balked Landing Penetrating the FAA Category I, Code E Obstacle-Free Zone
5. Report Date October 2008
6. Author(s) Dr. Richard Greenhaw
7. Performing Organization Code
8. Performing Organization Name and Address Department of Transportation/Federal Aviation Administration Flight Systems Laboratory, AFS-450 Systems Training Annex Bldg. 26 6500 S. MacArthur Blvd. Oklahoma City, OK 73169
9. Type of Report and Period Covered Technical report
10. Sponsoring Agency Name and Address Department of Transportation/Federal Aviation Administration Flight Systems Laboratory, AFS-450 Systems Training Annex Bldg. 26 6500 S. MacArthur Blvd. Oklahoma City, OK 73169 11. Supplementary Notes 12. Abstract The purposes of this study were to determine the probability of penetration of the Federal Aviation Administration (FAA) Category (CAT) I Obstacle-Free Zone (OFZ) (inner-transitional surface) by an Airbus A380 during a hand-flown balked landing operation and to determine whether one or more modifications to this OFZ might reduce that probability to an acceptable value. Using extreme value analysis, the study determined penetration probabilities of the current OFZ and two modified OFZ configurations. 13. Key Words Balked landing, Obstacle-Free Zone (OFZ), inner transitional surface
14. Distribution Statement Controlled by AFS-450
15. Security Classification of This Report Unclassified
16. Security Classification of This Page Unclassified
ii
Analysis of the Risk of an Airbus A380 Hand-Flown Balked Landing Penetrating the FAA Category I, Code E Obstacle-Free Zone
DOT-FAA-AFS-450-46 October 2008
Executive Summary The purposes of this study were to determine the probability of penetration of the Federal Aviation Administration Category (CAT) I, Code E Obstacle-Free Zone (OFZ) (innertransitional surface) by an Airbus A380 during a hand-flown balked landing operation and to determine whether a modification to this OFZ might reduce that probability to an acceptable level. In Advisory Circular 150/5300-13 CHG 8, “Airport Design,” the OFZ is specified to have a base width (inner approach surface) of 400 feet for runways serving large airplanes. At a point 200 feet laterally from the center of the runway, the inner-transitional OFZ surface rises vertically. The extent of this vertical rise is a function of both the runway threshold elevation above Mean Sea Level and the most demanding wingspan of airplanes expected to use the runway. From the top of this vertical rise, the surface then slopes 6 (horizontal) to 1 (vertical) out to a height of 148 feet [1]. The study was intended to determine the risk of the Airbus A380 penetrating the FAA CAT I, Code E inner-transitional OFZ during a hand-flown (Flight Director assisted) balked landing operation under typical environmental conditions. The study applied extreme value analysis, a type of statistical analysis, to determine the penetration probability. The results of this analysis showed that the probability of penetration of the current OFZ is 5.0 E-07. The analysis also showed that if the base of the OFZ is pushed out so that the vertical surface is 225 feet from the runway centerline (rather than 200 feet), the probability of penetration is 8.7 E-08. Additionally, if the base of the OFZ is cut vertically at a point 225 feet from the runway centerline giving a somewhat higher vertical height, the probability of penetration is 9.9 E-08. The appendix describes the methodology and results of a test used to validate the use of A340 simulators to obtain data used in this study of A380 behavior.
iii

TABLE OF CONTENTS
1.0 Introduction…………………………………………………………...1 2.0 Test Plan………………………………………………………………4 3.0 Test Results………………………………………………………….. 4 4.0 Analysis……………………………………………………………….5 5.0 Conclusion…………………………………………………………..13 Appendix: ……………………………………………………………….14 References………………………………………………………………..21
Analysis of the Risk of an Airbus A380 Hand-Flown Balked Landing Penetrating the FAA Category I, Code E Obstacle-Free Zone
DOT-FAA-AFS-450-46 October 2008
iv

Figures Figure 1: Current OFZ ....................................................................................................... 2Figure 2: Modified OFZ (Push-Out).................................................................................. 2 Figure 3: Current and Push-Out OFZs............................................................................... 2Figure 4: Modified OFZ (Vertical Cut) ............................................................................. 3 Figure 5: Current and Vertical Cut OFZs .......................................................................... 3Figure 6: Test Results Plot................................................................................................. 5Figure 7: Crosswind and Initiation Height Relationship ................................................... 7
Analysis of the Risk of an Airbus A380 Hand-Flown Balked Landing Penetrating the FAA Category I, Code E Obstacle-Free Zone
DOT-FAA-AFS-450-46 October 2008
LIST OF ILLUSTRATIONS
v
Tables
Table 1: Initiation Height and Crosswind Test Values...................................................... 4 Table 2: Go-Around Rates ................................................................................................. 6 Table 3: European Go-Around Rate .................................................................................. 8 Table 4: Go-Around Rate by Initiation Height .................................................................. 8 Table 5: Current OFZ Configuration ................................................................................. 9 Table 6: Push-Out OFZ Configuration ............................................................................ 10 Table 7: Vertical Cut OFZ Configuration........................................................................ 11 Table 8: Current OFZ Configuration ............................................................................... 12 Table 9: Push-Out OFZ Configuration ............................................................................ 12 Table 10: Vertical Cut OFZ Configuration...................................................................... 12 Table 11: Penetration Probability by OFZ Type.............................................................. 13 Table A.1: Maximum Lateral Deviation t-Test Results................................................... 16 Table A.2: Lateral Deviation Cumulative Probability Results ........................................ 16 Table A.3: Mean OFZ Vertical Exposure Slope t-Test Results....................................... 17 Table A.4: Height Loss Comparison (Feet)..................................................................... 17 Table A.5: Height Loss Statistical Test Results............................................................... 17 Table A.6: Roll Rate Comparison (Radians per Second) ................................................ 18 Table A.7: Roll Rate Statistical Test Result .................................................................... 18 Table A.8: Roll Angle Comparison ................................................................................. 18 Table A.9: Roll Angle Statistical Test Results ................................................................ 18 Table A.10: Yaw Angle Comparison............................................................................... 19 Table A.11: Yaw Angle Statistical Test Results.............................................................. 19 Table A.12: Minimum Height Above Runway Comparison (Feet) ................................ 19 Table A.13: Minimum Height Above Runway Statistical Test Results .......................... 19 Table A.14: S Comparison............................................................................................... 20 Table A.15: S Statistical Test Results.............................................................................. 20
Analysis of the Risk of an Airbus A380 Hand-Flown Balked Landing Penetrating the FAA Category I, Code E Obstacle-Free Zone
DOT-FAA-AFS-450-46 October 2008
1.0 Introduction
The purposes of this study were to determine the probability of penetration of the Federal Aviation Administration (FAA) Category (CAT) I Obstacle-Free Zone (OFZ) (innertransitional surface) by an Airbus A380 during a hand-flown balked landing operation, and to determine whether one or more modifications to this OFZ might reduce that probability to an acceptable value.
In Advisory Circular 150/5300-13 CHG 8, “Airport Design,” the OFZ is specified to have a base width (inner approach surface) of 400 feet for runways serving large airplanes (see Figure 1). At a distance of 200 feet from the runway center, the inner-transitional OFZ surface rises vertically on either side (indicated as H). The extent of this vertical rise (H) is a function of both the runway threshold elevation above Mean Sea Level and the most demanding wingspan of airplanes expected to use the runway. From the top of this vertical rise, the surface then slopes 16.7%, 6 (horizontal) to 1 (vertical) out to a height of 148 feet (see Figure 1).
The study was intended to determine the risk of an Airbus A380 penetrating the FAA CAT I inner-transitional OFZ during a hand-flown (Flight Director assisted) balked landing operation under typical environmental conditions. It also examined the same risk for two modified versions of the current OFZ configuration.
In the first modification, the base inner approach surface width was pushed out from 200 feet to 225 feet (from the centerline to the vertical surface) with no other changes (see Figure 2 and Figure 3). We called this change the “push-out modification.” The vertical rise (H) was calculated in the same manner as it is currently calculated.
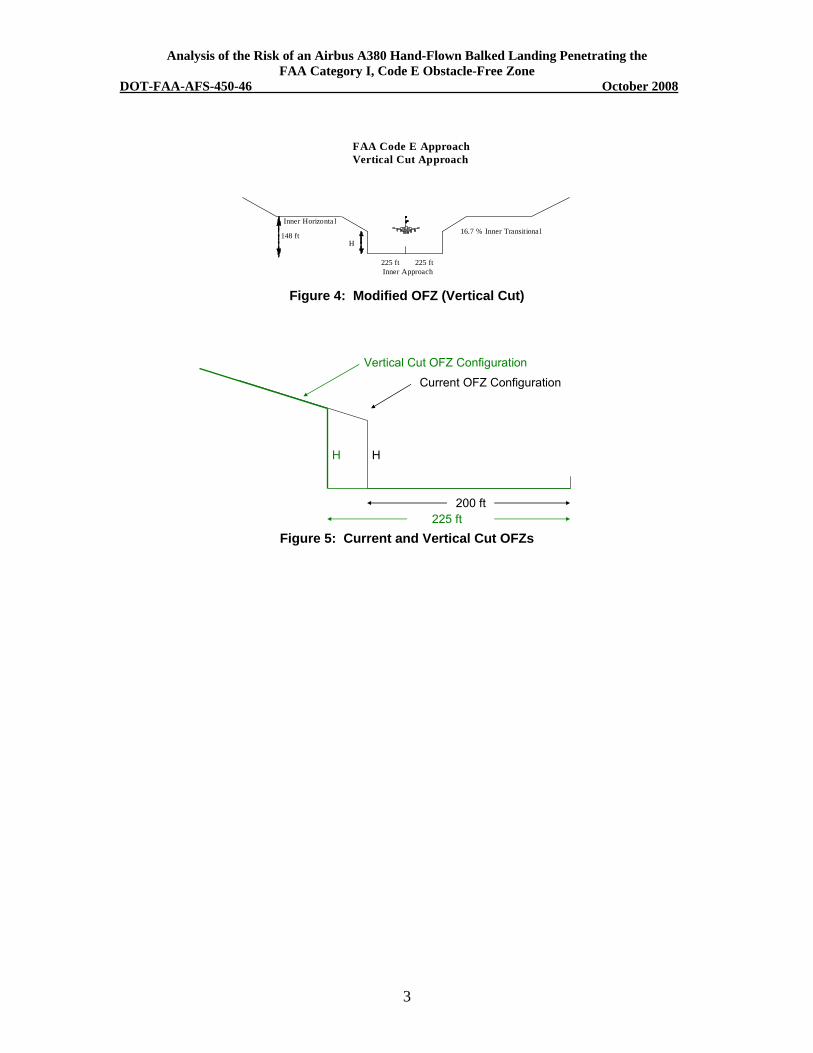
In the second modification, the current OFZ configuration was essentially cut vertically at 225 feet from the centerline so that the vertical rise (H) was higher than it was in either of the first two configurations (see Figure 4 and Figure 5). We called this change the “vertical cut modification.”
1

FAA Code E Approach Current
Inner H orizonta l 16.7 % Inne r Trans itiona l
148 f t H
200 ft 200 ft Inner A pproac h
Figure 1: Current OFZ
FAA Code E Approach Push-out Modification
Inner Horizonta l 16.7 % Inner Transitiona l
148 ft H
225 ft 225 ft Inner Approach
Figure 2: Modified OFZ (Push-Out)
Push-out OFZ Configuration
Current OFZ Configuration
H H
200 ft 225 ft
Figure 3: Current and Push-Out OFZs
Analysis of the Risk of an Airbus A380 Hand-Flown Balked Landing Penetrating the FAA Category I, Code E Obstacle-Free Zone
DOT-FAA-AFS-450-46 October 2008
2
Analysis of the Risk of an Airbus A380 Hand-Flown Balked Landing Penetrating the FAA Category I, Code E Obstacle-Free Zone
DOT-FAA-AFS-450-46 October 2008
FAA Code E Approach Vertical Cut Approach
3
225 ft 225 ft
16.7 % Inner Transitiona l
Inner Approach
Inner Horizonta l
148 ft H
Figure 4: Modified OFZ (Vertical Cut)
Vertical Cut OFZ Configuration
Current OFZ Configuration
HH
200 ft 225 ft
Figure 5: Current and Vertical Cut OFZs
Analysis of the Risk of an Airbus A380 Hand-Flown Balked Landing Penetrating the FAA Category I, Code E Obstacle-Free Zone
DOT-FAA-AFS-450-46 October 2008
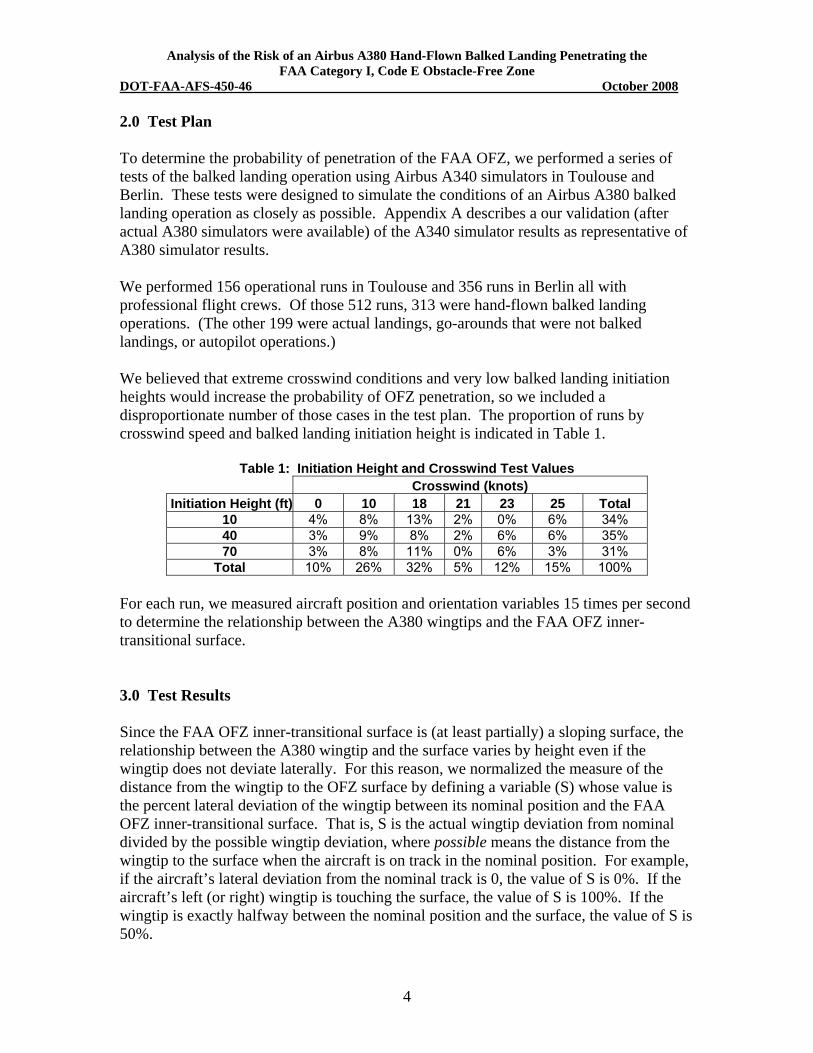
2.0 Test Plan To determine the probability of penetration of the FAA OFZ, we performed a series of tests of the balked landing operation using Airbus A340 simulators in Toulouse and Berlin. These tests were designed to simulate the conditions of an Airbus A380 balked landing operation as closely as possible. Appendix A describes a our validation (after actual A380 simulators were available) of the A340 simulator results as representative of A380 simulator results. We performed 156 operational runs in Toulouse and 356 runs in Berlin all with professional flight crews. Of those 512 runs, 313 were hand-flown balked landing operations. (The other 199 were actual landings, go-arounds that were not balked landings, or autopilot operations.) We believed that extreme crosswind conditions and very low balked landing initiation heights would increase the probability of OFZ penetration, so we included a disproportionate number of those cases in the test plan. The proportion of runs by crosswind speed and balked landing initiation height is indicated in Table 1.
Table 1: Initiation Height and Crosswind Test Values Crosswind (knots)
Initiation Height (ft) 0 10 18 21 23 25 Total 10 4% 8% 13% 2% 0% 6% 34% 40 3% 9% 8% 2% 6% 6% 35% 70 3% 8% 11% 0% 6% 3% 31%
Total 10% 26% 32% 5% 12% 15% 100%
For each run, we measured aircraft position and orientation variables 15 times per second to determine the relationship between the A380 wingtips and the FAA OFZ inner-transitional surface.
3.0 Test Results
Since the FAA OFZ inner-transitional surface is (at least partially) a sloping surface, the relationship between the A380 wingtip and the surface varies by height even if the wingtip does not deviate laterally. For this reason, we normalized the measure of the distance from the wingtip to the OFZ surface by defining a variable (S) whose value is the percent lateral deviation of the wingtip between its nominal position and the FAA OFZ inner-transitional surface. That is, S is the actual wingtip deviation from nominal divided by the possible wingtip deviation, where possible means the distance from the wingtip to the surface when the aircraft is on track in the nominal position. For example, if the aircraft’s lateral deviation from the nominal track is 0, the value of S is 0%. If the aircraft’s left (or right) wingtip is touching the surface, the value of S is 100%. If the wingtip is exactly halfway between the nominal position and the surface, the value of S is 50%.
4
Analysis of the Risk of an Airbus A380 Hand-Flown Balked Landing Penetrating the FAA Category I, Code E Obstacle-Free Zone
DOT-FAA-AFS-450-46 October 2008
Since the OFZ is a virtual surface and is not visible to the pilot, we used the same test data for each of the three OFZ configurations: the current configuration, the push-out modification, and the vertical cut modification.
For each OFZ configuration, we calculated values for S for each data point along the aircraft’s track starting with the initiation of the balked landing (taken to be when the throttle angle first exceeds 50°) and ending when the aircraft’s lower wingtip exceeded the 148-foot height of the sloping part of the inner-transitional surface (where the surface becomes horizontal) on its balked landing ascent. We then determined the maximum S value for each of the 313 balked landing runs.
For analysis purposes, the variables of interest from the test data for each run are then the maximum S value for the run, the crosswind speed, and the planned height at which the balked landing was initiated.
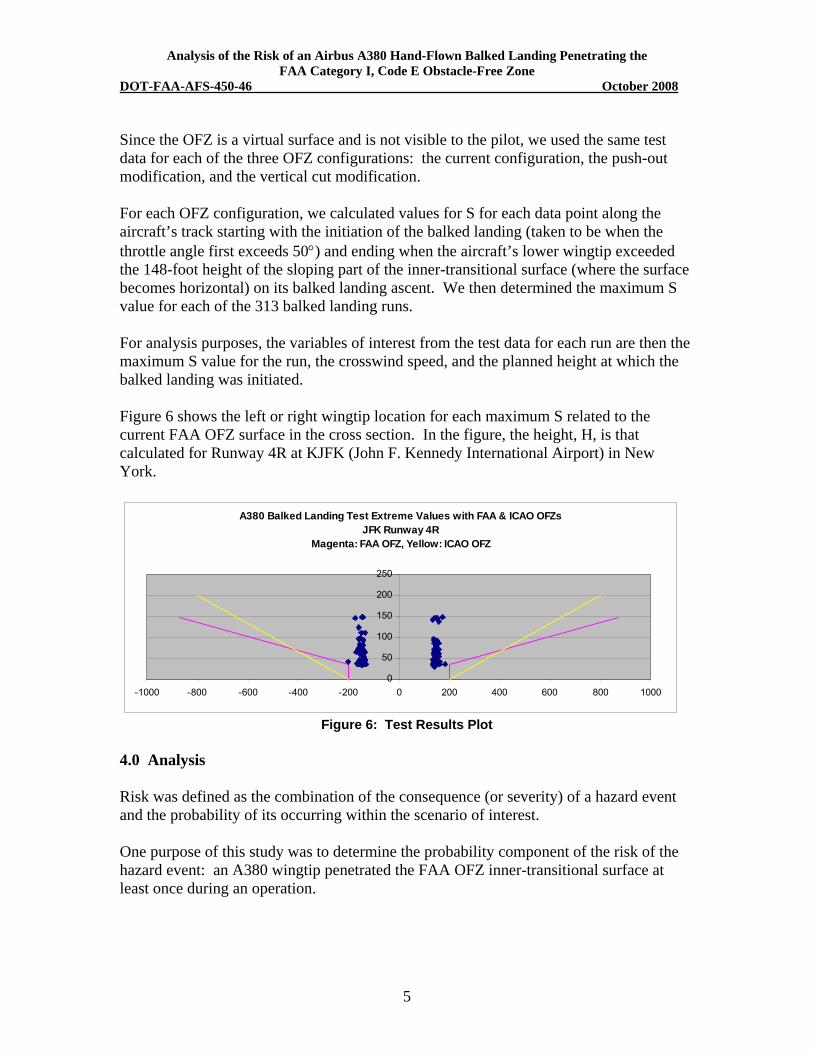
Figure 6 shows the left or right wingtip location for each maximum S related to the current FAA OFZ surface in the cross section. In the figure, the height, H, is that calculated for Runway 4R at KJFK (John F. Kennedy International Airport) in New York.
A380 Balked Landing Test Extreme Values with FAA & ICAO OFZs JFK Runway 4R
Magenta: FAA OFZ, Yellow: ICAO OFZ
250
200
150
100
50
0 -1000 -800 -600 -400 -200 0 200 400 600 800 1000
Figure 6: Test Results Plot
4.0 Analysis
Risk was defined as the combination of the consequence (or severity) of a hazard event and the probability of its occurring within the scenario of interest.
One purpose of this study was to determine the probability component of the risk of the hazard event: an A380 wingtip penetrated the FAA OFZ inner-transitional surface at least once during an operation.
5

Analysis of the Risk of an Airbus A380 Hand-Flown Balked Landing Penetrating the FAA Category I, Code E Obstacle-Free Zone
DOT-FAA-AFS-450-46 October 2008
Analysis Steps Here we established three results that we later combined to determine the probability component of the risk. First, we established a reasonable estimate for the likelihood of a balked landing. Second, we categorized the likelihood of balked landing by initiation height. Finally, we determined the probability of a balked landing at a given initiation height penetrating the FAA OFZ (both current and modified). Of the three results only the third depended on OFZ configuration. 1. The balked landing rate we used was less than 1.9 per 1,000 landing attempts: We compared go-around rates available from five European airports [2] and from a sample of Runway 14R at Chicago O’Hare airport [3] (see Table 2). These rates were consistently around 1.9 go-arounds per 1,000 attempted landings. However, while every balked landing is a go-around, not all go-arounds are balked landings. And since we had no data for actual balked landing rates, we used the go-around rate as an upper bound.
Table 2: Go-Around Rates Airport Year Approaches GA GA per Approach Approaches/GA LFPG 2003 257,475 691 2.68 E-03 373 LFPO 2003 103,248 150 1.45 E-03 688 LEBL 2002 135,268 200 1.48 E-03 676 LEBL 2003 140,275 237 1.69 E-03 592 LEMD 2002 183,727 279 1.52 E-03 659 LEMD 2003 189,173 369 1.95 E-03 513 LEPA 2002 80,305 145 1.81 E-03 554 LEPA 2003 84,387 139 1.65 E-03 607
Total 1,173,858 2,210 1.88 E-03 531
KORD 14R
1998-2000 43,960 84 1.91 E-03 523
2. Categorize balked landing rate by initiation height:
Figure 7 shows the graphical relationships among the three variables: S, crosswind speed, and initiation height. The colored surface is a smoothed surface created from the S means at each crosswind/height combination. The small circles represent actual S values at those crosswind/height coordinates.
The obvious conclusion from these data was that both higher crosswind speed and lower initiation height led to greater S values. (S values are plotted in the vertical axis in Figure 7.) We had no data relating actual balked landing rates to crosswind speed. However, we had data from several airlines relating actual balked landing rates to initiation height.
6

Figure 7: Crosswind and Initiation Height Relationship
Analysis of the Risk of an Airbus A380 Hand-Flown Balked Landing Penetrating the FAA Category I, Code E Obstacle-Free Zone
DOT-FAA-AFS-450-46 October 2008
Data provided to Airbus by five airlines [2] and validated by AFS-420 and AFS-450 gave detailed information on balked landing rates for 106,847 approaches. Table 3 and Table 4 summarize those data. The overall go-around rate is 1.6 per 1,000 attempted landings, which is slightly smaller than, but consistent with, the data above. And the proportion of go-arounds initiated at less than 50 feet is 7 per 169 or 0.04142.
7
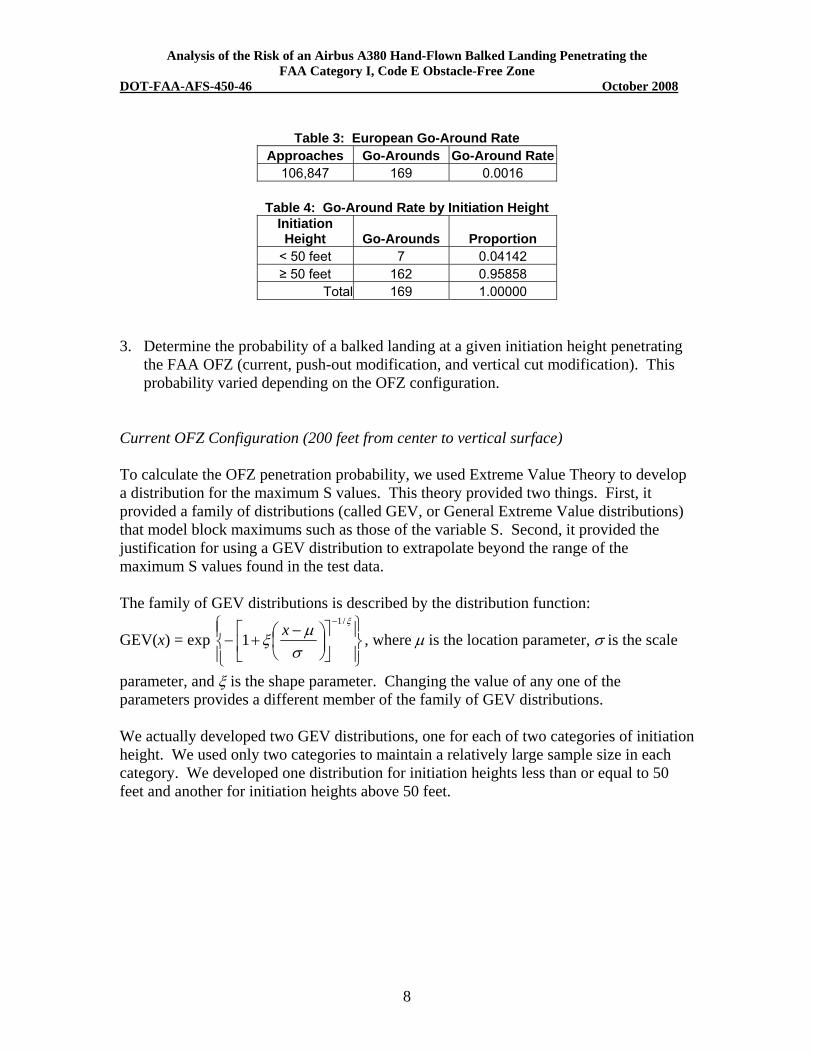
Table 3: European Go-Around Rate
Approaches Go-Arounds Go-Around Rate 106,847 169 0.0016
Table 4: Go-Around Rate by Initiation Height Initiation Height Go-Arounds Proportion
< 50 feet 7 0.04142 ≥ 50 feet 162 0.95858
Total 169 1.00000
Analysis of the Risk of an Airbus A380 Hand-Flown Balked Landing Penetrating the FAA Category I, Code E Obstacle-Free Zone
DOT-FAA-AFS-450-46 October 2008
3. Determine the probability of a balked landing at a given initiation height penetrating the FAA OFZ (current, push-out modification, and vertical cut modification). This probability varied depending on the OFZ configuration.
Current OFZ Configuration (200 feet from center to vertical surface)
To calculate the OFZ penetration probability, we used Extreme Value Theory to develop a distribution for the maximum S values. This theory provided two things. First, it provided a family of distributions (called GEV, or General Extreme Value distributions) that model block maximums such as those of the variable S. Second, it provided the justification for using a GEV distribution to extrapolate beyond the range of the maximum S values found in the test data.
The family of GEV distributions is described by the distribution function:
, where μ is the location parameter, σ is the scale 1/
xGEV(x) = exp ⎡⎢⎣1
parameter, and ξ is the shape parameter. Changing the value of any one of the parameters provides a different member of the family of GEV distributions.
We actually developed two GEV distributions, one for each of two categories of initiation height. We used only two categories to maintain a relatively large sample size in each category. We developed one distribution for initiation heights less than or equal to 50 feet and another for initiation heights above 50 feet.
⎫⎪⎬⎪⎭
ξ−⎤ ⎥⎦⎟⎠σ ⎞μ−⎛
⎜⎝ξ+−
⎧⎪⎨⎪⎩
8

We chose the break at 50 feet to balance the number of runs below and above the break in the test data with the number below and above in the Airbus airline data1. We used the test data and a standard extreme value technique (extreme value maximum likelihood estimation) to estimate the three parameter values for each of the two specific distributions that fit our data. For initiation heights less than or equal to 50 feet, case 1, the parameter values the estimation technique yields are: μ = 7.9065, σ = 6.2897, and ξ = 0.3656 with standard errors 0.5126, 0.4516, and 0.0786, respectively. We called this distribution GEV1. For initiation heights above 50 feet, case 2, the parameter values the estimation technique yields are: μ = 4.2574, σ = 2.5920, and ξ = 0.0161 with standard errors 0.3039, 0.2231, 0.0824, respectively. We called this distribution GEV2. We estimated the probability that S > 100%, given that a hand-flown balked landing has been attempted under this scenario by calculating the area under each GEV density function (GEV1 and GEV2 for cases 1 and 2, respectively) to the right of 100, multiplying each of these areas by the probability of each case occurring given a balked landing has occurred. Table 5 summarizes the calculation.
Table 5: Current OFZ Configuration
Case Initiation Height Penetration Probability
Given Case 1 ≤ 50 feet 6.3 E-03 2 > 50 feet 2.7 E-13
Analysis of the Risk of an Airbus A380 Hand-Flown Balked Landing Penetrating the FAA Category I, Code E Obstacle-Free Zone
DOT-FAA-AFS-450-46 October 2008
The 313 flight simulator test runs used three airports: John F. Kennedy International Airport (KJFK), Denver International Airport (KDEN), and Benito Juárez International Airport in Mexico City, Mexico (KMEX). The results here assumed the environmental conditions at those locations. Also, the values for the height, H, (see Figure 1) varied because of the differences in elevation of the three airports. The value of H decreases when the Mean Sea Level altitude increases. Therefore, the KJFK altitude (4 feet MSL) provided the greatest value for H.
To compare results using a uniformly high value for H, we analyzed the KJFK runs separately. The resultant penetration probabilities given a balked landing for the KJFK
1 We tested break values of both 40 and 60 feet also and obtained results similar to those using a 50-foot break (about 6.4 E-03 for 40 and 60 versus 6.3 E-03 for 50 feet). Note that for a break of 50 feet there were only 7 data points (out of 169) below in the Airbus airline data, but there were 219 (out of 313) below in the test run data.
9

runs were 3.9 E-03 for initiation heights less than 50 feet and 0.0 for initiation heights greater than or equal to 50 feet. This value is slightly smaller than the total resultant probability calculated here: 6.3 E-03 and 2.7 E-13, respectively (see Table 5). This led us to conclude that the results were not effectively biased by lower values of H at the higher altitude airports in the study.
Push-Out OFZ Configuration (225 feet from center to vertical surface, same H)
We also developed two GEV distributions for the push-out modified OFZ configuration, one for each of two categories of initiation height. We again developed one distribution for initiation heights less than or equal to 50 feet and another for initiation heights above 50 feet.
We used the test data and a standard extreme value technique (extreme value maximum likelihood estimation) to estimate the three parameter values for each of the two specific distributions that fit our data.
For initiation heights less than or equal to 50 feet, case 1, the parameter values the estimation technique yields are:
μ = 6.7398, σ = 4.9712, and ξ = 0.2577 with standard errors 0.3989, 0.3310, and 0.0712, respectively. We called this distribution GEV1.
For initiation heights above 50 feet, case 2, the parameter values the estimation technique yields are:
μ = 3.9503, σ = 2.3544, and ξ = -0.0105 with standard errors 0.2759, 0.2009, and 0.0819, respectively. We called this distribution GEV2.
We again estimated the probability that S > 100%, given that a hand-flown balked landing had been attempted by calculating the area under each GEV density function (GEV1 and GEV2 for cases 1 and 2, respectively) to the right of 100, multiplying each of these areas by the probability of each case occurring given a balked landing has occurred. Table 6 summarizes the calculation.
Table 6: Push-Out OFZ Configuration
Case Initiation Height Penetration Probability
Given Case 1 ≤ 50 feet 1.1 E-03 2 > 50 feet 0.0 E-00
Analysis of the Risk of an Airbus A380 Hand-Flown Balked Landing Penetrating the FAA Category I, Code E Obstacle-Free Zone
DOT-FAA-AFS-450-46 October 2008
10

Vertical Cut OFZ Configuration (225 feet from center to vertical, higher H)
We also developed two GEV distributions for the vertical cut modified OFZ configuration, one for each of two categories of initiation height. We again developed one distribution for initiation heights less than or equal to 50 feet and another for initiation heights above 50 feet.
We used the test data and a standard extreme value technique (extreme value maximum likelihood estimation) to estimate the three parameter values for each of the two specific distributions that fit our data.
For initiation heights less than or equal to 50 feet, case 1, the parameter values the estimation technique yields are:
μ =7.6394, σ =5.6578, and ξ =0.2374 with standard errors 0.4544, 0.3734, and 0.0708, respectively. We called this distribution GEV1.
For initiation heights above 50 feet, case 2, the parameter values the estimation technique yields are:
μ = 3.9503, σ = 2.3544, and ξ = -0.0105 with standard errors 0.2759, 0.2009, and 0.0819, respectively. We called this distribution GEV2.
We again estimated the probability that S > 100%, given that a hand-flown balked landing had been attempted by calculating the area under each GEV density function (GEV1 and GEV2 for cases 1 and 2, respectively) to the right of 100, multiplying each of these areas by the probability of each case occurring given a balked landing has occurred. Table 7 summarizes the calculation.
Table 7: Vertical Cut OFZ Configuration
Case Initiation Height Penetration Probability
Given Case 1 ≤ 50 feet 1.3 E-03 2 > 50 feet 2.7 E-13
Analysis of the Risk of an Airbus A380 Hand-Flown Balked Landing Penetrating the FAA Category I, Code E Obstacle-Free Zone
DOT-FAA-AFS-450-46 October 2008
Analysis Conclusion
To determine the probability of an aircraft on approach penetrating either the current or a modified OFZ during a balked landing, we combined the three preliminary results. For each initiation height case, we multiplied the proportion of balked landings by the penetration probability. Then we added the probabilities for these two cases and multiplied the result by the probability of a balked landing. Table 8 summarizes these results for the current OFZ configuration. Table 9 summarizes the results for the push-out OFZ configuration. Table 10 summarizes the results for the vertical cut OFZ configuration.
11

Table 8: Current OFZ Configuration Case
Case Initiation Height
Proportion Given
Balked Landing
Penetration Probability
Given Case
Resultant Probability
Given Balked Landing
Probability of Balked
Landing
Penetration Probability for an Approach
1 ≤ 50 feet 7/169 = 0.04142 6.3 E-03 2.6 E-04
1.9 E-03
5.0 E-07
2 > 50 feet 162/169 = 0.95858 2.7 E-13 2.6 E-13
Total (Both Cases) 2.6 E-04
Table 9: Push-Out OFZ Configuration Case Resultant
Case Initiation Height
Proportion Given
Balked Landing
Penetration Probability
Given Case
Probability Given
Balked Landing
Probability of Balked
Landing
Penetration Probability for
an Approach
1 ≤ 50 feet 7/169 = 0.04142 1.1 E-03 4.6 E-05
1.9 E-03
8.7 E-08
2 > 50 feet 162/169 = 0.95858 2.7 E-13 2.6 E-13
Total (Both Cases) 4.6 E-05
Table 10: Vertical Cut OFZ Configuration Case Resultant
Initiation Case Height
1 ≤ 50 feet
2 > 50 feet
Proportion Probability Given Penetration Given Probability
Balked Probability Balked of Balked Landing Given Case Landing Landing 7/169 = 1.26 E-03 5.2 E-05 0.04142
162/169 = 2.7 E-13 2.6 E-13 0.95858 Total (Both Cases) 5.2 E-05 1.9 E-03
Penetration Probability for
an Approach
9.9 E-08
Analysis of the Risk of an Airbus A380 Hand-Flown Balked Landing Penetrating the FAA Category I, Code E Obstacle-Free Zone
DOT-FAA-AFS-450-46 October 2008
12

Analysis of the Risk of an Airbus A380 Hand-Flown Balked Landing Penetrating the FAA Category I, Code E Obstacle-Free Zone
DOT-FAA-AFS-450-46 October 2008
5.0 Conclusion
We estimated the probability of FAA Category I, Code E OFZ penetration for hand-flown approaches for both the current OFZ configuration and the two modified OFZ configurations. Table 11 summarizes the results. The probabilities shown represent OFZ penetration probability for a manual approach operation. While the current OFZ configuration probability (5.0 E-07) is greater than 1.0 E-07, each of the modified OFZ configuration probabilities (8.7 E-08 and 9.9 E-08) is less than 1.0 E-07.
Table 11: Penetration Probability by OFZ Type
OFZ Configuration Penetration Probability Current 5.0 E-07
Push-Out 8.7 E-08 Vertical Cut 9.9 E-08
13
Analysis of the Risk of an Airbus A380 Hand-Flown Balked Landing Penetrating the FAA Category I, Code E Obstacle-Free Zone
DOT-FAA-AFS-450-46 October 2008
Appendix:
Introduction
This section describes a flight simulator test to explore Airbus A340 and A380 flight simulator lateral and vertical trajectories resulting from crew initiated balked landings beneath the Category I (Cat I) Decision Height/Altitude (DH/A) at heights specified by the plan. An earlier evaluation was conducted using the Airbus A340 flight simulator as a surrogate for the A380 to provide data for establishing Obstacle Free Zone (OFZ) requirements for the A380. For this data to be applied toward establishing the A380 OFZ, it was necessary for the A340 data to be validated as adequately representing the A380 during a balked landing. This section outlines the test performed to determine the validity of the A340 data.
The balked landings were performed from test procedures flown as Category I Instrument Landing System (ILS) instrument approaches during transition to a landing. The approaches were flown primarily in autopilot mode with a small sample flown in manual mode.
Background
FAA Advisory Circular 150/5300-13, “Airport Design Standards-Transport Airports, and ICAO Annex 14, Aerodromes,” prescribes runway design dimensions for various elements affecting runway utilization including runway obstruction clearance, shoulders, blast pads, clear ways, runway safety areas, etc., for large air carrier aircraft.
The runway elements and OFZ dimensions are referenced to aircraft/airplane design grouping from Code A to Code F (ICAO) or Group I to Group VI (U.S.) based on wingspan. Code E (or Group V) includes aircraft with wingspans up to 65 meters, which accommodates the Boeing 747 and Airbus A340 families. Code F (or Group VI) accounts for wingspans up to 80 meters, which includes the Airbus A380.
OFZ dimensions calculated for Code F (Group VI) aircraft are based solely on the physical dimensions of the aircraft. The OFZ calculation inherently assumes approach performance typical of the overall fleet including pre-digital autopilots and conventional control systems. However, superior track holding performance has been documented for the current generation of aircraft with modern autopilot and control systems. The enhanced avionics capabilities of these aircraft are expected to produce substantially better runway aligned tracking performance than conventional aircraft on which current OFZ dimensions have been based. Due to improved engine technology, modern air carrier aircraft also tend to have better climb performance quickly placing them above the OFZ surfaces on initiation of a balked landing.
14

Analysis of the Risk of an Airbus A380 Hand-Flown Balked Landing Penetrating the FAA Category I, Code E Obstacle-Free Zone
DOT-FAA-AFS-450-46 October 2008
The significant amount of data obtained in previous tests using the A340 has been used by the FAA to analyze the OFZ required for the A380. To finalize guidance regarding the A380 OFZ dimensions, it was necessary to validate the A340 data as representative of the A380 aircraft during a balked landing.
Test Objective and Methodology
The test objective was to determine whether the A340 simulator data used to measure FAA OFZ safety may be used in place of A380 simulator data.
The test compared data from A380 and A340 simulator runs using scenarios similar to those used to measure FAA OFZ safety. Using A340 and A380 aircraft flight simulators, flight track, height loss, and other relevant data were collected for balked landings at a representative air carrier airport (JFK) under Category I weather and flight conditions. The test used the same crews and the identical conditions of wind, weather, and other flight conditions for both aircraft simulators. The test compared the behavior of the simulators using simulator output data relevant to potential OFZ penetration. The test focused on the autopilot data, but it also collected Flight Director data. It used primary and secondary metrics.
There were two primary metrics:
• Maximum lateral deviations (for aircraft heights between 0 and 100 feet) • Mean OFZ vertical exposure slope (i.e., the slope of the vertical aircraft track
between track minimum and 75 feet above that minimum)
Combined, these metrics were used to measure exposure of the autopilot-guided aircraft to the OFZ surfaces.
There were six secondary metrics:
• Height loss (from initiation of the balked landing to the minimum height) • Roll rate mean and standard deviation (for aircraft heights between 0 and 100
feet) • Maximum roll angle, phi (for aircraft heights between 0 and 100 feet) • Maximum yaw angle, psi (for aircraft heights between 0 and 100 feet) • Minimum height above runway • Maximum S (S is defined as (y – w) / w, where y is the actual wingtip distance to
the OFZ, and w is the nominal wingtip distance to the OFZ)
These secondary metrics were used to confirm the results obtained in the analysis of the primary metrics.
15

Test Results
Primary Metric 1
We used two statistical tests to measure the relationship between the maximum lateral deviations of the two simulators. The criterion for success was that the performance of the A380 simulator be no worse than that of the A340. Specifically, the A380 simulator maximum lateral deviations should be no greater than those of the A340 simulator.
Test 1: Student’s t-Test
We used a t-test to determine whether the A380 simulator maximum lateral deviations were no greater than those of the A340 simulator under autopilot guidance. The results showed that they were not greater. This result indicated success based upon the criterion.
The details of the t-test showed that the mean maximum lateral deviation of the A380 simulator could not be shown to be greater than that of the A340 based on the data collected.
Table A.1: Maximum Lateral Deviation t-Test Results A340 Mean/SD2 A380 Mean/SD t-value p-value3
-2.74/16.7 0.07/12.9 -1.02 0.31
Test 2: Cumulative Probabilities
We compared the cumulative probabilities of the simulated aircraft deviating laterally to the left or right by more than 50 feet. We used 50 feet because a deviation of that size could have placed the relevant A380 wing tip very near (within 20 feet of) the vertical OFZ surface.
The details of the comparison showed that the probability of deviation (left or right) by more than 50 feet were much greater for the A340 simulator than for the A380 simulator. This result also indicated success based on the criterion.
Table A.2: Lateral Deviation Cumulative Probability Results A340
Probability < -50' A340
Probability > 50' A380
Probability < -50' A380
Probability > 50' 0.0080
0.0008 0.00005 0.00005
Analysis of the Risk of an Airbus A380 Hand-Flown Balked Landing Penetrating the FAA Category I, Code E Obstacle-Free Zone
DOT-FAA-AFS-450-46 October 2008
2 SD denotes standard deviation, a measure of variation in the deviations. 3 Small p-values (typically less than 0.05) indicate a significant difference in the A340 and A380 values measured. Larger p-values indicate no significant difference.
16
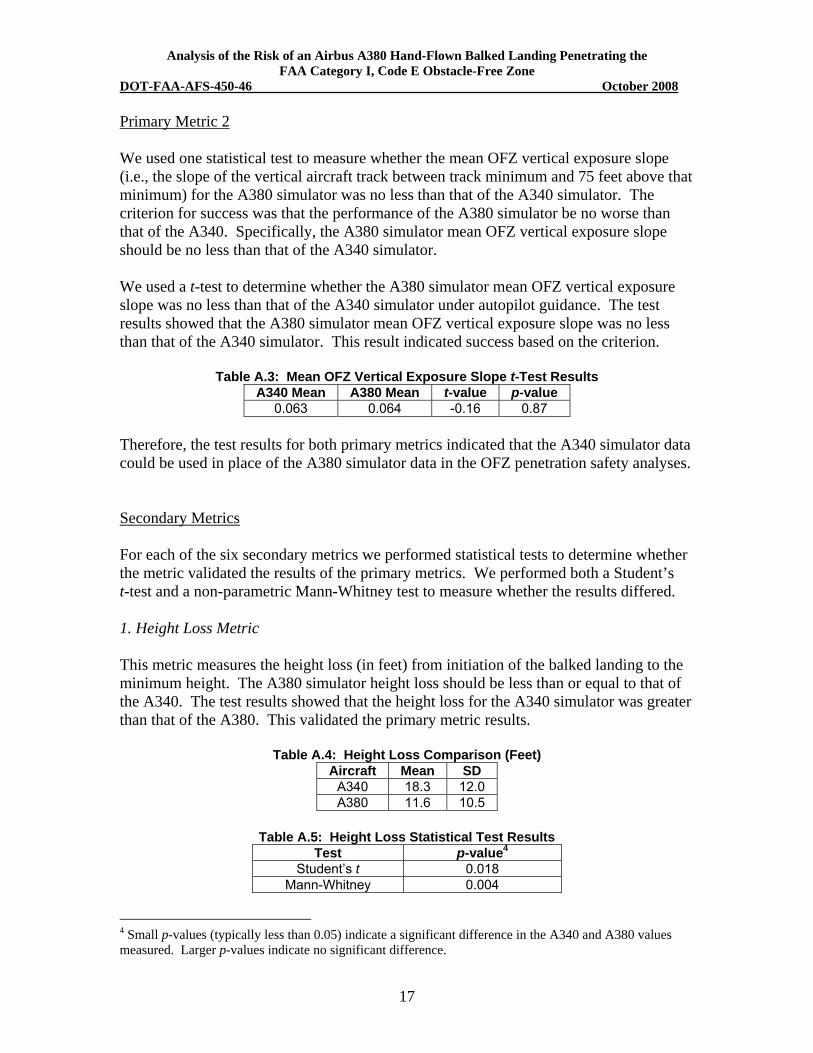
Primary Metric 2
We used one statistical test to measure whether the mean OFZ vertical exposure slope (i.e., the slope of the vertical aircraft track between track minimum and 75 feet above that minimum) for the A380 simulator was no less than that of the A340 simulator. The criterion for success was that the performance of the A380 simulator be no worse than that of the A340. Specifically, the A380 simulator mean OFZ vertical exposure slope should be no less than that of the A340 simulator.
We used a t-test to determine whether the A380 simulator mean OFZ vertical exposure slope was no less than that of the A340 simulator under autopilot guidance. The test results showed that the A380 simulator mean OFZ vertical exposure slope was no less than that of the A340 simulator. This result indicated success based on the criterion.
Table A.3: Mean OFZ Vertical Exposure Slope t-Test Results A340 Mean A380 Mean t-value p-value
0.063 0.064 -0.16 0.87
Therefore, the test results for both primary metrics indicated that the A340 simulator data could be used in place of the A380 simulator data in the OFZ penetration safety analyses.
Secondary Metrics
For each of the six secondary metrics we performed statistical tests to determine whether the metric validated the results of the primary metrics. We performed both a Student’s t-test and a non-parametric Mann-Whitney test to measure whether the results differed.
1. Height Loss Metric
This metric measures the height loss (in feet) from initiation of the balked landing to the minimum height. The A380 simulator height loss should be less than or equal to that of the A340. The test results showed that the height loss for the A340 simulator was greater than that of the A380. This validated the primary metric results.
Table A.4: Height Loss Comparison (Feet) Aircraft Mean SD
A340 18.3 12.0 A380 11.6 10.5
Table A.5: Height Loss Statistical Test Results Test p-value4
Student’s t 0.018Mann-Whitney 0.004
Analysis of the Risk of an Airbus A380 Hand-Flown Balked Landing Penetrating the FAA Category I, Code E Obstacle-Free Zone
DOT-FAA-AFS-450-46 October 2008
4 Small p-values (typically less than 0.05) indicate a significant difference in the A340 and A380 values measured. Larger p-values indicate no significant difference.
17

2. Roll Rate Metric
This metric measures the roll rate (radians per second) mean and standard deviation for aircraft heights between 0 and 100 feet. The A380 simulator roll rates should not differ significantly from those of the A340. The test results showed that this was the case. This validated the primary metric results.
.6: Roll Rate Comparison (Radians per Second) Table AAircraft Mean SD
A340 -0.0003 0.0016 A380 -0.0076 0.0987
Table A.7: Roll Rate Statistical Test Result Test p-value
Student’s t 0.61 Mann-Whitney 0.57
3. Roll Angle Metric
This metric measures the maximum roll angle, phi, for aircraft heights between 0 and 100 feet. The A380 simulator roll angles should not differ significantly from those of the A340. The test results showed that the A380 roll angle was slightly greater than that of the A340. While this validated the primary metric results, it did not invalidate the overall results since the aircraft typically roll away from the nearest OFZ surface.
Table A.8: Roll Angle Comparison Aircraft Mean SD
A340 1.52º 1.18º A380 2.01º 1.06º
Table A.9: Roll Angle Statistical Test Results Test p-value
Student’s t 0.072 Mann-Whitney 0.005
Analysis of the Risk of an Airbus A380 Hand-Flown Balked Landing Penetrating the FAA Category I, Code E Obstacle-Free Zone
DOT-FAA-AFS-450-46 October 2008
18

4. Yaw Angle Metric
This metric measures the maximum yaw angle, psi, for aircraft heights between 0 and 100 feet. The A380 simulator yaw angles should not differ significantly from those of the A340. The test results showed that this was the case. This validated the primary metric results.
Table A.10: Yaw Angle Comparison Aircraft Mean SD
A340 33.0º 8.5º A380 32.0º 7.7º
Table A.11: Yaw Angle Statistical Test Results Test p-value
Student’s t 0.60 Mann-Whitney 0.89
5. Height Above Runway Metric
This metric measures the minimum height above runway (in feet) during the balked landing. The A380 simulator minimum heights should not differ significantly from those of the A340. The test results showed that this was the case. This validated the primary metric results.
Table A.12: Minimum Height Above Runway Comparison (Feet) Aircraft Mean SD
A340 25.0 6.27 A380 23.8 8.10
Table A.13: Minimum Height Above Runway Statistical Test Results Test p-value
Student’s t 0.48 Mann-Whitney 0.08
Analysis of the Risk of an Airbus A380 Hand-Flown Balked Landing Penetrating the FAA Category I, Code E Obstacle-Free Zone
DOT-FAA-AFS-450-46 October 2008
19

OFZ Penetration Ratio Metric
This metric measures the maximum penetration ratio parameter value5, S. S is defined as (y – w) / w, where y is actual wingtip distance to the OFZ, and w is nominal wingtip distance to OFZ.
The A380 simulator ratios (S) should not differ significantly from those of the A340. The test results showed that this was the case. This validated the primary metric results.
Table A.14: S Comparison Aircraft Mean SD
A340 8.47 4.27 A380 8.45 3.54
Analysis of the Risk of an Airbus A380 Hand-Flown Balked Landing Penetrating the FAA Category I, Code E Obstacle-Free Zone
DOT-FAA-AFS-450-46 October 2008
6.
Table A.15: S Statistical Test Results Test p-value
Student’s t 0.98 Mann-Whitney 0.74
Overall, the secondary metric results validated those of the primary metrics.
5 S is a dimensionless ratio.
20
Analysis of the Risk of an Airbus A380 Hand-Flown Balked Landing Penetrating the FAA Category I, Code E Obstacle-Free Zone
DOT-FAA-AFS-450-46 October 2008
References
[1] FAA Advisory Circular 150/5300-13 CHG 8, “Airport Design”. pp. 22-23. October 30, 2004.
[2] Airbus Communication (letter) to AFS-440. “Balked Landing A380.” Willy-Pierre DuPont and Jaime SanMarti Gorbs, Airbus A380 Airport Compatibility Department (BNEJ). January 9, 2006.
[3] Greenhaw, Richard and David Lankford. Go Around Rates for Land and Hold Short Operations. DOT-FAA-AFS-420-93. March 2003.
21