Embed Size (px)
Citation preview

Energy Procedia 48 ( 2014 ) 172 – 180
Available online at www.sciencedirect.com
ScienceDirect
1876-6102 © 2014 The Authors. Published by Elsevier Ltd. Selection and peer review by the scientifi c conference committee of SHC 2013 under responsibility of PSE AGdoi: 10.1016/j.egypro.2014.02.022
SHC 2013, International Conference on Solar Heating and Cooling for Buildings and Industry September 23-25, 2013, Freiburg, Germany
Analysis of the overheating and stagnation problems of solar thermal installations
Pedro V. Quilesa, Francisco J. Aguilara, Simón Aledob aUniversity Miguel Hernández, Avda. Universidad S/N, Elche 03202, Spain
bProinter, S.L., C/ Nicolás de Buss, 30, Elche 03320, Spain
Abstract
This report illustrates the experimental data associated with solar overheating. The experimental data has validated an analytical model which allows for the study of the influences a primary circuit’s design has on the overheating of the solar tank. Secondly, the report includes a study of the stagnation in a solar facility. The evolution of the temperature in the hydraulic circuit by means of its measurement at 30 different points, together with the data of the pressure and flow, allow for the real behavior of the solar installation in stagnation conditions to be investigated. Finally, the study shows the measurements obtained on a solar thermal installation located in Alicante (southern Spain). Every installation has been monitored for several months and the main temperatures and pressures around the solar circuit have been noted. The measurements and their processing have allowed for the detection of overheating and stagnation problems in real operating conditions. © 2014 The Authors. Published by Elsevier Ltd. Selection and peer review by the scientific conference committee of SHC 2013 under responsibility of PSE AG.
Keywords: Overheating; Stagnation; Solar energy
1. Introduction
A rational use of energy brings both economic and environmental benefits, by reducing consumption of fossil fuels, electricity and pollutant emissions. In this sense, solar energy allows for the production of thermal and electrical energy using solar irradiance, without CO2 emissions. Thus, this paper presents an experimental study about the performance of solar thermal installations.
The main problems detected in solar thermal installations are overheating and stagnation, which are also the most important factors in determining an installation’s useful life. This is due to the high temperatures during high solar
© 2014 The Authors. Published by Elsevier Ltd. Selection and peer review by the scientific conference committee of SHC 2013 under responsibility of PSE AG
Pedro V. Quiles et al. / Energy Procedia 48 ( 2014 ) 172 – 180 173
irradiance conditions. As is exposed in [1] the temperature of a thermal fluid during stagnation can be reach up to and beyond 180ºC. Many of the installation’s components are made of plastic, so these temperatures must be limited.
The overheating of solar thermal installations occurs when the solar energy absorbed by a solar collector exceeds the capability of its heat transfer fluid circuit to adequately cool it, resulting in excessive temperatures. This phenomenon is most common when there is a low energy demand. This situation is most severe when the flow of the heat transfer fluid through the collector is interrupted due to power outages or component failures leading to the production of stagnations.
In the literature different methods are proposed to control the energy flux in flat-plate collectors. In [2] several strategies for control of temperature in solar collector are exposed. In [3] prismatic structures in a thermal solar collector are used as overheating protection. Finally, in [4] the capability of thermotropic layers to provide overheating protection in an all polymeric flat-plate collector is studied applying theoretical modeling
This paper shows the results of an experimental study on the overheating and stagnation of a solar thermal system in both laboratory and field conditions.
Finally, the study shows the measurements obtained on a solar thermal installation located in Alicante (southern Spain): a solar thermal system designed to heat water in a hospital. The results of this study show how the solar installations reach overheating and stagnation conditions very often. Thus their efficiency is much lower than expected.
2. Methods
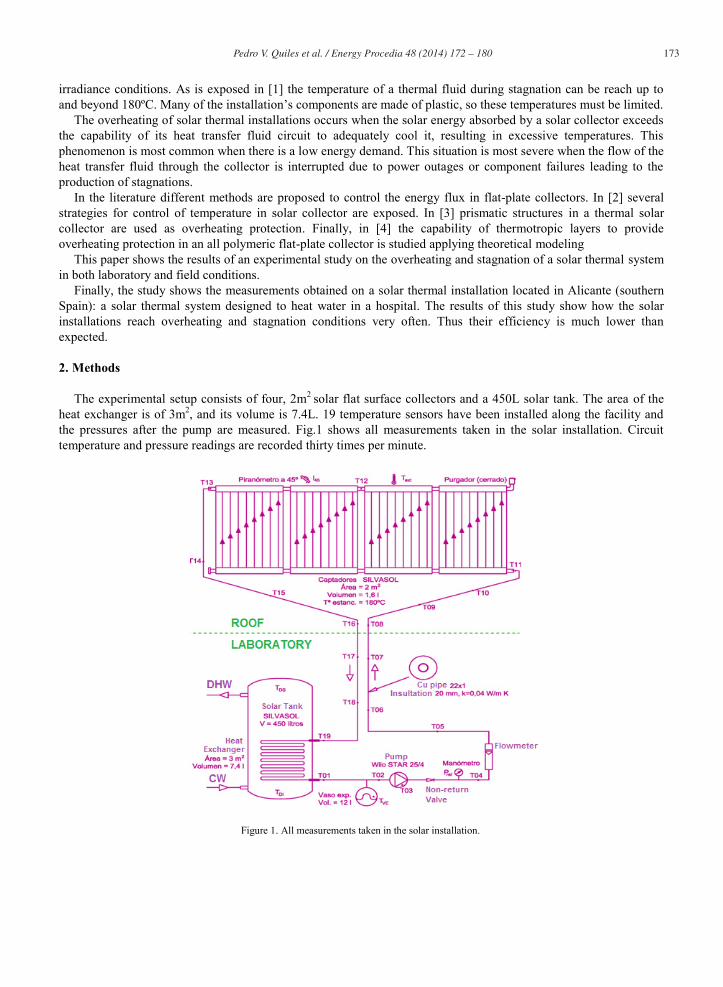
The experimental setup consists of four, 2m2 solar flat surface collectors and a 450L solar tank. The area of the heat exchanger is of 3m2, and its volume is 7.4L. 19 temperature sensors have been installed along the facility and the pressures after the pump are measured. Fig.1 shows all measurements taken in the solar installation. Circuit temperature and pressure readings are recorded thirty times per minute.
Figure 1. All measurements taken in the solar installation.
174 Pedro V. Quiles et al. / Energy Procedia 48 ( 2014 ) 172 – 180
3. Results
3.1. Analysis of the overheating
As mentioned above, any solar thermal installation, even those which do not have any failure in performance or design, can achieve periods of overheating without heat demand. To carry out the analysis 7 new temperature probes were used, all of which were installed in the solar storage tank at 200 mm centres.
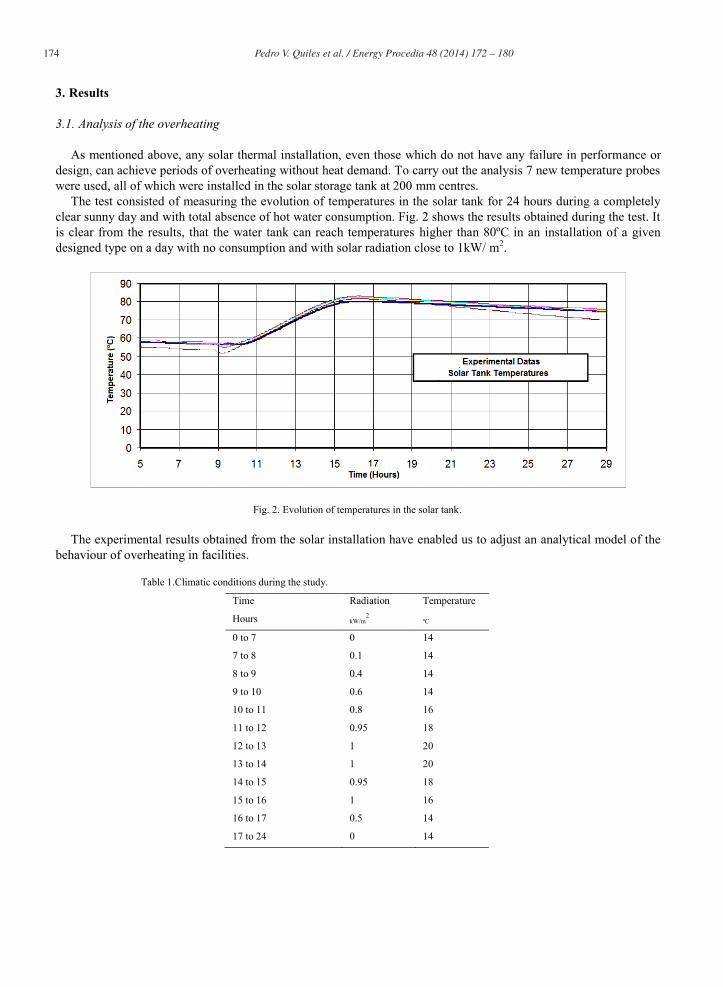
The test consisted of measuring the evolution of temperatures in the solar tank for 24 hours during a completely clear sunny day and with total absence of hot water consumption. Fig. 2 shows the results obtained during the test. It is clear from the results, that the water tank can reach temperatures higher than 80ºC in an installation of a given designed type on a day with no consumption and with solar radiation close to 1kW/ m2.
Fig. 2. Evolution of temperatures in the solar tank.
The experimental results obtained from the solar installation have enabled us to adjust an analytical model of the behaviour of overheating in facilities.
Table 1.Climatic conditions during the study.
Time
Hours
Radiation
kW/m2
Temperature
ºC
0 to 7 0 14
7 to 8 0.1 14
8 to 9 0.4 14
9 to 10 0.6 14
10 to 11 0.8 16
11 to 12 0.95 18
12 to 13 1 20
13 to 14 1 20
14 to 15 0.95 18
15 to 16 1 16
16 to 17 0.5 14
17 to 24 0 14
Pedro V. Quiles et al. / Energy Procedia 48 ( 2014 ) 172 – 180 175
Using the analytical model developed; several simulations on the evolution of the solar water tank’s temperature have been conducted, this was done on 5 clear days where there was no consumption of DHW. The calculations have been made based on data of the radiation above the plane of the solar collector and the ambient temperature on a sunny day of March (Table 1). The simulations began at 7:00pm with the water tank at 30°C.
From the yield curve of the solar collector, described in Eq.1, the energy supplied from the solar collectors to the primary fluid on an hourly basis can be obtained.
*10 Tkk (1)
Being 0k the optical factor, 1k the loss factor and *T the temperature reduced to the average temperature of the solar collector.
The losses in the primary circuit are important when determining the solar installation’s useful energy. For a primary circuit of 20m of piping length, the losses are 4W/°C.
Once the solar tank temperature and the temperature of the surrounding environment is known, energy losses are calculated with regard to the solar storage to date. The loss in the solar tank considered was 2W/°C, with the collector in a closed area at 22°C.
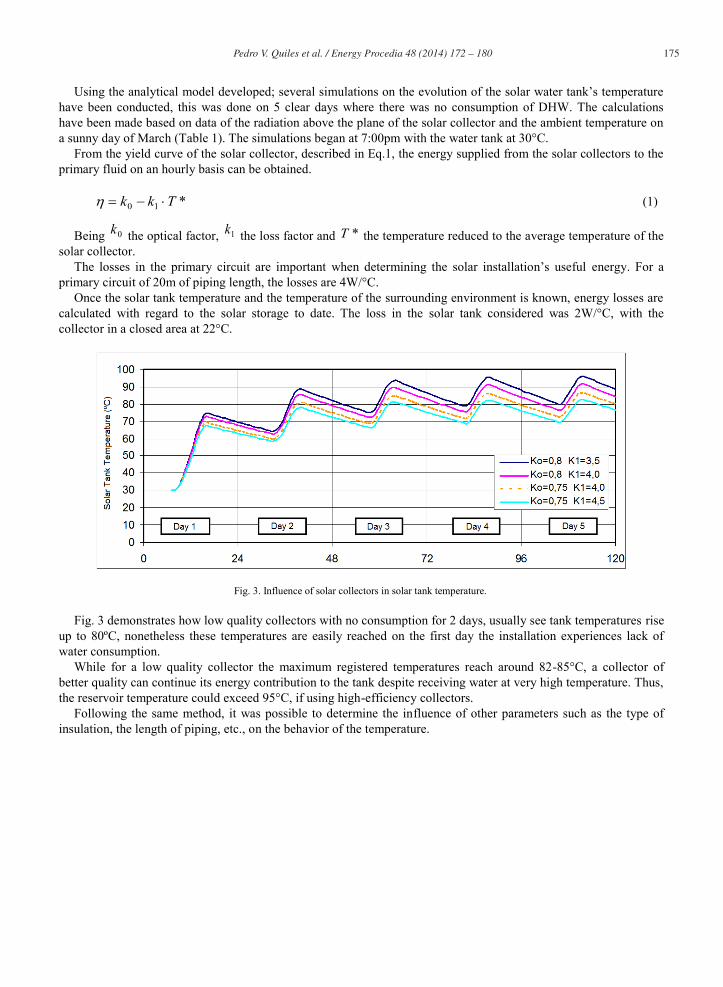
Fig. 3. Influence of solar collectors in solar tank temperature.
Fig. 3 demonstrates how low quality collectors with no consumption for 2 days, usually see tank temperatures rise up to 80ºC, nonetheless these temperatures are easily reached on the first day the installation experiences lack of water consumption.
While for a low quality collector the maximum registered temperatures reach around 82-85°C, a collector of better quality can continue its energy contribution to the tank despite receiving water at very high temperature. Thus, the reservoir temperature could exceed 95°C, if using high-efficiency collectors.
Following the same method, it was possible to determine the influence of other parameters such as the type of insulation, the length of piping, etc., on the behavior of the temperature.

176 Pedro V. Quiles et al. / Energy Procedia 48 ( 2014 ) 172 – 180
Fig. 4. Influence of the insulation of the tank in the solar tank temperature.
Fig. 5. Influence of the length of pipe in the solar tank temperature.
Fig. 6. Influence of the volume of tank in the solar tank temperature.

Pedro V. Quiles et al. / Energy Procedia 48 ( 2014 ) 172 – 180 177
3.2. Analysis of the stagnation
The analysis of the stagnation has been realized using the experimental setup described on this paper. The test was made during sunny April days, when the irradiance was high and the sun was at its highest position.
As the pump stops, the water temperature in the top of the collectors increases by around 4 to 6ºC per minute. So, in all installations, the upper part of the collectors reach 120ºC within 10-15 minutes and steam bubbles appear in the collector.
The characteristics of the stagnation change gravely depend of the design of the primary circuit. The relative position between the expansion tank and the non-return valve is extremely important and should be considered. If the steam expansion increases through the return pipe, the collectors lose the water slowly; this is called “slow draining”. When the steam is locked in the top of the collectors - pushing the water through the cold water pipe - it is called “fast draining”.
Stagnation with “slow draining”
Fig. 7 shows the stagnation when the expansion tank is installed behind the non-return valve. As mentioned, this
stagnation is called “slow draining”.
Fig. 7. Measurements taken and stagnation with “slow draining”.
Before stopping the pump, the temperature in the solar tank was 60ºC, with supply temperature registering at 64ºC and the return temperature at 70ºC. When the pump stops the irradiance in the collector plane is 970W/m2. 10
178 Pedro V. Quiles et al. / Energy Procedia 48 ( 2014 ) 172 – 180
minutes later, the pressure increases and the average temperature in the top of the collectors is 110ºC. After 30 minutes, the pressure reaches 4.2 bar (rel.) and the temperature hits 144ºC.
Fig. 7 shows all the measurements taken 60 minutes after the stopping of the pump. During the stagnation period, the temperature in the pipe between the collectors and the solar tank that contains the steam is 150 ºC.
The initial and final pressures are known (Pm=3 bar, PM=6.3 bar) (absolute). The steam volume is calculated as 11.3L.5.6L of steam are in the return pipe, while 5.7L are inside the collectors. It is possible to say that at the end of the stagnation there is 80-85% steam inside the collectors while 10-15% is liquid water.
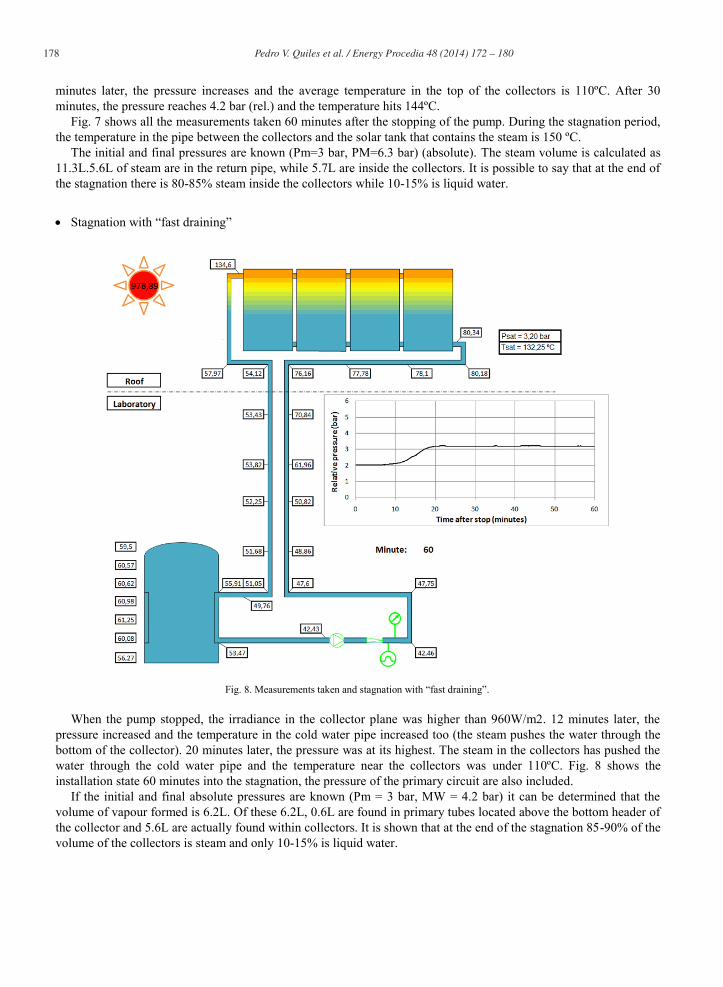
Stagnation with “fast draining”
Fig. 8. Measurements taken and stagnation with “fast draining”.
When the pump stopped, the irradiance in the collector plane was higher than 960W/m2. 12 minutes later, the pressure increased and the temperature in the cold water pipe increased too (the steam pushes the water through the bottom of the collector). 20 minutes later, the pressure was at its highest. The steam in the collectors has pushed the water through the cold water pipe and the temperature near the collectors was under 110ºC. Fig. 8 shows the installation state 60 minutes into the stagnation, the pressure of the primary circuit are also included.
If the initial and final absolute pressures are known (Pm = 3 bar, MW = 4.2 bar) it can be determined that the volume of vapour formed is 6.2L. Of these 6.2L, 0.6L are found in primary tubes located above the bottom header of the collector and 5.6L are actually found within collectors. It is shown that at the end of the stagnation 85-90% of the volume of the collectors is steam and only 10-15% is liquid water.

Pedro V. Quiles et al. / Energy Procedia 48 ( 2014 ) 172 – 180 179
The pump start with “fast draining” and with “slow draining”
The study of both deadlocks was completed after the primary circuit pump was set in motion and once the
stationary stagnation had been reached. In stagnation during slow draining (Fig. 7), as the pump starts nothing happens. The pressure that the pump is
capable of providing to the fluid is less than the difference in pressure head of the liquid heat transfer fluid produced by the steam siphon. The pump can be running for several hours without attaining any flow of fluid.
In fast draining stagnation (Fig. 8), with the steam located almost entirely within the collectors, when the pump is switched on; the liquid pushes the steam into the return lines. If the pressure provided by the pump is lower than the equivalent head in the steam siphon within the pipe, the fluid flow will stop. This situation is not recommended, as the collectors fill up with liquid state fluid, an increase in the steam production is experienced which also leads to an increase in pressure. Furthermore, the pump could be run for several hours without fluid flow and as a consequence leading to complete system failure.
Using the information provided in this study it can be said that:
- Fast draining stagnation is less damaging to the installation and the maintenance of its components. In this case less extreme temperatures are experienced which, without any doubt, helping to extend the installation’s life span.
- If the installation experiences stagnation, the pump should start only in the event that its head is greater than the difference in head within the primary circuit.
Example of the Stagnation in a solar thermal installation to heat water in a hospital
The results obtained during the monitoring of a solar thermal installation for the production of DHW in a central
hospital located in Alicante are presented. The facility, whose schematic diagram is included in Fig. 9, consists of a solar field of 146m2, located on the
building’s flat roof and with an inclination of 45°. It has a total of 12,000L, divided into 3 tanks each containing 4000L, two of them belonging to the solar system and the last is heated by a gas boiler, this provides the necessary support.
Fig. 9. Installation Schematics
8 temperature probes were installed along the circuit. Additionally a pressure sensor was fitted on the solar primary circuit to detect the starting and stopping of the pumps as well as pressure losses or excessively high

180 Pedro V. Quiles et al. / Energy Procedia 48 ( 2014 ) 172 – 180
overpressures. The most representative variables, namely the temperature on either side of the solar heat exchanger and the pressure in the primary circuit, can be seen displayed in Fig. 10.
Fig. 10. Temperatures and pressures analyzed.
Upon analysing Fig. 10 it can be seen that the low thermal demand during installation days leads to the overheating of the system for a prolonged amount of time - where temperatures rose above 80°C. As there is no air-heater fan-coil through which the excess heat can dissipate, the control system performs repeated start-up and shutdown operations in order to minimize the collector performance and hence reduce risk of overheating.
If steam is produced within collectors, stagnation is experienced, this occurs repeatedly throughout the day. The system pressure increases to over 5 bar (rel) and the pump ceases to cycle water.
4. Conclusions
An experimental study on the overheating process in solar thermal installations has been performed. The experimental data has allowed for the validation of an analytical model in which the influence of a collector was analysed.
The study has demonstrated that despite careful designing and dimensioning all solar storage tanks are susceptible to overheating
An analysis has been made on the influences that the primary circuit design may have on the stagnation of solar installations. It is important to design the circuits in such a way so that the collector drainage experienced is of the “fast” variation.
The frequency with which both overheating and stagnation may appear if the heat demand is lower than expected has been shown through monitoring of the solar installation in a hospital.
References
[1] M. K.ohla, M. Hecka, S. Brunold, et al. 2004. Advanced procedure for the assessment of the lifetime of solar absorber coatings. Solar Energy Materials & Solar Cells.
[2] Y. Tian a, C.Y. Zhao. 2013. A review of strategies for the control of high temperature stagnation in solar collectors and systems. Applied Energy.
[3] M. Slaman, R. Griessen. 2009. Solar collector overheating protection. Solar Energy. [4] Gernot M. Wallnera, Katharina Reschb, R. Hausnerc. 2008. Property and performance requirements for thermotropic layers to prevent
overheating in an all polymeric flat-plate collector. Solar Energy Materials & Solar Cells.


![Buss Comm1[1]](https://img.dokumen.tips/doc/110x75/577ce35a1a28abf1038be5ce/buss-comm11.jpg)