Embed Size (px)
Citation preview

Volume 19 Issue 3 Article 11
ANALYSIS OF THE ME70 MULTIBEAM ECHOSOUNDER DATA IN ANALYSIS OF THE ME70 MULTIBEAM ECHOSOUNDER DATA IN ECHOVIEW??URRENT CAPABILITY AND FUTURE DIRECTIONS ECHOVIEW??URRENT CAPABILITY AND FUTURE DIRECTIONS
Myounghee Kang Myriax Software Pty. Ltd. Hobart, Tasmania, Australia., [email protected]
Follow this and additional works at: https://jmstt.ntou.edu.tw/journal
Part of the Aquaculture and Fisheries Commons
Recommended Citation Recommended Citation Kang, Myounghee (2011) "ANALYSIS OF THE ME70 MULTIBEAM ECHOSOUNDER DATA IN ECHOVIEW??URRENT CAPABILITY AND FUTURE DIRECTIONS," Journal of Marine Science and Technology: Vol. 19 : Iss. 3 , Article 11. DOI: 10.51400/2709-6998.2197 Available at: https://jmstt.ntou.edu.tw/journal/vol19/iss3/11
This Research Article is brought to you for free and open access by Journal of Marine Science and Technology. It has been accepted for inclusion in Journal of Marine Science and Technology by an authorized editor of Journal of Marine Science and Technology.

ANALYSIS OF THE ME70 MULTIBEAM ECHOSOUNDER DATA IN ANALYSIS OF THE ME70 MULTIBEAM ECHOSOUNDER DATA IN ECHOVIEW??URRENT CAPABILITY AND FUTURE DIRECTIONS ECHOVIEW??URRENT CAPABILITY AND FUTURE DIRECTIONS
Acknowledgements Acknowledgements I am very grateful to Sarah Stienessen and Chris Wilson at Alaska fisheries Science Center, NOAA for permission to use their data and for valuable comments to improve the paper. Also I thank Toby Jarvis and an anonymous referee for helpful comments on the early manuscript.
This research article is available in Journal of Marine Science and Technology: https://jmstt.ntou.edu.tw/journal/vol19/iss3/11
312 Journal of Marine Science and Technology, Vol. 19, No. 3, pp. 312-321 (2011)
ANALYSIS OF THE ME70 MULTIBEAM ECHOSOUNDER DATA IN ECHOVIEW – CURRENT CAPABILITY AND FUTURE
DIRECTIONS
Myounghee Kang*
Key words: Echoview, ME70, 3D school detection, school tracking.
ABSTRACT The general features of the multibeam echosounder (Simrad,
ME70) are covered and trends in recent research on using the sonar systems are stated. Echoview’s current capability for analyzing ME70 data is precisely described in two categories: split beam data analysis and multibeam data analysis. In par-ticular, the visualization and analysis of school in three di-mensions and school tracking are illustrated using fish school echoes observed in Bering Sea during the summer of 2008 and 2009. Future software developments in Echoview may include: high resolution bathymetric algorithms to detect re-liable sea bottom, advanced school detection in three dimen-sions even for ambiguous shapes and its editing tool, and incident-angle-TS for supporting abundance estimation.
I. INTRODUCTION Traditional single beam echosounders have performed well
for many years for the purposes of biomass estimation and ecological research due to a well established methodology for the analysis and interpretation of data [20]. The multibeam sonar systems are relatively new instruments compared to the sounders but have wide coverage with high resolution data sample so that they have been increasingly used in order to understand the ecology of marine organisms. Numerous re-search using sonar system has been carried out. For example, morphological and geographical characteristics of pelagic schools in relation to environmental factors (thermocline, halocline, and fluorescence) and/or the existence of the vessel have been described using an echosounder (Biosonics 38 kHz) and sonar (Reson Seabat 6012) simultaneously [21]. Migra-tion of herring and capelin, especially the swimming speed
and direction of schools, was studied using Simrad sonars (SR240 and SA950) [9]. Moreover, predator-prey interactions have been investigated by sonar. Using a Reson Seabat 6012 (455 kHz) multibeam sonar, morphologic patterns of herring schools (e.g., bend, hourglass, vacuole, split and herd etc) in relation to the size of a school were categorized under predator attacks [1]. The same system was used for examining the speed of an anchovy school, its predator (sea lion), and waves inside the school. When predators attacked an anchovy school, waves of agitation inside the schools caused the internal struc- ture and external morphology of the school to be dramatically altered [7].
The ME70 is a highly configurable and calibrated multi-beam system with low side lobes, narrow beam width, and high dynamic range [24]. Each individual single beam data acts as a EK60 split beam to provide data of volume back-scattering strength (SV), target strength (TS), and along-ship and athwart-ship angle information. It collects far more data than scientific single beam echosounders. Hence data proc-essing and analysis systems face the challenge of handling these vast volumes of data. A powerful data processing and analysis software tool is required to efficiently extract infor-mation from the ME70, enable understanding of underwater ecosystems, and improve the accuracy of quantification of biomass. Also a tool for visualization and analysis of ME70 data in multi-dimensions is exceedingly necessary.
A number of trials using the ME70 have been conducted [2, 4, 6, 24] especially a couple of research papers have been published on new methods for improving bottom detection using ME70 data [4, 6]. However, the maximum capabilities of the ME70 have not been completely investigated yet. Therefore, analysis software should be flexible and evolving along with new discoveries and techniques by scientists. It is substantially significant to appreciate which applications are available for ME70 data and which features and functions are supportive. Accordingly that information can be used meth-odologically to assist one to make a survey plan and to process and analyze data.
Echoview is one application available to process ME70 data. It is not only for visualization but also for analysis.
Paper submitted 03/31/10; revised 08/03/10; accepted 10/01/10. Author forcorrespondence: Myounghee Kang (e-mail: [email protected]). *Myriax Software Pty. Ltd. Hobart, Tasmania, Australia.

M. Kang: Analysis of the ME70 Multibeam Echosounder Data in Echoview – Current Capability and Future Directions 313
Echoview represents each ME70 beam as a single beam data in the same manner as the channels on the EK60 echosounder. A multibeam data is derived that represents all beams from each transducer channel in a planar fan view. Hence, the application provides features for split beam data as well as for multibeam data from the ME70. In this study Echoview’s current processing capabilities of ME70 data will be catego-rized into two parts: split beam data analysis and multibeam data analysis. Major features pertaining to split beam data will be technically described and key features related to multibeam data will be explained with illustrations using data of fish schools observed in Bering Sea during the summer of 2008 and 2009. Strictly speaking an individual beam is a split beam, however single beam and split beam are used interchangeably in this paper to contrast with multibeam data.
II. GENERAL FEATURES OF THE ME70 AND RELEVANT FEATURES IN ECHOVIEW
1. Overview
Echoview’s current capability for handling ME70 data will be divided into two categories: single beam data and multi-beam data. Two dimensional school detection and analysis, single target detection, and fish track techniques are available. The function of Echoview pertaining to multibeam data analysis has been updated to provide key functionality for ME70 data, especially for the detection and characterization of schools in three dimensions. Tracking of three dimensional schools can be applicable to ME70 data. Various views of detected schools in three dimensions such as series of along- and athwart-ship cross sections of schools are available and extensive export functionality for further analysis outside of Echoview is supported.
2. Configuration
In order to determine the geographic location of targets on a single beam echogram and a multibeam echogram, each beam in a ping requires a defined geographic position. Therefore the parameters of transducer geometry should be set. Automatic beam configuration can allow a maximum 45 beams geometry to be automatically recognized in Echoview. ME70 beam steering angles and other beam information from data files are displayed in an echogram so that one can process data in consideration of beam geometry. Fig. 1 shows the definition of a beam and a ping. It illustrates the relationship between single beam echogram and multibeam echogram with respect to a beam and ping. Table 1 provides details on the beam con- figuration of two data sets. The dataset configured with 31 beams was collected from 23:31:23 on 6 July 2009 to 03:48:15 on 7 July 2009 and is called 2009 schools. The range of beam steering is between -66° and 66°. The sixteenth beam has the highest frequency of 117 kHz. The first and last beams have frequencies of 73 and 75 kHz respectively. The dataset con-figured with 21 beams was collected between 04:10:29 and
Beam n
1 2 3Ping no.
Beam n
Nth single beam echogram
Beams
Multibeam echogram
Beam 0
Ping 1
Ping 2
Ping 3
Fig. 1. Definition of a beam and a ping. The Nth single beam echogram
is created from the nth beam of ping 1, 2 and 3.
04:18:16 on 13 July 2008 and is called 2008 schools. The range of beam steering is between -44° and 44°. The eleventh beam is the maximum frequency of 116 kHz. The first and last beams have frequencies of 74 and 76 kHz respectively.
3. Synchronization Every single beam echogram and multibeam echogram (e.g.
Fig. 2) are synchronized. A single beam echogram is dis-played whilst replaying a loop of synchronized time from a related multibeam. For example an expanded part of a mul-tibeam echogram, which includes a target fish school, can be synchronized with multiple single echograms. Hence the tar- get fish school can be simultaneously viewed in various as-pects in single and multibeam echograms. The distance be-tween two or more points on the multibeam and single beam echograms can be measured so that the size of schools or any object can be quickly calculated. Fig. 2 depicts 21 single beam echograms and one multibeam echogram on the bottom right of the figure. The schools on single beam echograms are delineated by 21 different side aspects while viewing the schools from front to back on the multibeam echogram. Twenty one single beam echograms and a multibeam echo-gram are simultaneously visualized. The school starts to be viewed as two separate ones on the eleventh echogram even though they are one school confirmed by school detection in three-dimension.
III. ECHOVIEW’S CURRENT CAPABILITY WITH SINGLE BEAM DATA FROM THE ME70
1. School Detection Acoustic school detection technique on traditional single
beam echograms provides morphological, geographical and energetic characteristics of schools and has been widely used for understanding ecology and identifying species [11]. This technique can be used on individual ME70 beams. Two di-mensional school detection algorithms in Echoview filters data using thresholds to determine the school candidates. The

314 Journal of Marine Science and Technology, Vol. 19, No. 3 (2011)
Table 1. Beam configurations of two datasets used for school detection in three dimensions and school tracking.
2009 schools 2008 schools
Beam No.
Frequency (kHz)
Beam steering (°)
Beam width alongship (°)
Beam width athwartship (°)
Frequency(kHz)
Beam steering (°)
Beam width alongship (°)
Beam width athwartship (°)
1 73 -66 4.45 10.86 74 -44 4.58 6.24
2 76 -57 4.29 7.79 78 -38 4.34 5.34
3 79 -50 4.13 6.36 82 -32 4.12 4.73
4 82 -44 3.99 5.50 86 -27 3.92 4.28
5 85 -39 3.85 4.91 90 -22 3.74 3.93
6 88 -34 3.73 4.47 95 -18 3.58 3.65
7 90 -30 3.61 4.13 99 -14 3.43 3.43
8 93 -25 3.50 3.86 103 -10 3.29 3.25
9 96 -22 3.39 3.64 107 -6 3.16 3.09
10 99 -18 3.30 3.46 111 -3 3.04 2.96
11 102 -15 3.20 3.30 116 0 2.91 2.83
12 105 -12 3.12 3.17 113 4 2.99 2.91
13 108 -8 3.03 3.06 109 7 3.10 3.04
14 110 -5 2.95 2.96 105 11 3.22 3.19
15 113 -2 2.88 2.87 101 14 3.36 3.37
16 117 0 2.79 2.78 97 18 3.50 3.59
17 115 3 2.84 2.84 92 23 3.66 3.86
18 112 6 2.92 2.92 88 27 3.83 4.19
19 109 9 2.99 3.02 84 32 4.02 4.63
20 106 12 3.07 3.13 80 38 4.23 5.22
21 103 15 3.16 3.27 76 44 4.46 6.08
22 100 19 3.25 3.42
23 98 22 3.34 3.60
24 95 26 3.45 3.82
25 92 30 3.55 4.09
26 89 34 3.67 4.42
27 86 39 3.79 4.86
28 83 44 3.92 5.44
29 80 50 4.06 6.29
30 78 57 4.21 7.69
31 75 66 4.37 10.70
maximum threshold is generally not important to school de-tection. However, the minimum threshold is of great impor-tance, since sub-threshold data points surrounding the school will be excluded from analysis as the threshold increases, resulting in important changes in estimates of school shape and energetic properties. School candidates that meet the relevant criteria can be linked to one and other to form a larger school candidate. Candidates are linked based on the criteria
for horizontal and vertical linking distance (i.e. horizontal and vertical distances allow between two school candidates being linked to form a larger candidate school). Fig. 3 illustrates how two linking distances work for joining school candidates. These two distances form the vertical and horizontal semi- axes of an ellipse. The ellipse is, in effect, moved around the boundary of a school candidate. If any part of any other school candidate (B, Fig. 3) falls within the ellipse, a link is created

M. Kang: Analysis of the ME70 Multibeam Echosounder Data in Echoview – Current Capability and Future Directions 315
Ping no. 35 Fig. 2. Synchronization of 21 single beam echograms and a multibeam echogram. On single beam echogram, a dashed marker identifies the current
ping (ping 35). On the multibeam echogram, an annotated black arrow points to the time slider that indicates the current ping. All (displayed) echograms can be synchronized via the dashed marker or time slider. The school is shown differently based on incidence angle in the single beam echograms. The school highlighted by the dashed circle on the eleventh echogram seems to display two different school. However they are in fact one school as verified by school detection in three dimensions.
Vertical linking distance
Horizontal linking distance
LinkA
B
Fig. 3. The demonstration of horizontal and vertical linking distances
which is a part of processing for two-dimensional school detection. The two linking distances determine whether a neighboring school candidate is close enough to form one single fish school. The school candidate (B) falls within the ellipse therefore the school candidate (A) links the school candidate (B), eventually they be-come one school candidate for further schools detection processes.
between the school candidates. Finally, schools are rejected if they are smaller than the specified minimum length and height. The characteristics of a detected two dimensional school such as length, height, area, volume, perimeter, compactness and so forth can be exported for further analysis. Additionally, fractal dimension [16], elongation, unevenness1 and 2 [25], and rec-
tangularity [19] can be calculated from the characteristics output.
2. Single Target Detection There are several single target detection methods in Echo-
view. The detection methods are based on different echo-sounder algorithms. Among them, the single target detection split beam method 2 is used by the algorithm from the Simrad EK60 echosounder, and is appropriate to detect single targets using split beam data from the ME70. Each single target has a number of properties: TS and range from the transducer are notable, but many other properties: along-ship and athwart- ship angles; their standard deviations; the number of samples in a single target pulse; the length of a single target pulse (at 6 dB, 12 dB and 18 dB down from the peak) normalized to the transmitted pulse length are available for analysis.
3. Fish Tracking The fish track technique is applicable to single beam data
from the ME70. Fish track detection is used to identify groups of single targets which show a pattern of systematic movement. The targets grouped into a fish track are assumed to have been generated by a single object moving through space. Echo-view’s α-β Fish Tracker algorithm implements a fixed coeffi-

316 Journal of Marine Science and Technology, Vol. 19, No. 3 (2011)
cient filtering method as presented in Blackman [3]. This algorithm selects single targets as candidates for appending to a track. Once identified as a candidate, a target is assigned a measure which determines the track allocation process. The measure depends on weighted component distances from the predicted location, and the TS and time difference to the last target in the track. The allocation process is completed and all tracks are filtered according to the track acceptance criteria. A track is closed once the maximum ping gap is exceeded. Closed tracks are tested against the criteria for both the minimum number of single targets and pings. Outputs of this technique such as horizontal and vertical swimming speeds, change of distributed depth, swimming speed, and tortuosity are very useful in understanding the behaviors of fish more precisely. The mean TS of tracked fish can be processed to become the representative TS of the species. It should be noted that single target detection algorithm can drop weak echoes which are from target fish, and fish tracking method may not detect genuine and relevant all single targets as a track. Therefore, loose parameter setting for single target detection and manual fish track editing would be useful to compromise this matter and to obtain more accurate mean TS.
IV. ECHOVIEW’S CURRENT CAPABILITY WITH MULTIBEAM DATA FROM ME70
1. Background The use of vertical echosounder data to estimate fish abun-
dance has been well established. However, several limitations exist. Beam width in combination with depth, and also pulse duration and bottom topography, determine the extent of the dead zone near the seabed in which species residing close to the seabed and located inside the acoustic dead zone cannot be detected. The standard protocols for extracting morphological school descriptors from vertical echosounders are proposed [11], by using limited school characteristics in two dimen- sions (depth and along-ship). Under this proposal, informa-tion perpendicular to the survey track is unavailable. There-fore, horizontal (athwart-ship) avoidance reactions cannot be studied using single beam echosounders. To overcome such limitations, horizontal and vertical scanning sonars and multi- beam sonars have been employed. The use of scanning sonars and multibeam sonars that record successive vertical plans permits the addition of the third horizontal dimension to the two dimensions normally observed [8] (i.e., multibeams pro-vide an athwart-ship perspective). Such devices can allow a full 3D recording of the school characteristics potentially new criteria that are likely to help in defining school typology [21]. The three dimensional visualization is a powerful tool for investigating fish school behavior, for estimating fish school abundance, and for mapping fish habitat [8-10, 15, 17, 18, 21, 24]. Many studies have focused on using multibeam sonars to explore fish school movement, distribution, and behaviors [8, 9, 18, 21, 24]. With the emergence of the calibrated ME70 sonar, current research has begun to concentrate on assessing
fisheries resources [17]. The utilization of ME70 data in fishery acoustic research can lead to new insights in ecology as well as an estimation of the fish school abundance. Echoview functions for multibeam data from the ME70, which will be elucidated in the following section, have already been used for previously mentioned research studies. Echoview has the potential to play a very important role in enabling scientists to use the ME70 to its maximum capacity.
2. Visualization of Three Dimensional Schools and Seabed Surface Along- and athwart-ship cross sections of the school can
help to provide understanding of the internal structure of a fish school. The athwart-ship cross section can be viewed by the sequences of the slice of a school. If one chooses several pings across the school to detect schools in three dimensions, the school morphometrics per selected pings are obtained and seen as vertical cross sections. Another visualization for the athwart-ship cross section is to use a “multibeam ping curtain” which is a three dimensional representation of a single ping from a multibeam echogram and is converted into geo-refer- enced three dimensional curtains. Generally multibeam ping curtains from many pings are applied and displayed in scene which is a 3D environment where one or more 3D objects such as three dimensional schools can be displayed with a time slider. A school in multibeam ping curtain can be effectively viewed by setting different thresholds of minimum and maxi- mum color display. A slice of a three dimensional school in along-ship is like a school detected in two dimensions on a single beam echogram which can be shown as a “single beam echogram curtain”. Multiple along-ship vertical slices can be made by displaying single beam echogram curtains thorough multiple pings. A single beam echogram curtain from the 7th beam’s single beam echogram is illustrated in Fig. 4(c). A single beam echogram curtain from the 14th beam’s single beam echogram is illustrated in Fig. 4(e). Figs. 4(b) and 4(d) show schools, where the echoes are above the applied thresh-old, on the multibeam curtains and the intersecting single beam curtains. The school in Figs. 4(b) and 4(d) intersects with the along-ship curtain from Figs. 4(c) and 4(e) respec-tively. To understand more internal structures of a school, a cross sectional view of the school can be exported and shown outside of Echoview such as OpenQVis and 3Dview.
It is often desirable to visualize three dimensional schools on an accurately described sea bottom. In Echoview, a three dimensional bottom surface can be extracted from ME70 data. Three dimensional geographical surfaces can also be imported from supported surface file formats (csv, xyz and xyzi) to better understand the context of schools in the scene enviro- nment.
3. Detection and Characterization of a School in Three Dimensions Typically a three dimensional school is detected based on
color images of a target school by color threshold (e.g., 15 out
M. Kang: Analysis of the ME70 Multibeam Echosounder Data in Echoview – Current Capability and Future Directions 317
A
B
14th7th
C
(a)
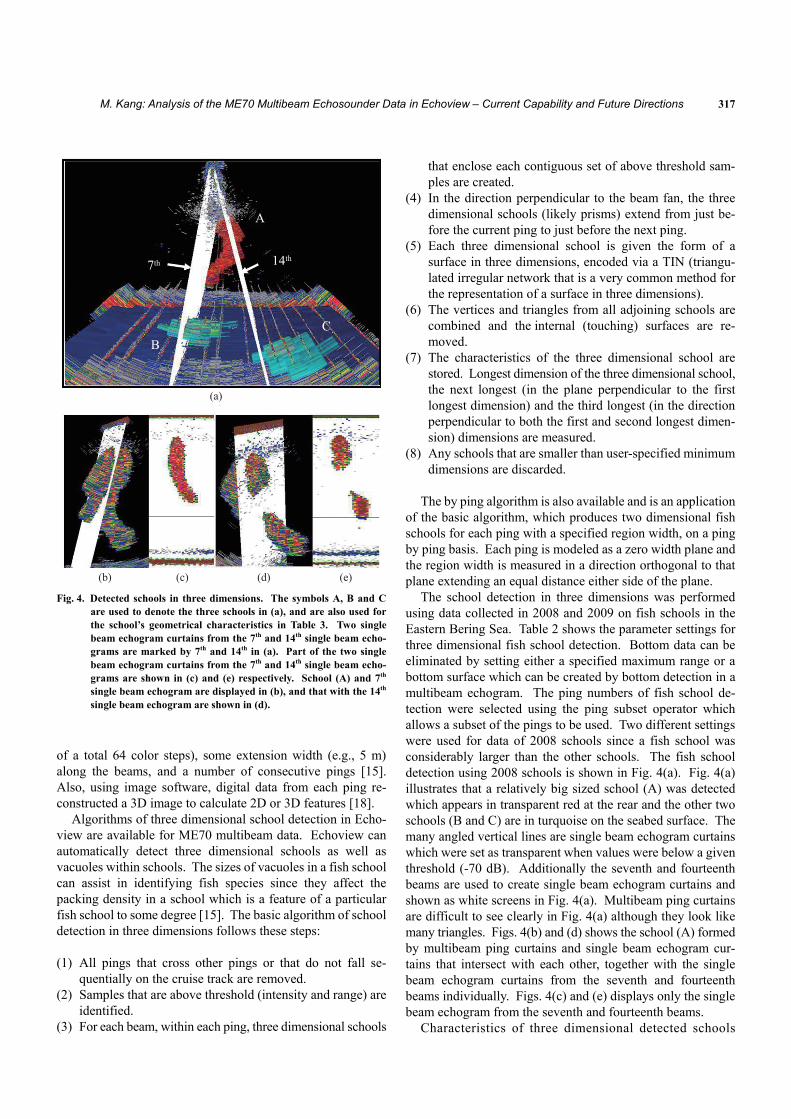
(b) (c) (d) (e) Fig. 4. Detected schools in three dimensions. The symbols A, B and C
are used to denote the three schools in (a), and are also used for the school’s geometrical characteristics in Table 3. Two single beam echogram curtains from the 7th and 14th single beam echo-grams are marked by 7th and 14th in (a). Part of the two single beam echogram curtains from the 7th and 14th single beam echo-grams are shown in (c) and (e) respectively. School (A) and 7th single beam echogram are displayed in (b), and that with the 14th single beam echogram are shown in (d).
of a total 64 color steps), some extension width (e.g., 5 m) along the beams, and a number of consecutive pings [15]. Also, using image software, digital data from each ping re-constructed a 3D image to calculate 2D or 3D features [18].
Algorithms of three dimensional school detection in Echo-view are available for ME70 multibeam data. Echoview can automatically detect three dimensional schools as well as vacuoles within schools. The sizes of vacuoles in a fish school can assist in identifying fish species since they affect the packing density in a school which is a feature of a particular fish school to some degree [15]. The basic algorithm of school detection in three dimensions follows these steps:
(1) All pings that cross other pings or that do not fall se-
quentially on the cruise track are removed. (2) Samples that are above threshold (intensity and range) are
identified. (3) For each beam, within each ping, three dimensional schools
that enclose each contiguous set of above threshold sam-ples are created.
(4) In the direction perpendicular to the beam fan, the three dimensional schools (likely prisms) extend from just be-fore the current ping to just before the next ping.
(5) Each three dimensional school is given the form of a surface in three dimensions, encoded via a TIN (triangu-lated irregular network that is a very common method for the representation of a surface in three dimensions).
(6) The vertices and triangles from all adjoining schools are combined and the internal (touching) surfaces are re-moved.
(7) The characteristics of the three dimensional school are stored. Longest dimension of the three dimensional school, the next longest (in the plane perpendicular to the first longest dimension) and the third longest (in the direction perpendicular to both the first and second longest dimen-sion) dimensions are measured.
(8) Any schools that are smaller than user-specified minimum dimensions are discarded.
The by ping algorithm is also available and is an application
of the basic algorithm, which produces two dimensional fish schools for each ping with a specified region width, on a ping by ping basis. Each ping is modeled as a zero width plane and the region width is measured in a direction orthogonal to that plane extending an equal distance either side of the plane.
The school detection in three dimensions was performed using data collected in 2008 and 2009 on fish schools in the Eastern Bering Sea. Table 2 shows the parameter settings for three dimensional fish school detection. Bottom data can be eliminated by setting either a specified maximum range or a bottom surface which can be created by bottom detection in a multibeam echogram. The ping numbers of fish school de-tection were selected using the ping subset operator which allows a subset of the pings to be used. Two different settings were used for data of 2008 schools since a fish school was considerably larger than the other schools. The fish school detection using 2008 schools is shown in Fig. 4(a). Fig. 4(a) illustrates that a relatively big sized school (A) was detected which appears in transparent red at the rear and the other two schools (B and C) are in turquoise on the seabed surface. The many angled vertical lines are single beam echogram curtains which were set as transparent when values were below a given threshold (-70 dB). Additionally the seventh and fourteenth beams are used to create single beam echogram curtains and shown as white screens in Fig. 4(a). Multibeam ping curtains are difficult to see clearly in Fig. 4(a) although they look like many triangles. Figs. 4(b) and (d) shows the school (A) formed by multibeam ping curtains and single beam echogram cur-tains that intersect with each other, together with the single beam echogram curtains from the seventh and fourteenth beams individually. Figs. 4(c) and (e) displays only the single beam echogram from the seventh and fourteenth beams.
Characteristics of three dimensional detected schools

318 Journal of Marine Science and Technology, Vol. 19, No. 3 (2011)
Table 2. The parameter settings for fish school detection in three dimensions. 2008 schools 2009 schools
3D schools detection algorithms Basic algorithm Basic algorithm By ping algorithm
Ping numbers 26
(25-50 ping subset) 48
(160-207 ping subset) 1019
(934-1952 ping subset) Exclude before specified minimum range 25 m 25 m 20 m
Bottom elimination Maximum range
120 m Maximum range
135 m bottom surface with depth
offset of -2.5 m Minimum 3D longest dimension 40 m 20 m 10 m Minimum 3D middle dimension 20 m 10 m 5 m Minimum 3D shortest dimension 10 m 5 m 2 m
Minimum vacuole 3D longest dimension 0.2 m 0.2 m 0.2 m Minimum vacuole 3D middle dimension 0.2 m 0.2 m 0.2 m Minimum vacuole 3D shortest dimension 0.2 m 0.2 m 0.2 m
Region width 4 m
Table 3. Morphological and geographical characteristics of detected fish schools in three dimensions. Illustration of the schools is in Fig. 3.
School label A B C Average Surface area (m2) 34232.05 6098.98 11716.66 17349.23 Length NS (m) 58.95 50.83 54.05 54.61 Length EW (m) 69.64 41.27 47.43 52.78
Minimum depth (m) 22.22 98.03 97.12 72.46 Maximum depth (m) 119.51 113.93 120.36 117.93
Height (m) 97.29 15.89 23.25 45.48 Volume (m3) 47870.91 6474.93 10544.08 21629.97
Geometric center in latitude (°) 59.27 59.27 59.27 59.27 Geometric center in longitude (°) 176.98 S 176.98 S 176.98 S 176.98 S Geometric center in depth (m) 67.7 104.71 108.82 93.74
The longest length of the school-aligned bounding box (m) 110.39 55.25 56.63 74.09 The second longest length of the school-aligned bounding box (m) 57.11 33.75 41.42 44.09
The shortest length of the school-aligned bounding box (m) 37.93 14.43 18.72 23.69 Roughness* (m-1) 0.72 0.94 1.11 0.92
*Roughness is surface area of a school divided by volume of the school.
shown in Fig. 4 were exported and shown in Table 3. All schools are distributed in approximately 100 m deep of water but the school (A) is a relatively large school compared to the other schools (B and C). For example it is 97 m high while the other two schools are around 16 and 23 m and the longest length of the school aligned bounding box for the school (A) is almost twice as long as those of the other two schools (B and C), and the length of the school for the school (A) is about 10 m longer than the others.
4. School Tracking in Three Dimensions To understand the behaviors of the fish, characteristics of
fish tracking (such as horizontal and vertical swimming di-
rection, change of distributed depth, swimming speed, and tortuosity) are very useful and frequently used. In the same way, tracking of three dimensional schools would be very valuable since it can show a pattern of systematic movement in a group of three dimensional schools. Where a sequence of schools from the same schools may be detected then a tracking algorithm can be used to track a single moving school. The tracking algorithm of three dimensional schools in Echoview is based on the existing fish tracking algorithm. After de-tecting three dimensional schools, the schools can be tracked utilizing an “α-β” tracker that tracks the centre of mass of the schools. It predicts the next position and velocity of a point on an existing track and selects candidate points for a track based
M. Kang: Analysis of the ME70 Multibeam Echosounder Data in Echoview – Current Capability and Future Directions 319
(a)
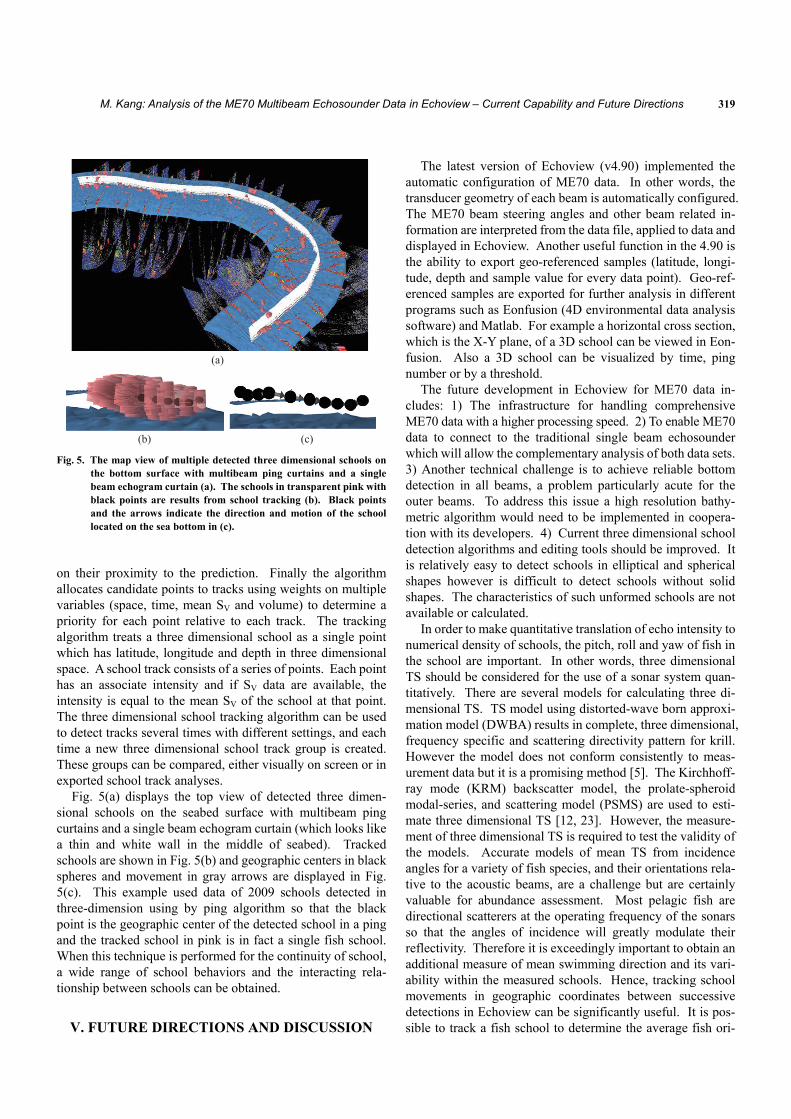
(b) (c) Fig. 5. The map view of multiple detected three dimensional schools on
the bottom surface with multibeam ping curtains and a single beam echogram curtain (a). The schools in transparent pink with black points are results from school tracking (b). Black points and the arrows indicate the direction and motion of the school located on the sea bottom in (c).
on their proximity to the prediction. Finally the algorithm allocates candidate points to tracks using weights on multiple variables (space, time, mean SV and volume) to determine a priority for each point relative to each track. The tracking algorithm treats a three dimensional school as a single point which has latitude, longitude and depth in three dimensional space. A school track consists of a series of points. Each point has an associate intensity and if SV data are available, the intensity is equal to the mean SV of the school at that point. The three dimensional school tracking algorithm can be used to detect tracks several times with different settings, and each time a new three dimensional school track group is created. These groups can be compared, either visually on screen or in exported school track analyses.
Fig. 5(a) displays the top view of detected three dimen-sional schools on the seabed surface with multibeam ping curtains and a single beam echogram curtain (which looks like a thin and white wall in the middle of seabed). Tracked schools are shown in Fig. 5(b) and geographic centers in black spheres and movement in gray arrows are displayed in Fig. 5(c). This example used data of 2009 schools detected in three-dimension using by ping algorithm so that the black point is the geographic center of the detected school in a ping and the tracked school in pink is in fact a single fish school. When this technique is performed for the continuity of school, a wide range of school behaviors and the interacting rela-tionship between schools can be obtained.
V. FUTURE DIRECTIONS AND DISCUSSION
The latest version of Echoview (v4.90) implemented the automatic configuration of ME70 data. In other words, the transducer geometry of each beam is automatically configured. The ME70 beam steering angles and other beam related in-formation are interpreted from the data file, applied to data and displayed in Echoview. Another useful function in the 4.90 is the ability to export geo-referenced samples (latitude, longi-tude, depth and sample value for every data point). Geo-ref- erenced samples are exported for further analysis in different programs such as Eonfusion (4D environmental data analysis software) and Matlab. For example a horizontal cross section, which is the X-Y plane, of a 3D school can be viewed in Eon- fusion. Also a 3D school can be visualized by time, ping number or by a threshold.
The future development in Echoview for ME70 data in-cludes: 1) The infrastructure for handling comprehensive ME70 data with a higher processing speed. 2) To enable ME70 data to connect to the traditional single beam echosounder which will allow the complementary analysis of both data sets. 3) Another technical challenge is to achieve reliable bottom detection in all beams, a problem particularly acute for the outer beams. To address this issue a high resolution bathy-metric algorithm would need to be implemented in coopera-tion with its developers. 4) Current three dimensional school detection algorithms and editing tools should be improved. It is relatively easy to detect schools in elliptical and spherical shapes however is difficult to detect schools without solid shapes. The characteristics of such unformed schools are not available or calculated.
In order to make quantitative translation of echo intensity to numerical density of schools, the pitch, roll and yaw of fish in the school are important. In other words, three dimensional TS should be considered for the use of a sonar system quan-titatively. There are several models for calculating three di-mensional TS. TS model using distorted-wave born approxi- mation model (DWBA) results in complete, three dimensional, frequency specific and scattering directivity pattern for krill. However the model does not conform consistently to meas-urement data but it is a promising method [5]. The Kirchhoff- ray mode (KRM) backscatter model, the prolate-spheroid modal-series, and scattering model (PSMS) are used to esti-mate three dimensional TS [12, 23]. However, the measure-ment of three dimensional TS is required to test the validity of the models. Accurate models of mean TS from incidence angles for a variety of fish species, and their orientations rela- tive to the acoustic beams, are a challenge but are certainly valuable for abundance assessment. Most pelagic fish are directional scatterers at the operating frequency of the sonars so that the angles of incidence will greatly modulate their reflectivity. Therefore it is exceedingly important to obtain an additional measure of mean swimming direction and its vari-ability within the measured schools. Hence, tracking school movements in geographic coordinates between successive detections in Echoview can be significantly useful. It is pos-sible to track a fish school to determine the average fish ori-

320 Journal of Marine Science and Technology, Vol. 19, No. 3 (2011)
entation from a sonar observation [22]. Ultimately, if TS can be accurately modeled versus all potentially encountered an-gles of incidence and in situ fish orientation relative to the acoustic beams can be accurately estimated, biomass estima-tions using multibeam sonars may be no more complicated than the current echosounder method. Single target detection algorithms allow TS in each single beam echogram from ME70 to be obtained as aforementioned. Therefore the meas- urement taken by the ME70 split beam can be compared with the model results. There are various research trials to utilize TS for abundance assessment using the ME 70 data. Echo-view will develop mean TS based on incidence angles and fish orientation which can be obtained by some models for three dimensional TS and extraction of swimming direction from tracked schools or some other methods.
Manual data processing, especially many single beam echo- grams (e.g., twenty one or thirty one echograms depending on transducer geometry configuration), would be tedious and time consuming. For example school detection in two di-mensions on single beam echograms should be carried out as many as times as the number of single beams contained a target fish school. Another example would be that the com-parison of schools detected by different threshold takes a long time to be completed. Echoview COM (Component Object Model) scripting offers to control and interrogate Echoview. Microsoft COM technology is used in the Microsoft Win-dows-family of Operating Systems to enable software com-ponents to communicate. Various menu commands to process, analyze and export data are used in Echoview. COM scripting allows one to write a program to automatically carry out a series of these tasks such as two and three dimensional school detections, and the comparison of schools by threshold. COM scripts can save processing time because they are able to automate repetitive tasks which would be very useful when processing large data sets, often generated by the ME70.
Species identification is often based on multifrequency technique (i.e., dB differencing). Multiple frequency data can be collected by the configuration which is all beams point in the same direction although the frequency range between 70-120 kHz would not be wide enough to classify all species of fish and zooplankton [13, 14]. The current version of Echoview does not support data logged by this configuration; however, it will be available when there are strong requests from users.
ACKNOWLEDGMENTS I am very grateful to Sarah Stienessen and Chris Wilson at
Alaska fisheries Science Center, NOAA for permission to use their data and for valuable comments to improve the paper. Also I thank Toby Jarvis and an anonymous referee for helpful comments on the early manuscript.
REFERENCES 1. Axelsen, B. E., Anker-Nilssen, T., Fossum, P., Kvamme, C., and Not-
testad, L., “Pretty patterns but a simple strategy: predator prey interac-tions between juvenile herring and Atlantic puffins observed with mul-tibeam sonar,” Canadian Journal of Zoology, Vol. 79, pp. 1586-1596 (2001).
2. Berger, L., Poncelet, C., and Trenkel, V. M., “A method for reducing uncertainty in estimates of fish-school frequency response using data from multifrequency and multibeam echosounders,” ICES Journal of Marine Science, Vol. 66, pp. 1155-1161 (2009).
3. Blackman, S. S., Multiple-Target Tracking with Radar Applications, Artech House, Dedham, MA (1986).
4. Bourguignon, S., Berger, L., Scalabrin, C., Fablet, R., and Mazauric, V., “Methodological developments for improved bottom detection with the ME70 multibeam echosounder,” ICES Journal of Marine Science, Vol. 66, pp. l015-1022 (2009).
5. Cutter, G. R., Renfree, J. S., Cox, M. J., Brierley, A. S., and Demer, D. A., “Modelling three-dimensional directivity of sound scattering by Antarctic krill: progress towards biomass estimation using multibeam sonar,” ICES Journal of Marine Science, Vol. 66, pp. 1245-1251 (2009).
6. Demer, D. A., Cutter, G. R., Renfree, J. S., and Butler, J. L., “A statistical- spectral method for echo classification,” ICES Journal of Marine Science, Vol. 66, pp. 1081-1090 (2009).
7. Gerlotto, F., Bertrand, S., Bez, N., and Gutierrez, M., “Waves of agitation inside anchovy schools observed with multibeam sonar: a way to transmit information in response to predation,” ICES Journal of Marine Science, Vol. 63, pp. 1405-1417 (2006).
8. Gerlotto, F., Soria, M., and Fréon, P., “From two dimensions to three: the use of multibeam sonar for a new approach in fisheries acoustics,” Ca-nadian Journal of Fisheries and Aquatic Sciences, Vol. 56, pp. 6-12 (1999).
9. Hafsteinsson, M. T. and Misund, O. A., “Recording the migration be-haviour of fish schools by multi-beam sonar during conventional acoustic surveys,” ICES Journal of Marine Science, Vol. 52, pp. 915-924 (1995).
10. Hamano, A., Tanoue, H., and Kieser, R., “The three-dimensional GIS using sonar information for coastal fisheries,” ICES CM Documents 2005, 2005 Annual Science Conference, Aberdeen, UK, ICES CM2005/U:19 (2005).
11. ICES, “Report on echo-trace classification,” ICES Cooperative Research Report, No. 238 (2000).
12. Jech, J. M. and Horne, J. K., “Three-dimensional visualization of fish morphometry and acoustic backscatter,” Acoustics Research Letters On- line, Vol. 3, pp. 35-40 (2002).
13. Kang, M., Furusawa, M., and Miyashita K., “Effective and accurate use of difference in mean volume backscattering strength to identify fish and plankton,” ICES Journal of Marine Science, Vol. 59, pp. 794-804 (2002).
14. Korneliussen, R. and Ona, E., “Synthetic echograms generated from relative frequency response,” ICES Journal of Marine Science, Vol. 60, pp. 636-640 (2003).
15. Misund, O. A., Aglen, A., Hamre, J., Ona, E., Røttingen, I., Skagen, D., and Valdemarsen, J. W., “Improved mapping of schooling fish near the surface: comparison of abundance estimates obtained by sonar and echo integration,” ICES Journal of Marine Science, Vol. 53, pp. 383-388 (1996).
16. Nero, R. W. and Magnuson, J. J., “Characterization of patches along transects using high-resolution 70-kHz integrated acoustic data,” Cana-dian Journal of Fisheries and Aquatic Sciences, Vol. 46, pp. 2056-2064 (1989).
17. Ona, E., Mazauric, V., and Andersen, L. N., “Calibration methods for two scientific multibeam systems,” ICES Journal of Marine Science, Vol. 66, pp. 1326-1334 (2009).
18. Paramo, J., Bertrand, S., Villalobos, H., and Gerlotto, F., “A three-dimen- sional approach to school typology using vertical scanning multibeam sonar,” Fisheries Research, Vol. 84, pp. 171-179 (2007).
19. Scalabrin, C. and Massé, J., “Acoustic detection of the spatial and tem-poral distribution of fish shoals in the Bay of Biscay,” Aquatic Living Resources, Vol. 6, pp. 269-283 (1993).
20. Simmonds, J. and Maclennan, D. Fisheries Acoustics: Theory and Prac-tice, Second edition, Fish and Aquatic Resources Series 10, Blackwell

M. Kang: Analysis of the ME70 Multibeam Echosounder Data in Echoview – Current Capability and Future Directions 321
Science, Oxford, UK (2005). 21. Soria, M., Bahri, T., and Gerlotto, F., “Effect of external factors (envi-
ronment and survey vessel) on fish school characteristics observed by echosounder and multibeam sonar in the Mediterranean sea,” Aquatic Living Resources, Vol. 16, pp. 145-157 (2003).
22. Tang, Y., Study on Abundance Estimation of Fish Close to the Sea Surface by Using Quantitative Scanning Sonar, Ph.D. Thesis, Department of Ocean Sciences, Tokyo University of Marine Science and Technology (2004). (in Japanese)
23. Tang, Y., Nishimori, Y., and Furusawa, M., “The average three-dimen-
sional target strength of fish by spheroid model for sonar surveys,” ICES Journal of Marine Science, Vol. 66, pp. 1176-1183 (2009).
24. Trenkel, V. M., Mazauric, V., and Berger, L., “The new fisheries multi-beam echosounder ME70: description and expected contribution to fish-eries research,” ICES Journal of Marine Science, Vol. 65, pp. 645-655 (2008).
25. Weill, A., Scalabrin, C., and Diner, N., “MOVIES-B: an acoustic detec-tion description software. Application to shoal species’ classification,” Aquatic Living Resources, Vol. 6, pp. 255-267 (1993).