Embed Size (px)
DESCRIPTION
Humans has started rising higher due to lace in horizontal space, Building taller structures hasbecome a common trend. But as this vertical limits is pushed the risk factor increase. Skyscraperhas to be analyzed for various loads to provide safety. Behavior of a structure is most critical duringearthquake thus it is important to analyze a structure for seismic resistance. Earthquake is anunpredictable hazard having power to bring a high raised structure to ground. Thus it is importantto analysis a structure for seismic force. Seismic coefficient method can be used to analyze smalland medium height structure up to 40m. It is a simple method of analysis and required lesscalculation. The behavior of a structure depends critically on overall shape, size and geometry. Asan asymmetrical structure behave more critically during earthquake as compared to a symmetricalstructure. A study on the behavior of symmetrical, L-shape and T-shape RC building duringearthquake is done to understand different in seismic loading and difference in behavior due todifferent shape. A 10 store building with height of each floor 3m having different shape assymmetrical, L-shape and T-shape in plan are analyses by seismic coefficient method with the helpof ETABS software. As manual analysis of as structure that is 10 store high is a time consumingjob and probability of errors is also increases. ETABS may provide an easy, efficient and accurateway to analyze a structure. The analysis is done as per IS 1893:2002 (Part-1). Estimation ofresponse such as; lateral forces, base shear, storey drift, storey shear etc. is carried out for all thedifferent shaped RC buildings and Compared based on response given by different shaped building.
Citation preview

i
ABSTRACT
Humans has started rising higher due to lace in horizontal space, Building taller structures has
become a common trend. But as this vertical limits is pushed the risk factor increase. Skyscraper
has to be analyzed for various loads to provide safety. Behavior of a structure is most critical during
earthquake thus it is important to analyze a structure for seismic resistance. Earthquake is an
unpredictable hazard having power to bring a high raised structure to ground. Thus it is important
to analysis a structure for seismic force. Seismic coefficient method can be used to analyze small
and medium height structure up to 40m. It is a simple method of analysis and required less
calculation. The behavior of a structure depends critically on overall shape, size and geometry. As
an asymmetrical structure behave more critically during earthquake as compared to a symmetrical
structure. A study on the behavior of symmetrical, L-shape and T-shape RC building during
earthquake is done to understand different in seismic loading and difference in behavior due to
different shape. A 10 store building with height of each floor 3m having different shape as
symmetrical, L-shape and T-shape in plan are analyses by seismic coefficient method with the help
of ETABS software. As manual analysis of as structure that is 10 store high is a time consuming
job and probability of errors is also increases. ETABS may provide an easy, efficient and accurate
way to analyze a structure. The analysis is done as per IS 1893:2002 (Part-1). Estimation of
response such as; lateral forces, base shear, storey drift, storey shear etc. is carried out for all the
different shaped RC buildings and Compared based on response given by different shaped building.

1 | P a g e
CHAPTER- 1
Introduction
An earthquake is the perceptible shaking of the Earth, which can be violent enough to destroy
major buildings and kill thousands of people. The severity of the shaking can range from barely
felt to violent enough to toss people around. Thus to reduce the loss of life due to earthquake it is
important to study earthquake and behaviour of building during earthquake.
1.1) Earthquake and its effect on buildings
An earthquake is the resulted due to sudden release of energy in the earth's crust that creates
seismic waves. Earthquakes are caused mostly by rupture of geological faults, but also by other
events such as volcanic activity, landslides, mine blasts, and nuclear tests.
Fig No. 1.1- Number of Earthquake per year

2 | P a g e
1.1.1) Behavior of Structure during Earthquake
In recent times, reinforced concrete buildings have become common in India, particularly in
towns and cities. Ground shaking is experienced during earthquake, building resting on the on
it will experience motion at its base. From Newton's First law of Motion, even though the base
of the building moves with the ground, the roof has a tendency to stay in its original position.
But since the walls and columns are connected to it, they drag the roof along with them. This
is much like the situation that you are faced with when the bus you are standing in suddenly
starts; your feet move with the bus, but your upper body tends to stay back making you fall
backwards!! This tendency to continue to remain in the previous position is known as Inertia.
In the building, since the walls or columns are flexible, the motion of the roof is different from
that of the ground (Figure 1.2). The force experienced by the roof due to drag of base structure
is knows as Inertia Force. [13]
Fig. No. 1.2- Effect on Inertia in building during earthquake

3 | P a g e
Inertia force in brief can be explained by Newton's Second Law of Motion, the inertia force F
is mass M times acceleration A (F=M x A), and its direction is opposite to that of the
acceleration. Clearly, more mass means higher inertia force. Therefore, lighter buildings
sustain the earthquake shaking better.
As the load transferred take place the inertia force experienced by the roof is transferred to the
ground via the columns, causing forces in columns. The forces are also generated due to
earthquake shaking, the columns undergo relative movement between their ends. (Figure 1.3).
As columns try to come back to the straight vertical position, i.e., columns resist deformations.
In the straight vertical position, the columns carry no horizontal earthquake force through them.
But, when forced to bend, they develop internal forces. The larger is the relative horizontal
displacement u between the top and bottom of the column, the larger this internal force in
columns.
Fig. No. 1.3- Inertia force in columns

4 | P a g e
1.1.2) Importance of Size and Shape of Building during Earthquake
The behaviour of a building during earthquakes depends critically on its overall shape, size
and geometry, in addition to how the earthquake forces are carried to the ground. A desire to
create an aesthetic and functionally efficient structure drives architects to conceive wonderful
and imaginative structures. Sometimes the shape of the building catches the eye of the visitor,
sometimes the structural system appeals, and in other occasions both shape and structural
system work together to make the structure a marvel.
In general, buildings with simple geometry in plan (Fig. No. 1.4) have performed well during
strong earthquakes. Buildings with re-entrant corners, like those U, V, and + shaped in plan
(Fig. No. 1.4), have sustained significant damage. Many times, the bad effects of these interior
corners in the plan of buildings are avoided by making the buildings in two parts. For example,
an L-shaped plan can be broken up into two rectangular plan shapes using a separation joint at
the junction (Fig. No. 1.4). Often, the plan is simple, but the columns/walls are not equally
distributed in plan. Buildings with such features tend to twist during earthquake shaking. [13]
Fig No. 1.4- Shapes of building
5 | P a g e
Twisting or torsional movement in a building is created due to irregularity in structure. As
earthquake force act on the center of mass of building and its resultant acts at the center of
stiffness of building. Due to difference in center of mass and center of stiffness of building
torsional movement is generated.
The twisting can be easily understood by the classic swing example
Swing - a wooden cradle tied with coir ropes to the sturdy branch of an old tree.
Consider swing tied by two identically equal rope. It swings equally, when you sit in
the middle of the cradle. Buildings too are like these rope swings; just that they are
inverted swings (Fig. No. 1.5). The vertical walls and columns are like the ropes, and
the floor is like the cradle. Buildings vibrate back and forth during earthquakes.
Buildings with more than one storey are like rope swings with more than one cradle.
Fig. No. 1.5- Behavior of building

6 | P a g e
Now consider same cradle and if you sit at one end of the cradle, it hoists (i.e., moves
more on the side you are sitting). This also happens sometimes when more of your
friends bunch together and sit on one side of the swing. Likewise, if the mass on the
floor of a building is more on one side (for instance, one side of a building may have a
storage or a library), then that side of the building moves more underground movement
(Fig. No. 1.6). This building moves such that its floors displace horizontally as well as
rotate. Twisting is due to unequal distribution of load.
Fig. No. 1.6- Twisting due to unequal distribution of mass

7 | P a g e
Now considering the same cradle but with two ropes which the cradle is tied to the
branch of the tree be different in length. Such a swing also twists even if you sit in the
middle (Fig. No. 1.7). Similarly, in buildings with unequal structural members (i.e.,
frames and/or walls) also the floors twist about a vertical axis (Fig. No. 1.7) and
displace horizontally. Likewise, buildings, which have walls only on two sides (or one
side) and flexible frames along the other, twist when shaken at the ground level (Fig.
No. 1.7). Twisting is due to Unequal distribution of Stiffness.
Fig. No. 1.7- Twisting due to irregularity in stiffness

8 | P a g e
1.1.3) Necessity of Seismic Analysis
The engineers do not attempt to make earthquake proof buildings that will not get damaged
even during the rare but strong earthquake; such buildings will be too robust and also too
expensive. Instead, the engineering intention is to make buildings earthquake resistant; such
buildings resist the effects of ground shaking, although they may get damaged severely but
would not collapse during the strong earthquake. Thus, safety of people and contents is assured
in earthquake-resistant buildings, and thereby a disaster is avoided. This is a major objective
of seismic design codes throughout the world. [13]
The earthquake design philosophy may be summarized as follows (Figure 1.8):
Fig. No. 1.8- Performance of building under different intensity of earthquake shake

9 | P a g e
(a) Under minor but frequent shaking, the main members of the building that carry vertical and
horizontal forces should not be damaged; however building parts that do not carry load may
sustain repairable damage.
(b) Under moderate but occasional shaking, the main members may sustain repairable damage,
while the other parts of the building may be damaged such that they may even have to be
replaced after the earthquake
(c) Under strong but rare shaking, the main members may sustain severe (even irreparable)
damage, but the building should not collapse.
Thus, after minor shaking, the building will be fully operational within a short time and the
repair costs will be small. And, after moderate shaking, the building will be operational once
the repair and strengthening of the damaged main members is completed. But, after a strong
earthquake, the building may become dysfunctional for further use, but will stand so that
people can be evacuated and property recovered.
Damage in Buildings: Unavoidable
Design of buildings to resist earthquakes involves controlling the damage to acceptable levels
at a reasonable cost. Contrary to the common thinking that any crack in the building after an
earthquake means the building is unsafe for habitation, engineers designing earthquake-
resistant buildings recognize that some damage is unavoidable. Different types of damage
occur in buildings during earthquakes. Some of these cracks are acceptable (in terms of both
their size and location), while others are not. For instance, in a reinforced concrete frame
building with masonry filler walls between columns, the cracks between vertical columns and
masonry filler walls are acceptable, but diagonal cracks running through the columns are not
(Fig. No. 1.9). Earthquake-resistant design is therefore concerned about ensuring that the
damages in buildings during earthquakes are of the acceptable variety, and also that they occur
at the right places and in right amounts.

10 | P a g e
Fig. No. 1.9- Diagonal crack in column
This approach of earthquake-resistant design is much like the use of electrical fuses in houses:
to protect the entire electrical wiring and appliances in the house, you sacrifice some small
parts of the electrical circuit, called fuses; these fuses are easily replaced after the electrical
overcurrent. Likewise, to save the building from collapsing, you need to allow some pre-
determined parts to undergo the acceptable type and level of damage.

11 | P a g e
1.2) Necessity of High Rise Building
Scarcity of land in fast growing city like Mumbai, Ahmedabad, Surat, etc. has raised the need of
vertical growth. With increasing population and restriction in horizontal development due to
scarcity in land, construction of number of skyscrapers or high raised building has increased.
Increase in high raised building is due to:-
Rapid growth of population in urban communities, and therefore the constant pressure of
the limited land area affected the evolution of building.
Table No. 1.1- Population growth [15]
Horizontal Development gets restricted due to less space & then vertical growth is the
ultimate option available.
Expensive land prices.
The high cost of setting up infrastructure for new cities.
Improving the esthetic view of the city.
With increase in height of building, human & economic losses due to various natural & human
hazards also increases. Thus high raised building should be designed in such a way that they can
resist against various forces.
Behaviour of a structure is vulnerable during an earthquake. Thus it is necessary to study the forces
and behaviour of structure during earthquake and designing structure in such a way that it can
withstand earthquake without collapsing.
Current Population of Gujarat in 2015 65,105,237
Population in 2014 63,891,303
Population of Gujarat in 2013 62,700,003
Population of Gujarat in 2012 61,530,916
Population of Gujarat in 2011 60,383,628

12 | P a g e
1.3) Introduction to ETABS
In this study, behaviour of building during earthquake were deliberate by the help of ETABS.
ETABS stands for Extended Three-dimensional Analysis of Building System. ETABS is an
analysis and design software for analyzing and designing a building.
1.3.1) Introduction to ETABS
ETABS is an engineering software for analysis and design of multistory structure. ETABS
is in use for 30 years and is developed by Computers and Structures, Inc. (CSI). CSI was
founded in 1975, is recognized globally as the pioneering leader in software tools for
structural and earthquake engineering. Software from CSI is used by thousands of
engineering firms in over 160 countries for the design of major projects. CSI also provides
various different products for analyzing and designing of different structures as SAP2000,
CSiBridge, ETABS, SAFE, PERFORM-3D and CSiCOL. [16]
Fig No. 1.10- ETABS

13 | P a g e
ETABS is a 3D object based modeling and visualization software, blazingly fast linear and
nonlinear analytical power, sophisticated and comprehensive design capabilities for a wide-
range of materials, and provides reports, and schematic drawings that allow quick and easy
understanding of analysis and design results.
ETABS integrates every aspect of the engineering design process. Creation of models in
ETABS is easier - intuitive drawing commands allow for the rapid generation of floor and
elevation framing. CAD drawings can be converted directly into ETABS models or used as
templates onto which ETABS objects may be overlaid. ETABS also helps in Design of steel
and concrete frames (with automated optimization), composite beams, composite columns,
steel joists, and concrete and masonry shear walls. Models can be rendered, and all results
can be seen directly on the structure. Comprehensive and customizable report is available for
all analysis and design output, and schematic construction drawings of framing plans,
schedules, details, and cross-sections may be generated for concrete and steel structures.
ETABS has a wide selection of templates for quickly starting a new model. At this model
template stage, the user has the ability to define grid and grid spacing, the number of stories.
It follow various international codes which helps user to analyze and design the structure as
per their code. Various kind of different load can be applied in etabs such as Super dead load,
Live load, Seismic load, Wind load, etc. ETABS provides the support of IS 1893:2002 for
seismic analysis of a building & provides the analysis results for various load combinations.
1.3.2) Features of ETABS
One Window, Many Views: - ETABS provides a single user interface to perform:
Modeling, Analysis, Design, Detailing, and Reporting.
Templates: - ETABS has a wide selection of templates for quickly starting a new
model. The user has the ability to define grid and grid spacing, the number of stories,
the default structural system sections.

14 | P a g e
Automated Code Based loading: - ETABS will automatically generate and apply
seismic and wind loads based on various domestic and international codes.
Load Cases and Combinations: - ETABS allows for an unlimited number of load
cases and combinations. Load combination types.
Mixed Units: - ETABS gives users full control of the units used with all model data
and displays results in the units desired. Whether architectural units or analysis
results units, you can have any combination of units throughout your model.
Deformed Geometry: - Users can display deformed geometry based on any load or
combination of loads, as well as animations of modes.
Reaction Diagrams: - Support reactions can be displayed graphically on the model
either as vectors or as tabular plots for selected reaction components.
Report Generation: - The report generator features include an indexed table of
contents, model definition information, and analysis and design results in tabulated
format. Reports are viewable within ETABS 2013 with live document navigation
connected to the Model Explorer and directly exportable to Microsoft Word.
1.3.3) History of ETABS
Etabs is originally development of TABS over 30 year by CSI.
The software is used by millions of engineers over 160 countries and is leading
tool for structural and earthquake engineering
ETABS was used to create the mathematical model of the Burj Khalifa, currently
world's tallest building designed by Skidmore, Owings and Merrill (SOM).
ETABS was used to analyze Taipei 101 Tower in Taiwan, One World Trade
Center in New York, the 2008 Olympics Birds Nest Stadium in Beijing, etc.
ETABS is commonly used to analyze: Skyscrapers, parking garages, steel &
concrete structures, low rise buildings, portal frame structures and high rise
buildings.
Other CSI software also helped in designing the cable-stayed Centenario Bridge
over the Panama Canal.
15 | P a g e
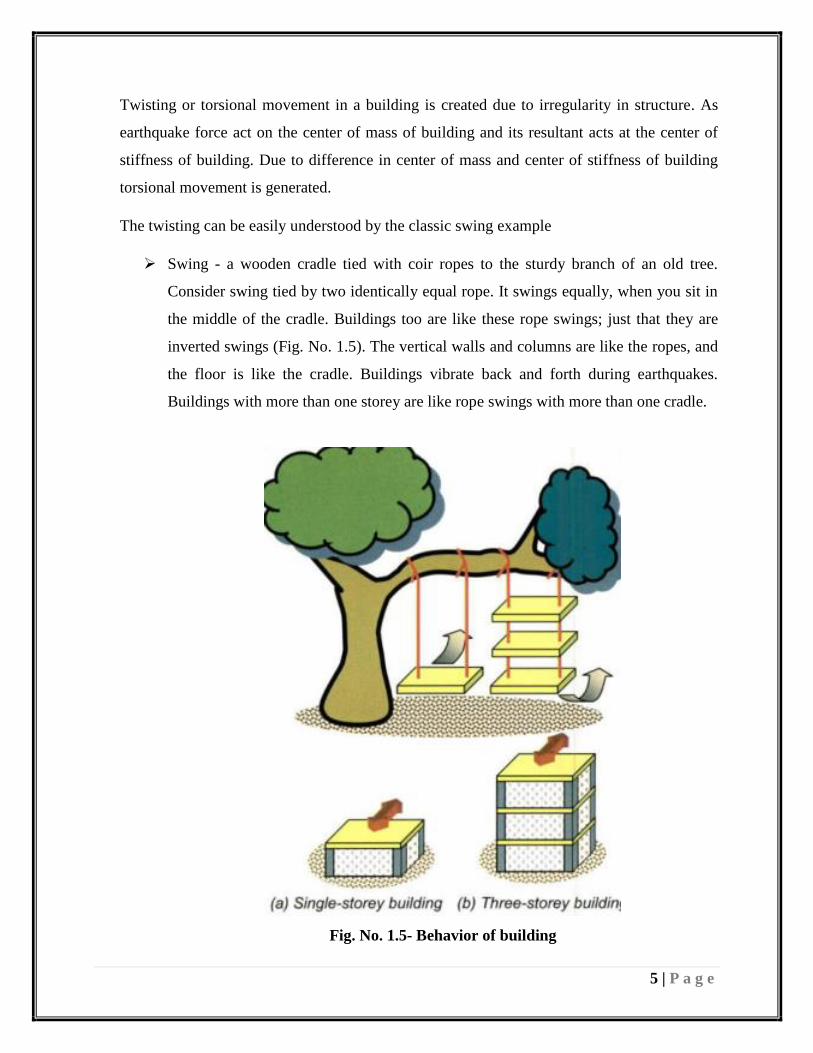
1.4) Objectives
1. To study behavior of high-rise RC building during earthquake.
2. Effect of seismic load on structure due to plan irregularity.
3. To compute lateral force on each levels due to seismic force.
4. To check the maximum allowable response of structure.
5. To study behavior of different shaped buildings in plan during earthquake.
6. Compute the torsional movement in structure due to irregularity in mass and stiffness.
7. To study the software and provide accurate and quicker analysis results by the use of
ETABS.
Fig. No. 1.11- Objectives
objectives
Learn software
Safety/ economy
Achieve accuracy
Save time

16 | P a g e
CHAPTER- 2
Literature Survey
For the brief understanding of earthquake, forces generated in building due to earthquake and
behaviour of building during earthquake Various research papers were studied.
2.1) Reviews of Research Papers
Mohammed yousuf ET.AL [1] carried out dynamic analysis of RC building with plan
irregularity. Four models of G+5 building with one symmetry plan and remaining irregular
plan. The analysis was carried out by ETABS 9.5 as per IS 1893:2002(Part-1). After
analyzing they concluded that Irregularity in plan can result in complex dynamics and
irregular response. Base shear is higher in rectangular building comparing to L-shaped
building. Asymmetrical building requires more accurate analysis therefore Response
Spectrum Method should be used.
Rucha S. Banginwar, ET.AL [2] attempted to evaluate the effect of plan configurations on
the response of structure by response spectrum method. They studied the effect of
difference geometrical configurations on the behavior of structure of the already
constructed building located in the same area during earthquake. After analyzing as per IS
1893:2002 (Part-1) they concluded the plan configurations of structure has significant
impact on the seismic response of structure in terms of displacement, story drift, story shear.
Building with severe irregularity shows maximum displacement and storey drift.
Maximum torsion observed in building with high irregularity plan.

17 | P a g e
DEEPAK SUTHAR, ET.AL [3] studied the evolution of tall building’s structural systems
and analyzed the residential high rise building for seismic forces by both static and dynamic
method considering two type of structural system. Model I -regular frame system i.e.
normal column-shear wall beam slab system and Model II - modular wall slab system.
Carried out the analysis by using ETABS. After analyzing they concluded the story drift,
lateral displacement and time period is more in model I as compared to model 2. The results
were more conservative in Static analysis as compared to the dynamic method resulting
uneconomical structure. As building was in irregular “L-shape” the behavior in both
direction is not similar.
Mr. Sandesh N. Suryawanshi, ET.AL [4] studied the complex behavior of structure under
asymmetric form and influence of torsional moment on the behavior of structure by using
Response spectrum method. A simplified nonlinear pushover analysis was used to find
structural descriptors required in seismic vulnerability assessment by using software
SAP2000. After analysis they concluded that the time period and base shear calculation by
using equivalent static method is approximately equal with response spectrum method in
SAP. Comparing the torsional moment (TM) in beam shows that TM in asymmetrical
building is more than symmetrical. Equivalent static method and response spectrum
method in SAP showed that, base shear and roof displacement for asymmetrical building
is more than symmetrical building. Formation of hinges in asymmetrical building is more
and early than symmetrical building.
Prof. Wakchaure M. R, ET.AL [5] studied the influence of the torsion effects on the
behavior of structure. 2 cases are considered in study, case one is without considering
torsion and case two is considering torsion. The Indian standard code of practice IS-1893
(Part I: 2002) is used for guidelines and methodology. After analyzing they concluded that
asymmetric building case 2, that is without considering torsion, the area of steel in the
beams at critical stage are much smaller than those in case 1, that is with considering torsion.
Therefore torsional behavior of asymmetric building is one of the most frequent source of
structural damage and failure during strong ground motions.

18 | P a g e
C. Justine Jose, ET.AL [6] studied response of tall symmetric buildings during earthquake.
Design moments of columns and roof displacements were taken as the parameters of the
study to find the torsional effect on building during earthquake. After analysis they
concluded that the torsional mode has significant effect from low raised buildings onwards
even for symmetric structures. The symmetric buildings exhibited torsional effects only
when the torsional time period T has a value between 0.55s and 4s.
Neha P. Modakwar, ET.AL [7] study different irregularity and torsional response due to
plan and vertical irregularity and to analyze cross shape and L shape building while
earthquake forces acts and calculated additional shear due to torsion in the columns. The
study initiated to quantify the effect of different degrees of irregularity on Structures
designed for earthquake using simplified analysis. The types of irregularity Considered
was (a) Horizontal Irregularity- Reentrant corner (b) Vertical Irregularity -Mass
Irregularity. The analysis showed the Re-entrant corner columns are needed to be stiffened
for shear force in the horizontal direction perpendicular to it as significant variation is seen
in these forces. For torsional effect the re-entrant corner columns must be strengthen at
lower floor levels and top two floor levels and from the analysis they observed that
behavior of torsion is same for all zones.
Dr. S.K. Dubey, ET.AL [8] studied different irregularity and torsional response due to plan
and vertical irregularity, and to analyze “T”-shaped building while earthquake forces acts
and calculated additional shear due to torsion in the columns. After analyzing they
concluded that buildings with irregularities are prone to earthquake damage. Soft storey-
For all new RC frame buildings, the best option is to avoid such sudden and large decrease
in stiffness and/or strength in any storey.
Shantanu S. Magdum, ET.AL [9] studied inelastic seismic behaviour of multistoried
building with vertical setbacks were analyzed by IS code approach. Analyzed the torsion
effect on building and studied the Designs of asymmetric multistoried building. Study

19 | P a g e
shows that there is increase in shear force due to torsion in column and increase in area of
steel reinforcement in column particularly at the edge member of the building. There was
4.53 % increase in the displacement due to torsion.
Sachin G. Maske, ET.AL [10] studied influence of the torsion effects on the behaviour of
structure. In study two cases are considered, case one is without considering torsion and
case two is considering torsion. Results were compared in terms of % Ast in columns. The
analysis showed the asymmetric building case 2, the forces in the columns located in the
stiff side of the plan are much smaller than those in the elements of the flexible side of the
plan. There is no significant change in column forces around center of rigidity.
P. P. Chandurkar, ET.AL [11] studied the effect of shear wall on building. 2 modal with
and without shear wall were analyzed with Parameters like Lateral displacement, story drift
and total cost required for ground floor were calculated in both the cases replacing column
with shear wall. After seismic analysis they concluded that changing the position of shear
wall will affect the attraction of forces, so that wall must be in proper position. Major
amount of horizontal forces are taken by shear wall. Providing shear walls at adequate
locations substantially reduces the displacements due to earthquake.
M. L. Saldivar, ET.AL [12] studied seismic vulnerability of existing mid-rise buildings. A
nonlinear incremental static analysis of building was done. Study evaluated two apartment
complexes built with obsolete regulations. After analyzing they show the damages were
mainly found where there in discontinuity of rigidity.

20 | P a g e
2.2) Conclusion base on Review of Research Papers
1. Seismic coefficient method is easy and convenient method of seismic analysis of
building up to the height of 40m (10-12 storey).
2. Building height more than 40 meter should be analyzed by response spectra method.
The method is highly accurate compared to seismic coefficient method.
3. An asymmetrical building will behave different in both direction during earthquake.
4. Torsional effect is observed in a building having vertical and horizontal irregularity.
5. Displacement in building increase by 4-5% due to torsional effect.
6. Earthquake effect on building can be minimized by providing shear wall.
7. Damage in a building due to earthquake is mainly found where there is discontinuity
of rigidity.

21 | P a g e
CHAPTER- 3
Methodology and Input Data
Seismic analysis of buildings can be done by various different methods. For the study Seismic
coefficient method of analysis is used as the method is easy and convenient. Method analysis is
generally used for the building up to the height of 40m (10-12 storey).
3.1) Seismic Coefficient Method
The seismic coefficient is easiest method for calculation of seismic forces on building. In this
method, first, the design base shear is calculated for the whole building, and it is then distributed
along the height of the building, as explained below: [17]
a) Determination of base shear :
The total design lateral force or design seismic base shear (VB) along any principal direction
shall be determined by the following expression:
(IS: 1893 (Part-1) – 2002, Cl. 7.5.3, Pg. 24)
VB = Ah.w
Where,
VB = total design lateral force at the base of a structure.
Ah = design horizontal acceleration spectrum value
W = seismic weight of the building
Seismic weight (w):
Seismic weight of floor system
= dead weight of slab + weight of beam + half of the weight of columns above and below
the floor + half of the weight of wall above and below the flow.

22 | P a g e
Imposed load (live load):
As per IS 1893 (1) – 2002, cl. 7.3.1 the percentage of imposed load as given in table
1.3 should be used. For calculating the design seismic forces of the structure the
imposed load on the roof need not to be considered.
Table No. 3.1- Percentage of imposed load to be considered in seismic weight calculation
(IS 1893 (Part-1):2002, Cl. 7.3.1)
Imposed uniformly distributed floor loads
(KN/M2)
Percentage of imposed
load
Up to and including 3.0 25
Above 3.0 50
Design horizontal seismic coefficient (Ah):
Seismic coefficient is calculated as per IS: 1893 (1) -2002, cl. 6.4.2, pg. 14.
Ah = (Z I Sa / 2 R g)
For any structure with T < 0.1 S, the value of Ah will not be taken less than Z/2
whatever be the value of I/R.
Where,
Z = zone factor
I = importance factor
R = response reduction factor
Sa/g = average response acceleration coefficient
23 | P a g e
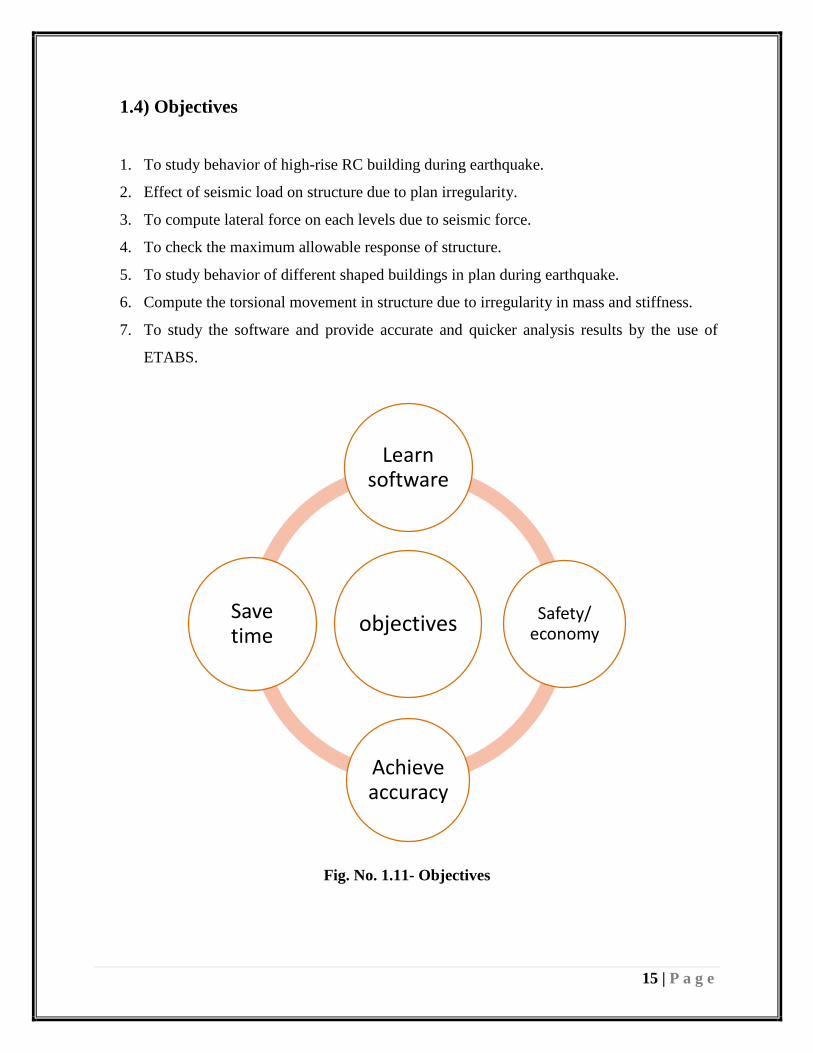
Zone factor (Z):
The value of zone factor (Z) given in table is for the maximum considered earthquake.
The factor 2 in the denominator of Z is used so as to reduce the MCE zone factor to the
factor for design basis earthquake (DBE).
Table No. 3.2- Zone factor (Z) (IS 1893 (Part-1):2002, cl. 6.4.2)
Seismic
zone II III IV V
Seismic
Intensity low Moderate severe
Very
severe
Z 0.10 0.16 0.24 0.36
Fig. No. 3.1- Seismic zone in INDIA

24 | P a g e
Importance factor (I):
Importance factor depends on the functional use of the structures, characterized by
hazardous consequences of its failure, post- earthquake function need, historical value,
or economic importance. The values of importance factor (I) are given table.
Table No. 3.3- Importance factor, I (IS 1893 (Part-1):2002, cl. 6.4.2)
SI. NO.
(1)
STRUCTURE
(2)
Importance
Factor
(3)
(I)
Importance service and community building, such as
hospitals; schools; monumental structures; emergency
building like telephone exchange, television stations,
radio community halls like cinemas, assembly halls and
subway station, power station.
1.5
(ii) All other building 1.0
Response reduction factor (R):
It depends on the perceived seismic damage performance of the structure, characterized
by ductile or brittle deformations. However, the ratio I/R shall not be greater than I.
Table No. 3.4- Response reduction factor, R for building systems
(IS 1893 (Part-1):2002, cl 6.4.2)
Sr. no.
(1)
Lateral load resisting system
(2)
R
(3)
(I) Ordinary RC moment – resisting frame(OMRF)2 3.0
(ii) Special RC moment – resisting frame (SMRF)3 5.0

25 | P a g e
Average response acceleration coefficient (Sa/g):
It is a factor which represent the acceleration response of the structure under earthquake
ground vibrations. It depends on the natural period and damping of the structure. For
rock or different types of soil the values of Sa/g are given in fig.
Fig. No. 3.2- Average response acceleration coefficient- Chart
Multiplying factor for obtaining values for other damping is given in table
below.
Table No. 3.5- Damping factor (IS 1893 (Part-1):2002, cl. 6.4.2)
Damping
Percent 0 2 5 7 10 15 20 25
Factor 3.20 1.40 1.00 0.90 0.80 0.70 0.60 0.55

26 | P a g e
Fundamental natural period (Ta):
Ta = 0.075 h0.75 …… for moment resisting frame building without brick infill panel
(RC frame).
Ta = 0.085 h0.75 …… for moment resisting frame building without brick infill panel
(Steel Panels).
Ta = 0.09 h / √d …… for all other building including moment resisting frame
with brick infill panels.
Where,
h = height of building (m)
d = base dimension of building at the plinth level in m, along the considered
direction of the lateral force.
b) Distribution of base shear :
The design base shear shall be distributed along the height of the building as per the
following expression:
Q = Vn (Wi hi 2 / ∑ Wi hi 2)
Where,
Q = design lateral force at floor I,
Wi = seismic weight of floor I,
hi = height of floor I measured from base,
n = number of storey

27 | P a g e
3.2) Input Data
Shape:-
Rectangular
Fig. No. 3.3- Rectangular building
L- Shaped
Fig. No. 3.3- L- shape building

28 | P a g e
T- Shaped
Fig. No. 3.3- T- shape building
Grid Data:-
Table No. 3.6- Grid data
Grid Data
No. of grid Span 1 2 3 4 5 6 Total length of grid
Size of
Grid
X (m) 4 4 4 4 4 4 24
Y (m) 4 4 4 4 4 - 20

29 | P a g e
Height of building:-
Table No. 3.7- Height of building
Height of Building
Name Height Elevation
m m
STORY10 3 30
STORY9 3 27
STORY8 3 24
STORY7 3 21
STORY6 3 18
STORY5 3 15
STORY4 3 12
STORY3 3 9
STORY2 3 6
STORY1 3 3
BASE 0 0
Material detail:-
Concrete- M 25
Steel- Fe 415
Structural Detail:-
Table No. 3.8- Structural Detail
Structural Detail
Stru.\Size B D Clear Cover
Beam 300 mm 500 mm 40 mm
Column 300 mm 300 mm 40 mm
Slab -- 150 mm --

30 | P a g e
Load applied and mass sources for seismic analysis:-
Table No. 3.9- Loading & Mass sources
Load applied & Mass source for seismic analysis
Name Load Detail Multiplier for seismic analysis
DEAD Self-Weight 1
LIVE 5kN/m2
on slab
0.5
(IS 1893
(Part-1):2002)
FF 1.2 Kn/m2 on slab 1
WALL 13.8 Kn/m- on beam 1
Seismic Details:-
Data for seismic analysis are taken from IS 1893 (Part-1):2002 as per criteria and
selected location of building. In this case building is situated at Ahmedabad and is
constructed over a medium soil strata.
Table No. 3.10- Seismic Data
Seismic Details (As per IS:18920) Scale Factor
for Response
spectrum Damping
Z
(Zone
Factor)
Soil
Type T(time)
I
(Impor.
Factor)
R
(Response
reduction)
5% 0.16 II
1.5
5
X (Sec) Y (Sec) 0.981
0.551 0.603
𝑡 =0.09ℎ
√𝑑 𝑆𝐹 =
𝐼𝐺
2𝑅
31 | P a g e
CHAPTER- 4
Modeling and Analysis in ETABS
ETABS 2013 is used for the seismic analysis of buildings by seismic coefficient method. Building
response for Base shear, Story drift, Displacement, torsional movement were studied using ETABS.
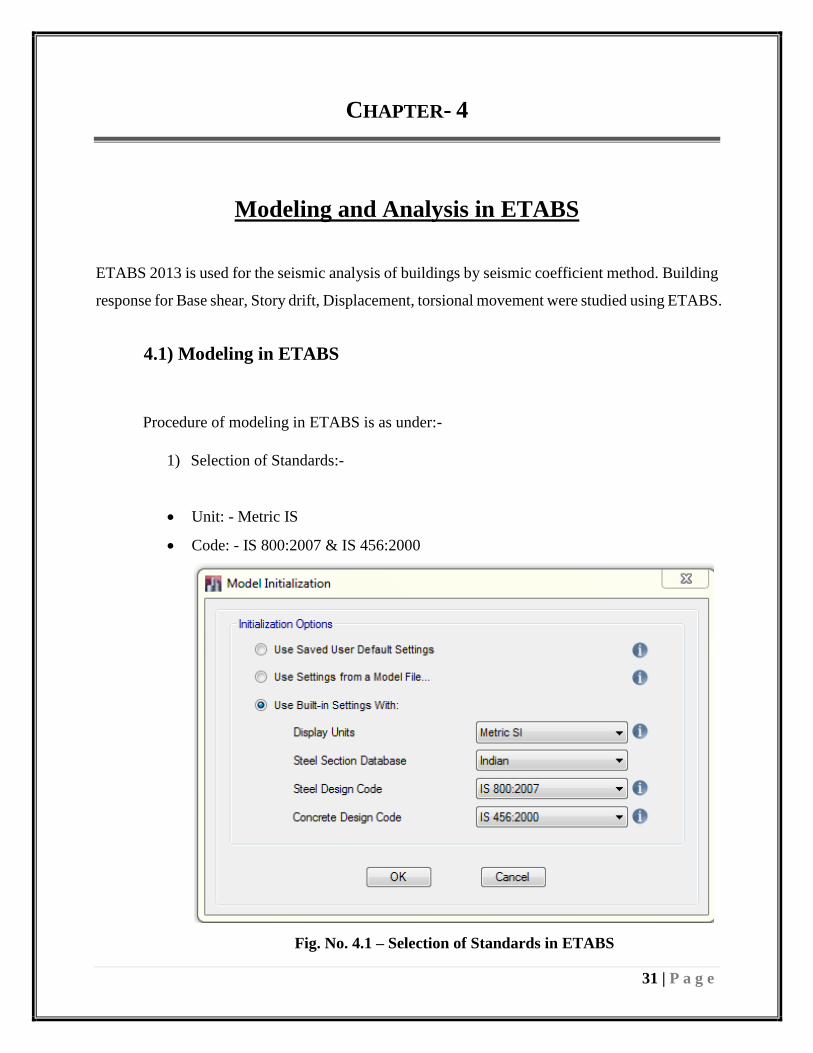
4.1) Modeling in ETABS
Procedure of modeling in ETABS is as under:-
1) Selection of Standards:-
Unit: - Metric IS
Code: - IS 800:2007 & IS 456:2000
Fig. No. 4.1 – Selection of Standards in ETABS

32 | P a g e
2) Defining Grid:-
Number and size of bay in X & Y direction.
Number of storey and height of typical store.
Modeling can be started with a predefined templates or grid can be imported from
a CAD file.
Grid of various beam can prepared by centerline command in AutoCAD & with the
help of drawing given by architect columns and beam can be provided in ETABS.
Fig. No. 4.2 – Defining Grid

33 | P a g e
3) Define material:-
Concrete (M20, M25, M30...)
Rebar’s (Mild steel, HYSD...)
Properties such as ultimate strength, characteristic strength, yield strength etc. can
be redefined.
New material can be added with its different properties such as elasticity, density,
Poisson ratio, shear modulus etc.
Fig. No. 4.3 – Defining Material

34 | P a g e
4) Define Frame Section:-
Beam, Column and Slab.
Reinforcement with different material can be provided.
Various details can be defined such as type of tie, dimensions of cover, minimum
& maximum diameter of bar.
Fig. No. 4.4- Defining Column

35 | P a g e
5) Define Loads:-
Dead Load, Floor finish, Wall load
Live Load
Seismic load (Detail for defining seismic load is describe in Cl-3.4)
Fig. No. 4.5- Defining Load

36 | P a g e
6) Mass Source Participation:-
Participation of mass during earthquake has to be defined.
Seismic weight of building depends on mass participation during earthquake.
Dead load provide 100% mass participation during earthquake.
Where live load participation depends on, LL > 3; multiplied by 0.5
Fig. No. 4.6- Mass Participation during earthquake

37 | P a g e
7) Modeling:-
Column, Beam, Slab, Defining Support
8) Assigning Load:-
Floor Finish & LL on Slab
Wall load on Beam
Fig. No. 4.7- Loading on slab and beam
9) Analyzing Frame:-
Frame is analyzed for Base Shear, CM & CR, Story Drift, etc.

38 | P a g e
4.2) Calculation of seismic load in ETABS
Before modeling in etabs, various loads on the structure are defined as shown above. While
defining seismic load various other data inputs are require for the analysis.
1) Code to use for seismic analysis
2) Direction of earthquake (X & Y)
3) Accidental eccentricity to be considered or not (5% as per code)
4) Response reduction factor (R) as per IS 1893 (Part-1):2002
5) Zone factor (Z) as per IS 1893 (Part-1):2002
6) Type of soil as per IS 1893 (Part-1):2002
7) Importance Factor as per IS 1893 (Part-1):2002
8) Time period as per IS 1893 (Part-1):2002
T= 0.09h/Sqrt (d)
9) Defining mass sources as per IS 1893 (Part-1):2002
Fig. No. 4.8- Seismic Load data

39 | P a g e
4.3) Check list for ETABS
Model in ETABS is prepared with the help of ETABS check list. Check list helps user during
modeling and data input. Check list shows various contents that are to be taken care of during
modeling a structure.
Check list shows a step wise modeling process with instructions for user for data input and analysis
required for different type of structures.
Check list helps a structural engineer to model a structure properly and an engineer to check the
different type of analysis carried out for designing the structure.
Table No. 4.1 - Check list for ETABS
Project No. : - Model by : - Date : -
Project Name : - Checked by : - Date : -
Sr.
No. Content / Description Engineer
(Design)
Engineer
( Check )
A Geometry Check
1 Basic layout of model & compare with Arch drawings & DBR
2 Check that distance between columns is from beam center to beam center
3 Check the code specifications
i) Concrete Frame Design
ii) Shear Wall Design
iii) Live Load Reduction
4 Check story data
i) Check no. of floors & compare with DBR & Arch drawings
ii) Check story height & compare with DBR & Arch drawings
5 Check all material properties in detail
i) Check concrete grade used & compare with DBR
ii) Check steel grade used & compare with DBR

40 | P a g e
iii) Check the modulus of elasticity
6 Check all defined frame sections
i) Check c/s dimensions
ii) Check property modifiers
iii) Check reinforcement & cover provided
iv) Check material used for section
7 Check all defined wall/ slab sections
i) Check section thickness
ii) Check material used for section
iii) Check type of section ( Shell or Membrane ) if shell (Mesh & Edge Constrain)
8 Check foundations restraints applied
9 Check all defined frame sections in geometry and modeled landing beams of stairs
to consider short column effect. ( Enable landing Beam for Torsion )
10 Check releases (Secondary Beam)
11 Check rigid diaphragms applied (check with senior engineer)
12 Check pier label for all wall sections and Check Overwrites for Wall Sections
B Loa ding Check
13 Check all defined static load cases
i) Check number of static load cases & its type
ii) Check the seismic code selected
iii) Check the seismic factors & compare with DBR (Consider Minimum eccentricity
for Eq.Forces)
iv) Check time period and compare with DBR (From Basement slab; if NO
basement than from Foundation)
14 Check load combinations defined & compare with DBR (For Regular geometry
structure NO 30% COMBO; for irregular geometry consider 30% combos.
15 Check mass source defined
16 Loading
i) Check unit of all load applied
ii) Check all loads to see if applied in proper category

41 | P a g e
iii) Check Big LL & Small LL
iv) Check temperature load if any
C Analysis Check
17 Check model for warnings or errors ( under "Analyze" tab )
18 Check Overwrites for frame and 1.2 DL + 0.5 LL, If P-Delta analysis is considered
19 Check the live load reduction factor as No live load reduction and also do not
consider special seismic design data
20 Run Analysis
21 Check deflection for beams and check all deformed shape of structure
22 Check LAST RUN LOG ANALYSIS for analysis warning and Error
23 If P-DELTA analysis than Check LAST RUN LOG ANALYSIS to See the ITERATION
CONVERGED; if not than INCREASE the number of ITERATION.
24 Check Mode-1 and Mode-2. It should be in pure translation, either X or Y
direction.(RZ should be less than 10% for Mode-1 and Mode-2)
25
Calculate design eccentricity. If it is less than permissible value than ok, otherwise
applied additional torsional moment at each diaphragm level. Consider the load
combination with additional torsional moment
26
Check the building structure for SOFT STOREY. The ratio of two successive story
should not be less than 0.7 if it is not than design the structure for twice the
magnitude of EQ.
27 Check limiting drift as per IS: 1893-2002 for service load combo.
28 Check the combinations that have been selected for design
29 Check applied EQ. Force, correctly as per IS CODE 1893:2002
30 Check for "load per unit area" ( for DL + LL )
D Design Check
31 Run Design for frame section and shear wall
32 Check for any frame section failures and shear wall failures
42 | P a g e
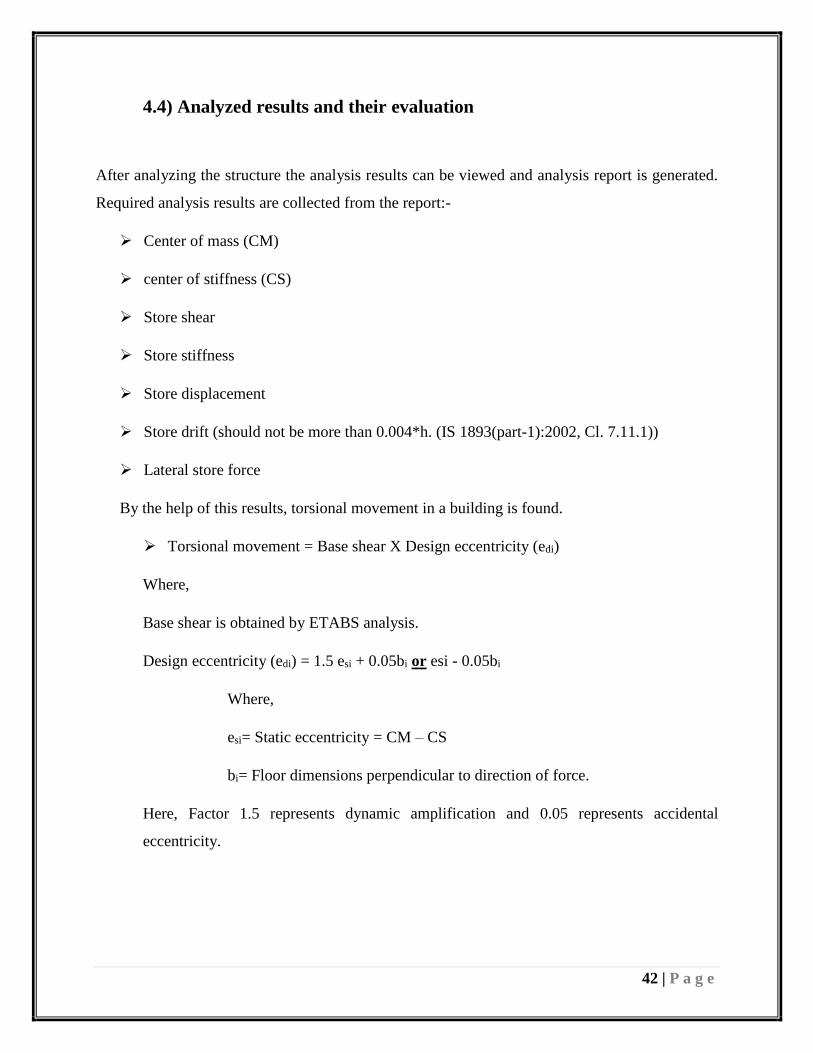
4.4) Analyzed results and their evaluation
After analyzing the structure the analysis results can be viewed and analysis report is generated.
Required analysis results are collected from the report:-
Center of mass (CM)
center of stiffness (CS)
Store shear
Store stiffness
Store displacement
Store drift (should not be more than 0.004*h. (IS 1893(part-1):2002, Cl. 7.11.1))
Lateral store force
By the help of this results, torsional movement in a building is found.
Torsional movement = Base shear X Design eccentricity (edi)
Where,
Base shear is obtained by ETABS analysis.
Design eccentricity (edi) = 1.5 esi + 0.05bi or esi - 0.05bi
Where,
esi= Static eccentricity = CM – CS
bi= Floor dimensions perpendicular to direction of force.
Here, Factor 1.5 represents dynamic amplification and 0.05 represents accidental
eccentricity.

43 | P a g e
CHAPTER- 5
Validation
For validation of results ETABS analysis results were cross checked by manual analysis results of
a problem given below:-
Plan and elevation of a three storey RCC school building is shown below (Fig. No. 5.1).
The intensity of dead load is 12 Kn/m2 (including column, beam and wall) and floor caries an
imposed load of 4 Kn/m2. The building is situated in zone IV. The type of soil encounter is medium
soil and it is proposed to design the building with special movement resistant frame. Determining
the seismic force using static coefficient method.
Fig. No. - 5.1- Plan and Elevation of building

44 | P a g e
5.1) Analysis by ETABS
IS1893 2002 Auto Seismic Load Calculation
This calculation presents the automatically generated lateral seismic loads for load pattern
seismic according to IS1893 2002, as calculated by ETABS.
Direction and Eccentricity
Direction = X-direction
Eccentricity Ratio = 5% for all diaphragms
Structural Period
Period Calculation Method = User Specified
User Period T = 0.286 sec
Factors and Coefficients
Seismic Zone Factor, Z [IS Table 2] Z = 0.24
Response Reduction Factor, R [IS Table 7] R = 5
Importance Factor, I [IS Table 6] I = 1.5
Site Type [IS Table 1] = II
Seismic Response
Spectral Acceleration Coefficient,
Sa /g [IS 6.4.5]
Sa
g=
1.36
T
Sa
g= 2.5
Equivalent Lateral Forces
Seismic Coefficient, Ah [IS 6.4.2] Ah =
ZISa
g
2R
Calculated Base Shear
Table No. 5.1- Base shear in building
Direction Period Used
(sec)
W
(Kn)
Vb
(Kn)
X 0.286 3200.00 288.00

45 | P a g e
5.2) Manual Analysis
Step: - 1- Lump mass of building
Dead load = (10 x 8) x 12 = 960 KN (Dead load of each floor and terrace).
Live load= 4 x0.5= 2 (50% as per IS 1893 (P-1):2002, page-24, Table- 8).
So L.L= 2 x (10 x 8) = 160 KN
Total load of building = DL of roof + DL of typical floor + LL of typical floor
Lump mass of building = 3200 KN
Step: - 2 – Fundamental natural period (Ta)
By IS 1893 (P.1):2002, Cl. 7.6.2
= 0.286 Sec
Step: - 3 – Design seismic Base shear (VB)
VB= Ah X w
All the value of Ah are taken from IS 1893 (P.1):2002
Ah = 0.09
So. VB = 0.09 X 3200 = 288 KN.
Analysis results of ETABS and manual analysis matches, thus it can be said that ETABS provide
genuine results as per Indian Standards. As manual analysis take more time and possibility of
errors are high it can be recommended to use ETABS for analysis of a structure is very helpful.
𝑡 =0.09ℎ
√𝑑
46 | P a g e
CHAPTER- 6
Results and Evaluation
After modeling of building or structure in ETABS, it is analyzed. On the base of the analysis result
a report is generate by ETABS containing detailed analysis results. Following results were
obtained after analysis:-
6.1) Structural Analysis Result by ETABS
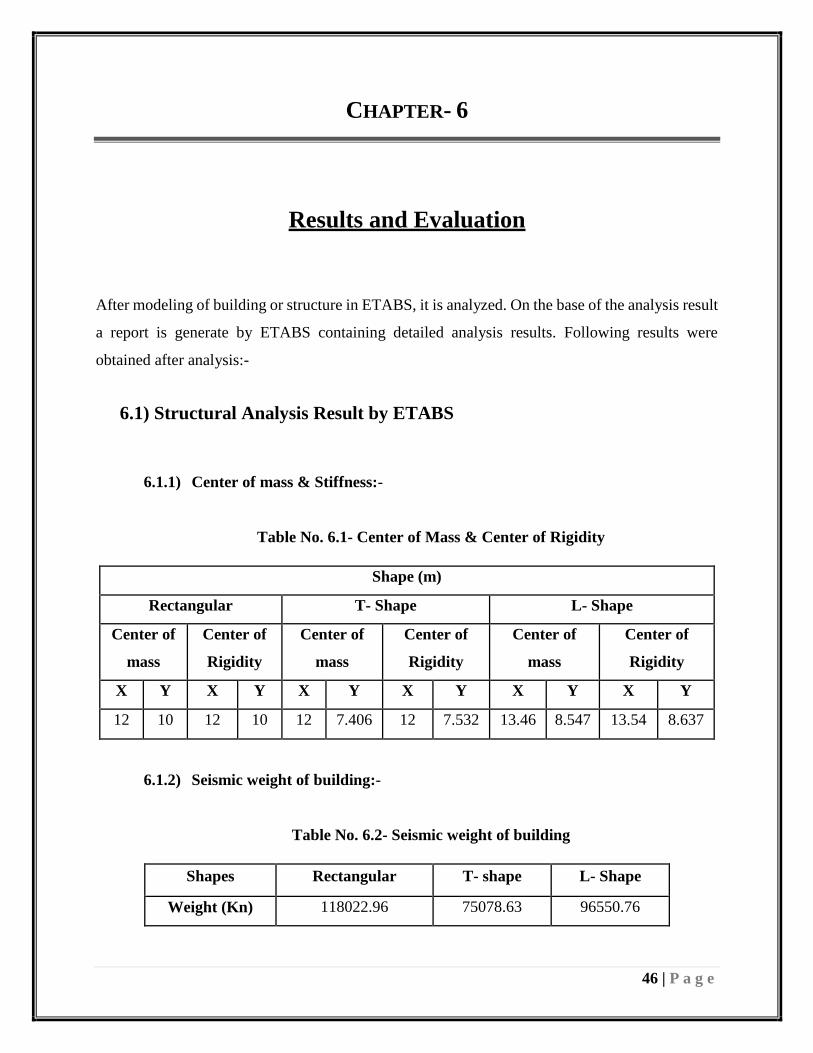
6.1.1) Center of mass & Stiffness:-
Table No. 6.1- Center of Mass & Center of Rigidity
Shape (m)
Rectangular T- Shape L- Shape
Center of
mass
Center of
Rigidity
Center of
mass
Center of
Rigidity
Center of
mass
Center of
Rigidity
X Y X Y X Y X Y X Y X Y
12 10 12 10 12 7.406 12 7.532 13.46 8.547 13.54 8.637
6.1.2) Seismic weight of building:-
Table No. 6.2- Seismic weight of building
Shapes Rectangular T- shape L- Shape
Weight (Kn) 118022.96 75078.63 96550.76

47 | P a g e
6.1.3) Story Shear:-
Table No. 6.3- Story Shear
Story- Shear (Kn)
Store
Shape
Rectangular T- Shape L- Shape
X Y X Y X Y
Store 10 1783.109 1627.748 1131.757 1033.148 1457.433 1330.449
Store 9 3262.877 2978.586 2073.813 1893.123 2668.345 2435.855
Store 8 4432.076 4045.914 2818.153 2572.61 3625.115 3309.262
Store 7 5327.244 4863.087 3388.039 3092.842 4357.642 3977.965
Store 6 5984.919 5463.459 3806.731 3475.054 4895.825 4469.256
Store 5 6441.638 5880.384 4097.489 3740.478 5269.563 4810.431
Store 4 6733.937 6147.216 4283.574 3910.35 5508.756 5028.783
Store 3 6898.356 6297.309 4388.247 4005.903 5643.301 5151.606
Store 2 6971.431 6364.017 4434.768 4048.371 5703.1 5206.194
Store 1 6989.7 6380.694 4446.398 4058.988 5718.049 5219.841
48 | P a g e
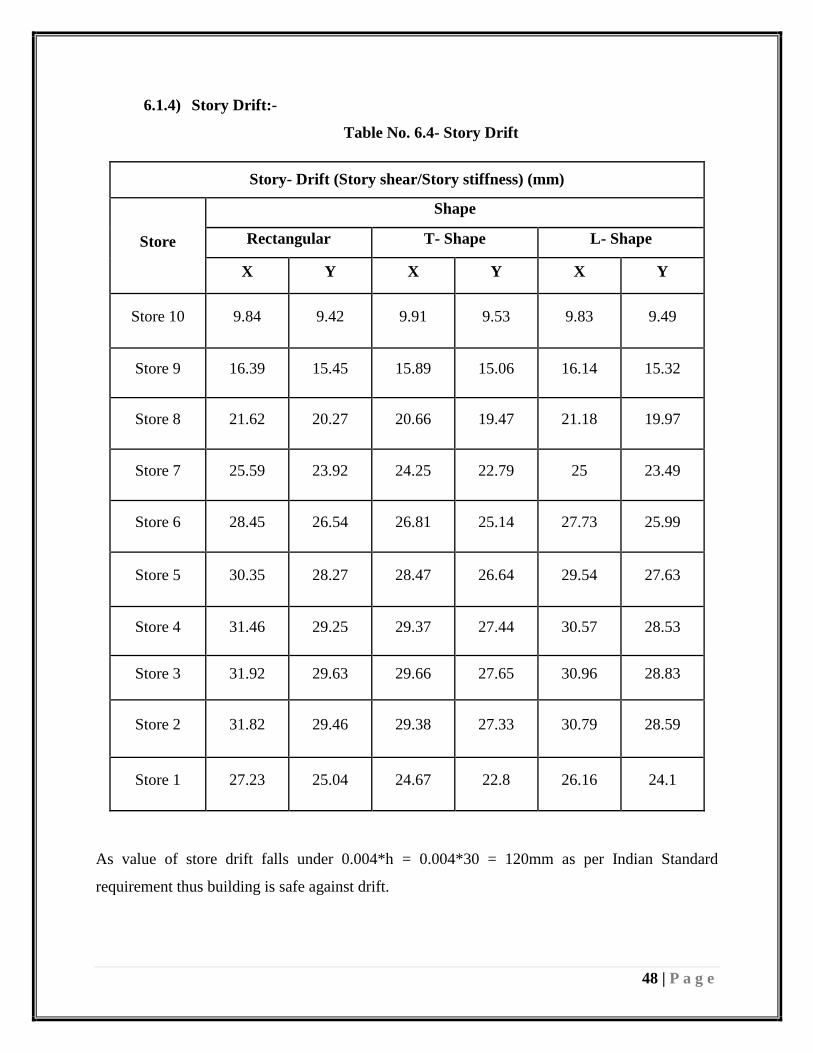
6.1.4) Story Drift:-
Table No. 6.4- Story Drift
Story- Drift (Story shear/Story stiffness) (mm)
Store
Shape
Rectangular T- Shape L- Shape
X Y X Y X Y
Store 10 9.84 9.42 9.91 9.53 9.83 9.49
Store 9 16.39 15.45 15.89 15.06 16.14 15.32
Store 8 21.62 20.27 20.66 19.47 21.18 19.97
Store 7 25.59 23.92 24.25 22.79 25 23.49
Store 6 28.45 26.54 26.81 25.14 27.73 25.99
Store 5 30.35 28.27 28.47 26.64 29.54 27.63
Store 4 31.46 29.25 29.37 27.44 30.57 28.53
Store 3 31.92 29.63 29.66 27.65 30.96 28.83
Store 2 31.82 29.46 29.38 27.33 30.79 28.59
Store 1 27.23 25.04 24.67 22.8 26.16 24.1
As value of store drift falls under 0.004*h = 0.004*30 = 120mm as per Indian Standard
requirement thus building is safe against drift.

49 | P a g e
6.1.5) Story Displacement:-
Table No. 6.5- Story Displacement
Story- Displacement (mm)
Store
Shape
Rectangular T- Shape L- Shape
X Y X Y X Y
Store 10 254.67 237.25 239.07 223.85 247.9 231.94
Store 9 244.83 227.83 229.16 214.32 238.07 222.45
Store 8 228.44 212.38 213.27 199.26 221.93 207.13
Store 7 206.82 192.11 192.61 179.79 200.75 187.16
Store 6 181.23 168.19 168.36 157 175.75 163.67
Store 5 152.78 141.65 141.55 131.86 148.02 137.68
Store 4 122.43 113.38 113.08 105.22 118.48 110.05
Store 3 90.97 84.13 83.71 77.78 87.91 81.52
Store 2 59.05 54.5 54.05 50.13 56.95 52.69
Store 1 27.23 25.04 24.67 22.8 26.16 24.1

50 | P a g e
6.2) Evaluation of Analysis Result’s
6.2.1) Design Eccentricity:-
Eccentricity due to asymmetrical shape of building is calculated as per IS 1893 (Part-1):
2002, Cl. 7.9.1
Table No. 6.6- Design Eccentricity
Eccentricity
Shape (m)
Rectangular T- Shape L- Shape
X Y X Y X Y
Static Eccentricity (esi) 0 0 0 0.1251 0.0879 0.0903
1) Design Eccentricity (edi) 1 1.2 1 1.38765 0.86815 1.33545
2) Design Eccentricity (edi) -1 -1.2 -1 -1.0749 -0.9121 -1.1097
Whichever of both design eccentricity gives more severe effect in shear of frame.
6.2.2) Torsion movement:-
Due to asymmetrical plan of building torsional movement or rotation in plan is generated.
Torsional movement is calculated by multiplying base shear to design eccentricity.
Table No. 6.7- Torsional Movement
Directions Shape (Kn*m)
Rect. T-Shape L- Shape
X 6989.70 4446.39 - 5215.43
Y 7656.83 5632.45 6970.84

51 | P a g e
CHAPTER- 7
Discussions and Conclusion’s
On the base of analysis results a discussion is be done on the behaviour of building and seismic
forces acting on building. On the base of this discussion conclusions are provides.
7.1) Discussion
1) Eccentricity in building
Eccentricity in building may be generated due to many reasons like in proper distribution of
mass, direction of rectangular columns, shape of building etc. this eccentricity is known as
static eccentricity.
Design eccentricity calculated as per codal provision provides multiplication (1.5) and
addition (0.05*bi) factor for dynamic amplification and accidental eccentricity for safety of
a structure.
Due to this multiplication and addition factor a symmetrical building with equal mass
distribution may also show some eccentricity. Which helps in providing higher safety and
overcome accidental eccentricity due to change in purpose of building, soft story effect etc.
Eccentricity is mainly effected by shape of building. Irregular shaped building has his higher
eccentricity.
From the graph (Fig. No. 7.1) it is clear that eccentricity is high in T- Shaped building than
in Rectangular or L- Shaped building.

52 | P a g e
Fig No. 7.1- Eccentricity due to different shapes (Graph)
2) Relation of Torsional movement-Mass of building
During the study it is clearly seen that the torsional movement depends on the mass of the
structure.
As the base shear is directly related to mass of building, thus higher the mass higher is base
shear and higher the torsional movement.
The torsional movement in rectangular building is high due to mass.
By the graph it is clear that mass plays important role in torsional movement of building
with eccentricity.
1.1
1.15
1.2
1.25
1.3
1.35
1.4
1.45
Rectangular L- Shape T- Shape
Eccentricity due to shapes

53 | P a g e
Fig No. 7.2- Mass v/s Torsional Movement Graph
T- Shape
L- Shape
Rectangular
5000.00
5500.00
6000.00
6500.00
7000.00
7500.00
8000.00
70000.00 80000.00 90000.00 100000.00 110000.00 120000.00 130000.00
Tors
ion
al M
ove
men
t (K
n m
)
Mass (Kn)
Mass vs Torsional movement

54 | P a g e
7.2) Conclusion’s
1) Base shear in building depends on the mass of building.
2) Irregularity in plan results in eccentricity of Center of mass and center of stiffness.
3) Behavior of all three shaped building are different in both direction due to difference in
size of building in both direction.
4) T- Shaped building in plan has high eccentricity compared to Rectangular and L-shaped
building.
5) It is observed that 3 floor of all the three shaped building shows the higher drift value than
any other floor in both the direction.
6) It is observed that displacement of building is higher when direction of earthquake is
perpendicular to longer face of building. In this case displacement is high in x-direction.
7) It is observed that torsion movement generated due to eccentricity is directly related to
mass. As mass of building increases torsional movement increases.
8) Base shear is high in Rectangular building.
9) Due to high base shear, torsional movement in rectangular building is also high.
10) Torsional movement is comparatively more when direction of earthquake is perpendicular
to the shorter face of building. In This case torsional movement is high in Y-direction.
11) Clear relation between mass & torsion and Eccentricity & Shape is obtained.

55 | P a g e
REFERENCES
1. MOHAMMED YOUSUF, P.M. SHIMPALE; Dynamic Analysis of Reinforced Concrete
Building with Plan Irregularities. International Journal of Emerging Technology and Advanced
Engineering, ISSN 2250-2459, Volume 3, Issue 9, September 2013.
2. RUCHA S. BANGINWAR, M. R. VYAWAHARE, P. O. MODANI; Effect of Plans
Configurations on the Seismic Behavior of the Structure by Response Spectrum Method.
International Journal of Engineering Research and Applications, ISSN: 2248-9622, Vol. 2,
Issue 3, May-Jun 2012, pp.1439-1443.
3. DEEPAK SUTHAR, H.S.CHORE, P.A. DODE; High rise structure subjected to seismic forces
and its behavior. 12th IRF International Conference, ISBN: 978-93-84209-31 -5.
4. Mr. Sandesh N. Suryawanshi, Prof. S. B. Kadam, Dr. S. N. Tande; Torsional Behavior of
Asymmetrical Buildings in Plan under Seismic Forces. International Journal of Emerging
Engineering Research and Technology, Volume 2, Issue 4, July 2014, PP 170-176, ISSN 2349-
4395 (Print) & ISSN 2349-4409 (Online).
5. Prof. Wakchaure M. R, Nagare Y U; Effect of Torsion Consideration in Analysis of Multi
Storey frame. International Journal of Engineering Research and Applications (IJERA), ISSN:
2248-9622, Vol. 3, Issue 4, Jul-Aug 2013, pp.1828-1832.
6. C. Justine Jose, T. P. Somasundaran, V. Mustafa; prediction of seismic torsional effects in tall
symmetric buildings. IJRRAS 5 (2), November 2010.
7. Neha P. Modakwar, Sangita S. Meshram, Dinesh W. Gawatre; Seismic Analysis of Structures
with Irregularities. IOSR Journal of Mechanical and Civil Engineering (IOSR-JMCE), e-ISSN:
2278-1684, p-ISSN: 2320-334X, PP 63-66.
8. Dr. S.K. Dubey, P.D. Sangamnerkar; Seismic behavior of asymmetric RC buildings.
International Journal of Advanced Engineering Technology, E-ISSN 0976-3945.
9. Shantanu S. Magdum, Dr.P.S.Patil; Study of seismic behaviour of vertical asymmetric multi-
storied building. International Journal of Advanced Technology in Engineering and Science,
Volume No.02, Issue No. 06, June 2014, ISSN (online): 2348 – 7550.
10. Sachin G. Maske, Dr. P. S. Pajgade; Torsional Behaviour of Asymmetrical Buildings.
International Journal of Modern Engineering Research (IJMER), Vol.3, Issue.2, March-April.
2013, pp-1146-1149 ISSN: 2249-6645.
11. P. P. Chandurkar, Dr. P. S. Pajgade; Seismic Analysis of RCC Building with and Without
Shear Wall. International Journal of Modern Engineering Research (IJMER), Vol. 3, Issue. 3,
May - June 2013, pp-1805-1810, ISSN: 2249-6645.
12. M. L. Saldivar, L.M. Garino Libardi, G. Navarta Navarro; Seismic Performance of Existing
Residential Buildings. 15 WCEE, LISBOA 2012.
13. Earthquake tips- IITK
14. IS 1893 (Part-1):2002
15. http://www.indiaonlinepages.com/population/gujarat-population.html
16. www.csiamerica.com/products/etabs
17. Book : Earthquake Engineering by R.P.Rethaliya


![Seismic Analysis of a High-rise RC Framed Structure with ... · 1. M Anvesh, Shaikh and Pavan Kumar [1], Effect of Mass Irregularity on Reinforced Concrete Structure Using Etabs,](https://img.dokumen.tips/doc/110x75/5f0baec67e708231d431b41a/seismic-analysis-of-a-high-rise-rc-framed-structure-with-1-m-anvesh-shaikh.jpg)