Embed Size (px)
Citation preview

http://www.iaeme.com/IJMET/index.asp 897 [email protected]
International Journal of Mechanical Engineering and Technology (IJMET) Volume 8, Issue 7, July 2017, pp. 897–908, Article ID: IJMET_08_07_098
Available online at http://www.iaeme.com/IJMET/issues.asp?JType=IJMET&VType=8&IType=7
ISSN Print: 0976-6340 and ISSN Online: 0976-6359
© IAEME Publication Scopus Indexed
ANALYSIS OF STRESS DISTRIBUTION ON
DIFFERENT SECTIONS UNDER DIFFERENT
LOADING AND MACHINING CONDITIONS
K L N Sandeepa Sarma, B. Venkateshwarlu, Jacob Thottathil Varghese
School of Mechanical Engineering,
Vellore Institute of Technology, Vellore, India
ABSTRACT
The magnitude of stress is directly proportional to strain up to yield point
particularly in thick walled components. The distortion of components is strongly
related to the residual stresses induced by manufacturing processes like forming and
machining. While removing material during machining, new stress state of equilibrium
is established in the component. The product quality and efficiency during
manufacturing can be increased by thorough understanding of stress distribution under
different loading and machining conditions. In this work, welded T, I, and L profile
sections made of pure aluminium used as test specimens. Grooves were machined to the
profiles later and again subjected to various loading conditions and results were
obtained. Different loads of 30, 35, and 40 kN were applied on purely welded
components and machined and welded components. The corresponding pressure
distribution results were compared. It was observed that effect of machining is different
for different sections. Purely welded T and I sections are weaker compared to their
machined and welded counterparts whereas purely welded L-sections are stronger
compared to their machined and welded counterparts.
Key words: Distortion, Finite element method (FEM), Machining, Residual stresses.
Cite this Article: K L N Sandeepa Sarma, B. Venkateshwarlu and Jacob Thottathil
Varghese, Analysis of Stress Distribution on Different Sections Under Different
Loading and Machining Conditions, International Journal of Mechanical Engineering
and Technology, 8(7), 2017, pp. 897–908, 8(7),
http://www.iaeme.com/IJMET/issues.asp?JType=IJMET&VType=8&IType=7
1. INTRODUCTION
I, L, and T sections are frequently used in various structural units such as bridges, railway
tracks, etc., and also to support various complex geometric structures. This implies that these
sections are subjected to very high pressures and moments. The distortion of components is
strongly related to residual stress state induced by manufacturing process like forming and
machining. It is clear that there is a significant influence of mechanical operations done a
component on the residual stress distribution which acts as a carrier of distortion potential [1].

K L N Sandeepa Sarma, B. Venkateshwarlu and Jacob Thottathil Varghese
http://www.iaeme.com/IJMET/index.asp 898 [email protected]
It is concluded in one of the previous works that heterogeneous residual stresses increase
amount of distortion [2]. The correlation exists between residual stresses and amount of
distortion in an increasing fashion as observed for a grinding process [3]. While removing
material during machining, new stress equilibrium is established for the component [4]. The
stress is directly proportional to the strain up to yield point. Beyond yield point, particularly in
thick walled cylinders, there exists a phase in which material is partially elastic and partially
plastic. Perfect plasticity is a property of materials to undergo an irreversible plastic
deformation without any increase in stresses when loads are applied. Plastic materials with
hardening necessitate increasingly higher stresses to result in further plastic deformation. The
two phases will meet at a junction point and state exists till whole material becomes plastic with
an increase in pressure. This intermediate phase is called an elastic-plastic phase. In cylindrical
components subjected to high internal pressures, the plastic state is represented by power law
which is expressed as � = �� ∈n, where �� is strain hardening modulus, n is index (from 0 to
1). According to Brinksmeier et al. 2009 [5], the distortion potential is related to residual
stresses induced in the components during manufacturing process.
2. EXPERIMENTAL PROCEDURE
The work pieces have been designed, welded and machined using CATIA V5R17 software. Six
work pieces are used in this work and named as 1.Welded L-section, 2. Machined and welded
L-section, 3.Welded T-section and 4.Machined and welded T-section 5. Welded I-section 6.
Machined and welded I-section (see Figures 1- 6).
Figure 1 Geometry of purely welded L-section
Figure 2 Geometry of machined and welded L-section
Figure 3 Geometry of purely welded T-section
Figure 4 Geometry of machined and welded T-section
Analysis of Stress Distribution on Different Sections Under Different Loading and Machining
Conditions
http://www.iaeme.com/IJMET/index.asp 899 [email protected]
Figure 5 Geometry of machined and welded I-section
Figure 6 Geometry of purely welded I- section
The specimens are manufactured from aluminium blocks of 120 x 60 x 20 mm size. For
purely welded components, the blocks are maintained in their respective planes and welded
correspondingly. For machined and welded components, a groove of 20 X 60 x 10 mm size is
made at centre of the base block using lathe machine and then the other block is fitted into the
groove and welded. Each work piece is subjected to a load of 30, 35, and 40 kN and the
corresponding pressure induced on work piece surface is computed using the simple relation
P=F/A, where F= Force applied on work piece surface (kN), A= Surface area of the work piece
subjected to loading (mm2). Profiles are meshed and finite element method (FEM) techniques
are applied. The reports are generated using above mentioned software. Results obtained for
purely welded and machined and welded components are compared and analyzed.
3. MODELLING WITH CATIA
For the work piece, the material behaviour of tempered aluminium is modelled using
viscoelastic-plastic behaviour. Yield stress is calculated using below mentioned analytical
function [6]
(1)
The yield stress depends on the equivalent plastic strain Ɛpl and also the temperature for
including thermal softening effects. A, B, m and n are material parameters. The non-
dimensional temperature Ɵ is calculated with the current temperature. The strain rate
dependence is expressed by the middle term, where C is the dimensionless strain-rate hardening
coefficient and Ɛ0 is the normalizing reference strain rate. The material parameters used in this
work for modelling are shown in below Table 1 [7-9]. For designing and machining, CATIA
V5R17 software is used. Using this software various machining operations such as milling,
welding, all lathe operations, etc., can be done with high degree of accuracy. Specimens are
clamped rigidly and the load is applied on appropriate surfaces. After meshing is done, stress
and strain distributions are evaluated and the corresponding plots are generated.

K L N Sandeepa Sarma, B. Venkateshwarlu and Jacob Thottathil Varghese
http://www.iaeme.com/IJMET/index.asp 900 [email protected]
Table 1 Material parameters used for modelling
A [MPa] 546 Tm [K] 922
B [MPa] 678 Ttr [K] 293
C 0.024 Ρ [g/cm3] 2.7
M 1,56 cv [J/kg-K] 896
n 0.71 G [GPa] 26.5
Ɛ0[1/s] 1 E [GPa] 79.4
In this work, finite element method and von misses criterion is applied to the work pieces.
The main criterion chosen for failure is maximum strain energy criterion or von misses failure
criteria, which says that the material will fail when the equivalent stress exceeds the yield point
of the material. For an axis-symmetric problem, there are no shear stresses induced and hence
hoop, longitudinal and radial stresses are the principal stresses. The governing equation
considered for failure for this situation is:
(2)
Where, σƟ is hoop stress, σr is radial stress, σz is stress along z-axis and σy is normal stress
[6]. Here, left hand side of the governing equation represents von Mises stress. The work piece
models used for analysis are shown below in Figure 7.
Figure 7 CATIA workpiece models of L-section
4. ANALYSIS RESULTS
Loading condition at 30 kN: The corresponding maximum pressure applied on surface is
4166666.6667 N/m2 (see Figures 8-13)
Figure 8 Purely welded L-section.

Analysis of Stress Distribution on Different Sections Under Different Loading and Machining
Conditions
http://www.iaeme.com/IJMET/index.asp 901 [email protected]
Figure 9 Machined and welded L-section.
Figure 10 Purely welded T-section
Figure 11 Machined and welded T-section.
Figure 12 Purely welded I-section
K L N Sandeepa Sarma, B. Venkateshwarlu and Jacob Thottathil Varghese
http://www.iaeme.com/IJMET/index.asp 902 [email protected]
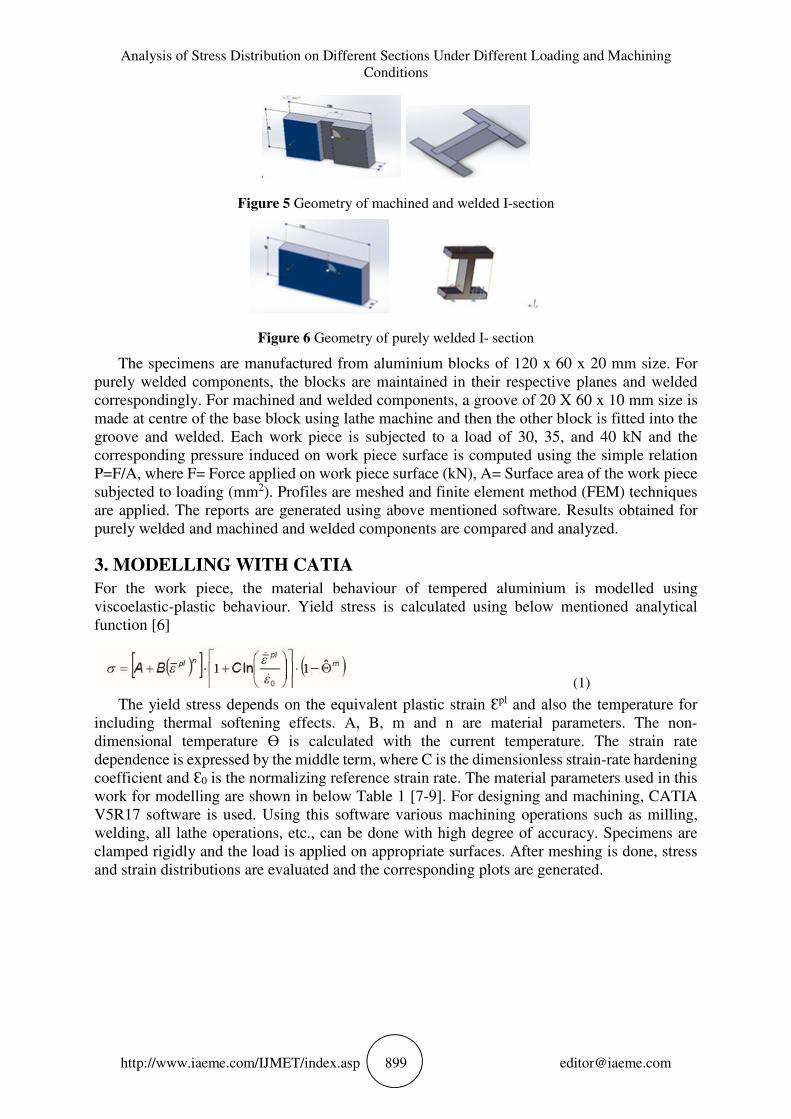
Figure 13 Machined and welded I-section
4.2. Loading condition at 35 kN: The corresponding maximum pressure applied on surface is
4861111.1111 N/m2 (see Figures 14-19)
Figure 14 Purely welded L-section
Figure 15 Machined and welded L-section
Figure 16 Purely welded T-section
Analysis of Stress Distribution on Different Sections Under Different Loading and Machining
Conditions
http://www.iaeme.com/IJMET/index.asp 903 [email protected]
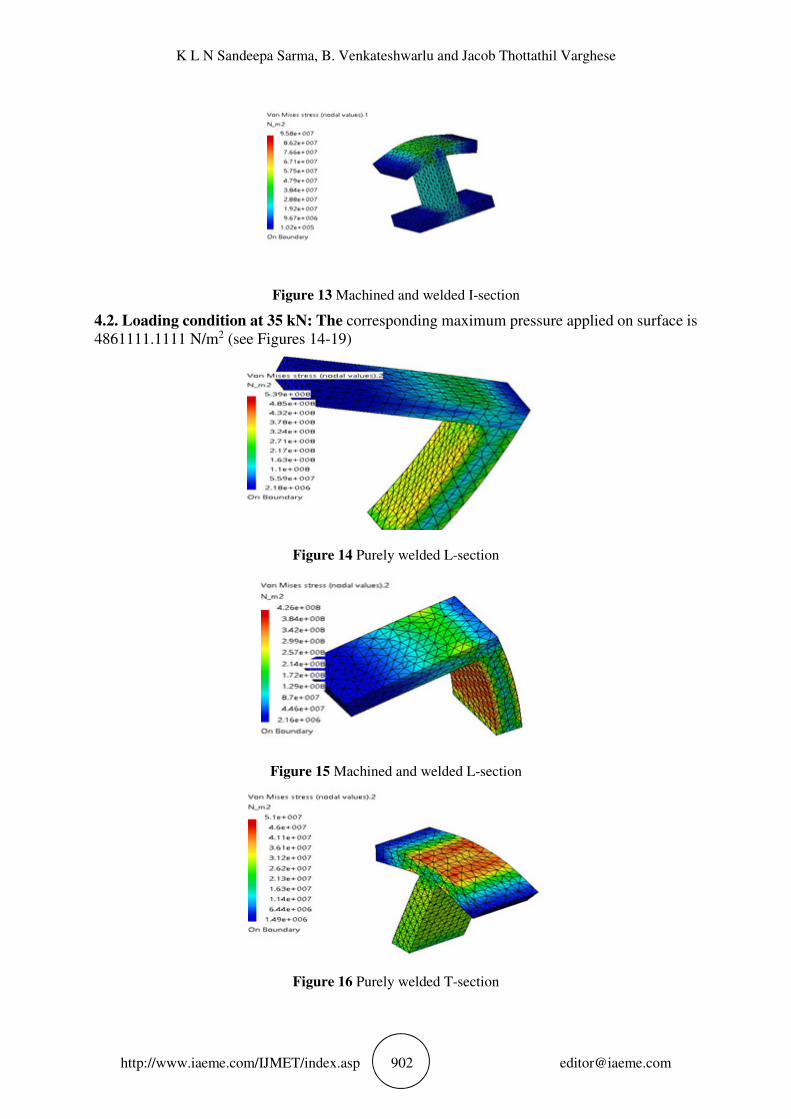
Figure 17 Machined and welded T-section
Figure 18 Purely welded I-section
Figure 19 Machined and welded I-section.
4.3. Loading condition at 40 kN: The corresponding maximum pressure applied on surface is
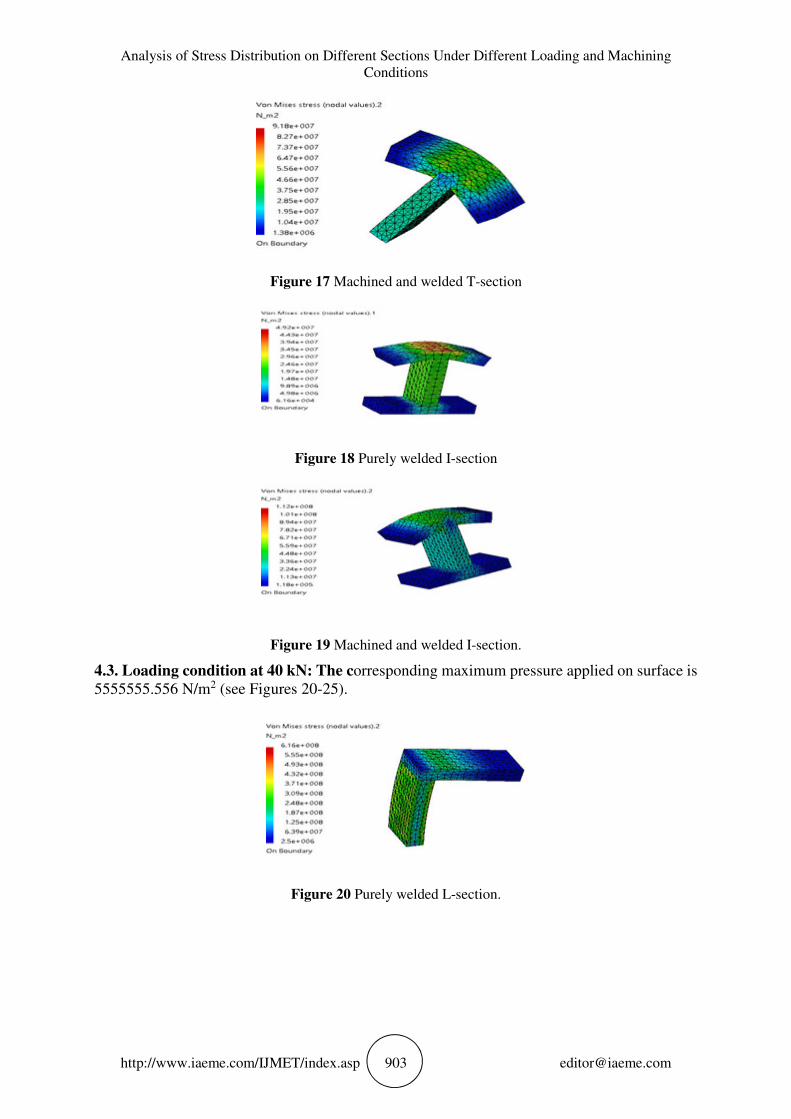
5555555.556 N/m2 (see Figures 20-25).
Figure 20 Purely welded L-section.
K L N Sandeepa Sarma, B. Venkateshwarlu and Jacob Thottathil Varghese
http://www.iaeme.com/IJMET/index.asp 904 [email protected]
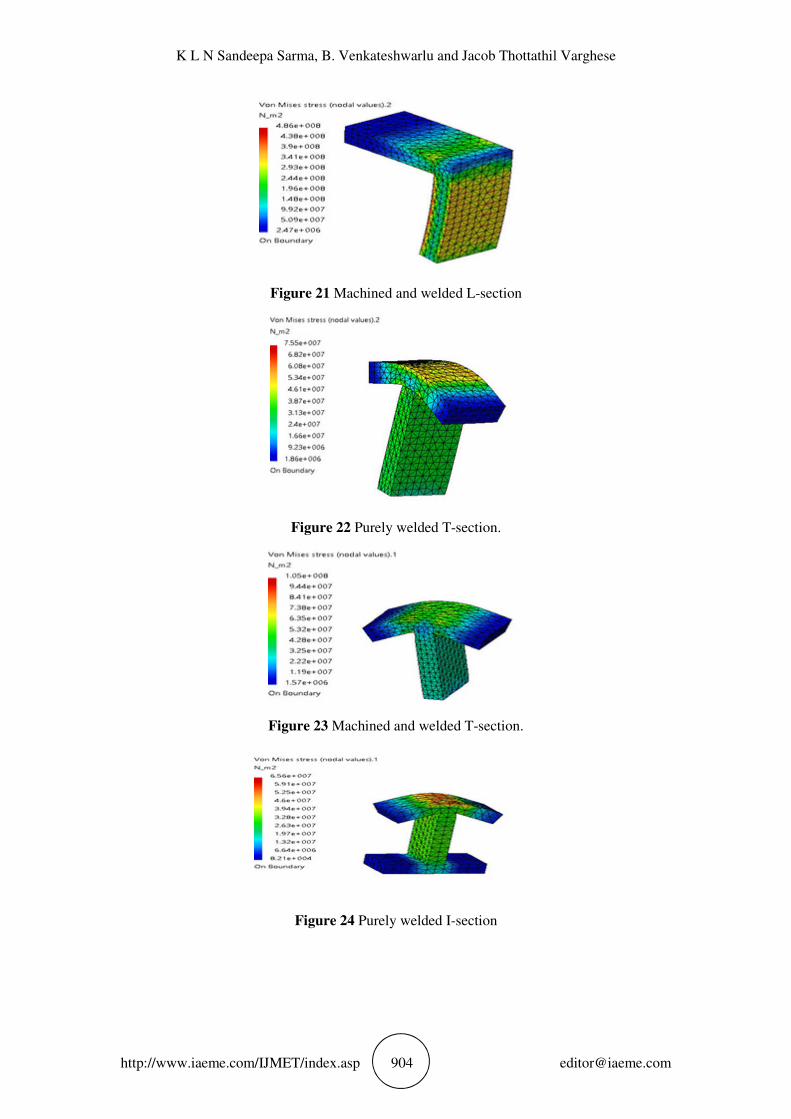
Figure 21 Machined and welded L-section
Figure 22 Purely welded T-section.
Figure 23 Machined and welded T-section.
Figure 24 Purely welded I-section

Analysis of Stress Distribution on Different Sections Under Different Loading and Machining
Conditions
http://www.iaeme.com/IJMET/index.asp 905 [email protected]
Figure 25 Machined and welded I-section.
5. RESULTS AND DISCUSSION
The figures 8-25 show the analysis results obtained for L, T and I sections subjected to various
loading conditions before and after suitable machining. The figures show mesh plots with
different colours where red colour indicates maximum stress level (i.e. failure stress), blue
colour indicates minimum stress and green colour indicates permissible stress levels.
Figure 26 Load Vs Failure stress for L-section
L- section: The above graph (see Figure 26) indicates the variation of failure stress level for L-
section. Series 1 is for purely welded L section and series 2 is for machined and welded L
section. From the above figure, it can be seen clearly that purely welded L-section can bear
more stress before its failure compared to the corresponding welded and machined section. This
may be attributed to weakening of machined section because of residual stresses induced during
machining. In case of L section, it can also be seen that the complete stress is borne by the
machined part and fails easily.
Table 2 Magnitude of residual forces for L-section
Force (kN) For purely welded section For welded and machined
section
30 1.809*10^-4 4.896*10^-4
35 2.004*10^-4 8.232*10^-4
40 2.836*10^-4 9.427*10^-4
K L N Sandeepa Sarma, B. Venkateshwarlu and Jacob Thottathil Varghese
http://www.iaeme.com/IJMET/index.asp 906 [email protected]
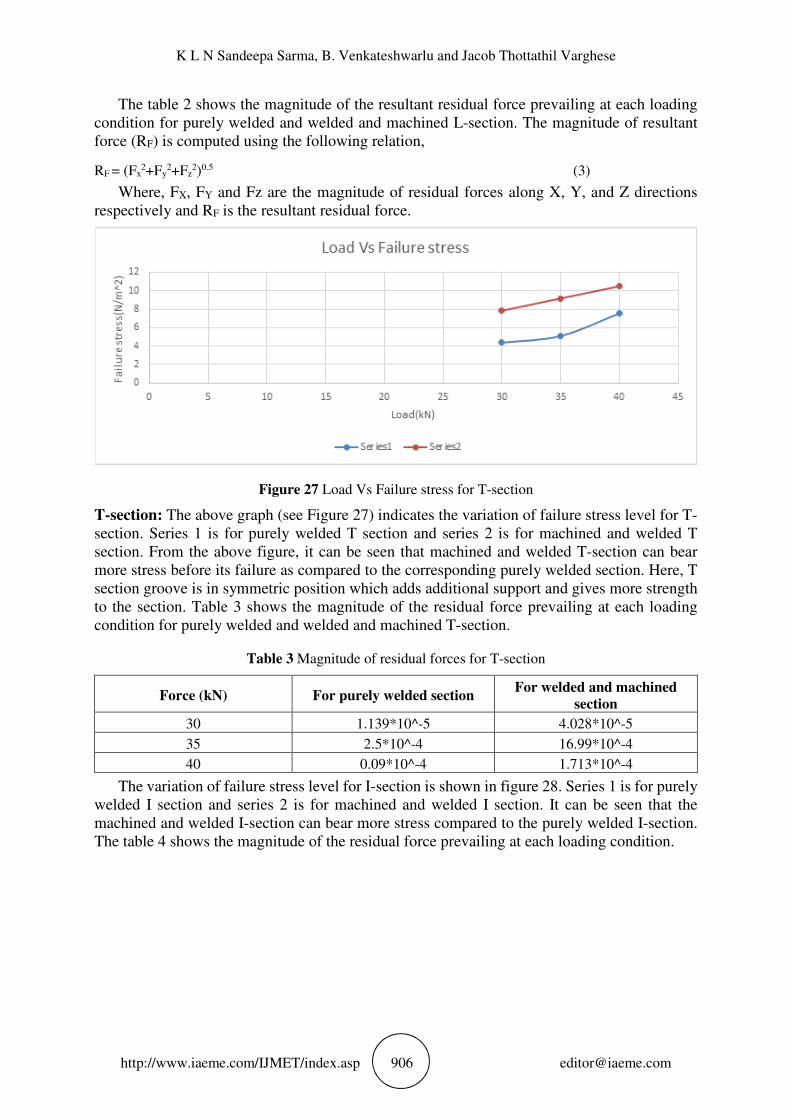
The table 2 shows the magnitude of the resultant residual force prevailing at each loading
condition for purely welded and welded and machined L-section. The magnitude of resultant
force (RF) is computed using the following relation,
RF = (Fx2+Fy
2+Fz2)0.5 (3)
Where, FX, FY and Fz are the magnitude of residual forces along X, Y, and Z directions
respectively and RF is the resultant residual force.
Figure 27 Load Vs Failure stress for T-section
T-section: The above graph (see Figure 27) indicates the variation of failure stress level for T-
section. Series 1 is for purely welded T section and series 2 is for machined and welded T
section. From the above figure, it can be seen that machined and welded T-section can bear
more stress before its failure as compared to the corresponding purely welded section. Here, T
section groove is in symmetric position which adds additional support and gives more strength
to the section. Table 3 shows the magnitude of the residual force prevailing at each loading
condition for purely welded and welded and machined T-section.
Table 3 Magnitude of residual forces for T-section
Force (kN) For purely welded section For welded and machined
section
30 1.139*10^-5 4.028*10^-5
35 2.5*10^-4 16.99*10^-4
40 0.09*10^-4 1.713*10^-4
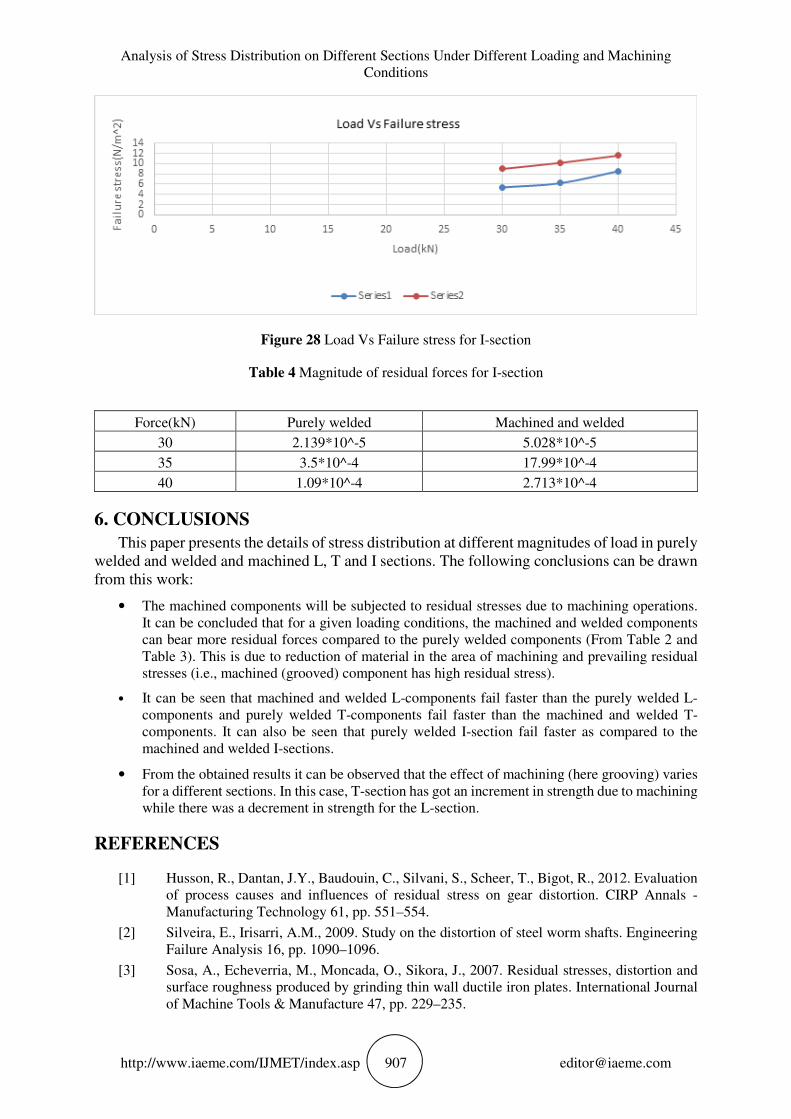
The variation of failure stress level for I-section is shown in figure 28. Series 1 is for purely
welded I section and series 2 is for machined and welded I section. It can be seen that the
machined and welded I-section can bear more stress compared to the purely welded I-section.
The table 4 shows the magnitude of the residual force prevailing at each loading condition.
Analysis of Stress Distribution on Different Sections Under Different Loading and Machining
Conditions
http://www.iaeme.com/IJMET/index.asp 907 [email protected]
Figure 28 Load Vs Failure stress for I-section
Table 4 Magnitude of residual forces for I-section
6. CONCLUSIONS
This paper presents the details of stress distribution at different magnitudes of load in purely
welded and welded and machined L, T and I sections. The following conclusions can be drawn
from this work:
• The machined components will be subjected to residual stresses due to machining operations.
It can be concluded that for a given loading conditions, the machined and welded components
can bear more residual forces compared to the purely welded components (From Table 2 and
Table 3). This is due to reduction of material in the area of machining and prevailing residual
stresses (i.e., machined (grooved) component has high residual stress).
• It can be seen that machined and welded L-components fail faster than the purely welded L-
components and purely welded T-components fail faster than the machined and welded T-
components. It can also be seen that purely welded I-section fail faster as compared to the
machined and welded I-sections.
• From the obtained results it can be observed that the effect of machining (here grooving) varies
for a different sections. In this case, T-section has got an increment in strength due to machining
while there was a decrement in strength for the L-section.
REFERENCES
[1] Husson, R., Dantan, J.Y., Baudouin, C., Silvani, S., Scheer, T., Bigot, R., 2012. Evaluation
of process causes and influences of residual stress on gear distortion. CIRP Annals -
Manufacturing Technology 61, pp. 551–554.
[2] Silveira, E., Irisarri, A.M., 2009. Study on the distortion of steel worm shafts. Engineering
Failure Analysis 16, pp. 1090–1096.
[3] Sosa, A., Echeverria, M., Moncada, O., Sikora, J., 2007. Residual stresses, distortion and
surface roughness produced by grinding thin wall ductile iron plates. International Journal
of Machine Tools & Manufacture 47, pp. 229–235.
Force(kN) Purely welded Machined and welded
30 2.139*10^-5 5.028*10^-5
35 3.5*10^-4 17.99*10^-4
40 1.09*10^-4 2.713*10^-4

K L N Sandeepa Sarma, B. Venkateshwarlu and Jacob Thottathil Varghese
http://www.iaeme.com/IJMET/index.asp 908 [email protected]
[4] V. Schulzea, P. Arrazolab, F. Zangera, J. Osterrieda,* Simulation of Distortion due to
Machining of Thin-walled Components, Karlsruhe Institute of Technology (KIT), wbk
Institute of Production Science, Kaiserstaße 12, 76131 Karlsruhe, Germany.
[5] Brinksmeier, E., Sölter, J., 2009. Prediction of shape deviations in machining. CIRP Annals
– Manufacturing Technology 58, pp. 507–510.
[6] G.Raju, K. Hari Babu, N.Siva nagaraju, K.Kiran chand Design and analysis of Stress on
Thick Walled Cylinder with and with out Holes, Assistant professor Department of
mechanical engineering, Narasaraopet engineering college, Narasaraopet.,JNT University
Kakinada.
[7] Chen, Y., Ghosh, S., 2012. Micromechanical analysis of strain rate-dependent deformation
and failure in composite microstructures under dynamic loading conditions. International
Journal of Plasticity 32–33, pp. 218–247.
[8] Vaziri, R., Delfosse, D., Pageau, G., Poursartip, A., 1993. Highspeed impact response of
particulate metal matrix composite materials – An experimental and theoretical
investigation. Int. J. Impact Engng 13, 2, pp. 329-352.
[9] Pushpakumaran S and Balamurugan S. Stress Distribution Analysis of Intact and Implant
Model of Humerus. International Journal of Mechanical Engineering and Technology, 8(6),
2017, pp. 44–50.
[10] G. Prasanna Kumar, G. Durga Rama Naidu, P. Puspalatha, P. Manoj Kumar, An
Experimental Study on Non-Destructive Tests and Stress Strain Curves of M20 Grade
Concrete with Nano-Silica Using M-Sand. International Journal of Civil Engineering and
Technology, 8(3), 2017, pp. 385–390
[11] Bae, G., Xiong, Y., Kumar, S., Kang, K., Lee, C., 2008. General aspects of interface
bonding in kinetic sprayed coatings. Acta Materialia 56, pp. 4858–486.