Embed Size (px)
Citation preview
Analysis of Seepage through Earth Dams with
Internal Core
Mohamed N. Salem Prof. of Irrigation and Drainage Structures,
Water and Water Structures Engineering Dept., Zagazig University,
Zagazig, Egypt.
Hazem M. Eldeeb
Lecturer, Water and Water Structures Engineering Dept.,
Zagazig University, Zagazig, Egypt.
Salma A. Nofal Demonstrator, Higher Institute of Engineering and
Technology, Zagazig, Egypt.
Abstract— Seepage flow through earth embankments is the
primary cause that leads to failure due to eroding, scouring, and
piping. Flow of water through soil can lead to movement of the
soil grains. Continued movement causes erosion. Many factors
can affect the movement of the soil grains including hydraulic
gradient, soil plasticity, particle size, capillary tension, and
others. In this research, seepage passing through the body of
earth dam with/without internal core has been studied
experimentally and numerically. Different models have been
studied using GEOSTUDIO (2012) program in term of SEEP/W
and SLOPE/W. SEEP/W was used to compute seepage, while
SLOPE/W was used for the analysis of slope stability. Numerical
results have been verified using experimental data from seepage
and permeability model. The effect of core permeability, core
width, core base thickness, and core penetration on seepage,
pressure head, exit gradient, upstream and downstream slope
stabilities have been studied. It's concluded that by Increasing of
side slopes (H:V), a noticeable drop of seepage line is observed
with increasing of downstream slope stability, by decreasing
core permeability, increasing core thickness, base core
thickness, and core penetration, the quantity of seepage and exit
gradient decreased upstream slope stability decreased and
downstream slope stability increased.
Keywords—
Seepage; earth dam; core; finite element method;
slope stability.
I.
INTRODUCTION
Earthen dam is a structure composed of soil particle
attached to each other and compacted in layers by mechanical
means. Earth dams are usually trapezoidal in shape with a
broad base. It was designed as a non-overflow section with a
separate spillway. In this type of dams, the shear strength of
soil ensures its stability. The three main types of earth dams
are homogeneous, zoned and diaphragm earth dams [1].
Zoned dams are constructed with a central impervious
core flanked by more pervious material known as shells.
These pervious zones or shells support and protect the
impervious core;
the upstream pervious zone affords stability
against rapid drawdown; and the downstream pervious zone
acts as a drain to control seepage and lower the phreatic
surface. The maximum width of the impervious zone is
controlled by stability, seepage criteria,
and by the
availability of materials [2].
Erosion in earth structures due to water flow occurs when
the erosion resistant forces are less than the seepage forces
that tend to produce it. The resistant forces depend on the
cohesion, the interlocking effect, the weight of the soil
particles and the kind of protection they have downstream.
Since the seepage through an earth structure is not uniform,
the erosion phenomenon increases where there exists a
concentration of seepage [3, 4].
II.
REVIEW
OF
PREVIOUS
WORK
There are several means to analyze seepage problems
(analytical, experimental, and numerical), most of which used
Darcy's law and Laplace equations [5].
Awal et al., (2009) [6] studied sudden failure of landslide
dam in the experimental flume for steady discharge in the
upstream reservoir. Sachpazis (2014) [7] studied the seepage
inside the body of a homogeneous earth dam by means of
drainage and seepage tank. Djehiche et al., (2014) [8] built a
small-scale model of homogeneous earth dam with a vertical
drain on a pervious foundation to determine the best position
of a vertical drain in a homogeneous earth dam according to
the maximum head of water. Shaaban et al., (2014) [9]
studied two-dimensional unsteady state of unconfined
seepage flow problems through earth dams using (Z_SOIL)
numerical model taking required data from permeability and
seepage experimental model of sand soil. Kanchana and
Prasanna (2015) [10] analyzed the usage of different
materials of earth dam with central impervious vertical core
to study the behavior of phreatic line by varying effective
length of horizontal drainage filter. Vazquez and Alejandro
(2015) [11] built a model of zoned earth dam to identify the
failure mechanisms of embankment dams by verifying the
reliability of risk analysis after the breaching of the dam.
Luofeng and Duan (2012) [12] studied the permeability and
seepage stability of dams by the simulation of new structure
of accumulating tubular geotextile sand-bags and casting
sand-bags at the coastal reservoir storing
fresh water.
Malekpour et al., (2012) [13] studied the effect horizontal
drain size on the stability of an embankment dam in steady
International Journal of Engineering Research & Technology (IJERT)
ISSN: 2278-0181http://www.ijert.org
IJERTV8IS080168(This work is licensed under a Creative Commons Attribution 4.0 International License.)
Published by :
www.ijert.org
Vol. 8 Issue 08, August-2019
768
and transient seepage conditions. Xu et al., (2003) [14]
developed a numerical scheme to calculate the optimal
solution in an ideal earth dam cross section utilizing two
different types of soil material. Tayfur et al., (2005) [15]
developed FEM and artificial neural network (ANN) models
to predict seepage through the body of Jeziorsko earthfill
dam. Chen and Zhang (2006) [16] developed finite element
method (FEM) and partial difference equation (PDE) using
SVFLUX and FLEXPDE program respectively to simulate
the movement of the water and the distribution of pore water
pressure through Gouhou rock fill dam in two- and three-
dimensional analyses. Fu and Sheng (2009) [17] proposed a
numerical model to simulate the unsteady seepage flow
through dam using finite element method (FEM). Giglou and
Zeraatparvar (2012) [18] analyzed seepage flow numerically
with a two-dimensional finite element method through
homogeneous earth dam. Li and Liu (2010) [19] established
steady and transient models by using finite element software
SEEP/W. They concluded that the small infiltration
coefficient of the dam shell make the core bears the most
head loss due to its little permeability, which may lead to
excess hydrostatic pressure exerted on the core and adversely
affect the stability of the dam. Ismaeel and Noori (2011) [20]
analyzed Duhok zoned earth dam using finite element method
(FEM) by SEEP2D computer program to study the effect of
an isotropy of core material on seepage, and analyzed the
stability using STABIL program. Shakir (2011) [21] studied
the effect of an impervious core in reducing the quantity of
seepage through earth dam. Two cases of core were studied:
vertical core and core inclined towards upstream side. Hasani
and Karimi (2013) [22] applied finite element method (FEM)
using SEEP/W and SLOPE/W software to find out the
seepage loss through Ilam fill dam by providing horizontal
and vertical toe drains and internal core and to evaluated the
stability of this dam under the following condition of dam,
steady state, the sudden draw down, with three different
methods: Bishop, Janbu, Ordinary method of Slices, and
Morgenstem. Fakhari and Ghanbari (2013) [23] presented a
new formula for calculating the quantity of seepage passing
through embankment dams with vertical and oblique core.
Karampoor and Riazi (2015) [24] calculated the seepage rate
using SEEP/W and SPSS software of non-homogenous earth
dam with clay core. Jamel (2016) [25] presented an
approximate method of analysis involving the use of finite
element technique (FEM) using computer program SEEP/W
to study the behavior of seepage through a homogeneous
earth dam without filter on impervious base. An empirical
Equation (1) was developed to predict quantity of seepage
under different conditions and the results were compared with
artificial network (ANN), Depuit and Casagrande solution.
Q = 0.117×𝐾×𝐹𝐷×(𝑡𝑎𝑛 𝜃)0.039×(𝑡𝑎𝑛 𝛼)0.681×(
𝐻
𝐹𝐷)2.072
(𝐹𝐵𝐹𝐷
)0.194
×(𝑏
𝐹𝐷)
0.068 (1)
Khassaf and Madhloom (2017) [26] studied the effect of
use impervious core on seepage through Khassa Chai earth
dam at different conditions such as core thickness and
permeability using finite element method (FEM). Arshad and
Javed (2017) [27] used the finite element method (FEM) to
solve a two-dimensional unsteady flow through a
homogeneous earth fill dam to study seepage and slope
stability analysis using Geo-studio software (SEEP/W and
SLOPE/W respectively) under a different condition. Kachare
and Jagtap (2017) [28] analyzed seepage through Gangapur
earth dam using Geo-Studio software depending on finite
element method (FEM) to estimate seepage loss, exit
gradient, uplift pressures, phreatic surface, and the amount of
seepage to design a suitable dewatering system.
Souliyavong et al., (2012) [29] studied the effect of slope
inclination, soil properties, and hydraulic conductivity on the
stability of dam subjected to reservoir drawdown using
general limit equilibrium method. Abdulkareem et al., (2014)
[30] studied the safety of two existing zoned earthen dams in
Kurdistan region, Iraq namely Duhok and Bawashawar dams.
In the present work, numerical and experimental and
analyses have been performed to study the seepage flow
through earth embankment and how to use the internal core to
reduce it. The numerical analysis was verified using
experimental model. The effect of core permeability, total
core thickness, base core thickness and core penetration has
been studied numerically to compute the behavior of seepage,
exit gradient, pressure head using SEEP/W computer
program; to analyze the stability of earthen dam using
SLOPE/W program. SLOPE/W is formulation based on the
general limit equilibrium method to find the critical factor of
safety that resist the potential sliding.
III. METHODOLOGY
A. Experimental study
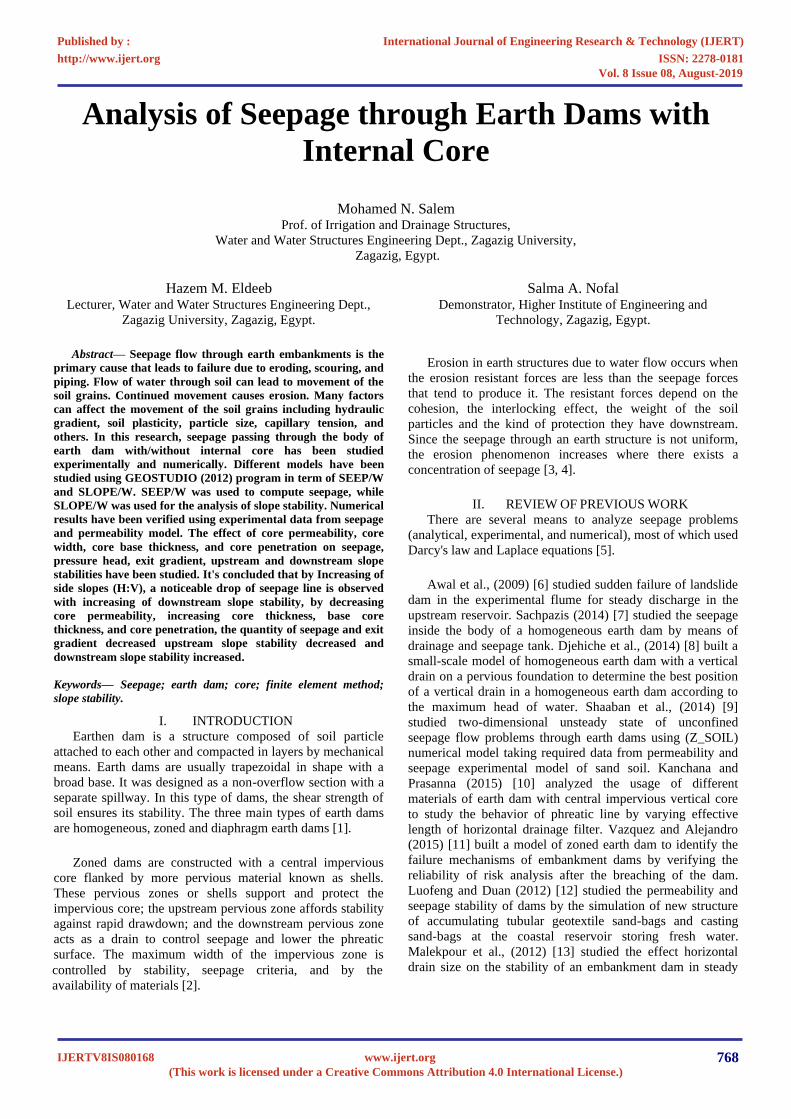
The physical model of an earth dam was constructed in a
seepage and permeability model to investigate the behavior of
seepage through the earth dam. It was equipped with 27
piezometers to measure the pore water pressure in steady
state experiments. Two permeable perforated membranes
were rigid fixed in the model before and after the soil to
prevent it from getting through, as shown in Fig. 1. Fig. 2
shows the alignment of seepage and permeability model in
the Hydraulics and Fluid Mechanics Laboratory, Faculty of
Engineering, Zagazig University, Zagazig.
Fig. 1. Schematic view of the dam boundary
International Journal of Engineering Research & Technology (IJERT)
ISSN: 2278-0181http://www.ijert.org
IJERTV8IS080168(This work is licensed under a Creative Commons Attribution 4.0 International License.)
Published by :
www.ijert.org
Vol. 8 Issue 08, August-2019
769
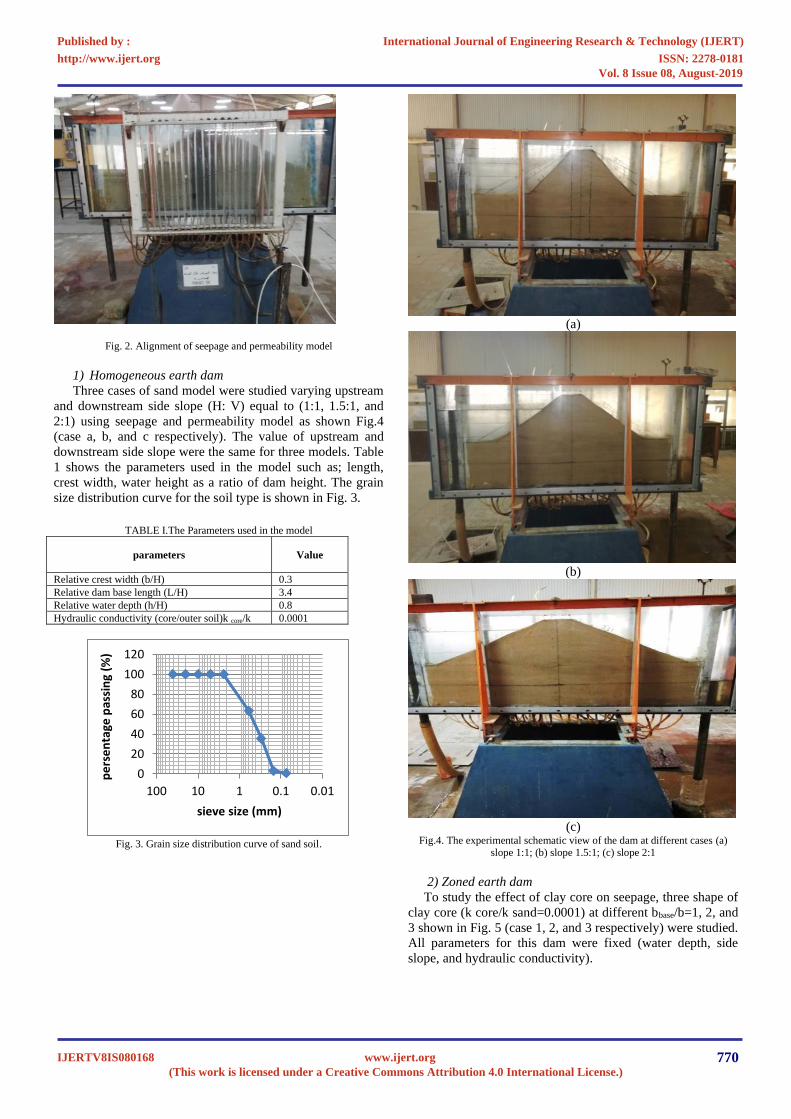
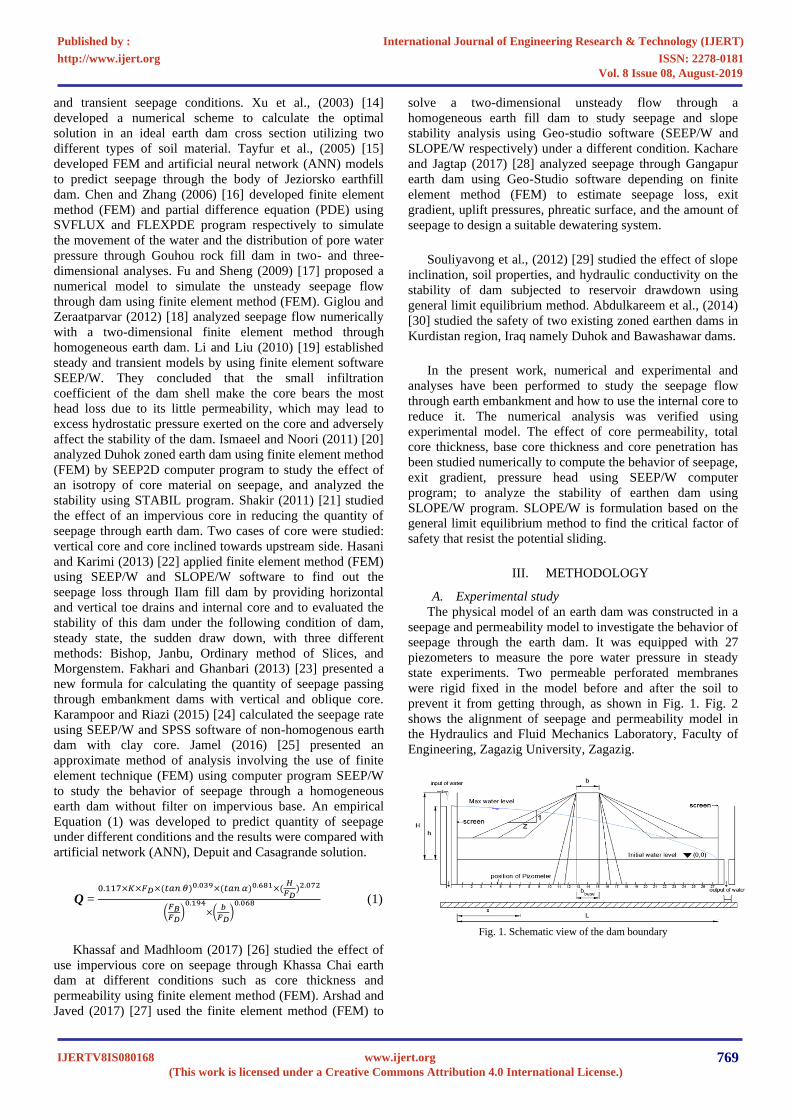
Fig. 2. Alignment of seepage and permeability model
1) Homogeneous earth dam
Three cases of sand model were studied varying upstream
and downstream side slope (H: V) equal to (1:1, 1.5:1, and
2:1) using seepage and permeability model as shown Fig.4
(case a, b, and c respectively). The value of upstream and
downstream side slope were the same for three models. Table
1 shows the parameters used in the model such as; length,
crest width, water height as a ratio of dam height. The grain
size distribution curve for the soil type is shown in Fig. 3.
TABLE I.The Parameters used in the model
parameters Value
Relative crest width (b/H) 0.3
Relative dam base length (L/H) 3.4
Relative water depth (h/H) 0.8
Hydraulic conductivity (core/outer soil)k core/k 0.0001
Fig. 3. Grain size distribution curve of sand soil.
(a)
(b)
(c)
Fig.4. The experimental schematic view of the dam at different cases (a) slope 1:1; (b) slope 1.5:1; (c) slope 2:1
2) Zoned earth dam
To study the effect of clay core on seepage, three shape of
clay core (k core/k sand=0.0001) at different bbase/b=1, 2, and
3 shown in Fig. 5 (case 1, 2, and 3 respectively) were studied.
All parameters for this dam were fixed (water depth, side
slope, and hydraulic conductivity).
0
20
40
60
80
100
120
0.010.1110100
pe
rse
nta
ge p
assi
ng
(%)
sieve size (mm)
International Journal of Engineering Research & Technology (IJERT)
ISSN: 2278-0181http://www.ijert.org
IJERTV8IS080168(This work is licensed under a Creative Commons Attribution 4.0 International License.)
Published by :
www.ijert.org
Vol. 8 Issue 08, August-2019
770
(a)
(b)
(c)
Fig. 5. The experimental schematic view of the dam at different cases (a) bbase/b=1; (b) bbase/b=2; (c) bbase/b=3
B. Computer model
Seepage analyses often performed within groups of
geotechnical engineering using finite element numerical
methods. In this research numerical computer program
SEEP/W (part of GEOSTUDIO software package) used to
analyze the fluid flow and the distribution of pore water
pressure within porous media in saturated and unsaturated
flow state. The saturated-only flow case is a confined flow
such as seepage flow beneath a structure. The saturated and
unsaturated flow is an unconfined flow problem, such as a
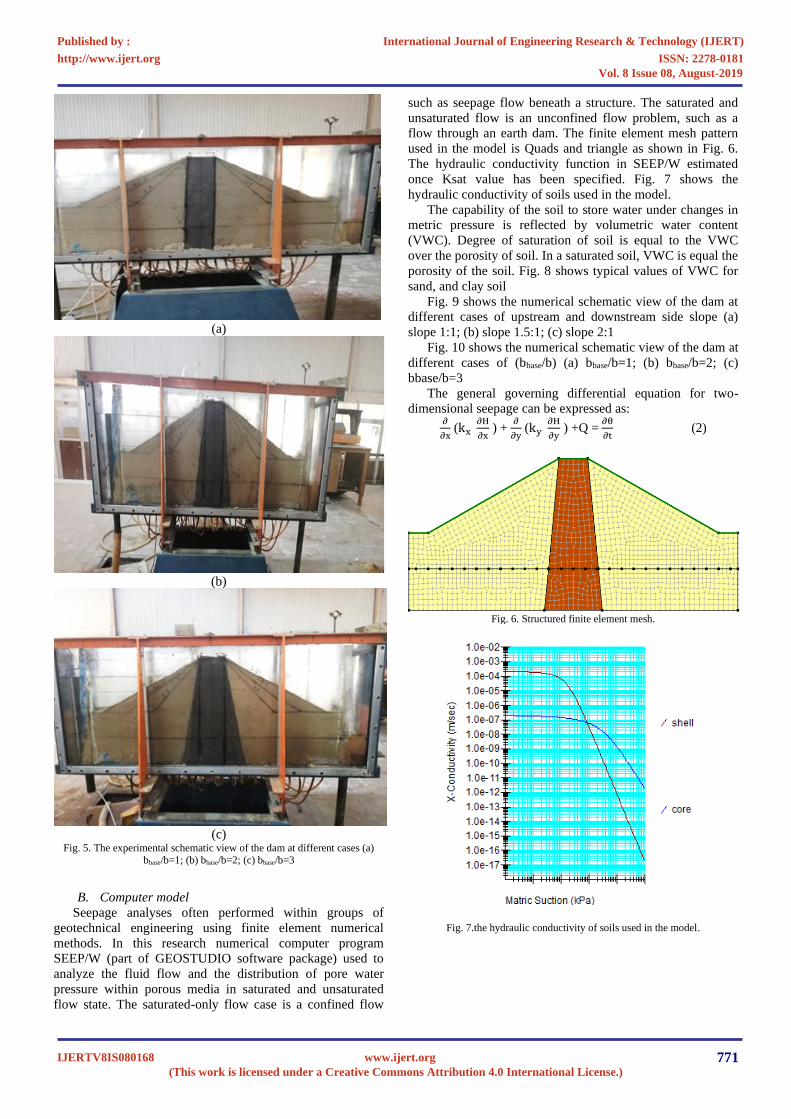
flow through an earth dam. The finite element mesh pattern
used in the model is Quads and triangle as shown in Fig. 6.
The hydraulic conductivity function in SEEP/W estimated
once Ksat value has been specified. Fig. 7 shows the
hydraulic conductivity of soils used in the model.
The capability of the soil to store water under changes in
metric pressure is reflected by volumetric water content
(VWC). Degree of saturation of soil is equal to the VWC
over the porosity of soil. In a saturated soil, VWC is equal the
porosity of the soil. Fig. 8 shows typical values of VWC for
sand, and clay soil
Fig. 9 shows the numerical schematic view of the dam at
different cases of upstream and downstream side slope (a)
slope 1:1; (b) slope 1.5:1; (c) slope 2:1
Fig. 10 shows the numerical schematic view of the dam at
different cases of (bbase/b) (a) bbase/b=1; (b) bbase/b=2; (c)
bbase/b=3
The general governing differential equation for two-
dimensional seepage can be expressed as: ∂
∂x (kx
∂H
∂x ) +
∂
∂y (ky
∂H
∂y ) +Q =
∂θ
∂t (2)
Fig. 6. Structured finite element mesh.
Fig. 7.the hydraulic conductivity of soils used in the model.
International Journal of Engineering Research & Technology (IJERT)
ISSN: 2278-0181http://www.ijert.org
IJERTV8IS080168(This work is licensed under a Creative Commons Attribution 4.0 International License.)
Published by :
www.ijert.org
Vol. 8 Issue 08, August-2019
771

Fig. 8. Typical values of VWC for sand, and clay soil.
(a)
(b)
(c)
Fig. 9. The numerical schematic view of the dam at different cases of
upstream and downstream side slope (a) slope 1:1; (b) slope 1.5:1; (c) slope 2:1.
(a)
(b)
(c)
Fig. 10. The numerical schematic view of the dam at different cases of (b
base/b) (a) bbase/b=1; (b) bbase/b=2; (c) bbase/b=3.
C. Comparison between experimental and numerical
work
The experimental model results (using seepage and
permeability model) and finite element model data using
Geostudio software in term of SEEP/W were verified. The
fundamental aspects of the finite element Modelling are the
defining of the geometry, dividing the model into appropriate
regions, defining material properties, and specification of the
appropriate boundary conditions.
Fig. 11 shows comparison of seepage surface between
numerical and experimental solution at different upstream
and downstream side slope.
Fig. 12 shows Comparison of seepage surface between
numerical and experimental solution at different bbase/b at
upstream and downstream side slope 2:1.
International Journal of Engineering Research & Technology (IJERT)
ISSN: 2278-0181http://www.ijert.org
IJERTV8IS080168(This work is licensed under a Creative Commons Attribution 4.0 International License.)
Published by :
www.ijert.org
Vol. 8 Issue 08, August-2019
772

Fig. 11. Comparison of seepage surface between numerical and experimental
solution at different upstream and downstream side slope (Z: 1) (dam without core).
Fig. 12. Comparison of seepage surface between numerical and experimental studies at different b base/b at upstream and downstream side slope 2:1(dam
with core).
IV. NUMERICAL STUDY
A. SEEP/W analysis
The fundamental aspects of finite element Modelling are
discretization, defining material properties and boundary
conditions. Creating the finite element model includes
selecting an appropriate geometry, dividing the model into
appropriate regions, and creating the discretized mesh.
Fig. 13 shows the coordinates of the main points required
to define the geometry and dimensions of the dam cross
section.
The most important soil property used in seepage analysis
is the hydraulic conductivity (including an isotropy). In soils,
the ability of water to transport saturated and unsaturated
conditions is reflected by hydraulic conductivity function. The
hydraulic conductivities of the materials used in the model are
shown in Table 2
In steady state analysis, water pressure and water flow rate
that reached a steady condition are independent of time. There
are two choices of boundary conditions: a constant pressure
(or head) or a constant flux rate. Fig. 14 shows boundary
condition of steady-state condition used in model. Fig. 15
shows Places where data are gathered.
Table II. Parameters used in the model
Parameters Value
Crest width (b) 18m
Dam length (L) 900m
Dam height (H) 60m
Water height(h) 0.8H
Us& Ds side slope (z:1) 2:1
Hydraulic conductivity (outer soil), k (m/sec) 2×10⁻⁴
Hydraulic conductivity (core), k core (m/sec) 2×10⁻⁸
Fig. 13.Earth Dam Cross Section.
Fig. 14.Steady-state Boundary conditions.
Fig. 15.Places where data are gathered.
2) Results and discussion
a) Effect of changing core permeability
To study the effect of changing relative core permeability
as a ratio of dam shell permeability kcore/k) ranging from (1 to
0.001) on the quantity of seepage, exit gradient at toe of the
dam, and pressure head at point A which is located at the
center of the core base see Fig. 15.
Fig. 16 shows that the quantity of seepage decreased by
about (3.69%) by decreasing the relative core permeability
(kcore/k) from (1 to 0.1), (2.2%) by decreasing the relative
core permeability (kcore/k) from (0.08 to 0. 01), (0.406%) by
decreasing the relative core permeability (kcore/k) from (0.008
to 0. 001) and remains constant for the other values.
Fig. 17 shows that the exit gradient decreased by about
(0.26%) by decreasing the relative core permeability (kcore/k)
from (1 to 0.1), (0.22%) by decreasing the relative core
permeability (kcore/k) from (0.08 to 0. 01), (0.2%) by
decreasing the relative core permeability (kcore/k) from (0.008
to 0. 001) and remains constant for the other values.
Fig. 18 shows that the pressure head decreased by about
(1.64%) by decreasing the relative core permeability (kcore/k)
from (1 to 0.1), (0.46) by decreasing the relative core
permeability (kcore/k) from (0.08 to 0. 1), (0.028 %) by
decreasing the relative core permeability (kcore /k) from
(0.008 to 0. 001) and remains constant for the other values.
International Journal of Engineering Research & Technology (IJERT)
ISSN: 2278-0181http://www.ijert.org
IJERTV8IS080168(This work is licensed under a Creative Commons Attribution 4.0 International License.)
Published by :
www.ijert.org
Vol. 8 Issue 08, August-2019
773

Fig. 16. Effect of different values of core permeability on the quantity of
seepage.
Fig. 17. Effect of different values of core permeability on exit gradient.
Fig. 18. Effect of different values of core permeability on pressure head at
node (A) which is located at the center of the core base.
b) Effect of total core thickness
Fig. 19 shows that the quantity of seepage decreased by
about (1%) by increasing the relative core thickness (b`/b)
from (0.1 to 0.6), and (2%) by increasing the relative core
thickness from (0.7 to 1).
c) Effect of core base thickness
Fig. 20 shows the effect of changing relative core base
thickness (bbase/b) from (1 to 5). The quantity of seepage was
decreased by about (7.7%).
d) Effect of core penetration depth
Fig. 21 shows that by increasing the relative core
penetration depth from (0 to 0.5), the quantity of seepage de-
creased by about (24.1%), and (77.4%) when the relative core
penetration depth ranging from (0.5 to 1).
Fig. 19. Effect of different values of core thickness on the quantity of
seepage at K core/k=0.001.
Fig. 20 Effect of different values of core base thickness on the quantity of
seepage at Kcore/k=0.001.
Fig. 21. Effect of different values of core penetration depth on seepage rate at
Kcore/k=0.001.
B. Slope/w analysis
SLOPE/W is one of the most common and popular
software applications which used for the stability analysis of a
slope. This is a part of Geostudio software application. This
International Journal of Engineering Research & Technology (IJERT)
ISSN: 2278-0181http://www.ijert.org
IJERTV8IS080168(This work is licensed under a Creative Commons Attribution 4.0 International License.)
Published by :
www.ijert.org
Vol. 8 Issue 08, August-2019
774
application was created based on limit equilibrium method
and includes several types of analysis like Fellenius, Bishop,
Janbu, spencer and Morgenstern -Price methods.
The GLE formulation is based on two factors of safety
equations; one equation gives the factor of safety with respect
to moment equilibrium (Fm) while the other equation gives the
factor of safety with respect to horizontal force equilibrium
(Ff) as shown in equation (3, 4) [31].
𝐹𝑓=∑(𝑐`𝛽 𝑐𝑜𝑠 𝛼+(𝑁−𝑢𝛽) 𝑐𝑜𝑠 𝛼 𝑡𝑎𝑛 ∅`)
∑ 𝑊𝑋−∑ 𝑁 𝑠𝑖𝑛 𝛼+∑ 𝑘𝑤±∑ 𝐷 𝑐𝑜𝑠 𝜔±∑ 𝐴 (3)
𝐹𝑚=∑(𝑐`𝛽𝑅+(𝑁−𝑢𝛽)𝑅 𝑡𝑎𝑛 ∅`)
∑ 𝑊𝑋−∑ 𝑁𝑓+∑ 𝐾𝑊𝑒±∑ 𝐷𝑑±∑ 𝐴𝑎 (4)
Fig. 22 shows the effect of the relative core permeability
ratio (k core/k) from (1 to 0.001) on the stability of upstream
and downstream faces of earth dam. It is found that by
decreasing core permeability, the upstream factor of safety
decreased and the downstream factor of safety increased.
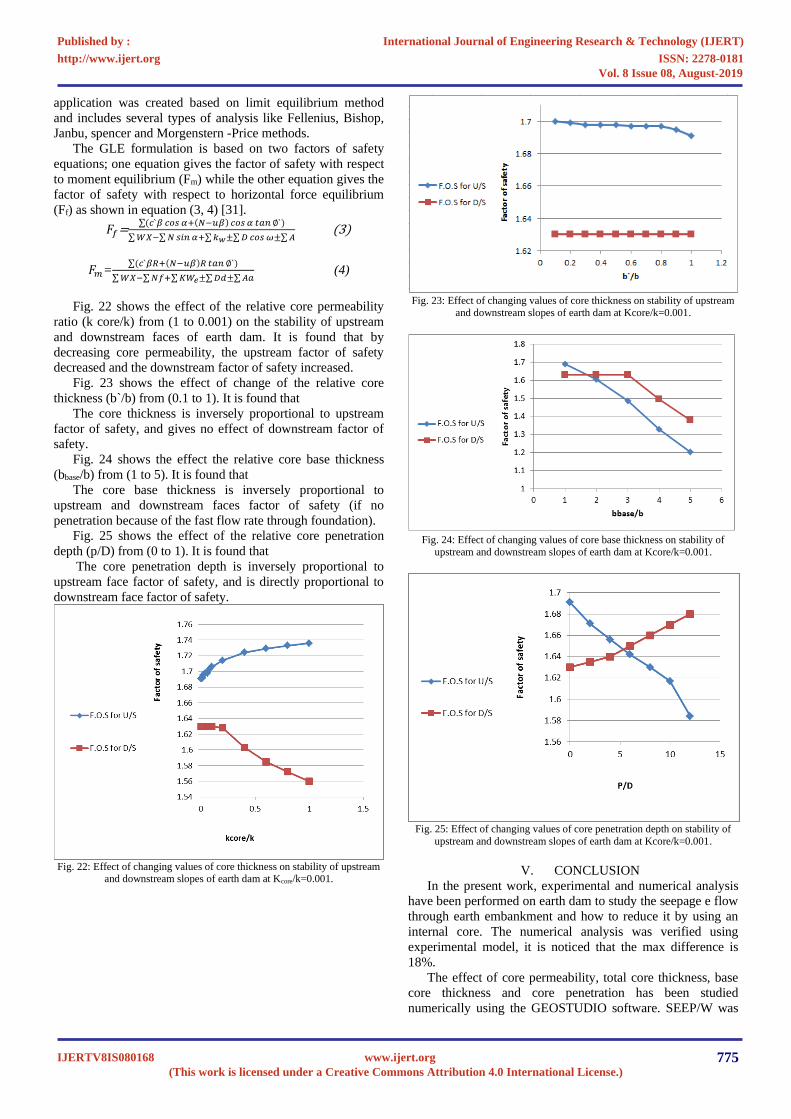
Fig. 23 shows the effect of change of the relative core
thickness (b`/b) from (0.1 to 1). It is found that
The core thickness is inversely proportional to upstream
factor of safety, and gives no effect of downstream factor of
safety.
Fig. 24 shows the effect the relative core base thickness
(bbase/b) from (1 to 5). It is found that
The core base thickness is inversely proportional to
upstream and downstream faces factor of safety (if no
penetration because of the fast flow rate through foundation).
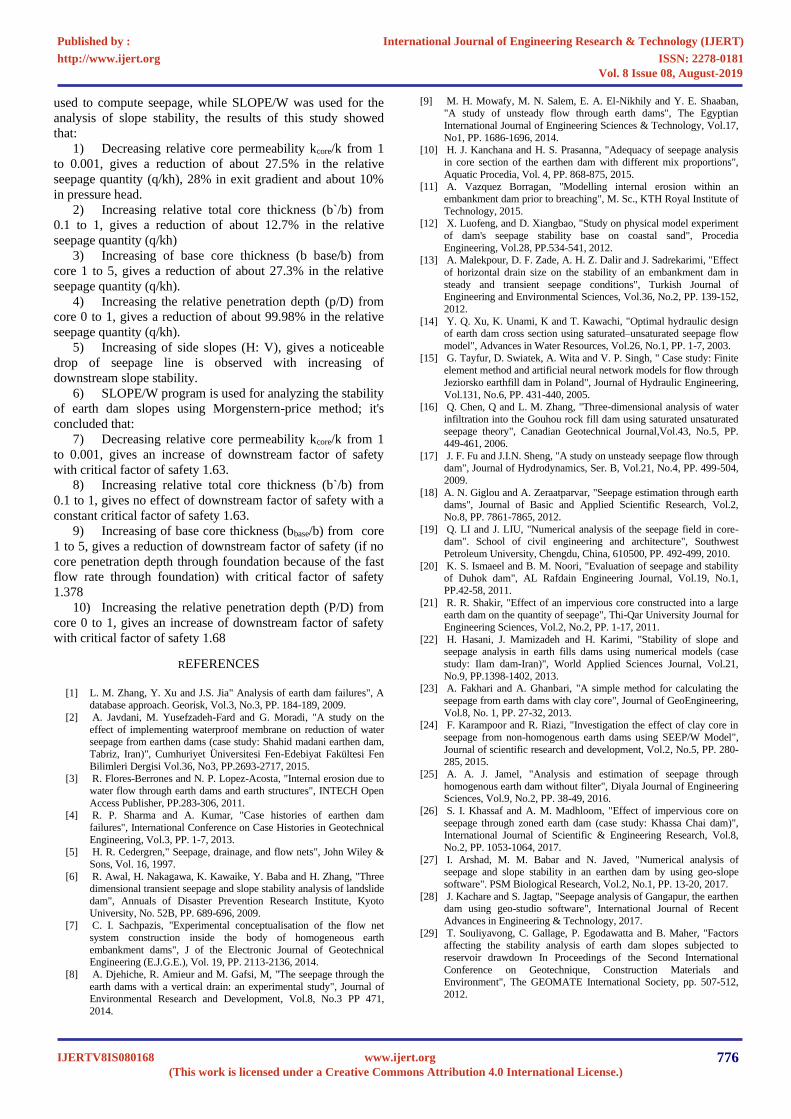
Fig. 25 shows the effect of the relative core penetration
depth (p/D) from (0 to 1). It is found that
The core penetration depth is inversely proportional to
upstream face factor of safety, and is directly proportional to
downstream face factor of safety.
Fig. 22: Effect of changing values of core thickness on stability of upstream
and downstream slopes of earth dam at Kcore/k=0.001.
Fig. 23: Effect of changing values of core thickness on stability of upstream
and downstream slopes of earth dam at Kcore/k=0.001.
Fig. 24: Effect of changing values of core base thickness on stability of
upstream and downstream slopes of earth dam at Kcore/k=0.001.
Fig. 25: Effect of changing values of core penetration depth on stability of
upstream and downstream slopes of earth dam at Kcore/k=0.001.
V. CONCLUSION
In the present work, experimental and numerical analysis
have been performed on earth dam to study the seepage e flow
through earth embankment and how to reduce it by using an
internal core. The numerical analysis was verified using
experimental model, it is noticed that the max difference is
18%.
The effect of core permeability, total core thickness, base
core thickness and core penetration has been studied
numerically using the GEOSTUDIO software. SEEP/W was
International Journal of Engineering Research & Technology (IJERT)
ISSN: 2278-0181http://www.ijert.org
IJERTV8IS080168(This work is licensed under a Creative Commons Attribution 4.0 International License.)
Published by :
www.ijert.org
Vol. 8 Issue 08, August-2019
775
used to compute seepage, while SLOPE/W was used for the
analysis of slope stability, the results of this study showed
that:
1) Decreasing relative core permeability kcore/k from 1
to 0.001, gives a reduction of about 27.5% in the relative
seepage quantity (q/kh), 28% in exit gradient and about 10%
in pressure head.
2) Increasing relative total core thickness (b`/b) from
0.1 to 1, gives a reduction of about 12.7% in the relative
seepage quantity (q/kh)
3) Increasing of base core thickness (b base/b) from
core 1 to 5, gives a reduction of about 27.3% in the relative
seepage quantity (q/kh).
4) Increasing the relative penetration depth (p/D) from
core 0 to 1, gives a reduction of about 99.98% in the relative
seepage quantity (q/kh).
5) Increasing of side slopes (H: V), gives a noticeable
drop of seepage line is observed with increasing of
downstream slope stability.
6) SLOPE/W program is used for analyzing the stability
of earth dam slopes using Morgenstern-price method; it's
concluded that:
7) Decreasing relative core permeability kcore/k from 1
to 0.001, gives an increase of downstream factor of safety
with critical factor of safety 1.63.
8) Increasing relative total core thickness (b`/b) from
0.1 to 1, gives no effect of downstream factor of safety with a
constant critical factor of safety 1.63.
9) Increasing of base core thickness (bbase/b) from core
1 to 5, gives a reduction of downstream factor of safety (if no
core penetration depth through foundation because of the fast
flow rate through foundation) with critical factor of safety
1.378
10) Increasing the relative penetration depth (P/D) from
core 0 to 1, gives an increase of downstream factor of safety
with critical factor of safety 1.68
REFERENCES
[1] L. M. Zhang, Y. Xu and J.S. Jia" Analysis of earth dam failures", A
database approach. Georisk, Vol.3, No.3, PP. 184-189, 2009.
[2] A. Javdani, M. Yusefzadeh-Fard and G. Moradi, "A study on the
effect of implementing waterproof membrane on reduction of water seepage from earthen dams (case study: Shahid madani earthen dam,
Tabriz, Iran)", Cumhuriyet Üniversitesi Fen-Edebiyat Fakültesi Fen
Bilimleri Dergisi Vol.36, No3, PP.2693-2717, 2015.
[3] R. Flores-Berrones and N. P. Lopez-Acosta, "Internal erosion due to
water flow through earth dams and earth structures", INTECH Open
Access Publisher, PP.283-306, 2011. [4] R. P. Sharma and A. Kumar, "Case histories of earthen dam
failures", International Conference on Case Histories in Geotechnical
Engineering, Vol.3, PP. 1-7, 2013. [5] H. R. Cedergren," Seepage, drainage, and flow nets", John Wiley &
Sons, Vol. 16, 1997.
[6] R. Awal, H. Nakagawa, K. Kawaike, Y. Baba and H. Zhang, "Three dimensional transient seepage and slope stability analysis of landslide
dam", Annuals of Disaster Prevention Research Institute, Kyoto
University, No. 52B, PP. 689-696, 2009. [7] C. I. Sachpazis, "Experimental conceptualisation of the flow net
system construction inside the body of homogeneous earth
embankment dams", J of the Electronic Journal of Geotechnical Engineering (E.J.G.E.), Vol. 19, PP. 2113-2136, 2014.
[8] A. Djehiche, R. Amieur and M. Gafsi, M, "The seepage through the
earth dams with a vertical drain: an experimental study", Journal of
Environmental Research and Development, Vol.8, No.3 PP 471,
2014.
[9] M. H. Mowafy, M. N. Salem, E. A. El-Nikhily and Y. E. Shaaban,
"A study of unsteady flow through earth dams", The Egyptian
International Journal of Engineering Sciences & Technology, Vol.17,
No1, PP. 1686-1696, 2014. [10] H. J. Kanchana and H. S. Prasanna, "Adequacy of seepage analysis
in core section of the earthen dam with different mix proportions",
Aquatic Procedia, Vol. 4, PP. 868-875, 2015. [11] A. Vazquez Borragan, "Modelling internal erosion within an
embankment dam prior to breaching", M. Sc., KTH Royal Institute of
Technology, 2015. [12] X. Luofeng, and D. Xiangbao, "Study on physical model experiment
of dam's seepage stability base on coastal sand", Procedia
Engineering, Vol.28, PP.534-541, 2012. [13] A. Malekpour, D. F. Zade, A. H. Z. Dalir and J. Sadrekarimi, "Effect
of horizontal drain size on the stability of an embankment dam in
steady and transient seepage conditions", Turkish Journal of Engineering and Environmental Sciences, Vol.36, No.2, PP. 139-152,
2012.
[14] Y. Q. Xu, K. Unami, K and T. Kawachi, "Optimal hydraulic design
of earth dam cross section using saturated–unsaturated seepage flow
model", Advances in Water Resources, Vol.26, No.1, PP. 1-7, 2003.
[15] G. Tayfur, D. Swiatek, A. Wita and V. P. Singh, " Case study: Finite element method and artificial neural network models for flow through
Jeziorsko earthfill dam in Poland", Journal of Hydraulic Engineering,
Vol.131, No.6, PP. 431-440, 2005. [16] Q. Chen, Q and L. M. Zhang, "Three-dimensional analysis of water
infiltration into the Gouhou rock fill dam using saturated unsaturated seepage theory", Canadian Geotechnical Journal,Vol.43, No.5, PP.
449-461, 2006.
[17] J. F. Fu and J.I.N. Sheng, "A study on unsteady seepage flow through dam", Journal of Hydrodynamics, Ser. B, Vol.21, No.4, PP. 499-504,
2009.
[18] A. N. Giglou and A. Zeraatparvar, "Seepage estimation through earth dams", Journal of Basic and Applied Scientific Research, Vol.2,
No.8, PP. 7861-7865, 2012.
[19] Q. LI and J. LIU, "Numerical analysis of the seepage field in core-dam". School of civil engineering and architecture", Southwest
Petroleum University, Chengdu, China, 610500, PP. 492-499, 2010.
[20] K. S. Ismaeel and B. M. Noori, "Evaluation of seepage and stability of Duhok dam", AL Rafdain Engineering Journal, Vol.19, No.1,
PP.42-58, 2011.
[21] R. R. Shakir, "Effect of an impervious core constructed into a large earth dam on the quantity of seepage", Thi-Qar University Journal for
Engineering Sciences, Vol.2, No.2, PP. 1-17, 2011.
[22] H. Hasani, J. Mamizadeh and H. Karimi, "Stability of slope and seepage analysis in earth fills dams using numerical models (case
study: Ilam dam-Iran)", World Applied Sciences Journal, Vol.21,
No.9, PP.1398-1402, 2013. [23] A. Fakhari and A. Ghanbari, "A simple method for calculating the
seepage from earth dams with clay core", Journal of GeoEngineering,
Vol.8, No. 1, PP. 27-32, 2013. [24] F. Karampoor and R. Riazi, "Investigation the effect of clay core in
seepage from non-homogenous earth dams using SEEP/W Model",
Journal of scientific research and development, Vol.2, No.5, PP. 280-285, 2015.
[25] A. A. J. Jamel, "Analysis and estimation of seepage through
homogenous earth dam without filter", Diyala Journal of Engineering Sciences, Vol.9, No.2, PP. 38-49, 2016.
[26] S. I. Khassaf and A. M. Madhloom, "Effect of impervious core on
seepage through zoned earth dam (case study: Khassa Chai dam)", International Journal of Scientific & Engineering Research, Vol.8,
No.2, PP. 1053-1064, 2017.
[27] I. Arshad, M. M. Babar and N. Javed, "Numerical analysis of seepage and slope stability in an earthen dam by using geo-slope
software". PSM Biological Research, Vol.2, No.1, PP. 13-20, 2017.
[28] J. Kachare and S. Jagtap, "Seepage analysis of Gangapur, the earthen dam using geo-studio software", International Journal of Recent
Advances in Engineering & Technology, 2017.
[29] T. Souliyavong, C. Gallage, P. Egodawatta and B. Maher, "Factors affecting the stability analysis of earth dam slopes subjected to
reservoir drawdown In Proceedings of the Second International
Conference on Geotechnique, Construction Materials and Environment", The GEOMATE International Society, pp. 507-512,
2012.
International Journal of Engineering Research & Technology (IJERT)
ISSN: 2278-0181http://www.ijert.org
IJERTV8IS080168(This work is licensed under a Creative Commons Attribution 4.0 International License.)
Published by :
www.ijert.org
Vol. 8 Issue 08, August-2019
776

[30] S. H. Abdulkareem, T. M. Ahmed, and A. H. B. Ghazali, "Safety
assessment of earth dams in Kurdistan region, Iraq based on seepage
simulation and surveillance data", Bund. O, Vol. 19, PP.3597-3613,
2014. [31] E. Spencer1967, "A method of analysis of embankments assuming
parallel inter-slice forces", Geotechnique, Vol.17, No.1, pp. 11-26,
1967.
LIST OF SYMBOLS AND VARIABLE
H: The Total Head,
𝐤𝐱: The hydraulic conductivity in x direction,
𝐤𝐲: The hydraulic conductivity in y direction,
Q: the applied boundary flux, 𝛛
𝛛𝐱: Rate of change of gradient in x direction,
𝛛
𝛛𝐲: Rate of change of gradient in y direction,
𝛛𝛉
𝛛𝐭: Rate of change in volumetric water content or water
stored in the soil, required for transient analysis,
W: the total weight of a slice of width b and height h,
N: the total normal force on the base of the slice,
X: the vertical interslice shear forces. Subscripts L and R
define the left and right sides of the slice respectively,
D: an external point load,
𝐤𝐰 : The horizontal seismic load applied through the centroid
of each slice,
R: the radius for a circular slip surface or the moment arm
associated with the mobilized shear force, smfor any shape of
slip surface,
f: the perpendicular offset of the normal force from the centre
of rotation or from the centre of moments. It is assumed that f
distances on the right side of the centre of rotation of a
negative slope (i.e., a right-facing slope) are negative and
those on the left side of the centre of rotation are positive. For
positive slopes, the sign convention is reversed,
x: the horizontal distance from the centreline of each slice to
the centre of rotation or to the centre of moments,
e: the vertical distance from the centroid of each slice to the
centre of rotation or to the centre of moments,
d: the perpendicular distance from a point load to the centre
of rotation or to the centre of moments,
h: the vertical distance from the centre of the base of each
slice to the uppermost line in the geometry (i.e., generally
ground surface),
a: the perpendicular distance from the resultant external water
force to the centre of rotation or to the centre of moments.
The L and R subscripts designate the left and right sides of
the slope, respectively,
A: the resultant external water forces. The L and R subscripts
designate the left and right sides of the slope, respectively,
ω :the angle of the point load from the horizontal. This angle
is measured counter-clockwise from the positive x-axis,
α : the angle between the tangent to the centre of the base of
each slice and the horizontal.
International Journal of Engineering Research & Technology (IJERT)
ISSN: 2278-0181http://www.ijert.org
IJERTV8IS080168(This work is licensed under a Creative Commons Attribution 4.0 International License.)
Published by :
www.ijert.org
Vol. 8 Issue 08, August-2019
777