Embed Size (px)
Citation preview

This is the author manuscript accepted for publication and has undergone full peer review but has not
been through the copyediting, typesetting, pagination and proofreading process, which may lead to
differences between this version and the Version of Record. Please cite this article as doi:
10.1002/JPER.18-0097.
This article is protected by copyright. All rights reserved.
Analysis of salivary phenotypes of generalized aggressive and chronic periodontitis through
nuclear magnetic resonance-based metabolomics
Federica Romano*, Gaia Meoni
†‡, Valeria Manavella
*, Giacomo Baima
*, Leonardo Tenori
†‡, Stefano
Cacciatore§, Mario Aimetti*
*Department of Surgical Sciences, C.I.R. Dental School, University of Turin, Turin, Italy.
†Magnetic Resonance Center (CERM), University of Florence, Sesto Fiorentino, Italy.
‡Department of Experimental and Clinical Medicine, University of Florence, Sesto Fiorentino, Italy.
§Department of Surgery & Cancer, Imperial College, London, UK and International Centre for
Genetic Engineering and Biotechnology, Cancer Genomics Group, Cape Town, South Africa.
Federica Romano and Gaia Meoni contributed equally to this article.
Corresponding author:
Prof. Mario Aimetti, Section of Periodontology, C.I.R. Dental School, Via Nizza 230 10126 Turin
(Italy). Phone: +390116331543 email: [email protected] Fax: +390116331506 (Fax number and
e-mail can be published).
Word count: 3460

This article is protected by copyright. All rights reserved.
Number of Tables: 2
Number of Figures: 4
Number of references: 46
Running title: Salivary metabolomics in periodontitis
One sentence summary: Metabolomic analysis of saliva discriminates healthy individuals from
periodontitis patients, irrespectively of the aggressive or chronic periodontitis profile.
Abstract
Background: Recent findings about the differential gene expression signature of periodontal lesions
have raised the hypothesis of distinctive biological phenotypes expressed by generalized chronic
periodontitis (GCP) and generalized aggressive periodontitis (GAgP) patients. Therefore, this cross-
sectional investigation was planned, primarily, to determine the ability of nuclear magnetic resonance
(NMR) spectroscopic analysis of unstimulated whole saliva to discriminate GCP and GAgP disease-
specific metabolomic fingerprint and, secondarily, to assess potential metabolites discriminating
periodontitis patients from periodontally healthy individuals (HI).
Methods: NMR-metabolomics spectra were acquired from salivary samples of patients with a clinical
diagnosis of GCP (n = 33) or GAgP (n = 28) and from HI (n = 39). The clustering of HI, GCP and
GAgP patients was achieved by using a combination of the Principal Component Analysis and
Canonical Correlation Analysis on the NMR profiles. Results: These analyses revealed a significant
predictive accuracy discriminating HI from GCP, and discriminating HI from GAgP patients (both
81%). In contrast, the GAgP and GCP saliva samples seem to belong to the same metabolic space
(60% predictive accuracy). Significantly lower levels (P < 0.05) of pyruvate, N-acetyl groups and
This article is protected by copyright. All rights reserved.
lactate and higher levels (P < 0.05) of proline, phenylalanine, and tyrosine were found in GCP and
GAgP patients compared with HI.
Conclusions: Within the limitations of this study, CGP and GAgP metabolomic profiles were not
unequivocally discriminated through a NMR-based spectroscopic analysis of saliva.
Keywords: biomarkers, metabolomics, magnetic resonance spectroscopy, periodontal diseases,
saliva.
Introduction
Periodontitis is a multifactorial, chronic, inflammatory disease that leads to loss of periodontal
attachment to the root surface and alveolar bone resorption and, if untreated, ultimately results in
tooth exfoliation.1 It is widely accepted that dysbiosis within the human dental plaque biofilm is the
primary initiator of periodontitis2, even though the extent and severity of tissue destruction appear to
be host-mediated.3,4
Periodontitis can have heterogeneous clinical presentations. The traditional classification recognizes
two major forms of periodontitis, chronic periodontitis (CP) and aggressive periodontitis (AgP),
differing in rate of progression, prognosis and need for specific treatment approaches.5 At the present,
the diagnosis AgP and CP is primarily based on clinical examination and radiographic parameters.5
No clinical, histopathological or microbiological assessment provides an unequivocal discrimination
between the two conditions.6,7
For this reason, there is a strong effort to discover specific molecular
arrays as a diagnostic tool to differentiate CP and AgP by oral-health professionals.8
Several molecules in the oral fluids, namely gingival crevicular fluid (GCF) and saliva, have been
investigated so far in the attempt to provide detailed understanding of the biochemical network of
periodontal tissue destruction.9 Saliva is particularly promising as it contains locally produced

This article is protected by copyright. All rights reserved.
proteins, as well as other molecules from the systemic circulation.8 Furthermore, its collection is non-
invasive, rapid and inexpensive.10
Salivary diagnostics has already proved efficient in identifying
alterations in oral and systemic health status.11,12
Even so, various challenges persist regarding the use
of saliva as a medium for an accurate and cost-effective detection of periodontitis, mainly due to the
lack of specific markers of disease.13
Metabolomics is a newly emerging field of research dealing with the high-throughput identification
and quantification of the whole ensemble of metabolites (small molecules; <1500 Da) in a cell, tissue,
body fluids or ecological systems.14
The metabolomics profiling reflects the dynamic response of a
living system to genetic modification and physiological, pathological, and developmental stimuli.15
Thus, metabolomics offers the potential for a holistic approach to an individualized, patient-centered
medicine.
Compared with other high throughput approaches, the main benefit of metabolomics analysis resides
in its ability to take a snap at the very end-point of all the complex causal pathways driving
periodontal pathogenesis. Small molecules derived from the dysbiotic community and host tissue
breakdown, targeted by metabolomics, are potentially able to reflect the real-time molecular
phenotype of the disease.9 At the same time, it has been proven that saliva is a stable biofluid and that
a clear individual metabolic phenotype can be revealed using saliva samples.16
Untargeted metabolomics by nuclear magnetic resonance (NMR) spectroscopy or mass spectrometry
(MS) has been previously employed to differentiate healthy and periodontally diseased individuals
through the pattern recognition analysis of saliva and GCF, since this approach has the advantage to
maximize the number of metabolites detected, including chemical unknowns.17-19
Although some
studies provided promising preliminary outcomes regarding the detection of some panels of
discriminant metabolites, further trials with larger sample sizes are needed in order to add consistency
and external validity to these results.17-20
This article is protected by copyright. All rights reserved.
To the best of our knowledge, the possibility to employ the NMR-based metabolomics analysis to
discriminate CP and AgP remains to explore. This pilot study was designed to test the hypothesis that
untargeted metabolomic analysis of saliva could differentiate the biochemical signatures of the
generalized forms of chronic periodontitis (GCP) and aggressive periodontitis (GAgP). The secondary
aim was related to the detection of a differentially expressed array of metabolites that could be further
investigated as potential biomarkers for the development of a rapid diagnostic tool for periodontitis.
Material and Methods
The protocol of this cross-sectional study was approved by the Institutional Ethical Review Board
(protocol number 1503/2016) and the study was conducted in accordance with the Helsinki
Declaration. Written informed consent was obtained from all participants. The study was reported
according to the STROBE guidelines.21.
Study population
The sample size was set at 100 individuals based on the results of previous studies19,22
and the pilot
nature of this study. A total of 33 patients with GCP (mean age: 50.5 ± 8.9 years, 63.6% males and
15.2% smokers), 28 patients with GAgP (mean age: 31.1 ± 4.6 years, 64.3% males and 14.3%
smokers) and 39 periodontally healthy individuals (mean age: 46.6 ± 8.2 years, 64.1% males and
15.4% smokers) were consecutively recruited from among individual seeking oral health consultation
at the C.I.R. Dental School, University of Turin (Italy) from January to September 2017. After being
screened, participants were balanced with respect to gender, and smoking habits.
Exclusion criteria included less than 20 teeth; antibiotic intake within the previous 3 months,
periodontal treatment during the past 6 months, abnormal salivary function, diagnosis of any disease
in oral and hard tissues and other systemic conditions that could influence periodontal status and
This article is protected by copyright. All rights reserved.
metabolomic profile (e.g. diabetes mellitus and metabolic syndromes), regular alcohol consumption,
pregnancy and lactation.23
Determination of periodontal status and saliva collection
All participants underwent a periodontal examination by two experienced clinicians (V.M, F.R) who
were previously trained and calibrated for the periodontal examination and saliva sampling. A set of
full-mouth periapical radiographs was taken for each patient. Presence/absence of plaque (PI),
presence/absence of bleeding on probing (BoP), probing depth (PD), and clinical attachment level
(CAL) were measured at six sites around each tooth by manual probing§
. Inter-examiner reliability
was determined by having each examiner made dual measurements along with those of the Project
Director (M.A) on 15 non-study patients, and intra-examiner reproducibility was assessed by taking
replicate measurements on the same patients with an interval of 24 hours between the first and the
second recording. The percentage of agreement within 1 mm of PD and CAL ranged between 94%
and 97%.
Patients with GCP and GAgP and healthy controls were diagnosed based on the current classification
of the 1999 International Workshop for the Classification of Periodontal Diseases and Conditions5 and
met the following criteria. GCP patients had ≥ 30% of sites with PD and CAL > 5 mm, and presence
of BoP.5 Patients in the GAgP group were <35 years of age, and had at least six permanent first
molars and/or incisors with at least one site with PD and CAL > 5 mm as well as a minimum of six
teeth other than first molars and incisors also presenting at least one site each with PD and CAL > 5
mm.24
Other factors such as family aggregation, rapid progression and the relationship between local
factors and periodontal destruction were also considered.5 The control group comprised healthy

This article is protected by copyright. All rights reserved.
individuals (HI) with PD and CAL ≤ 3 mm at all sites on all teeth, no radiographic evidence of
alveolar bone loss, and <15% of sites presenting BoP.24
At least 24 hours after periodontal measurements to avoid blood contamination, unstimulated whole
saliva was obtained by all study subjects between 8:00 and 10:00 am using standard techniques as
described by Silwood et al.25
. Briefly, all subjects were advised to refrain from using mouthwash and
brushing their teeth at least 1 h before sample collection. Each subject was instructed not to force
salivation, to allow saliva to be collected in the mouth, and let the saliva drain into a sterile graduated
tube for 10 min. About 1 ml of saliva was collected from every patient and immediately frozen.
NMR sample preparation
Frozen saliva samples were thawed at room temperature and were centrifuged (5000 × g for a period
of 30 min at 4°C) to remove debris. A total of 300 µl of sodium phosphate buffer (70 mM Na2HPO4;
20 % (v/v) 2H2O; 6.15 mM NaN3; 6.64 mM sodium trimethylsilyl [2,2,3,3-
2H4] propionate (TMSP);
pH 7.4) was immediately added to 300 µl of each sample, and the mixture was homogenized by
vortexing for 30 s. NaN3 was added as a preservative to ensure that metabolites were not generated or
consumed due to bacteria present in the saliva during the time of preparation of the samples or of the
acquisition of NMR spectra. A total of 450 µl of this mixture was transferred into a 4.25 mm NMR
tube¶ for analysis.
NMR spectral acquisition
NMR spectra for all samples were acquired using a spectrometer# operating at 600.13 MHz proton
Larmor frequency equipped with a 5 mm CPTCI 1H-
13C-
31P and
2H-decoupling cryoprobe including a
z axis gradient coil, an automatic tuning-matching (ATM) and an automatic sample changer. A BTO
¶
#
This article is protected by copyright. All rights reserved.
2000 thermocouple served for temperature stabilization at the level of approximately 0.1 K at the
sample. Before measurement, samples were kept for at least 3 min inside the NMR probehead, for
temperature equilibration (300 K). For each saliva sample, a 1H-NMR spectrum was acquired using
the pulse sequence NOESY-presat with 64 free induction decay (FID) collected into 65536 data
points over a spectral width of 12019 Hz, relaxation delay (RD) of 4 s and mixing time of 0.1s.
Spectral processing and analysis
Free induction decays were multiplied by an exponential function equivalent to a 1.0 Hz line-
broadening factor before applying Fourier transform. Transformed spectra were automatically
corrected for phase and baseline distortions and calibrated using a RMN processing software**
.
Spectra were aligned by calibrating the TMSP peak at 0.00 ppm. Each 1D spectrum in the spectral
ranges 0.2−4.3 and 6.6−10.0 ppm was segmented into 0.02 ppm chemical shift bins, and the
corresponding spectral areas were integrated using a specific software program†† . The binning
procedure is a mean to reduce the number of total variables, to compensate for subtle signal shifts, and
filter noise in the spectra, making the analysis more robust and reproducible.26,27
The total spectral
area was calculated on the bins and total area normalization was carried out on the data prior to
pattern recognition.
Statistical analysis
All data analyses were performed blindly using R statistical package. Significance difference among
the clinical groups was calculated using analysis of variance for clinical data and post hoc significance
of differences between pairs of comparisons was determined using Fisher least significant difference
procedure.
**
This article is protected by copyright. All rights reserved.
Multivariate statistical analysis tools were applied to study the metabolomics profiles of GCP, GAgP
and HI groups.28
The supervised statistical procedure applied for data reduction and classification was
a combination of Principal Component Analysis (PCA) and canonical correlation analysis (CA) on the
PCA scores. K-nearest neighbors (kNN) learning method (k = 5) applied on the CA scores was used
to predict test samples. The global accuracy for classification was assessed by means of a Monte
Carlo cross-validation scheme. Twenty-two metabolites, corresponding to well defined and resolved
peaks in the spectra, were assigned. Signal identification was performed using a library of NMR
spectra of pure organic compounds, public databases (e.g. HMBD) storing reference. The relative
concentrations of the various metabolites in the different spectra were calculated by spectral fitting
and integration of the signal area using in-house scripts‡‡
.29
The Wilcoxon test was used for the
determination of the statistically relevant metabolites. False discovery rate correction (FDR) was
applied using the Benjamini and Hochberg method30
: an adjusted P-value ≤ 0.05 was considered
statistically significant. The changes in metabolites levels between periodontitis and healthy controls
spectra were calculated as the log2 fold change (FC) ratio of the normalized median intensities of the
corresponding signals in the spectra of the two groups. A statistical software program was used for
pathway analysis§§
.31
Results
Characteristics of the study population
Demographic and clinical characteristics of the 100 participants according to the periodontal
diagnosis are shown in supplementary Table 1 in the online Journal of Periodontology. The mean age
in the GAgP group was significantly less than the other two groups, whereas ages were similar for the
‡‡ Matlab and Statistics Toolbox, Mathworks Inc., Natick, Massachusetts, USA
§§ MetaboAnalyst version 3.0, www.metaboanalyst.ca
This article is protected by copyright. All rights reserved.
GCP and HI groups (P > 0.05). Smokers in all the three clinical groups smoked less than 10 cigarettes
a day (range 5 to 8).
As expected, the mean Full-Mouth Plaque Scores (FMPS), Full-Mouth Bleeding Scores (FMBS), PD,
and CAL values were statistically significantly higher in patients with GAgP and GCP compared with
the HI; all reached P < 0.001. When GCP and GAgP groups were compared, the only statistically
significant difference found was in FMPS (P < 0.001).
Metabolomic profiling of saliva
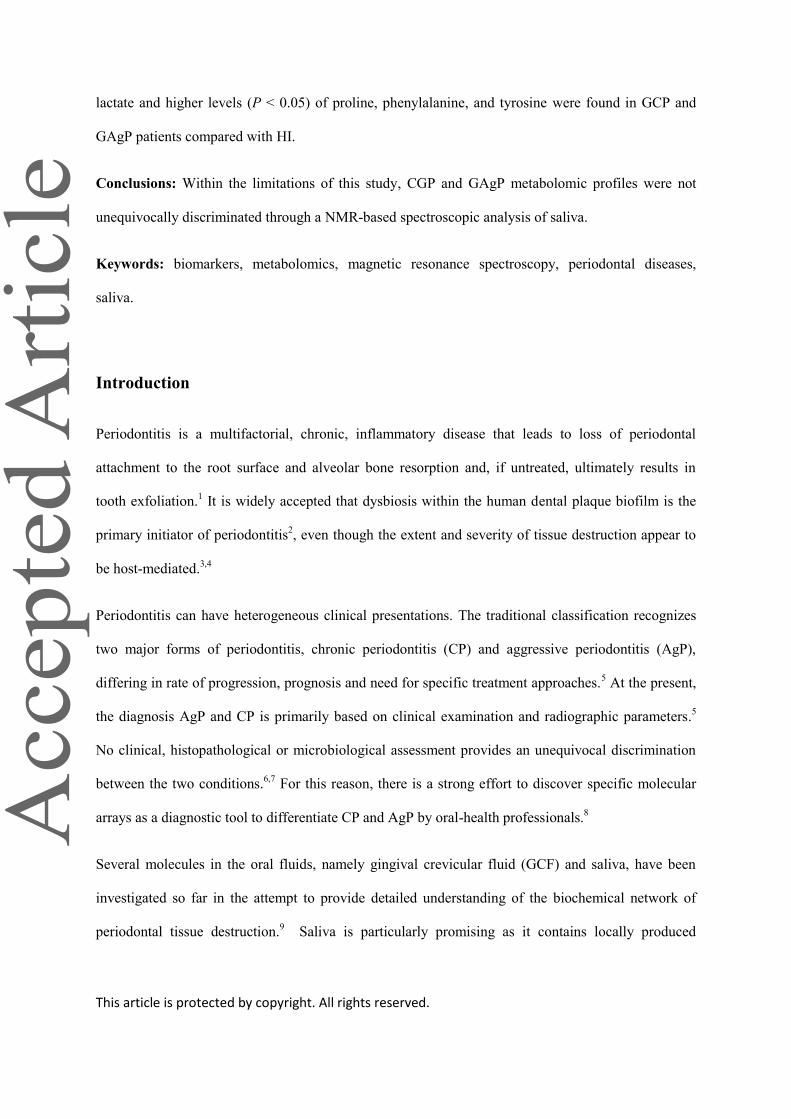
The clustering of HI, GCP and GAgP patients was achieved by using PCA/CA on the 1H-NMR
profiles of saliva samples (Fig. 1). These analyses revealed 81% predictive accuracy discriminating
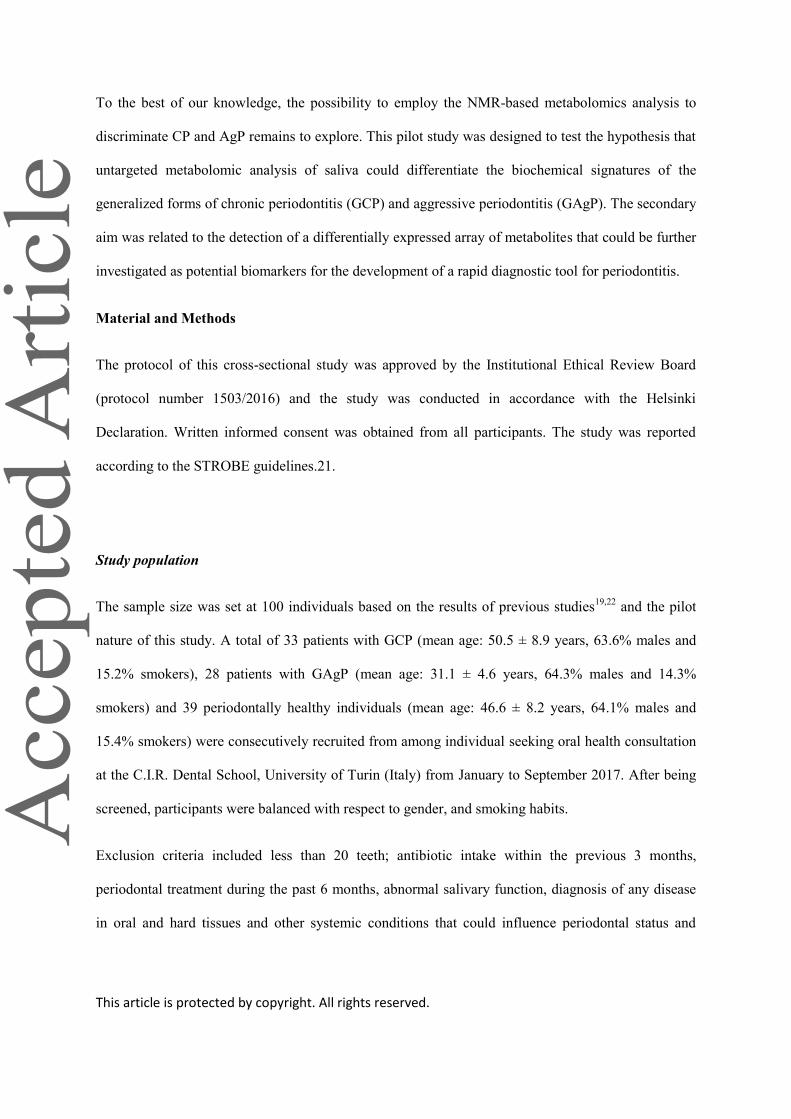
HI from GCP, and 81% discriminating HI from GAgP affected patients (Fig. 2A,B). Permutation test
(number of permutations = 1000) results showed statistically significant classification accuracy (P <
0.001). The statistical model applied proved to be effective to discriminate HI from GCP and GAgP
patients, while the same statistical approach was not effective to discriminate GCP from the GAgP
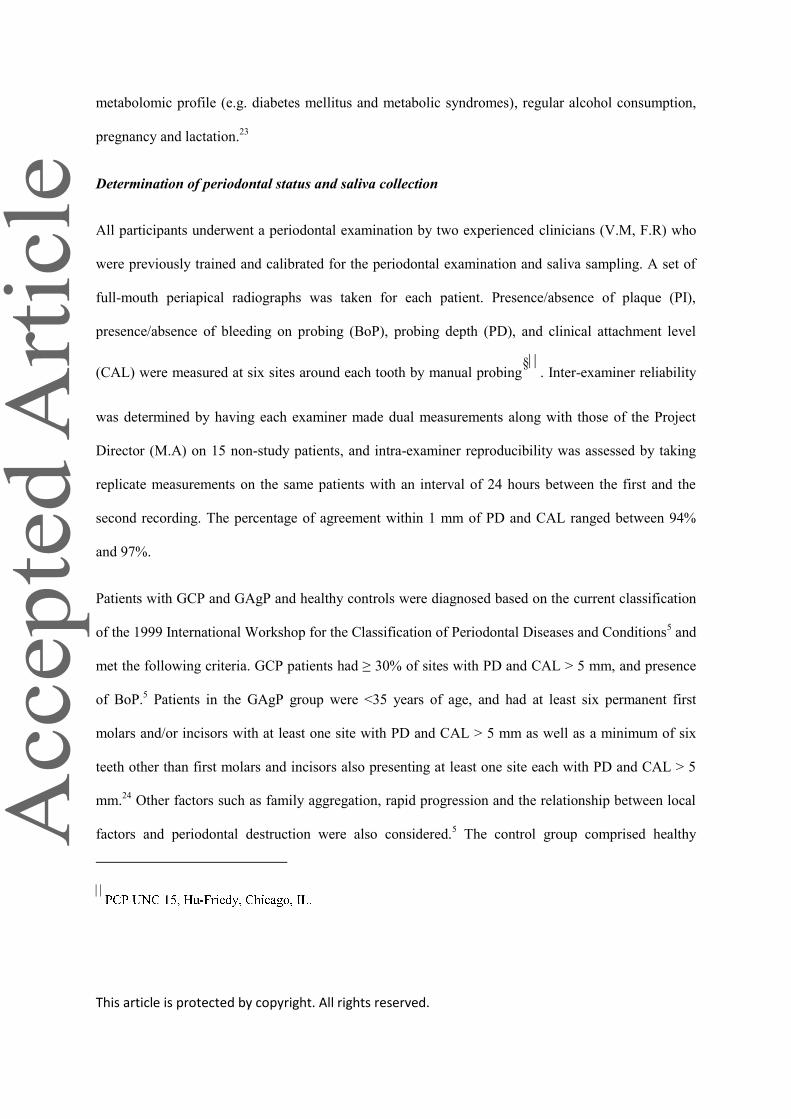
counterpart (60% predictive accuracy). Indeed, GAgP and GCP saliva samples seem belonging to the
same metabolic space (Fig. 3). The predictive accuracy of these models did not change when smokers
were excluded from the analysis (81% HI vs. GCP, 81% HI vs. GAgP, 60% GAgP vs. GCP).
Metabolites contributing to periodontal disease
The discrimination obtained between saliva samples of GCP and GAgP patients compared with HI,
also demonstrated the existence of an altered metabolism in
patients affected from periodontitis. Assigned signals in NMR spectra were integrated to obtain the
concentration of metabolites in arbitrary units. By comparing the spectra of the saliva samples of
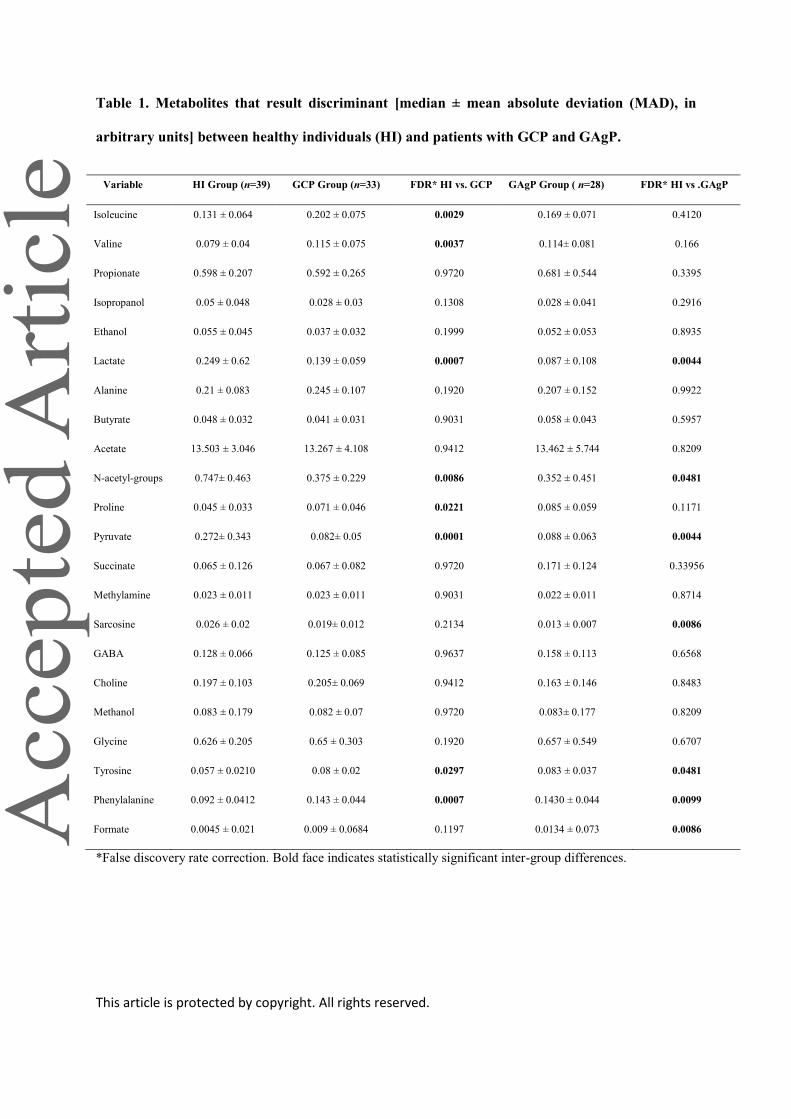
periodontitis patients with HI, it results that GCP patients are characterized by lower levels (P < 0.05)
of pyruvate, N-acetyl groups and lactate, and higher levels (P < 0.05) of proline, phenylalanine,
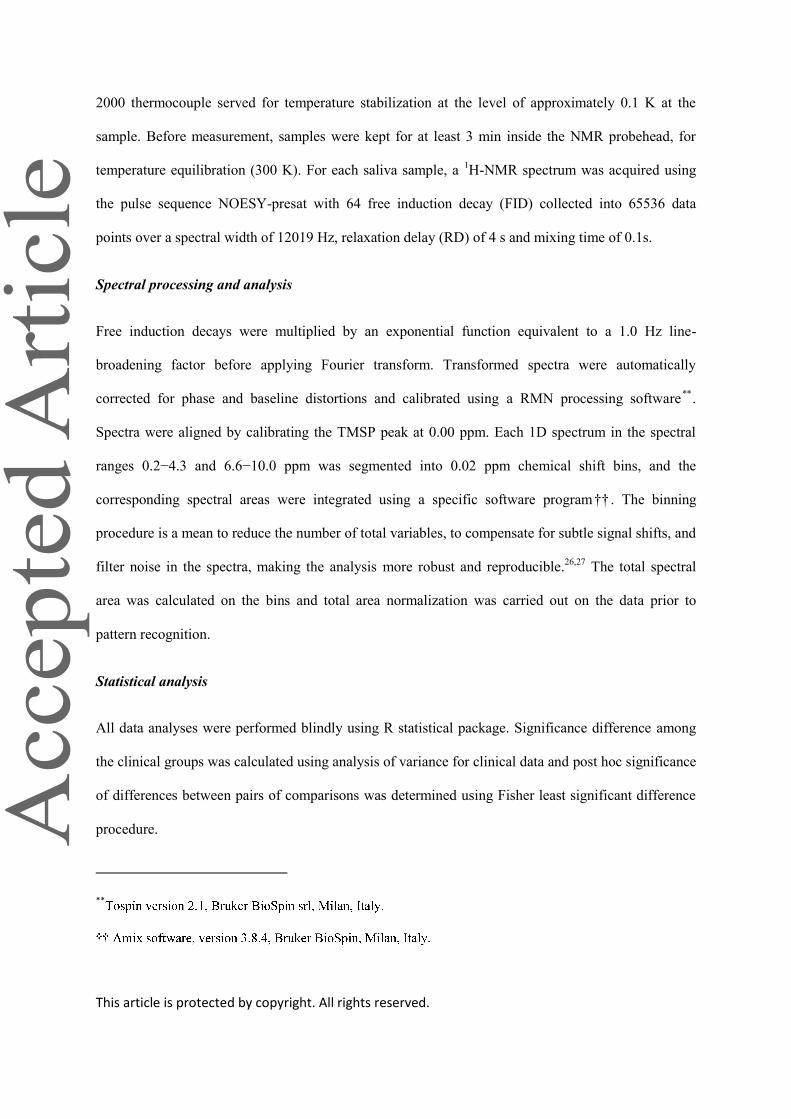
isoleucine, valine and tyrosine, as summarized in Fig. 4A and Table 1. Compared with HI, GAgP
This article is protected by copyright. All rights reserved.
patients are characterized by lower levels (P < 0.05) of pyruvate, N-acetyl groups and lactate and
sarcosine, and higher levels (P < 0.05) of formate, phenylalanine and tyrosine (Fig. 4B). A simplified
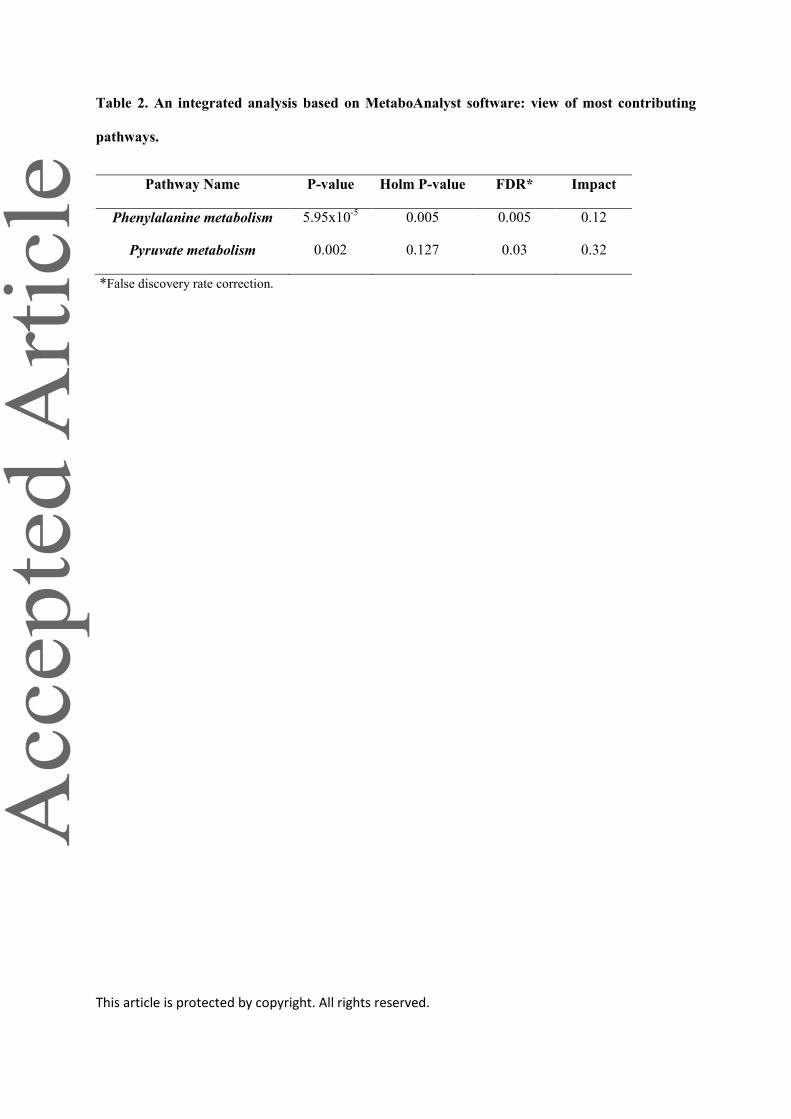
list of the most contributing metabolic pathways is reported in Table 2. The analysis showed alteration
in biochemical pathways like phenylalanine metabolism (phenylalanine, pyruvic acid, tyrosine, lactic
acid) and pyruvate metabolism (pyruvic acid and lactic acid). The analysis was calculated based on
adjusted P-value (P < 0.05) of the pathway enrichment analysis and an “Impact” (calculated from
pathway topology analysis) equal to or greater than 0.1 was considered significant.
Discussion
The present study was designed to test the ability of NMR-based metabolomics to differentiate the
biochemical signatures of GCP and GAgP in human saliva. To this purpose, gingivitis and localized
manifestations of periodontitis were pointedly excluded because of the risk of flawing the results, and
only periodontally HI were selected as controls. However, while corroborating substantial differences
between pathological and healthy periodontal conditions, the multivariate analysis of NMR spectra
did not provide a significant discrimination between the GCP and GAgP metabolomics profiles. The
latter finding is in agreement with an increasing body of evidence and confirms that it is almost
impossible to use the term AgP as long as there is no proper way to diagnose the disease.32
Indeed, the
discrimination between CP and AgP is not supported by sufficiently distinct histological,
microbiological, immunological or genetic foundations.33-37
Moreover, microbiome exhibits
conserved metabolic and virulence gene expression profiles despite the inter-individual differences in
the disease phenotype.38
This may suggest that what distinguishes AgP from CP are dissimilarities in
the immune-inflammatory host response39
or, as advocated by Van der Velden32
, a difference in the
degree of bacterial invasiveness. It is unlikely that the sole analysis of the metabolites in oral fluids
can detect any pathognomonic benchmarks. Presumably, as far as all new high-throughput
technologies have proven the existence of several molecular signatures in distinct periodontal
patients35
, the traditional binomial classification seems not to fit this emerging heterogeneity anymore.
This article is protected by copyright. All rights reserved.
New models need to be hypothesized and tested, but due to the disease complexity a simultaneous
multiomics approach should be elected.
The secondary goal was assessing the potential of oral fluid-based metabolomics to provide robust
molecular biomarkers for periodontal diagnosis. Chronic periodontal infections activate the patient’s
host response to liberate a myriad of metabolic products at the interface between the tooth and the
periodontal pocket.13
The discrimination between the salivary samples from periodontitis patients,
irrespective of the type of disease, and HI strengthens the evidence of a metabolomics trace of
periodontitis in human saliva.17
The Human Metabolome Database reports about 800 metabolites
detected in saliva. However, according to similar studies, the NMR spectral profiles of this set of
subjects are dominated by the signals of 20−30 molecules.16-18
The values of the relative
concentrations of saliva metabolites were estimated through the integration of the signals in the NMR
spectra and were found consistent with the results and the biological interpretation of a previous
publication of this same group.18
The significantly reduced levels of lactate detected in the saliva of
patients with GCP are partially explained by its conversion to acetate and propionate by some of the
most prevalent periodontal bacterial species.40,41
This may reflect on the pyruvate concentrations as
the result of the substrate depletion of the L-lactate dehydrogenase. The levels of proline,
phenylalanine, isoleucine, valine and tyrosine were higher in the saliva samples of patients with GCP
with respect to C, as the amounts (not significant) of fatty acids, dipeptides and monosaccharide. This
parallel up-regulation of the lipase, protease and glycosidase activities found in periodontitis is
responsible for the overall tissue degradation and offers an ideal environment for bacterial
proliferation and immune cells migration.42
The results of the present study should be interpreted with caution, as there are some limitations. One
of the major problems with oral metabolites is that there is no way to determine their true origin. They
could be essential constituent of the patient unique saliva, they could derive from the breakdown of
the host tissues as from the bacterial communities, even from the supragingival plaque. Kuboniwa et
This article is protected by copyright. All rights reserved.
al.22
performed supragingival scaling prior to sample collection and found that the discriminating
ability of their model was significantly improved. By the way, in this study a scaling session was not
performed; being able to find differences in a largely noisy environment could have more impact on
the development of a rapid, noninvasive diagnostic tool.
Furthermore, the groups were matched for gender and smoking habits, yet not for age. This was not
possible due to the difference in the age of onset of the two clinical forms of periodontitis, therefore
GAgP patients were in average younger than GCP patients and the control group was comparable for
age only with GCP individuals. Although there are no NMR-based metabolomics studies on the effect
of aging on saliva, it is well-known that aging has a drastic effect on the serum metabolome.43,44
Concentrations of certain small molecule metabolites in saliva, including some hormones and many
pharmaceuticals and drugs of abuse, are known to correlate quantifiably with concentrations in serum.
Nonetheless, data from a companion study demonstrated that the salivary NMR fingerprint had low
discrimination accuracy between young (14 - 40 years) and elderly (58 – 73 years).18
Finally, due to the limited number of light smokers within this subset, the effect of smoking habits on
metabolomics profiling was not specifically analyzed. However, when smokers were excluded from
the analysis, the discrimination accuracy of the predicting models remained unchanged. It was thus
plausible to exclude smoking as a confounding factor. This finding corroborates previous data
demonstrating that light smoking had a negligible effect on the salivary profile.18
A major challenge in clinical periodontology is to find a reliable molecular marker of tissue
destruction with high sensitivity, specificity and utility. At present, there is still a certain level of noise
in metabolites fluctuation occurring in the periodontal microenvironment during the pathogenesis of
periodontitis, that is not currently understood.45
The hurdle in identifying neat pathological
phenotypes is due to the intrinsic heterogeneity of periodontal diseases and the inherent complexity
underlying.35,46
Presumably, the main concern a clinician should have is not about discriminating
This article is protected by copyright. All rights reserved.
between GCP and GAgP, but about the prompt detection of active or inactive phases of supporting
tissue breakdown. Future endeavors of salivary biomarkers inquiries should be hence directed towards
the real time assessment of disease activity and the molecular characterization of different phenotypes
of severe periodontitis. Regarding this issue, metabolomics could be of most interest in future
research directions.
Conclusions
This cross-sectional investigation provided the evidence that NMR-based metabolomics failed to
detect an unequivocal biochemical signature discriminating GCP from GAgP. The absence of
evidence is not automatically evidence of the absence, but this finding adds consistency to the quest to
redefine the current classification of periodontitis. Conversely, the successful differentiation between
healthy and diseased individuals corroborated the sensibility of metabolomics profiling as a source of
potential panels of biomarkers for molecular diagnostics. Nonetheless, the complex multifactorial
etiology of periodontitis will require large clinical trials bringing together a multiomics assessment of
saliva to properly address this issue.
Acknowledgments
The authors received no financial support and declare no potential conflicts of interest with respect to
the authorship and/or publication of this article.
This article is protected by copyright. All rights reserved.
REFERENCES
1. Kornman KS. Mapping the pathogenesis of periodontitis: a new look. J Periodontol
2008;79(Suppl. 8):1560–1568.
2. Roberts FA, Darveau RP. Microbial protection and virulence in periodontal tissue as a function of
polymicrobial communities: symbiosis and dysbiosis. Periodontol 2000 2015;69:18–27.
3. Bartold PM, Van Dyke TE. Periodontitis: a host-mediated disruption of microbial homeostasis.
Unlearning learned concepts. Periodontol 2000 2013;62:203–217.
4. Papapanou PN. Commentary: advances in periodontal disease epidemiology: a retrospective
commentary. J Periodontol 2014;85:877–879.
5. Armitage GC. Development of a classification system for periodontal diseases and conditions. Ann
Periodontol 1999;4:1–6.
6. Armitage GC. Comparison of the microbiological features of chronic and aggressive periodontitis.
Periodontol 2000 2010;53:70-88.
7. Ji S, Choi Y. Point-of-care diagnosis of periodontitis using saliva: technically feasible but still a
challenge. Front Cell Infect Microbiol 2015;5:65.
8. Buduneli N, Kinane DF. Host-derived diagnostic markers related to soft tissue destruction and bone
degradation in periodontitis. J Clin Periodontol 2011;38(Suppl. 11):85–105.
9. Barros SP, Williams R, Offenbacher S, Morelli T. Gingival crevicular fluid as a source of
biomarkers for periodontitis. Periodontol 2000 2016;70:53–64.
10. Kinney JS, Morelli T, Braun T, et al. Saliva/pathogen biomarker signatures and periodontal
disease progression. J Dent Res 2011;90:752–758.
11. Zhang Y, Sun J, Lin CC, Abemayor E, Wang MB, Wong DTW. The emerging landscape of
salivary diagnostics. Periodontol 2000 2016;70:38-52.
This article is protected by copyright. All rights reserved.
12. Rathnayake N, Gieselmann DR, Heikkinen AM, Tervahartiala T, Sorsa T. Salivary Diagnostics-
Point-of-Care diagnostics of MMP-8 in dentistry and medicine [published online ahead of print
January 20, 2017]. Diagnostics (Basel); doi: 10.3390/diagnostics7010007.
13. Giannobile WV. Salivary diagnostics for periodontal diseases. J Am Dent Assoc 2012;143(Suppl.
10):6–11.
14. German JB, Hammock BD, Watkins SM. Metabolomics: building on a century of biochemistry to
guide human health. Metabolomics 2005;1:3–9.
15. Clark J, Haselden JN. Metabolic profiling as a tool for understanding mechanisms of toxicity.
Toxicol Pathol 2008;36:140-147.
16. Wallner-Liebmann S, Tenori L, Mazzoleni A, et al. Individual human metabolic phenotype
analyzed by (1)H NMR of saliva samples. J Proteome Res 2016;15:1787–1793.
17. Barnes VM, Ciancio SG, Shibly O, et al. Metabolomics reveals elevated macromolecular
degradation in periodontal disease. J Dent Res 2011;90:1293-1297.
18. Aimetti M, Cacciatore S, Graziano A, Tenori L. Metabonomic analysis of saliva reveals
generalized chronic periodontitis signature. Metabolomics 2012;8:465–474.
19. Ozek NS, Zeller I, Renaul DE, et al. Differentitation of chronic and aggressive periodontitis by
FTIR spectroscopy. J Dent Res 2016;95:1472-1478.
20. Mikkonen JJW, Singh SP, Herrala M, Lappalainen R, Myllymaa S, Kullaa AM. Salivary
metabolomics in the diagnosis of oral cancer and periodontal diseases. J Periodontal Res
2016;51:431-437.
21. von Elm E, Altman DG, Egger M, Pocock SJ, Gotzsche PC, Vandenbroucke JP. The
strengthening the reporting of observational studies in epidemiology (STROBE) statement: guidelines
for reporting observational studies. Lancet 2010; 370:1453–1457.
22. Kuboniwa M, Sakanaka A, Hashino E, Bamba T, Fukusaki E, Amano A. Prediction of periodontal
inflammation via metabolic profiling of saliva. J Dent Res 2016;95:1381-1386.
This article is protected by copyright. All rights reserved.
23. Guasch-Ferré M, Hruby A, Toledo E, et al. Metabolomics in prediabetes and diabetes: a
systematic review and meta-analysis. Diabetes Care 2016;39:833–846.
24. Ertugrul AS, Sahin H, Dikilitas A, Alpaslan N, Bozoglan A. Comparison of CCL28, interleukin-8,
interleukin-1b and tumor necrosis factor-alpha in subjects with gingivitis,
chronic periodontitis and generalized aggressive periodontitis. J Periodont Res 2013; 48:44–51.
25. Silwood CJL, Lynch EJ, Seddon S, Sheerin A, Claxson AWD, Grootveld MC. 1H-NMR analysis
of microbial-derived organic acids in primary root carious lesions and saliva. NMR Biomed
1999;12:345–356.
26. Holmes E, Foxall PJ, Nicholson JK, et al. Automatic data reduction and pattern recognition
methods for analysis of 1H nuclear magnetic resonance spectra of human urine from normal and
pathological states. Anal Biochem 1994;220:284–296.
27. Spraul M, Neidig P, Klauck U, et al. Automatic reduction of NMR spectroscopic data for
statistical and pattern recognition classification of samples. J Pharm Biomed Anal 1994;12:1215–
1225.
28. Madsen R, Lundstedt T, Trygg J. Chemometrics in metabolomics--a review in human disease
diagnosis. Anal Chim Acta 2010;659:23–33.
29. Wishart DS. Quantitative metabolomics using NMR. TrAC Trends Anal Chem 2008;27:228–237.
30. Benjamini Y, Hochberg Y. On the adaptive control of the false discovery rate in multiple testing
with independent statistics. J Educ Behav Stat 2000;25:60–83.
31. Xia J, Sinelnikov IV, Han B, Wishart DS. MetaboAnalyst 3.0--making metabolomics more
meaningful. Nucleic Acid Res 2015;43:W251-257.
32. Van der Velden U. What exactly distinguishes aggressive from chronic periodontitis: is it mainly a
difference in the degree of bacterial invasiveness? Periodontol 2000 2017;75:24–44.
This article is protected by copyright. All rights reserved.
33. Nibali L, D’Aiuto F, Ready D, Parkar M, Yahaya R, Donos N. No association between A.
actinomycetemcomitans or P. gingivalis and chronic or aggressive periodontitis diagnosis.
Quintessence Int 2012;43:247–254.
34. Kebschull M, Guarnieri P, Demmer RT, Boulesteix AL, Pavlidis P, Papapanou PN. Molecular
differences between chronic and aggressive periodontitis. J Dent Res 2013; 92:1081-1088.
35. Loos BG, Papantonopoulos G. Molecular biotypes for periodontal diseases? J Dent Res
2013;92:1056–1057.
36. Könönen E, Müller HP. Microbiology of aggressive periodontitis. Periodontol 2000 2014;65:46–
78.
37. Ziukaite L, Slot DE, Loos BG, Coucke W, Van der Weijden GA. Family history of periodontal
disease and prevalence of smoking status among adult periodontitis patients: a cross-sectional study.
Int J Dent Hyg 2017;15:e28-e34.
38. Jorth P, Turner KH, Gumus P, Nizam N, Buduneli N, Whiteley M. Metatranscriptomics of the
human oral microbiome during health and disease. mBio 2014;5:e01012-01014.
39. Champagne CME, Buchanan W, Reddy MS, Preisser JS, Beck JD, Offenbacher S. Potential for
gingival crevice fluid measures as predictors of risk for periodontal diseases. Periodontol 2000
2003;31:167–180.
40.
41.
42. Barnes VM, Teles R, Trivedi HM, et al. Acceleration of purine degradation by periodontal
diseases. J Dent Res 2009;88:851-855.

This article is protected by copyright. All rights reserved.
43. Yu Z, Zhai G, Singmann P, et al. Human serum metabolic profiles are age dependent. Aging Cell
2012;11:960-967.
44. Vignoli A, Tenori L, Luchinat C, Saccenti E. Age and sex effects on plasma metabolite
association networks in healthy subjects. J Proteome Res 2018;17:97–107.
45. Hajishengallis G, Korostoff JM. Revisiting the Page & Schroeder model: the good, the bad and
the unknowns in the periodontal host response 40 years later. Periodontol 2000 2017;75:116–151.
46. Khoury MJ, Gwinn M, Ioannidis JP. The emergence of translational epidemiology: from scientific
discovery to population health impact. Am J Epidemiol 2010;172:517–524.
Figure legends
Figure 1. PCA/CA score plot built on saliva spectra of healthy (HI) and periodontitis patients (GAgP
and GCP). Healthy individuals are very well recognized, while the saliva samples of chronic and
aggressive periodontitis are confounded within the same metabolic space as suggested by cross-
validation result.
This article is protected by copyright. All rights reserved.
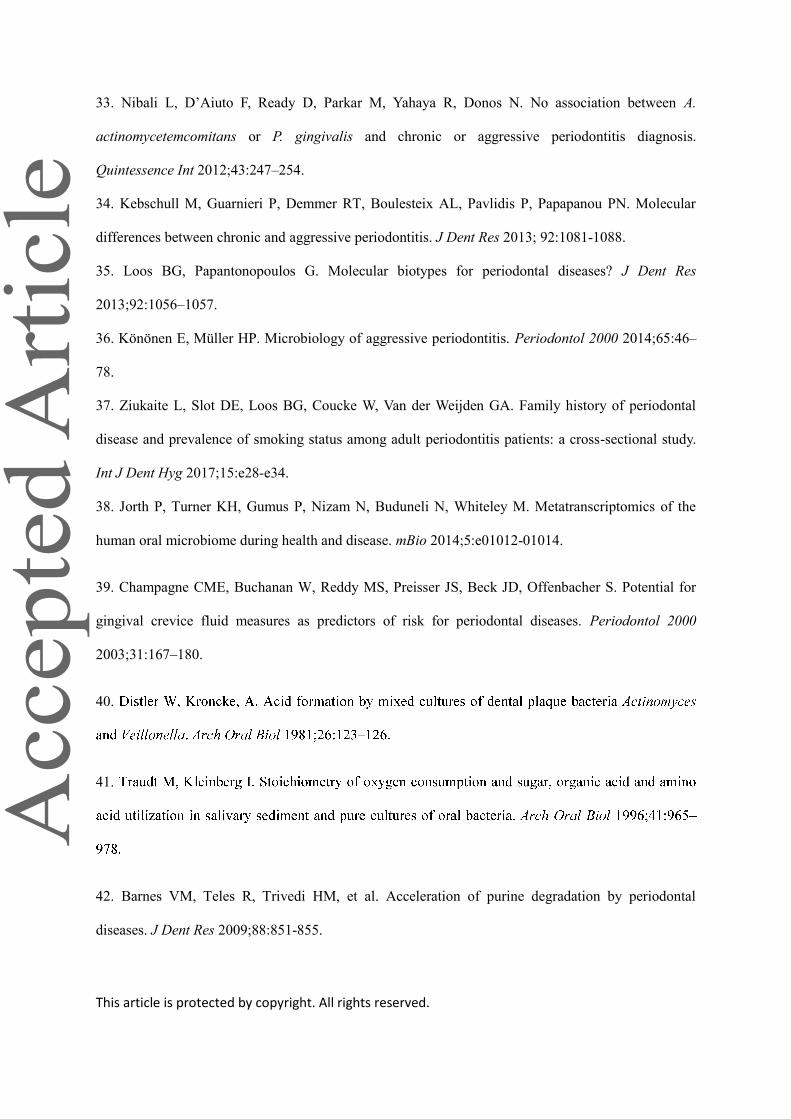
Figure 2. PCA/CA score plots. Discrimination between saliva spectra of healthy individuals and
chronic periodontitis patients (A) and between healthy and aggressive periodontitis patients (B). In
both cases, the discrimination is effective as it arises from the related prediction accuracy.
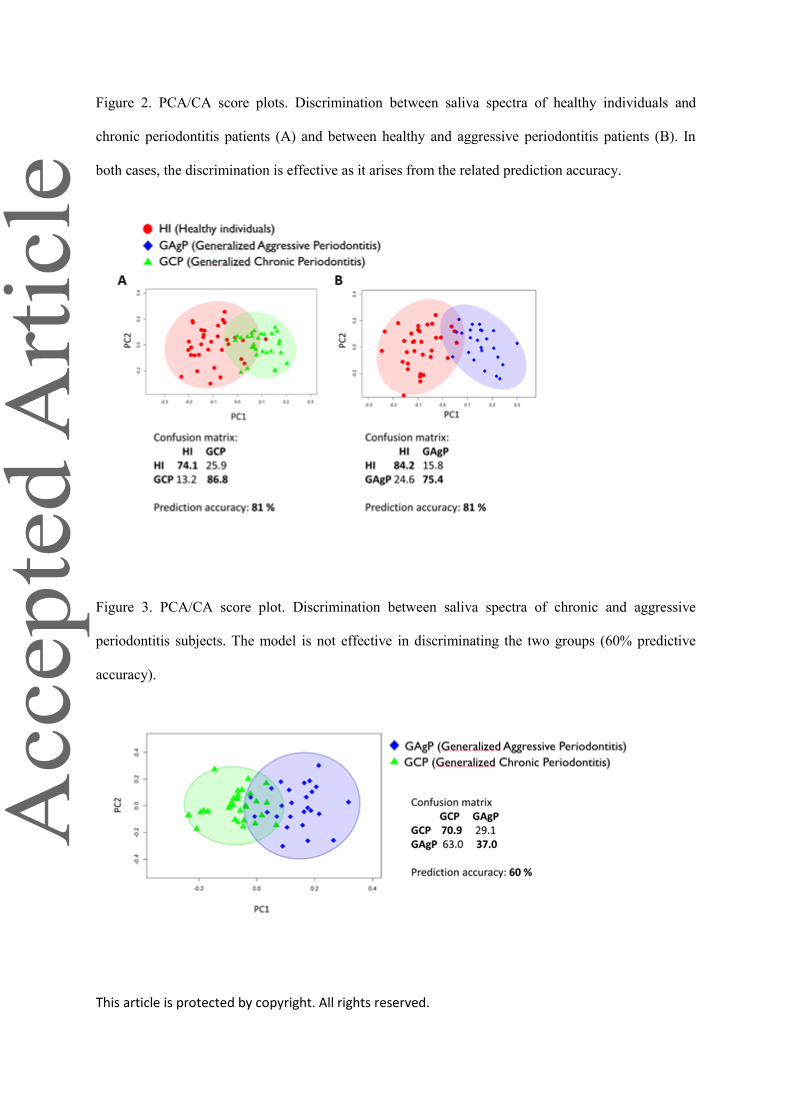
Figure 3. PCA/CA score plot. Discrimination between saliva spectra of chronic and aggressive
periodontitis subjects. The model is not effective in discriminating the two groups (60% predictive
accuracy).
This article is protected by copyright. All rights reserved.
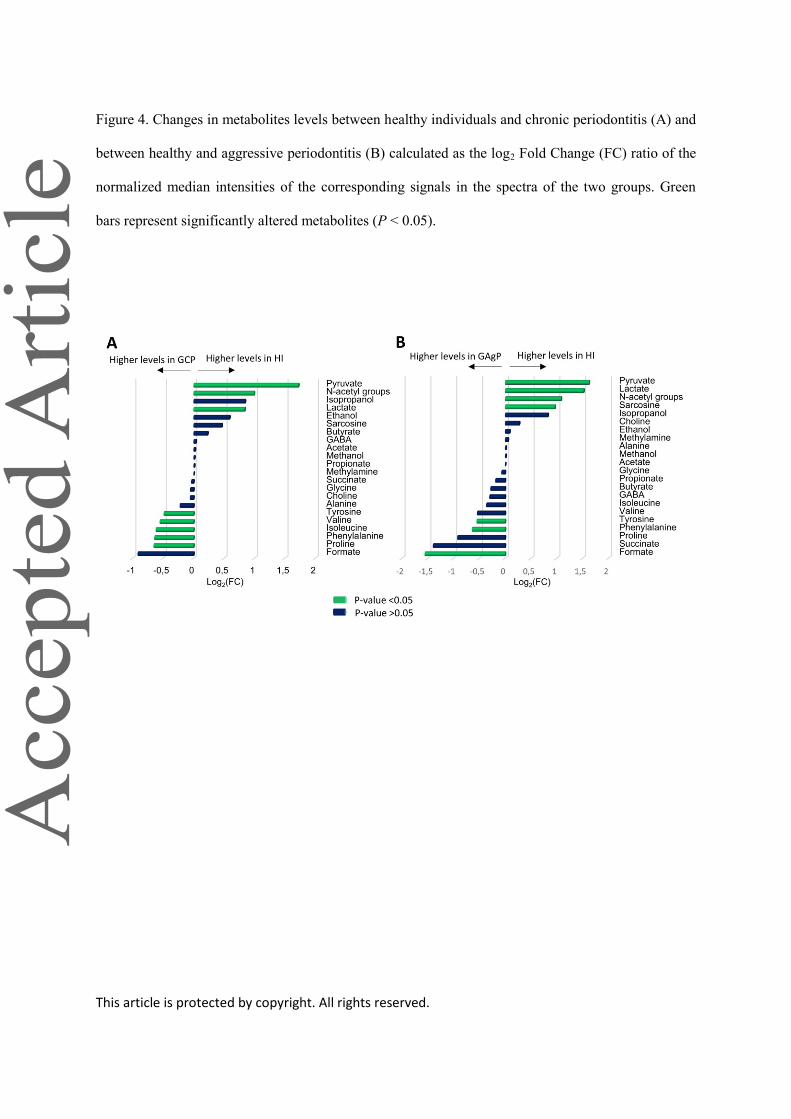
Figure 4. Changes in metabolites levels between healthy individuals and chronic periodontitis (A) and
between healthy and aggressive periodontitis (B) calculated as the log2 Fold Change (FC) ratio of the
normalized median intensities of the corresponding signals in the spectra of the two groups. Green
bars represent significantly altered metabolites (P < 0.05).
This article is protected by copyright. All rights reserved.
Table 1. Metabolites that result discriminant [median ± mean absolute deviation (MAD), in
arbitrary units] between healthy individuals (HI) and patients with GCP and GAgP.
Variable HI Group (n=39) GCP Group (n=33) FDR* HI vs. GCP GAgP Group ( n=28) FDR* HI vs .GAgP
Isoleucine 0.131 ± 0.064 0.202 ± 0.075 0.0029 0.169 ± 0.071 0.4120
Valine 0.079 ± 0.04 0.115 ± 0.075 0.0037 0.114± 0.081 0.166
Propionate 0.598 ± 0.207 0.592 ± 0.265 0.9720 0.681 ± 0.544 0.3395
Isopropanol 0.05 ± 0.048 0.028 ± 0.03 0.1308 0.028 ± 0.041 0.2916
Ethanol 0.055 ± 0.045 0.037 ± 0.032 0.1999 0.052 ± 0.053 0.8935
Lactate 0.249 ± 0.62 0.139 ± 0.059 0.0007 0.087 ± 0.108 0.0044
Alanine 0.21 ± 0.083 0.245 ± 0.107 0.1920 0.207 ± 0.152 0.9922
Butyrate 0.048 ± 0.032 0.041 ± 0.031 0.9031 0.058 ± 0.043 0.5957
Acetate 13.503 ± 3.046 13.267 ± 4.108 0.9412 13.462 ± 5.744 0.8209
N-acetyl-groups 0.747± 0.463 0.375 ± 0.229 0.0086 0.352 ± 0.451 0.0481
Proline 0.045 ± 0.033 0.071 ± 0.046 0.0221 0.085 ± 0.059 0.1171
Pyruvate 0.272± 0.343 0.082± 0.05 0.0001 0.088 ± 0.063 0.0044
Succinate 0.065 ± 0.126 0.067 ± 0.082 0.9720 0.171 ± 0.124 0.33956
Methylamine 0.023 ± 0.011 0.023 ± 0.011 0.9031 0.022 ± 0.011 0.8714
Sarcosine 0.026 ± 0.02 0.019± 0.012 0.2134 0.013 ± 0.007 0.0086
GABA 0.128 ± 0.066 0.125 ± 0.085 0.9637 0.158 ± 0.113 0.6568
Choline 0.197 ± 0.103 0.205± 0.069 0.9412 0.163 ± 0.146 0.8483
Methanol 0.083 ± 0.179 0.082 ± 0.07 0.9720 0.083± 0.177 0.8209
Glycine 0.626 ± 0.205 0.65 ± 0.303 0.1920 0.657 ± 0.549 0.6707
Tyrosine 0.057 ± 0.0210 0.08 ± 0.02 0.0297 0.083 ± 0.037 0.0481
Phenylalanine 0.092 ± 0.0412 0.143 ± 0.044 0.0007 0.1430 ± 0.044 0.0099
Formate 0.0045 ± 0.021 0.009 ± 0.0684 0.1197 0.0134 ± 0.073 0.0086
*False discovery rate correction. Bold face indicates statistically significant inter-group differences.
This article is protected by copyright. All rights reserved.
Table 2. An integrated analysis based on MetaboAnalyst software: view of most contributing
pathways.
Pathway Name P-value Holm P-value FDR* Impact
Phenylalanine metabolism 5.95x10⁻⁵
0.005 0.005 0.12
Pyruvate metabolism 0.002 0.127 0.03 0.32
*False discovery rate correction.