Embed Size (px)
Citation preview

ANALYSIS OF RECRUITMENT OF POCILLOPORA DAMICORNIS UNDER
CLIMATE CHANGE SCENARIOS
A THESIS SUBMITTED TO
THE GLOBAL ENVIRONMENTAL SCIENCE
UNDERGRADUATE DIVISION IN PARTIAL FULFILLMENT
OF THE REQUIREMENTS FOR THE DEGREE OF
BACHELOR OF SCIENCE
IN
GLOBAL ENVIRONMENTAL SCIENCE
December 2017
By
Tiana Tran
Thesis Advisors
Dr. Robert Toonen

ii
[We / I] certify that [we / I] have read this thesis and that, in [our / my] opinion, it is
satisfactory in scope and quality as a thesis for the degree of Bachelor of Science in
Global Environmental Science.
THESIS ADVISORS
________________________________
Robert Toonen
Hawai’i Institute of Marine Biology

iii
ACKNOWLEDGEMENTS
First and foremost, I would like to express my gratitude towards Dr. Keisha Bahr
and Dr. Chris Jury for allowing me the opportunity to partake in this project, and for all
their guidance in mentoring me through my first scientific research endeavor. I would
also like to express much appreciation towards everyone at the Jokiel lab for being so
welcoming, and for making my time at HIMB so joyous and rewarding. A special
acknowledgement goes to Michael Guidry for his immense support throughout my entire
undergraduate experience, and for advising me through the hardships. Lastly, I would
like to acknowledge my parents, sisters, and friends who have been there for me
unconditionally, and whom I couldn’t have done this without.

iv
ABSTRACT
Ocean warming and acidification are among the greatest threats to coral reefs, and
severe bleaching events have become more common in recent decades, putting coral reefs
at risk of extinction. The loss of coral reefs would have a catastrophic cascading effect on
all marine life and would mean a loss of one the world’s largest pools of biodiversity.
There have been many studies conducted on the individual effects of warming and
acidification on coral response, but not as many that attempt to assess the combined
effect, which could possibly be synergistic. This study looks at the individual and
combined effects of warming and acidification on Pocillopora damicornis under four
different treatments: ambient, heated, acidified, and heated/acidified, in a multi-annual
mesocosm experiment. P. damicornis were able to recruit under these stressors, and the
recruits were measured for size, condition, and abundance during two separate
assessments and the differences across treatments and within treatments were analyzed.
The results showed that more bleaching occurred in the heated treatments than in the non-
heated treatments, and that mean size significantly increased in the treatments with
acidification from July to October.
v
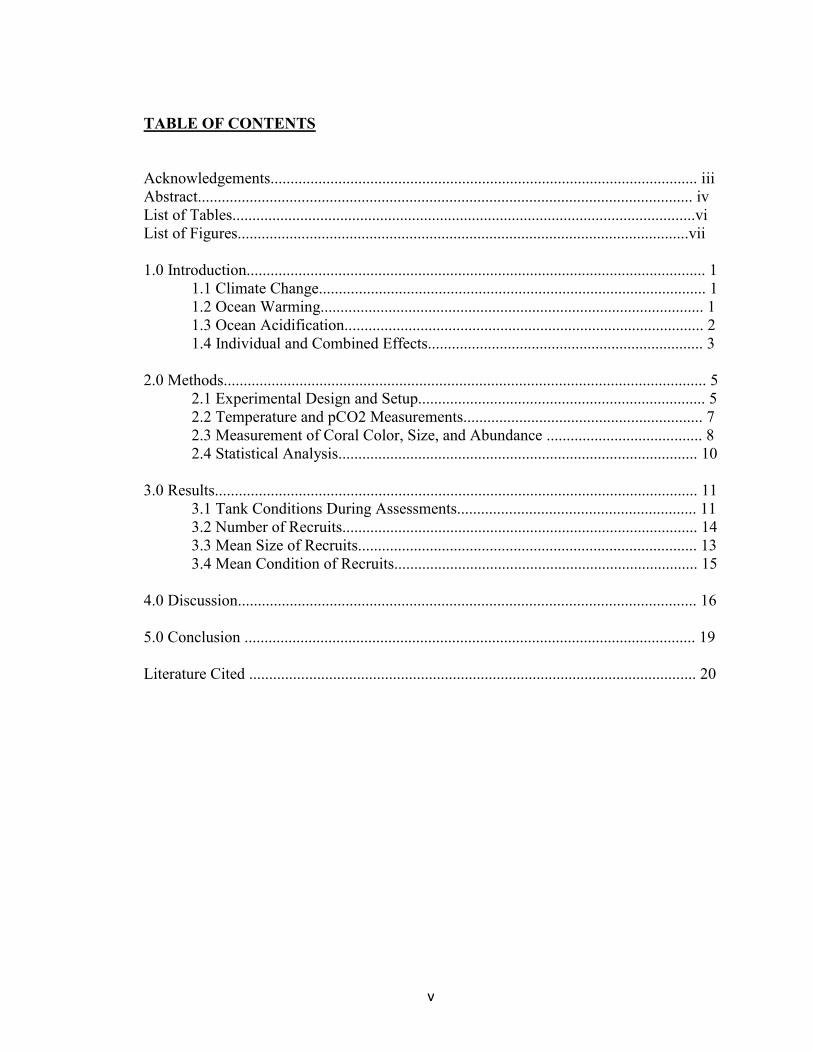
TABLE OF CONTENTS
Acknowledgements........................................................................................................... iii
Abstract............................................................................................................................ iv
List of Tables....................................................................................................................vi
List of Figures.................................................................................................................vii
1.0 Introduction................................................................................................................... 1
1.1 Climate Change................................................................................................. 1
1.2 Ocean Warming................................................................................................ 1
1.3 Ocean Acidification.......................................................................................... 2
1.4 Individual and Combined Effects..................................................................... 3
2.0 Methods......................................................................................................................... 5
2.1 Experimental Design and Setup........................................................................ 5
2.2 Temperature and pCO2 Measurements............................................................ 7
2.3 Measurement of Coral Color, Size, and Abundance ....................................... 8
2.4 Statistical Analysis.......................................................................................... 10
3.0 Results......................................................................................................................... 11
3.1 Tank Conditions During Assessments............................................................ 11
3.2 Number of Recruits......................................................................................... 14
3.3 Mean Size of Recruits..................................................................................... 13
3.4 Mean Condition of Recruits............................................................................ 15
4.0 Discussion................................................................................................................... 16
5.0 Conclusion ................................................................................................................. 19
Literature Cited ................................................................................................................ 20
vi
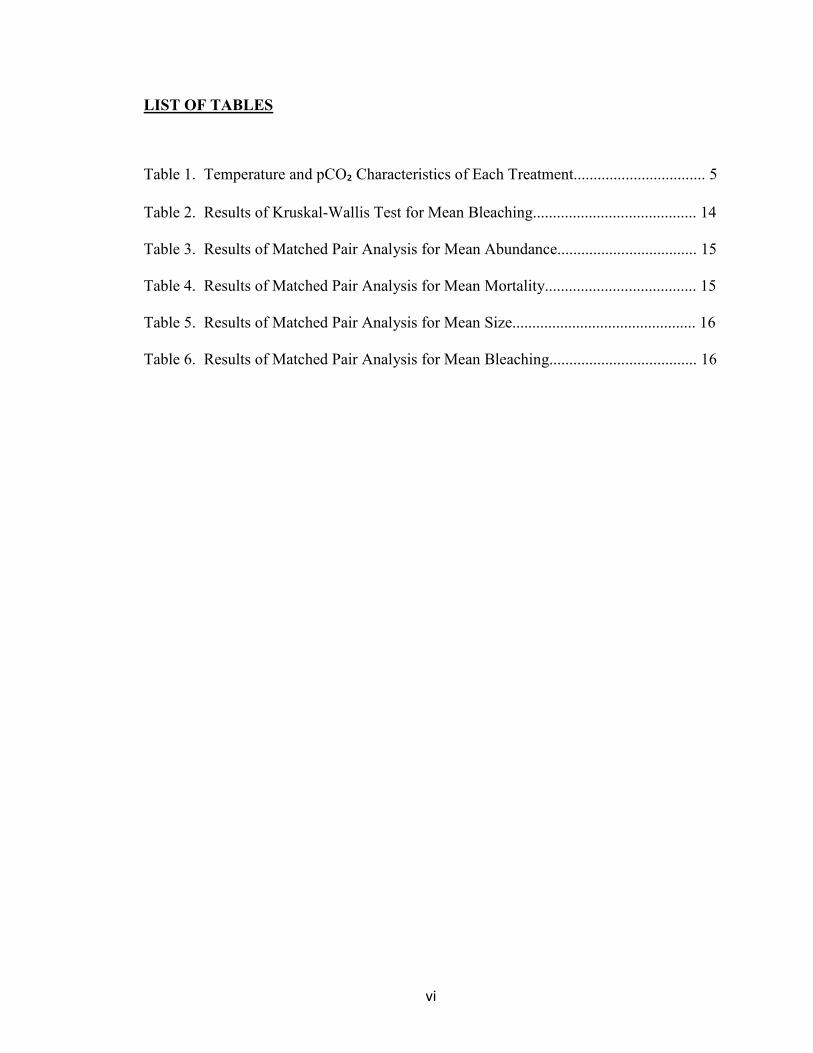
LIST OF TABLES
Table 1. Temperature and pCO₂ Characteristics of Each Treatment................................. 5
Table 2. Results of Kruskal-Wallis Test for Mean Bleaching......................................... 14
Table 3. Results of Matched Pair Analysis for Mean Abundance................................... 15
Table 4. Results of Matched Pair Analysis for Mean Mortality...................................... 15
Table 5. Results of Matched Pair Analysis for Mean Size.............................................. 16
Table 6. Results of Matched Pair Analysis for Mean Bleaching..................................... 16

vii
LIST OF FIGURES
Figure 1. Example Mesocosm........................................................................................... 4
Figure 2. Outdoor Mesocosm Setup.................................................................................. 6
Figure 3. Schematic Map of Treatments........................................................................... 7
Figure 4. Close up of Feeder Tank and Header Tanks...................................................... 7
Figure 5. Coral Health Chart............................................................................................. 9
Figure 6. Time Series of Average Temperatures............................................................. 10
Figure 7. Tank Temperatures During Assessments......................................................... 12
Figure 8. Number of Tanks with Recruits....................................................................... 12
Figure 9. Mean Number of Recruits................................................................................. 13
Figure 10. Mean Size of Recruits..................................................................................... 13
Figure 11. Mean Percent of Conditions............................................................................ 14

1
1.0 INTRODUCTION
1.1 Climate Change
Coral reefs are one of the most diverse and productive ecosystems in the world
and hold great biological value, as they are an important habitat for marine species and
also provide us with coastal protection, food, and resources. However, due to the
increasing diversity, frequency, and scale of human impacts, coral reefs are now one of
the most threatened habitats and are declining at 1-2% per year (Hoegh-Guldberg, 2011).
Human activities mainly due to the burning of fossil fuels, produce anthropogenic
emissions including carbon dioxide, a greenhouse gas. This has consequently forced the
atmospheric carbon dioxide concentration to increase at an alarming rate, intensifying the
greenhouse effect and warming the planet as well as the oceans, which absorb some of
the heat. The rate of current CO2 increase is about 100x faster than what has occurred
over the past 650,000 years, and the rising atmospheric CO2 levels have risen to the point
of being irreversible on human timescales (Kleypas et al., 2006).
1.2 Ocean Warming
Corals are tolerant of only a range of temperatures, becoming stressed if their
thermal threshold is exceeded, causing them to bleach (Hoegh-Guldberg et al., 2007).
Here in Hawai‘i, sea surface temperatures have already increased 1.15°C between 1956-
2014 (Bahr et al., 2016). Bleaching is caused by a breakdown in the symbiosis of the
coral with its zooxanthellae that provides nearly ninety percent of its metabolic
requirements, ultimately reducing the performance of the coral host (Pandolfi et al.,
2
2011). Coral bleaching events often result in high coral mortality, and the frequency and
intensity of these events will increase due to continued increases in carbon production
(Hoegh-Guldberg et al., 2007). There have already been several extremely severe
bleaching events that have wiped out extensive areas of coral reef, and events of this
magnitude will become commonplace (Hoegh-Guldberg et al., 2007). A decline in coral
reefs would have a cascading effect on a diversity of marine organisms who rely on on
the reefs for food, shelter, and protection.
1.3 Ocean Acidification
About one fourth of the carbon dioxide emitted from all anthropogenic sources
currently enters the ocean, where it reacts with the water and produces carbonic acid
(Hoegh-Guldberg et al. 2007). When carbonic acid dissociates, its byproducts are a
bicarbonate ion (HCO3-) and a hydrogen ion (H+), and this increase in hydrogen ion
concentration lowers pH and increases ocean acidity (Hoegh-Guldberg et al. 2007).
Calcification of coral skeletons are dependent on the passage of hydrogen ions between
the water column and the coral tissue (Jokiel, 2013). The proton flux hypothesis states
that an increase of hydrogen ions in the water column weakens the gradient, leaving
corals unable to expel hydrogen ions, which hinders calcification (Jokiel, 2013). If ocean
acidification continues to add hydrogen ions, construction rates could fall below natural
destruction rates, causing a loss of reefs.
1.4 Individual and Combined Effects

3
Global warming and ocean acidification will compromise carbonate accretion,
reducing the number of corals in our reef systems and pushing them towards risk of
extinction. The loss of these important coastal ecosystems will diminish resources for
many around the world. There have been numerous studies on the individual effects of
ocean warming and acidification on coral response, but less research has been conducted
on the combined effects of the two (Pandolfi et al., 2011). Ocean warming and
acidification are happening simultaneously, and so it would be of great significance to
understand whether or not the two together produce a synergistic effect.
The Hawaiʻi Institute of Marine Biology at Moku o Loʻe (Coconut Island) in
Kāneʻohe, Oʻahu received funding from the National Science Foundation for a long term
mesocosm study to examine the effects of elevated temperature and carbon dioxide
partial pressure (pCO2) on corals. There have been other similar studies but this will be
the first to examine these effects in replicated mesocosms over a multiannual timeframe,
whereas short term studies might not account for effects that can only be detected over a
longer term. The mesocosm study includes eight of the most dominant coral species
across the Hawaiian archipelago, that together constitute more than ninety-seven percent
of the coral cover on Hawaiian reefs, one of which is Pocillopora damicornis (Jokiel et
al., 2004).
The life history strategy of P. damicornis differs from that of the other seven
species in that this species grows fast, matures early, and broods larvae that once released
are ready to settle within a couple of days (Harii et al., 2002). P. damicornis colonies in
Hawai‘i release planulae monthly throughout the year that can stay competent for over a
hundred days after their release, and are ready to settle within much shorter periods as
4
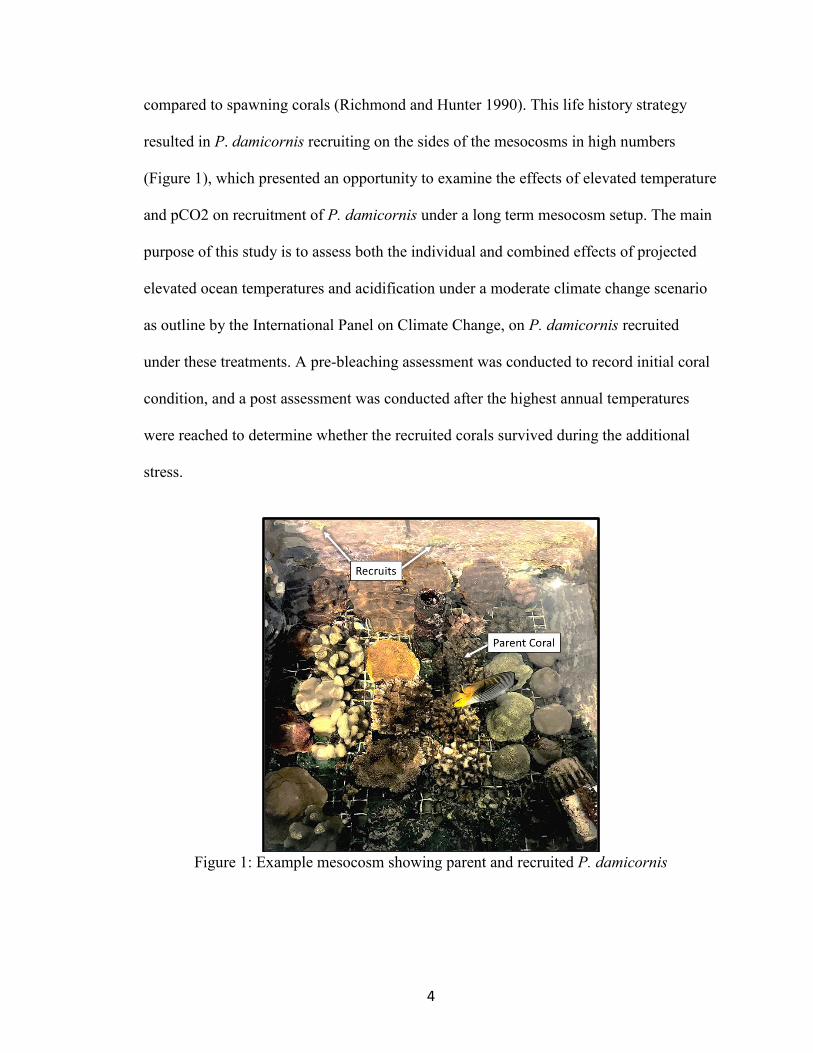
compared to spawning corals (Richmond and Hunter 1990). This life history strategy
resulted in P. damicornis recruiting on the sides of the mesocosms in high numbers
(Figure 1), which presented an opportunity to examine the effects of elevated temperature
and pCO2 on recruitment of P. damicornis under a long term mesocosm setup. The main
purpose of this study is to assess both the individual and combined effects of projected
elevated ocean temperatures and acidification under a moderate climate change scenario
as outline by the International Panel on Climate Change, on P. damicornis recruited
under these treatments. A pre-bleaching assessment was conducted to record initial coral
condition, and a post assessment was conducted after the highest annual temperatures
were reached to determine whether the recruited corals survived during the additional
stress.
Figure 1: Example mesocosm showing parent and recruited P. damicornis
5
2.0 METHODS
2.1 Experimental Design and Setup
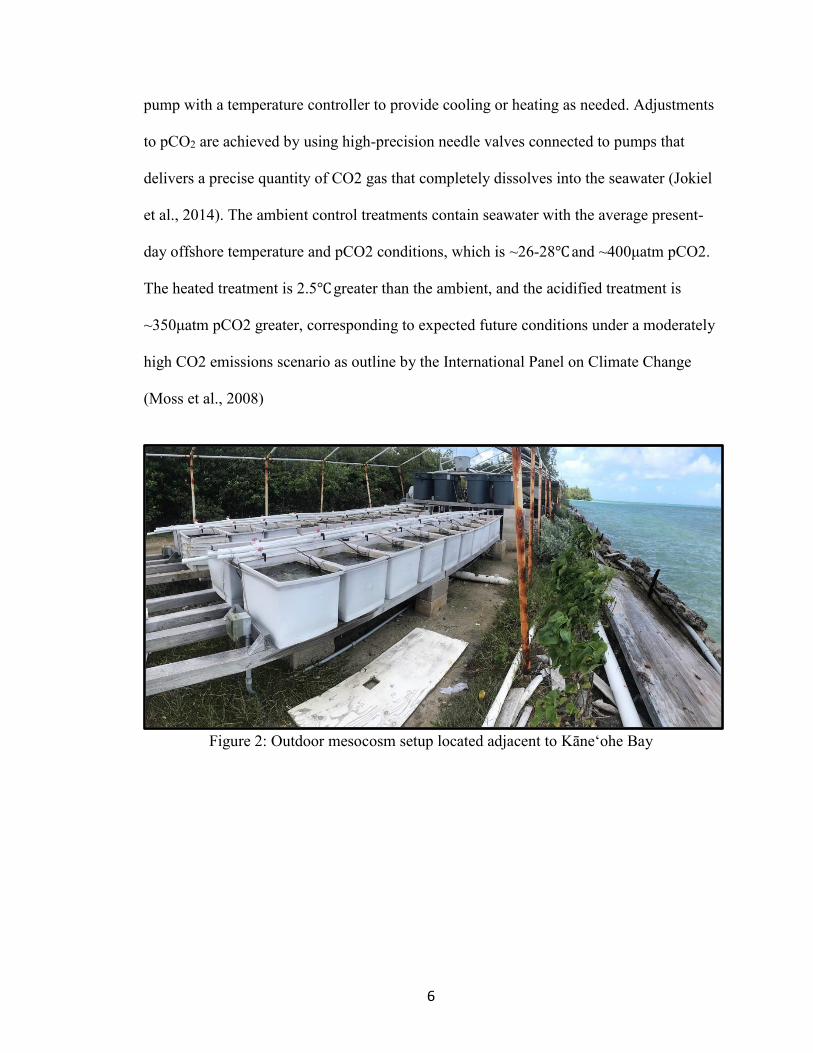
The full mesocosm outdoor system is a fully factorial design containing forty
tanks and is located outdoors so that it is exposed to natural, seasonal changes in
irradiance (Figure 2). Unfiltered seawater is pumped directly from the adjacent coral reef
of Kāneʻohe Bay in order to mimic the natural environment as closely as possible, but
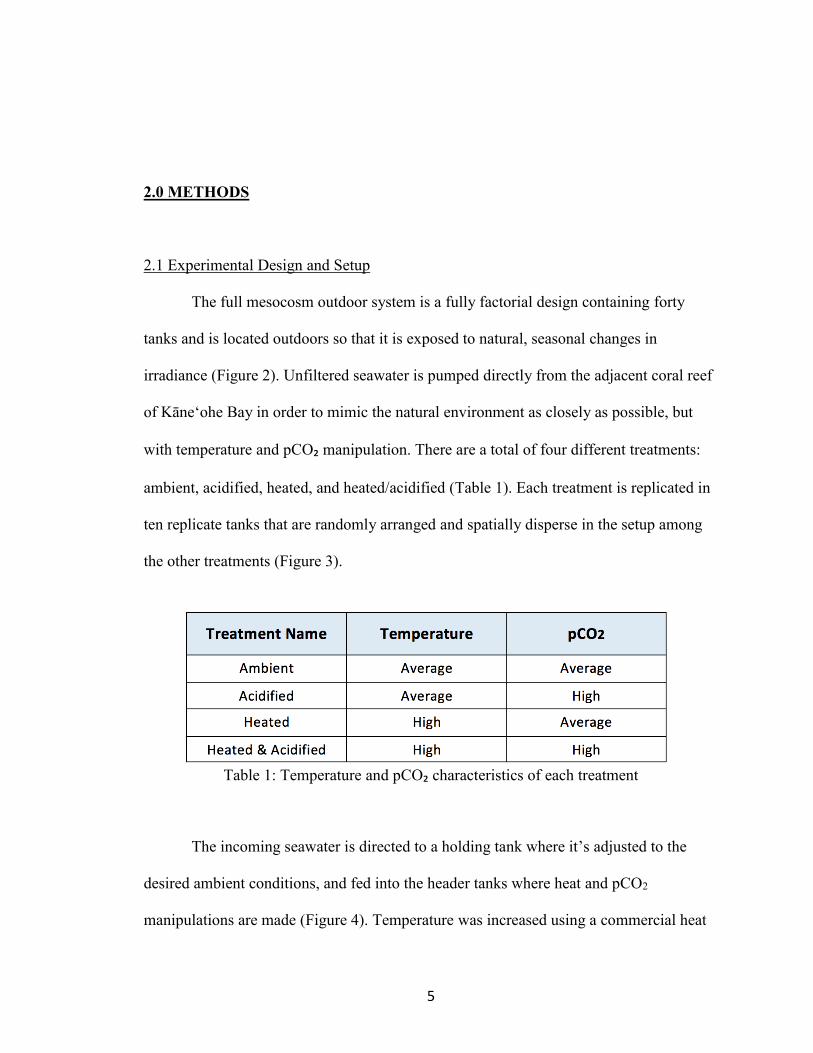
with temperature and pCO₂ manipulation. There are a total of four different treatments:
ambient, acidified, heated, and heated/acidified (Table 1). Each treatment is replicated in
ten replicate tanks that are randomly arranged and spatially disperse in the setup among
the other treatments (Figure 3).
Table 1: Temperature and pCO₂ characteristics of each treatment
The incoming seawater is directed to a holding tank where it’s adjusted to the
desired ambient conditions, and fed into the header tanks where heat and pCO2
manipulations are made (Figure 4). Temperature was increased using a commercial heat
6
pump with a temperature controller to provide cooling or heating as needed. Adjustments
to pCO2 are achieved by using high-precision needle valves connected to pumps that
delivers a precise quantity of CO2 gas that completely dissolves into the seawater (Jokiel
et al., 2014). The ambient control treatments contain seawater with the average present-
day offshore temperature and pCO2 conditions, which is ~26-28℃ and ~400μatm pCO2.
The heated treatment is 2.5℃ greater than the ambient, and the acidified treatment is
~350μatm pCO2 greater, corresponding to expected future conditions under a moderately
high CO2 emissions scenario as outline by the International Panel on Climate Change
(Moss et al., 2008)
Figure 2: Outdoor mesocosm setup located adjacent to Kāneʻohe Bay

7
Figure 3: Schematic map of the treatments pertaining to each tank
Figure 4: Close up of Feeder Tank and Header Tanks
2.2 Temperature and pCO2 Measurements
Temperature loggers are deployed in each mesocosm for monitoring and are
regularly calibrated using a certified thermometer. To track the carbonate chemistry over

8
time, water samples from each mesocosm were taken weekly to test for total alkalinity,
pH, and salinity. Additionally, monthly water samples from each mesocosm occurred
every four hours over a twenty-four hour period to track the carbonate chemistry over the
diel cycle. Total alkalinity was determined by running potentiometric titrations with a
877 Titrino Plus, with the accuracy and precision of the values verified using a certified
reference material (Dickson et al., 2003). Salinity was measured using a YSI Pro Plus
multimeter instrument, and pH was determined with the use of a spectrophotometer.
2.3 Measurement of Coral Color, Size, and Abundance
Measurements of coral size, pigmentation, and total number of coral recruits were
recorded for each of the forty mesocosms in both of assessments. Size was measured in
centimeters with the use of a caliper. Abundance was determined at the end of each
assessment by totaling the number of individual corals found in each mesocosm.
Pigmentation was denoted as normal, pale, bleached, dead, or a combination of more than
one expressed as a percentage. Prior to measuring, training was received from Dr. Keisha
Bahr on use of the Coral Health Chart (Figure 5) and on how to differentiate certain
characteristics that indicate bleaching and mortality. The Coral Health Chart was
developed by the University of Queensland in Australia as a part of a citizen science
project CoralWatch, to provide a simple and standardized tool that can be used by anyone
to quantify coral health. Color was determined solely based on observation thus it is
difficult to be precise. However, the colors on the card are calibrated with coral condition
(chlorophyll levels etc.) to provide a semi-quantified methodology. Observer error was
9
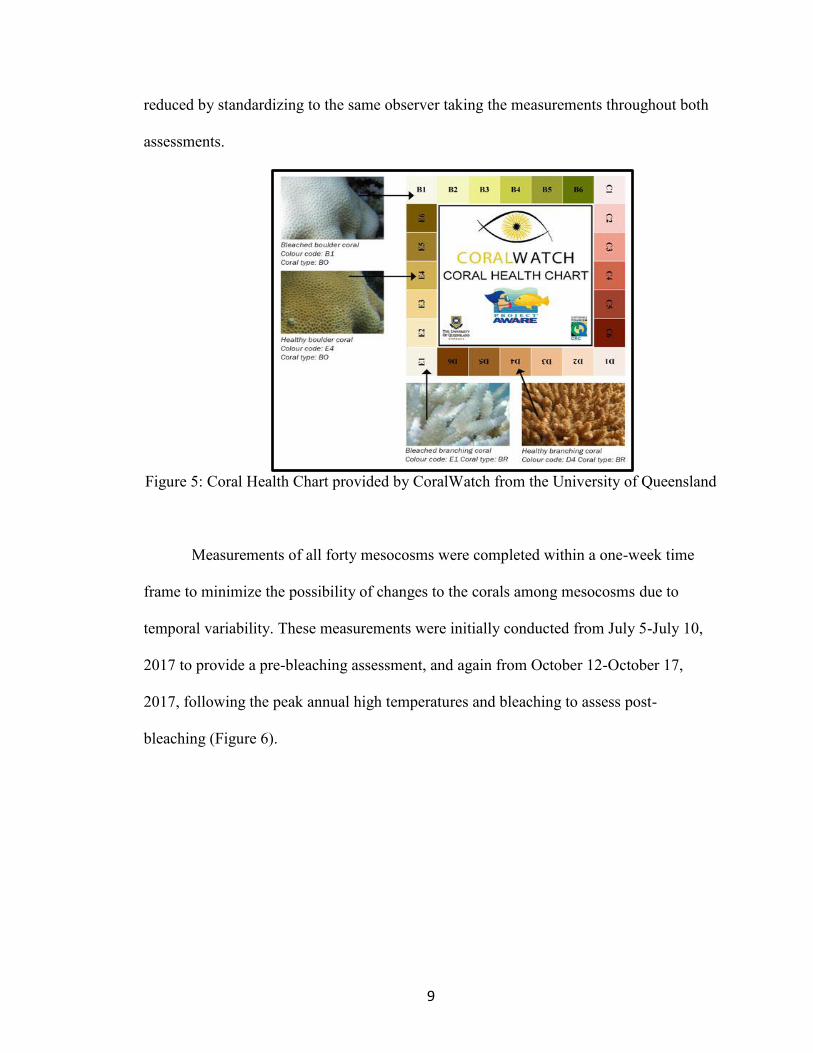
reduced by standardizing to the same observer taking the measurements throughout both
assessments.
Figure 5: Coral Health Chart provided by CoralWatch from the University of Queensland
Measurements of all forty mesocosms were completed within a one-week time
frame to minimize the possibility of changes to the corals among mesocosms due to
temporal variability. These measurements were initially conducted from July 5-July 10,
2017 to provide a pre-bleaching assessment, and again from October 12-October 17,
2017, following the peak annual high temperatures and bleaching to assess post-
bleaching (Figure 6).

10
Figure 6: Time series of average in-situ treatment temperatures, (highlighted
intervals=when the assessments occurred)
2.4 Statistical Analysis
The objective was to assess how the measurements differed across treatments as
well as within treatments, by statistically analyzing the means. All of the statistical
analysis was done using JMP software, with the use of a Kruskal-Wallis test to compare
differences across treatments, and a matched pair t-test to compare differences within
treatments. The Kruskal-Wallis is a test by ranks and is a non-parametric method for
testing whether samples originate from the same distribution. The Matched Pairs analysis
compares the means between two or more correlated variables and assesses the
differences. It standardizes to the initial subject to compare the same subject through
time, while the paired t-test statistical method takes the correlated responses between the
two time frames into account.

11
Running the data through these tests returns a p-value, which is a number between
zero and one, that is used to weigh the strength of what the data is telling you about the
population. A small p-value (typically ≤ 0.05) provides strong evidence that the
difference is significant and not due to chance, while a p-value greater than 0.05 indicates
the difference is not statistically significant. The degrees of freedom which is
automatically taken into account, is related to the number of observations and is defined
as the number of values that are free to vary in each data set. The DF and p-value are
inextricably linked, so it is important to note the DF for each test run since the sample
sizes for each treatment varied with some treatments having more observation points than
others. The DF values are taken into account during analysis to determine whether a
given test statistic is significant or not, and the higher the degrees of freedom, the lower
the threshold for a significant result.
3.0 RESULTS
3.1 Pre and Post Assessment Measurements
Figures 7 shows the temperatures for each tank during noon sampling for the
week that the assessments in July and October were conducted.

12
Figure 7: Temperatures by tank for July and October assessments
The pattern within treatments were identical for July and October with acidified
having the most tanks with recruits with nine out of ten, followed by ambient with eight,
then heated, and heated/acidified which each had six (Figure 8).
Figure 8: Total number of tanks with recruits by treatment for July and October
(n=10 tanks per treatment)

13
Figure 9: Mean number of recruits by treatment for July and October
Figure 10: Mean size of recruits by treatment for July and October
14
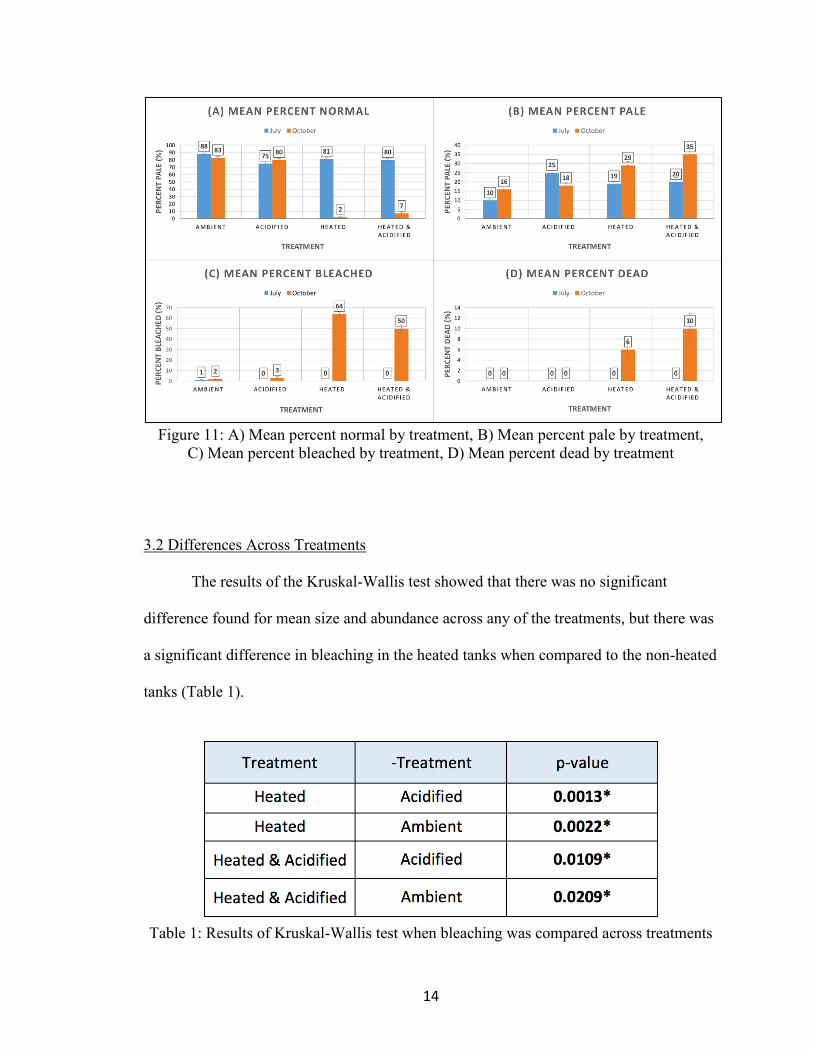
Figure 11: A) Mean percent normal by treatment, B) Mean percent pale by treatment,
C) Mean percent bleached by treatment, D) Mean percent dead by treatment
3.2 Differences Across Treatments
The results of the Kruskal-Wallis test showed that there was no significant
difference found for mean size and abundance across any of the treatments, but there was
a significant difference in bleaching in the heated tanks when compared to the non-heated
tanks (Table 1).
Table 1: Results of Kruskal-Wallis test when bleaching was compared across treatments
15
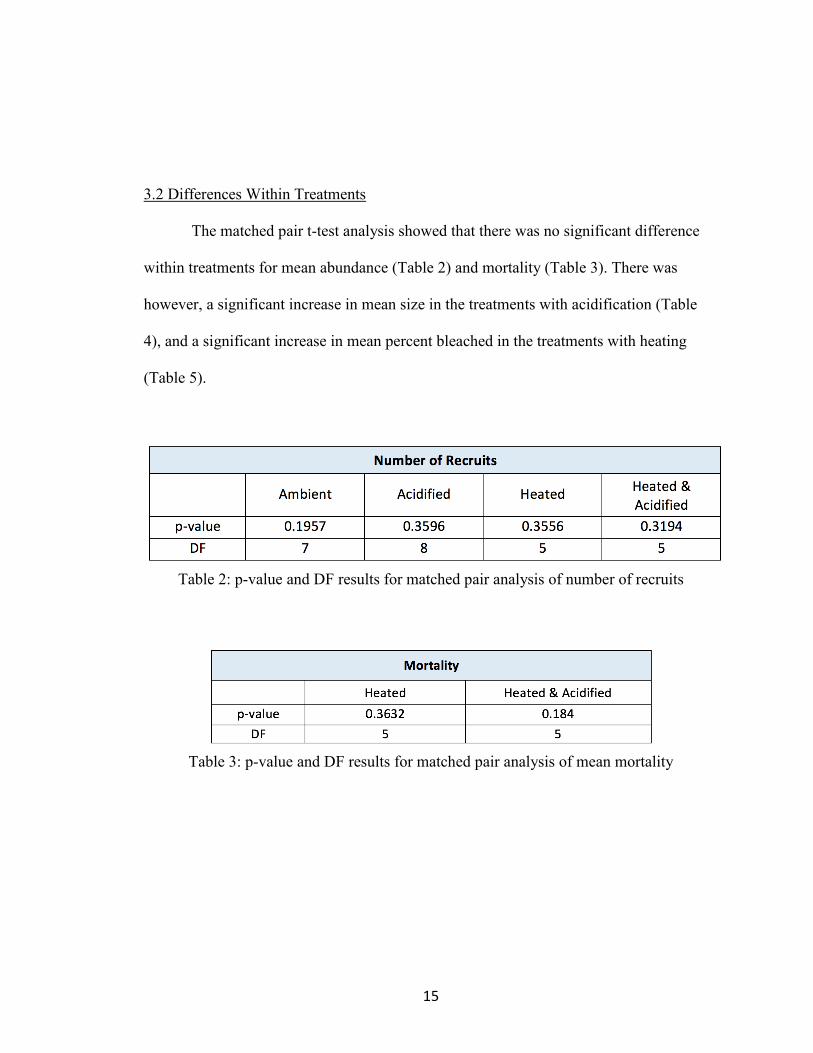
3.2 Differences Within Treatments
The matched pair t-test analysis showed that there was no significant difference
within treatments for mean abundance (Table 2) and mortality (Table 3). There was
however, a significant increase in mean size in the treatments with acidification (Table
4), and a significant increase in mean percent bleached in the treatments with heating
(Table 5).
Table 2: p-value and DF results for matched pair analysis of number of recruits
Table 3: p-value and DF results for matched pair analysis of mean mortality
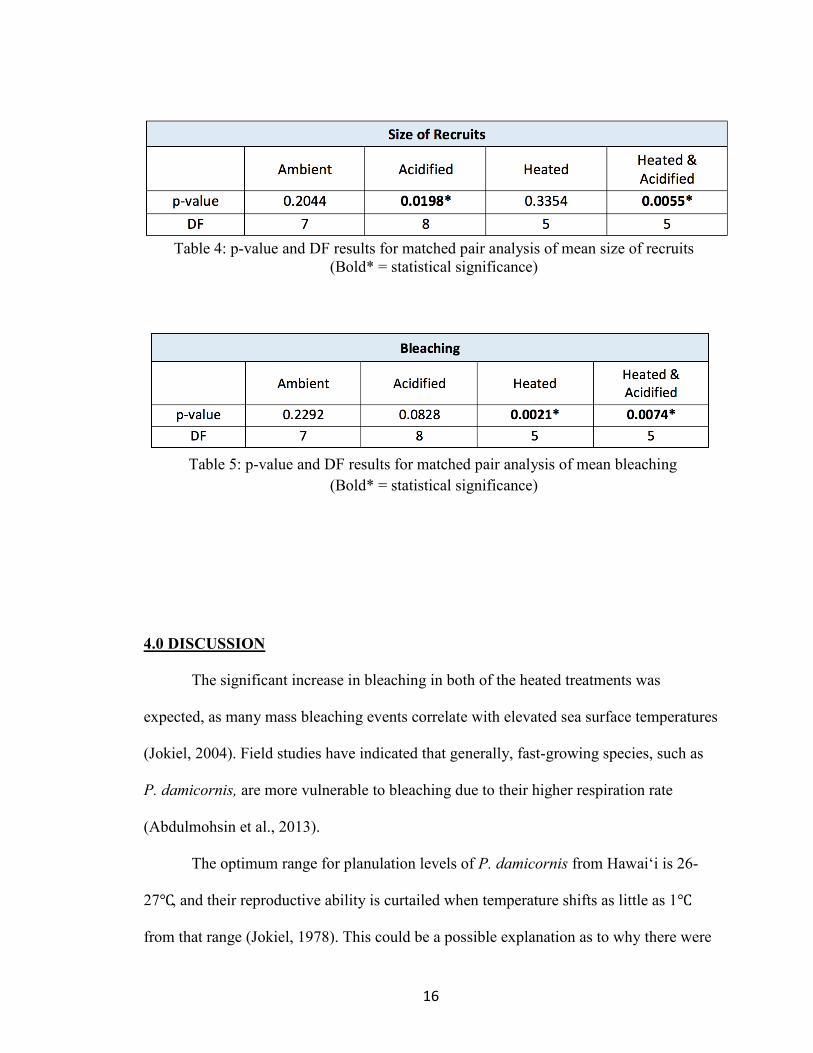
16
Table 4: p-value and DF results for matched pair analysis of mean size of recruits
(Bold* = statistical significance)
Table 5: p-value and DF results for matched pair analysis of mean bleaching
(Bold* = statistical significance)
4.0 DISCUSSION
The significant increase in bleaching in both of the heated treatments was
expected, as many mass bleaching events correlate with elevated sea surface temperatures
(Jokiel, 2004). Field studies have indicated that generally, fast-growing species, such as
P. damicornis, are more vulnerable to bleaching due to their higher respiration rate
(Abdulmohsin et al., 2013).
The optimum range for planulation levels of P. damicornis from Hawaiʻi is 26-
27℃, and their reproductive ability is curtailed when temperature shifts as little as 1℃
from that range (Jokiel, 1978). This could be a possible explanation as to why there were

17
more tanks with recruits in the ambient and acidified treatments, which both maintained
temperatures within the optimum range during the July assessment (Figure 7), while the
other two heated treatments were at temperatures greater than optimal.
Pocillopora damicornis in Hawaiʻi are able to produce planulae year round, but
studies show that the majority of recruitment is restricted to the summer months, which
coincides with when water temperatures start to exceed 26℃, the lower value of their
optimal range (Jokiel, 1978). With a 1℃ temperature change from the optimum, the
successful reproduction of P. damicornis diminishes by up to one order of magnitude
(Jokiel, 1978). On the basis of this, we would expect to have seen a difference in
abundance across treatments, with the non-heated tanks having a greater abundance than
the heated tanks. Instead, we saw no significance difference and this can be attributed to
the wide variation in mean abundance among mesocosms of the same treatment, which
meant that any differences in mean abundance could not be attributed to treatment.
We also expected to see a difference in mean size across treatments based on the
proton flux hypothesis, since treatments with acidification should have a greater
hydrogen ion concentration than that of treatments without acidification, hindering the
calcification of recruits in acidified treatment tanks. However, the results showed quite
the opposite pattern, with there being a significant increase in mean size only in the
treatments with acidification. The most direct response of corals to reduced calcification
is a decreased linear extension rate and skeletal density, but they may also exhibit
alternate responses such as reducing skeletal density to maintain their growth rate, or
investing greater energy in calcification to maintain both skeletal growth and density
(Hoegh-Guldberg et al., 2007). Although these strategies could help maintain growth
18
rate, it would also be diverting resources from other essential processes such as
reproduction. If the P. damicornis of this study are using one of these alternate strategies,
it would not only explain the large mean size and increase in growth despite stress, but
also account for why the two treatments with acidification both had a low number of
recruits. This mechanism can not be confirmed by the results of this experiment, as
measurement of size was only taken linearly, and skeletal density was not assessed.
Another possible explanation for the increase in mean size of treatments with
acidification is that there is variability in sensitivity among corals, with some corals
possessing the ability to maintain calcification rates under acidified conditions (Bahr et
al., 2016). In a few cases of recent studies, calcification was seen to increase under
moderately elevated pCO2, and in studies that were conducted over weeks or months as
opposed to under a day, sensitivity of calcification to acidification appeared to be reduced
(Pandolfi et al., 2011). This same pattern could be what we’re seeing in this experiment,
as the acidified treatments were modeled to represent moderately elevated pCO2, and the
experiment was multi-annual.
It is interesting because this means that the recruits in the heated/acidified
treatment, were shown to have a significant increase in mean size, but were also shown to
have a significantly increase in mean bleaching. It seems as though the recruits in this
treatment were able to still grow, despite them also bleaching. A recent study that tested
the interactive effects of increased seawater temperature and pCO2 saw that temperature
may be able to mitigate the adverse effects of acidification on calcification of juvenile P.
damicornis, but at the substantial cost of asexual budding (Jiang et al., 2017). Since there
was no significant difference in the other measurements besides bleaching across
19
treatments, no other conclusions can be drawn as to how the effects differ when the
stressors are combined as compared to when they are alone.
5.0 CONCLUSION
Some of the differences that we expected to see across treatments proved to not be
significant as there was a lot of variation in the mean size and abundance of recruits
amongst mesocosms of the same treatment. The results showed a significant increase in
bleaching in both heated treatments which was expected, and a significant increase in
mean size in both acidified treatments which was not expected and might suggest an
acclamatory response but this mechanism can not be confirmed by this particular
experiment. Since there was not a significant difference
At the end of the post-bleaching assessment, there was no mortality in the ambient
and acidified treatments, and there was very low mortality in the heated and
heated/acidified treatments (Figure 11D). This means that our results thus far are not
necessarily conclusive, as the fate of the recruits is still unknown. There could be delayed
effects and their condition could worsen, or now that temperatures are starting to climb
back down from the annual maximum, they could also possibly start to recover. We had
expected there to be higher mortality during the second assessment after the bleaching
event, but since there was not, another assessment necessary to follow up on the recruits
and assess their condition months after the bleaching event. The data from the third
assessment should give us a bigger overall picture of what’s happening to the recruits,
and give us a better idea of how and to what extent these treatments are affecting the
recruits.

20
LITERATURE CITED
Hoegh-Guldberg, O. (2011) Coral Reef Ecosystems and Anthropogenic Climate
Change. Regional Environmental Change, 11, 215-227.
http://dx.doi.org/10.1007/s10113-010-0189-2
Jiang, L., Zhang, F., Guo, ML. et al. Coral Reefs (2017).
https://doi.org/10.1007/s00338-017-1634-1
Kleypas, J.A., R.A. Feely, V.J. Fabry, C. Langdon, C.L. Sabine, and L.L. Robbins,
2006. Impacts of Ocean Acidification on Coral Reefs and Other Marine
Calcifiers: A Guide for Future Research, report of a workshop held 18–20 April
2005, St. Petersburg, FL, sponsored by NSF, NOAA, and the U.S. Geological
Survey, 88 pp.
Hoegh-Guldberg, O., Mumby, P. J., Hooten, A. J., Steneck, R. S., Greenfield, P.,
Gomez, E., . . . Hatziolos, M. E. (2007, December 14). Coral Reefs Under Rapid
Climate Change and Ocean Acidification. Retrieved November 07, 2017,
http://science.sciencemag.org/content/318/5857/1737
Bahr, K.D., Jokiel, P.L. & Rodgers, K.S. Coral Reefs (2016) 35: 729.
https://doi.org/10.1007/s00338-016-1405-4
Pandolfi, J & Connolly, Sean & J Marshall, Dustin & Cohen, Anne. (2011).
Projecting Coral Reef Futures Under Global Warming and Ocean Acidification.
Science (New York, N.Y.). 333. 418-22. 10.1126/science.1204794.
S., Harii, Kayanne H., Takigawa H., Hayashibara T., and Yamamoto M. "Larval
Survivorship, Competency Periods and Settlement of Two Brooding Corals,
Heliopora Coerulea and Pocillopora Damicornis." Marine Biology 141.1 (2002):
39-46. Web.
Richmond, R., & Hunter, C. (1990). Reproduction and recruitment of corals:
comparisons among the Caribbean, the Tropical Pacific, and the Red
Sea. Marine Ecology Progress Series, 60, 185-203.
Jokiel, PL, Brown, EK. 2004. Global warming, regional trends and inshore
environmental conditions influence coral bleaching in Hawaii. Global Change
Biology. 10:1627-1641.
Jokiel Paul L. , Bahr Keisha D. , Rodgers Ku'ulei S. , (2014), Low-cost, high-flow
mesocosm system for simulating ocean acidification with CO2 gas, Limnol.
Oceanogr. Methods, 12, doi:10.4319/lom.2014.12.313.

21
Jokiel, Paul & B. Guinther, Eric. (1978). Effects of Temperature on Reproduction in
the Hermatypic Coral Pocillopora Damicornis. Bulletin of Marine Science. 28.
786-789.
Moss, RH, et al. 2008. Toward new scenarios for analysis of emissions, climate
change impacts, and response strategies. IPCC Expert Meeting Report, IPCC,
Geneva.
Putnam, Hollie & Gates, Ruth. (2015). Preconditioning in the reef-building coral
Pocillopora damicornis and the potential for trans-generational acclimatization
in coral larvae under future climate change conditions. The Journal of
experimental biology. 218. doi:10.1242/jeb.123018.
Abdulmohsin A. Al-Sofyani, Yahya A.M. Floos, Effect of temperature on two reef-
building corals Pocillopora damicornis and P. verrucosa in the Red Sea, In
Oceanologia, Volume 55, Issue 4, 2013, Pages 917-935, ISSN 0078-3234,
https://doi.org/10.5697/oc.55-4.917.
(http://www.sciencedirect.com/science/article/pii/S0078323413500467)