Embed Size (px)
Citation preview

Atmos. Chem. Phys., 11, 3949–3979, 2011www.atmos-chem-phys.net/11/3949/2011/doi:10.5194/acp-11-3949-2011© Author(s) 2011. CC Attribution 3.0 License.
AtmosphericChemistry
and Physics
Analysis of reactive bromine production and ozone depletion in theArctic boundary layer using 3-D simulations with GEM-AQ:inference from synoptic-scale patterns
K. Toyota1,2, J. C. McConnell1, A. Lupu1, L. Neary1,*, C. A. McLinden2, A. Richter3, R. Kwok4, K. Semeniuk1,J. W. Kaminski1, S.-L. Gong2, J. Jarosz1, M. P. Chipperfield5, and C. E. Sioris2
1Department of Earth and Space Science and Engineering, York University, Toronto, Ontario, Canada2Air Quality Research Division, Science and Technology Branch, Environment Canada, Toronto, Ontario, Canada3Institute of Environmental Physics, University of Bremen, Bremen, Germany4Jet Propulsion Laboratory, California Institute of Technology, Pasadena, California, USA5School of Earth and Environment, University of Leeds, Leeds, UK* now at: Belgian Institute for Space Aeronomy (BIRA-IASB), Brussels, Belgium
Received: 2 October 2010 – Published in Atmos. Chem. Phys. Discuss.: 5 November 2010Revised: 26 March 2011 – Accepted: 20 April 2011 – Published: 28 April 2011
Abstract. Episodes of high bromine levels and surface ozonedepletion in the springtime Arctic are simulated by an onlineair-quality model, GEM-AQ, with gas-phase and heteroge-neous reactions of inorganic bromine species and a simplescheme of air-snowpack chemical interactions implementedfor this study. Snowpack on sea ice is assumed to be theonly source of bromine to the atmosphere and to be capableof converting relatively stable bromine species to photola-bile Br2 via air-snowpack interactions. A set of sensitivitymodel runs are performed for April 2001 at a horizontal res-olution of approximately 100 km×100 km in the Arctic, toprovide insights into the effects of temperature and the age(first-year, FY, versus multi-year, MY) of sea ice on the re-lease of reactive bromine to the atmosphere. The model sim-ulations capture much of the temporal variations in surfaceozone mixing ratios as observed at stations in the high Arcticand the synoptic-scale evolution of areas with enhanced BrOcolumn amount (“BrO clouds”) as estimated from satelliteobservations. The simulated “BrO clouds” are in modestlybetter agreement with the satellite measurements when theFY sea ice is assumed to be more efficient at releasing re-active bromine to the atmosphere than on the MY sea ice.Surface ozone data from coastal stations used in this studyare not sufficient to evaluate unambiguously the differencebetween the FY sea ice and the MY sea ice as a source of
Correspondence to:K. Toyota([email protected])
bromine. The results strongly suggest that reactive bromineis released ubiquitously from the snow on the sea ice dur-ing the Arctic spring while the timing and location of thebromine release are largely controlled by meteorological fac-tors. It appears that a rapid advection and an enhanced turbu-lent diffusion associated with strong boundary-layer windsdrive transport and dispersion of ozone to the near-surfaceair over the sea ice, increasing the oxidation rate of bromide(Br−) in the surface snow. Also, if indeed the surface snow-pack does supply most of the reactive bromine in the Arc-tic boundary layer, it appears to be capable of releasing re-active bromine at temperatures as high as−10◦C, particu-larly on the sea ice in the central and eastern Arctic Ocean.Dynamically-induced BrO column variability in the lower-most stratosphere appears to interfere with the use of satelliteBrO column measurements for interpreting BrO variabilityin the lower troposphere but probably not to the extent of to-tally obscuring “BrO clouds” that originate from the surfacesnow/ice source of bromine in the high Arctic. A budgetanalysis of the simulated air-surface exchange of brominecompounds suggests that a “bromine explosion” occurs inthe interstitial air of the snowpack and/or is accelerated byheterogeneous reactions on the surface of wind-blown snowin ambient air, both of which are not represented explicitlyin our simple model but could have been approximated by aparameter adjustment for the yield of Br2 from the trigger.
Published by Copernicus Publications on behalf of the European Geosciences Union.

3950 K. Toyota et al.: 3-D modeling of boundary-layer bromine and ozone in the Arctic
1 Introduction
During the spring after complete darkness in the winter,boundary-layer air over Arctic sea ice and its surroundingcoastal areas experiences a frequent occurrence of ozonedepletion events (ODEs) from background levels (∼30–40 nmol mol−1) to below 5–10 nmol mol−1 and sometimeseven below experimental detection limits (.1 nmol mol−1)(Oltmans, 1981; Bottenheim et al., 1986, 2002, 2009; Sol-berg et al., 1996; Hopper et al., 1998; Tarasick and Bot-tenheim, 2002). The ODEs are generally accompanied bya significant increase in gaseous and/or particulate bromineconcentrations (Barrie et al., 1988; Oltmans et al., 1989;Li et al., 1994). The detection of BrO radicals as high as30 pmol mol−1 in the near-surface air provided compellingevidence for bromine radical chemistry that depletes ozone inseveral days (Hausmann and Platt, 1994; Tuckermann et al.,1997):
Br+O3 → BrO+O2 (R1)
BrO+BrO→
{2Br+O2Br2+O2
(R2)
Br2+hν → 2Br. (R3)
The boundary-layer ODEs also take place over sea ice aroundthe Antarctica (Yurganov, 1990; Murayama et al., 1992;Wessel et al., 1998; Tarasick and Bottenheim, 2002), wherethe increase of IO radicals to about 20 pmol mol−1 along withBrO radicals indicates a synergistic effect of bromine and io-dine radical chemistry on the ozone loss (Kreher et al., 1997;Frieß et al., 2001, 2004; Saiz-Lopez et al., 2007; Schonhardtet al., 2008). In the Arctic, the impact of iodine radicalchemistry has been found to be rather limited in spatialscale and in magnitude (Tuckermann et al., 1997; Schonhardtet al., 2008; Mahajan et al., 2010). Satellite measurementshave revealed that areas with enhanced BrO column amount,called “BrO clouds”, occur extensively in the polar regionsof both hemispheres particularly during the spring (Chance,1998; Richter et al., 1998; Wagner and Platt, 1998; Wag-ner et al., 2001). This has been interpreted normally as aconsequence of reactive bromine release from a vast area ofthe polar ice/snow surface, but a recent study bySalawitchet al. (2010) pointed to convolutions from BrO variabilityabove the near-surface boundary layer, especially that asso-ciated with dynamically-induced changes in the BrO columnamount near the tropopause.
Heterogeneous chemistry plays a critical role for the for-mation of reactive bromine in the polar boundary layer. Witha realization that the snowpack retains a significant amountof bromide (Br−) originated from seawater and accessiblefrom the atmosphere especially when mediated by a windpumping (McConnell et al., 1992), the following reactionshave been proposed as key steps to a net release of bromine
from the snowpack to the atmosphere (Tang and McConnell,1996; Michalowski et al., 2000; Lehrer et al., 2004):
HOBr+Br−H+
→ Br2+H2O (R4)
BrONO2+Br− → Br2+NO−
3 (R5)
where HOBr and BrONO2 are reproduced via gas-phasechemistry in the atmosphere and presumably in the snowpackinterstitial air as well, subsequent to the photolysis of Br2(ReactionR3) and the production of BrO via Reaction (R1):
BrO+HO2 → HOBr+O2 (R6)
BrO+NO2+M → BrONO2+M. (R7)
These reactions constitute an autocatalytic cycle of releas-ing bromine from the snowpack to the atmosphere, called“bromine explosion” (Wennberg, 1999), which continues un-til the production of HOBr and/or BrONO2 diminishes afterozone is depleted and is then taken over by the deposition ofinactive bromine species perhaps in the form of gaseous HBrand particulate Br− back to the snowpack. The strong sur-face wind also generates drifting and/or blowing snow parti-cles detached from the surface snowpack and thereby facili-tates the bromine explosion via an increased exposure of thesaline snow surface to ambient air in the near-surface bound-ary layer (Jones et al., 2009).
The chemistry of Br2 release from salty snow/ice (Reac-tions R4–R5) often involves Cl−, which is more abundantthan Br− in seawater by about 650 times (as mole fraction)and also in the Arctic snowpack typically by 2 to 3 ordersof magnitude (Simpson et al., 2005; Millero et al., 2008), togive BrCl as an initial step:
HOBr+Cl−H+
→ BrCl+H2O (R8)
BrONO2+Cl− → BrCl+NO−
3 (R9)
followed by halogen inter-exchange reactions (Adams et al.,2002):
BrCl+Br− � Br2Cl− � Br2+Cl−. (R10)
A part of BrCl is released to ambient air before reactingwith Br− in the snowpack and then undergoes photolysis toproduce Cl-atoms along with Br-atoms (Michalowski et al.,2000; Foster et al., 2001; Spicer et al., 2002). The Cl-atomsaccount for a major part of the loss of hydrocarbons observedin the springtime Arctic boundary layer, but are believed toplay a marginal role in ozone loss (Jobson et al., 1994; Sol-berg et al., 1996; Ramacher et al., 1999).
One of the outstanding questions about reactive halogenchemistry in the polar boundary layer is how the releaseof halogens from the natural saline snow/ice surface is fa-cilitated at temperatures below the freezing point of wa-ter and brine. For instance, from the long-term record of
Atmos. Chem. Phys., 11, 3949–3979, 2011 www.atmos-chem-phys.net/11/3949/2011/
K. Toyota et al.: 3-D modeling of boundary-layer bromine and ozone in the Arctic 3951
ozonesonde data obtained at several Arctic stations,Tara-sick and Bottenheim(2002) found boundary-layer ODEs(defined by [O3]<10 nmol mol−1) only when local air tem-peratures dropped below−20◦C, whereasBottenheim et al.(2009), during “frozen-in” shipboard measurements in theice-covered Arctic Ocean, observed partially depleted sur-face ozone levels (ca. 10∼20 nmol mol−1) at local air tem-peratures as high as−6◦C. Sander et al.(2006) suggestedan essential role of low temperature conditions for activatingthe bromine chemistry in two ways: first, by carbonate pre-cipitation from brine to titrate its alkalinity (more than 80 %of carbonate originally contained in seawater is estimated toprecipitate when cooled down to−8◦C) so that the brine canbe acidified by a relatively small amount of acidic gas uptake,and second, by shifting the equilibrium constants of Reac-tions (R10) towards the Br2 formation. Morin et al. (2008),however, argued that the carbonate precipitation should notreduce the alkalinity of brine as proposed bySander et al.(2006) (see also a follow-up study bySander and Morin,2010). At least at temperatures above the freezing point ofwater, for the release of Br2 and/or BrCl to occur via uptakeof gaseous HOBr, aqueous salt solutions need to be acidifiedto pHs below 6.5 (Fickert et al., 1999). On the other hand,Adams et al.(2002) experimentally showed that the reactiveuptake of HOBr onto frozen NaBr/NaCl solution results inthe Br2 and/or BrCl release below−20◦C even if the sub-strate is alkaline at room temperature before frozen.
Another important question that remains to be fully an-swered is how halide anions such as Br− are supplied tothe surface snow and made accessible from the atmosphereacross the polar regions. Fresh, growing sea ice entrapsbrine, which is expelled from the ice during congelation,and the salinity of brine increases with decreasing temper-ature (Steffen and DeMaria, 1996; Light et al., 2003). Somebrine is also expelled onto the top of sea ice. Under somecircumstances, the condensation of water vapor leads to aformation of intricate crystals called “frost flowers”, whichwick up salinity from the slurry surface of the sea ice and arethen covered with drifting snow in several days (Perovich andRichter-Menge, 1994). It has been suggested that the frostflowers themselves, either bound to the sea ice or suspendedin the air after wind abrasion, provide a major source of re-active bromine to the polar boundary layer (Rankin et al.,2002; Kaleschke et al., 2004). Kaleschke et al.(2004) pro-posed an algorithm to diagnose the potential coverage of frostflowers (called “potential frost flower”, or PFF) on sea iceacross the polar regions by using satellite data of sea ice con-centrations and objective analyses of large-scale surface airtemperatures. Their algorithm predicts increased PFF valueswith decreasing surface air temperatures particularly below−20◦C for a given formation rate of open/refreezing leadsin the sea ice.Simpson et al.(2007a), however, showed thatthe PFF data obtained by theKaleschke et al.(2004) algo-rithm did not provide a good measure for locating the sourceof reactive bromine on Arctic sea ice to explain the origins of
enhanced BrO columns measured from the ground at Barrow,Alaska. The age of sea ice as to whether it is first-year (FY)or multi-year (MY) can also be retrieved remotely from satel-lite (e.g.,Kwok, 2004). According toSimpson et al.(2007a),the FY sea ice is a better indicator for locating the source re-gion of reactive bromine than the PFF, presumably becausesalinity is generally higher on the FY sea ice than on the MYsea ice.
Readers may refer to thorough reviews bySimpson et al.(2007b) andGrannas et al.(2007) on a range of issues andfindings regarding the ODEs and reactive halogen chemistryin the polar boundary layer as well as photochemistry inthe snowpack releasing a variety of compounds to the atmo-sphere. The springtime bromine chemistry is also importantfor the geochemical cycle of mercury in the polar regions(seeSteffen et al., 2008, for a review). In this study, we fo-cus on the surface source problem with regard to the occur-rence of high bromine levels and ODEs in the Arctic spring.By using a three-dimensional online air-quality model thatincorporates bromine chemistry, it is shown that the ubiqui-tous occurrence of reactive bromine release initiated mainlyon the FY sea ice accounts for surface ozone variability asobserved at Arctic coastal stations and even the evolution of“BrO clouds” as seen from satellite reasonably well, and thatthey are altogether controlled by synoptic-scale meteorolog-ical forcing. We also look at a sensitivity of the simulationresults on the choice of temperature below which reactivebromine release from the snow/ice surface is turned on in themodel, to provide some insights into chemistry occurring inthe snow across the Arctic.
2 Model description
GEM-AQ is an online air-quality model that incorpo-rates gas-phase oxidant chemistry and size-resolved multi-component aerosol modules into a Canadian weather fore-cast model, GEM (Global Environmental Multiscale model).It has been used for simulating the regional-scale transportand microphysical evolution of aerosols released from forestfires (O’Neill et al., 2006), the global distributions of HCN inthe upper troposphere (Lupu et al., 2009), and the formationand transport of ozone in the lower troposphere during thesummer 2006 heat wave in Europe (Struzewska and Kamin-ski, 2008). The model has been evaluated also from a per-spective of global tropospheric chemistry (Kaminski et al.,2008). Unless otherwise noted, the present model configura-tion is the same as described inKaminski et al.(2008).
2.1 Numerical configuration
An important feature of the host GEM model is that it allowsglobal simulations with variable resolution grids by zoominga region of interest (Cote et al., 1998). In this study, we runthe model employing a global variable grid with a reasonably
www.atmos-chem-phys.net/11/3949/2011/ Atmos. Chem. Phys., 11, 3949–3979, 2011

3952 K. Toyota et al.: 3-D modeling of boundary-layer bromine and ozone in the Arctic
Table 1. Gas-phase, heterogeneous (on aerosols), and photolysis reactions of bromine species added to GEM-AQ for this study.a,b
No. Reaction Rate constantc Reference
Gas-phase reactions
G119 Br + O3 →BrO (+O2) k = 1.7×10⁻¹¹exp(−800/T ) 1G120 BrO + BrO→ Br + Br (+O2) k = 2.7×10⁻¹² 1G121 BrO + BrO→ Br2 (+O2) k = 2.9×10⁻¹⁴exp(840/T ) 1G122 BrO + NO→ Br + NO2 k = 8.7×10⁻¹²exp(260/T ) 1G123 Br + HO2 → HBr (+O2) k = 7.7×10⁻¹²exp(−450/T ) 1
G124 Br + HCHOO2→ HBr + CO + HO2 k = 7.7×10⁻¹²exp(−580/T ) 2
G125 Br + ALD2O2→ HBr + MCO3 k = 1.8×10⁻¹¹exp(−460/T ) 2
G126 OH + HBr→ Br (+H2O) k = 5.5×10⁻¹²exp(205/T ) 1G127 BrO + NO2 + M → BrONO2 + M k0 = 4.7×10⁻³¹(T /300)−3.1
[M] 1d
k∞ = 1.8×10⁻¹¹, Fc = 0.4G128 BrO + HO2 → HOBr (+O2) k = 4.5×10⁻¹²exp(500/T ) 1
G129 BrO + MO2O2→ HCHO + 0.75 k = 5.7×10⁻¹² 3
×HOBr + 0.25×Br + 0.25×HO2
Heterogeneous reactions on aerosols
G130 HOBr→ 0.5×Br2 γ = 0.1 see Notee
G131 BrONO2 → HOBr + HNO3 γ = 0.1 see Notee
G132 HBr→ 0.5×Br2 γ = 0.1 see Notee
Photolysis reactions
P20 BrO + hν → Br + O see Notef
P21 Br2 + hν → Br + Br see Notef
P22 HOBr + hν → Br + OH see Notef
P23 BrONO2 + hν → Br + NO3 see Notef
References: 1Atkinson et al.(2007); 2 Atkinson et al.(2006); 3 IUPAC (2005).a SeeKaminski et al.(2008) for the list of other reactions included in GEM-AQ.b ALD2 = CH3CHO and higher aldehydes, assumed to react asCH3CHO; MCO3 = CH3CO3; andMO2 = CH3O2.c The unit of the rate constants for gas-phase reactions (G119–129) is cm3 molecule−1 s−1.d SeeAtkinson et al.(2007) for the formulation of the pseudo-second-order rate constant of the termolecular reaction (G127).e Heterogeneous reactions on the aerosol surface where the first-order rate constants (in s−1) are calculated by the modified Fuchs-Sutugin equation as described inGong et al.
(2003) and by using an estimated reaction probability (γ = 0.1). However, theHBr loss rate via Reaction (G132) and the sum of theHOBr loss rate via Reaction (G130) and the
BrONO2 loss rate via Reaction (G131) are diagnosed before the numerical integration of chemical tendency equations and, if the former is greater than the latter (i.e.,kG132[HBr] >
kG130[HOBr]+kG131[BrONO2]), the rate constant for Reaction (G132) is scaled down so as to equalize the two diagnosed quantities.f Absorption cross sections and quantum yields as adopted by the MESSy/JVAL submodel (Jockel et al., 2006) and based largely onDeMore et al.(1997).
high resolution over the Arctic Ocean and surrounding sub-arctic regions. It has 191×150 horizontal grid cells in to-tal, among which 90×90 grid cells around the North Polecomprise a uniform core at the 0.88◦
×0.88◦ (approximately100 km×100 km) resolution and remaining grid cells spreadoutside the core by a stretching factor of 1.04 per grid south-wards. The vertical grid consists of 28 levels and extendsfrom the ground/sea surface to 10 hPa in a hybrid p-σ coor-dinate, containing 8 layers in the lowest 2 km. The modelaccounts for large-scale advection, turbulent diffusion, con-vective transport, emissions, dry and wet deposition, chemi-cal reactions and aerosol microphysics. Each sub-process isintegrated at a time step of 1800 s.
2.2 Gas-phase and heterogeneous aerosol chemistry
GEM-AQ has incorporated a chemical mechanism for gas-phase oxidants modified from the Acid Deposition and Ox-idant Model (ADOM) mechanism (Stockwell and Lurmann,1989), which is originally designed for regional air-qualitysimulations, to permit extended applications to backgroundtropospheric chemistry (Kaminski et al., 2008). The hetero-geneous hydrolysis of N2O5 on aerosols has been also in-cluded, for which Canadian Aerosol Module, CAM (Gonget al., 2003), can provide online spatial distributions of fivecomponents of size-resolved aerosols, viz. sea salt (producedon the ice-free ocean), sulfate, black carbon, organic carbon,and dust.
Atmos. Chem. Phys., 11, 3949–3979, 2011 www.atmos-chem-phys.net/11/3949/2011/
K. Toyota et al.: 3-D modeling of boundary-layer bromine and ozone in the Arctic 3953
For this study, we add gas-phase chemistry and simplifiedheterogeneous aerosol chemistry of six inorganic brominespecies, viz. Br, BrO, Br2, HOBr, BrONO2 and HBr (Ta-ble 1). Chlorine chemistry is not included in the model. Asmentioned in the Note e of Table1, the Br2 production inReaction (G132) is assumed to be limited by the concurrentuptake of HOBr and BrONO2 onto aerosols so that the first-order rate constant of HBr loss for Reaction (G132) is ad-justed at every time step by diagnosing the availability ofHOBr and BrONO2 from the gas phase. This adjustmentprocedure, taken together with a product assignment for Re-action (G130), serves as a numerically efficient means of ap-proximating the competitive formation of Br2 and BrCl viaReaction (R10) in our simple scheme of bromine chemistrybut without chlorine chemistry.
Among the five aerosol components that can be handled byCAM, only sulfate and sea salt are switched on in our presentmodel runs for numerical efficiency and relevance to Arcticbromine chemistry (e.g.,Fan and Jacob, 1992). The sea-saltaerosols are assumed to be unimportant as a source of halo-gens (e.g.,Lehrer et al., 1997) and only to provide their sur-face for facilitating heterogeneous reactions along with thesulfate aerosols (cf.Vogt et al., 1996; Toyota et al., 2004;Yang et al., 2005). Simulated concentrations of sulfate andsea-salt aerosols are briefly evaluated against ground-levelobservations from selected Arctic sites (see Sect. S2 in theSupplement).
Zhao et al.(2008) developed another version of GEM-AQ by taking a multiphase chemistry module fromSanderet al. (2005) to simulate reactive halogen release from sea-salt aerosols generated by a wind abrasion of frost flow-ers. It should be noted that the reaction scheme for halogenchemistry and the numerical approach employed in this studyare somewhat different from those employed byZhao et al.(2008).
2.3 Emission, deposition, and air-snow/ice surfaceinteractions of reactive bromine species
We use a parameterization for the dry deposition of gaseouscompounds to quantify the sink, and the source as ex-plained below, of inorganic bromine species on various typesof surface. GEM-AQ calculates dry deposition velocitiesby a multiple-resistance approach with aerodynamic, quasi-laminar layer and bulk surface resistances acting in series(Wesely, 1989; Zhang et al., 2002). The surface resistancefor each compound is obtained by parametric functions of aneffective Henry’s law at neutral pH and an estimated oxida-tive reactivity employing a semi-empirical scaling of thesephysicochemical properties from those for SO2 and O3 (Ta-ble 2). Except on the snow/ice-covered surface, dry deposi-tion is assumed to remove HBr, HOBr, BrONO2 and Br2 ir-reversibly from the atmosphere. On the sea ice and snow/ice-covered land surfaces, the surface resistance is reduced tozero for HOBr, BrONO2 and HBr. As a result, their dry de-
Table 2. Effective Henry’s law constants (H∗) at neutral pH andoxidative reactivity parameters (f0) for calculating the dry deposi-tion velocities of inorganic bromine species except on the snow/icecovered surface.
Species H∗ [M atm−1] f0
Br2 8×10⁻¹ (seea) 1HOBr 6×10³ (seeb) 1BrONO2 2×10¹⁶ (seec) 1HBr 2×10¹⁶ (seed) 0
a Taken fromBartlett and Margerum(1999).b Taken fromFrenzel et al.(1998).c Assumed to be the same as the value forHBr.d Calculated based onBrimblecombe and Clegg(1988, 1989) andLax (1969).
position velocities are controlled mainly by the aerodynamicresistance and can be as large as about 1 cm s−1 when windybut otherwise orders of magnitude smaller in the staticallystable Arctic boundary layer. In addition to the dry depo-sition, HBr is assumed to undergo a wet deposition via im-paction scavenging in precipitation at a first-order rate con-stant (3.89×10⁻⁴ s−1 per mm h−1 of precipitation) as em-ployed in GEM-AQ for HNO3 (Langner et al., 1998).
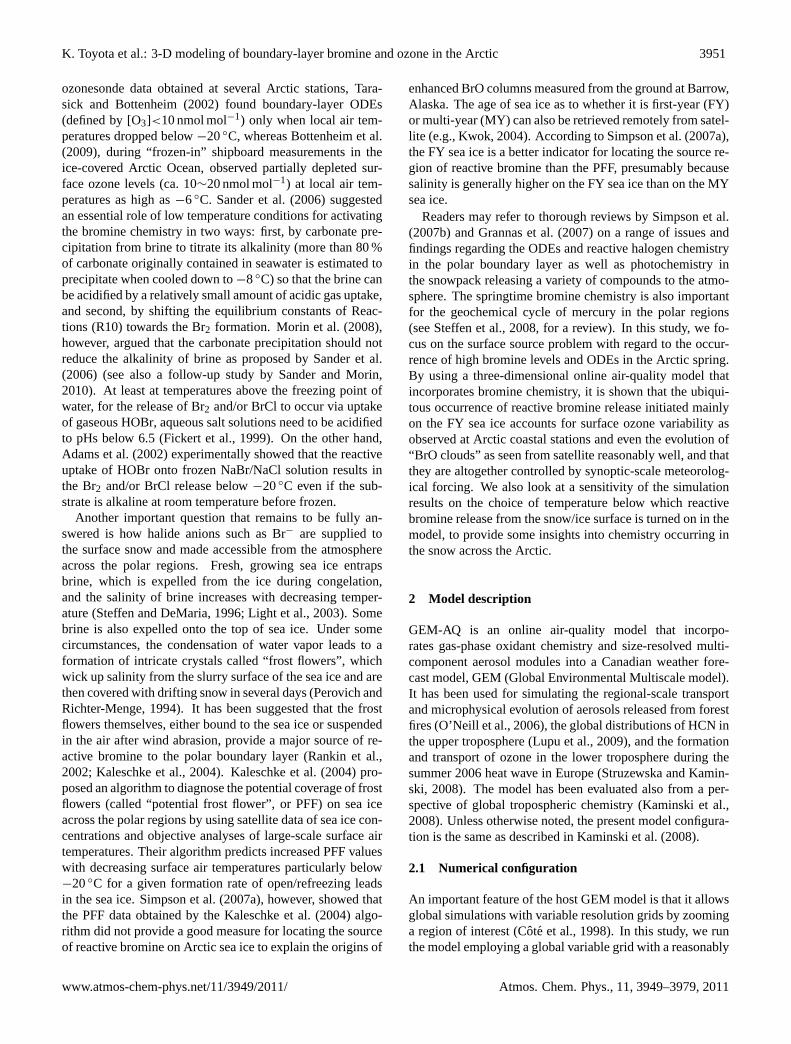
The dry deposition of Br2 is assumed not to occur on thesnow/ice covered surface; instead, Br2 is emitted to the at-mosphere at a rate prescribed from the dry deposition fluxesof HOBr, BrONO2, HBr and O3 (Fig. 1). This approach issimilar to the one employed byLehrer et al.(2004) in theirone-dimensional model study. The capacity of the Br2 emis-sion is assumed to vary between the FY and MY sea-ice sur-faces and the snow-covered land surface as described below.At first, following theSimpson et al.(2007a) study, we as-sume that the FY sea ice is more efficient at releasing reac-tive bromine from its overlying snowpack than the MY seaice. To evaluate this assumption, however, we conduct an-other set of model runs in which the reactive bromine releaseon the MY sea ice is assumed to be as efficient as on the FYsea ice.
The snowpack on the FY sea ice is assumed to retain aninexhaustible storage of Br− so that the total dry depositionflux of HOBr and BrONO2 is fully converted to the flux ofBr2 back to the atmosphere regardless of concurrent HBr de-position. Thus, as long as chemistry in the near-surface airfavors the photochemical formation of HOBr and BrONO2over that of HBr, the atmospheric loading of bromine in-creases autocatalytically via the “bromine explosion”.
On the MY sea ice, the supply of Br− is assumed to be lim-ited by the dry deposition of HBr from the atmosphere, ow-ing to a substantial salinity decrease during summer melt(s)in previous year(s) (Eicken et al., 2002). Also, the forma-tion of open and refreezing leads as a fresh source of seasalt and/or brine is less likely to occur than in the FY seaice that is more vulnerable to a tensile force arising from
www.atmos-chem-phys.net/11/3949/2011/ Atmos. Chem. Phys., 11, 3949–3979, 2011

3954 K. Toyota et al.: 3-D modeling of boundary-layer bromine and ozone in the Arctic
O3
dry depositionVd~0.01 cm/s
Br2
Ice/snow
Atmosphere
“trigger” on FY
HOBr
BrONO2
HBr
FY: Infinite source of Brassumed for Br2 production
Br BrO
dry deposition (no surface resistance)Vd can be ~1 cm/s when windy
“explosion” on FY
(FY)(MY)(LS)
recyclingon aerosols
gas-phasephotochemistry
MY: Available Brlimited by HBr deposition and no storage,but infinite Cl- source assumed for BrCl (= 0.5*Br2) production
LS: Same as MY but with no Cl- source
(“dark” FY)(“sunlit” FY)(MY & LS)
“recycling” on MY & LS
Fig. 1. A schematic of the basic scenario for bromine chemistryin the atmosphere and air-ice/snow interactions of reactive brominespecies in the present simulations. FY, MY and LS denote the snow-pack on the FY sea ice, the MY sea ice and the land surface, respec-tively. Presented values for the molar yields (81 and82) of Br2from the dry deposition of O3, HOBr and BrONO2 are valid forthe model runs 3–5, whereas the values are somewhat different forother model runs (see Table3).
surface wind drag and so forth (Richter-Menge and Jones,1993; Sammonds et al., 1998; Kwok, 2006). The total drydeposition flux of HOBr and BrONO2, if it is not more thanthe concurrent deposition flux of HBr, is fully converted tothe Br2 emission flux. However, if the deposition flux ofHOBr and BrONO2 exceeds that of HBr, the excess deposi-tion of HOBr and BrONO2 is converted to Br2 at the 50 %molar yield assuming that BrCl is released instead of Br2 tothe atmosphere by consuming virtually inexhaustible Cl− inthe snowpack (e.g.,Simpson et al., 2005). This formulationallows for the recycling of up to 100 % of the atmosphericbromine reservoirs entering the snow/ice surface back intothe atmosphere instantaneously as Br2. But, in reality, theprocess would be more complex in that an unused portion ofBr− deposited on the snow would likely have a finite resi-dence time and be emitted later as Br2. This is not pursued inthe present study. We will show, however, that the scenariodescribed above tends to work somewhat better in simulatingthe “BrO clouds” across the Arctic than assuming the sameefficiency for the release of Br2 from both the FY and MYsea ice sustained equally by an inexhaustible storage of Br−
in the snowpack (Runs 3–5 versus Runs 6–8, see Table3).
The snow-covered land surface is also assumed to emitBr2 back into the atmosphere but with less efficiency thanthe snowpack on the MY sea ice. In addition, the terrestrialsnowpack is assumed to store no Cl− and Br− so that the Br2emission flux is determined by taking a smaller flux from ei-ther the dry deposition of HBr or the total dry deposition ofHOBr and BrONO2. Consequently, the recycled fraction of
bromine can vary from∼0 % to 100 %. As before for theMY sea ice, this overly simplified assumption ignores theobserved presence of Cl− and Br− in the terrestrial snow-pack as well as the measurements of BrCl in ambient surfaceair near the Arctic Ocean (e.g.,Foster et al., 2001; Simp-son et al., 2005). At a horizontal scale of our model grid(≈100 km×100 km), however, it is not very unreasonable toassume the absence of Cl− for halogen re-activation in thesnowpack over land, since more than two orders of magni-tude decrease in the snowpack Cl− concentration has beenobserved within 150 km from the coastline in Alaska (Dou-glas and Sturm, 2004). Also, the snowpack measurementsof Br− by Simpson et al.(2005) imply that the air-snow ex-change of bromine diminishes towards inland by an order ofmagnitude or more within a few hundreds kilometers fromthe coast of the Arctic Ocean. At the timescale of our inter-est (perhaps longer than 2–3 days) for bromine release fromthe snow and subsequent ODEs, a boundary-layer air masswould travel farther than that distance in many cases (e.g.,Bottenheim and Chan, 2006).
Bromine explosion and recycling processes cannot be ini-tiated without a trigger. For this, more than a few mech-anisms have been proposed, including the photolysis ofCHBr3 of biogenic origin (Tang and McConnell, 1996), thereactive uptake of ozone onto the Br−-containing ice surfaceto release Br2 (Oum et al., 1998) and the oxidation of Br− byaqueous-phase OH radicals and other radical chain reactionproducts in the brine (Mozurkewich, 1995). Since there aretoo many unknowns to simulate these processes across theArctic in a three-dimensional model, we choose to parame-terize the trigger simply by associating the loss of ozone viadry deposition to the snow/ice surface with the Br2 emissionback into the atmosphere. In this study, the surface resistanceof ozone to the snow/ice surface is increased to 104 s m−1
(Helmig et al., 2007b) and thus its dry deposition velocity onthe snowpack remains close to 0.01 cm s−1 under a variety ofatmospheric conditions. In Runs 2–5 the trigger is placed onthe FY sea ice only, whereas in Runs 6–8 the trigger is placedon the MY sea ice as well (Table3). The trigger strength isassumed to be enhanced under sunlight. This is representedby changing the molar yield (81) of Br2 against the ozoneloss via dry deposition with the solar zenith angle (SZA).
One of the simulation scenarios assumes that the dry de-position flux of ozone is converted to the Br2 emission fluxat 81 = 10−3 regardless of SZA on the FY sea ice (Run 2,see Table3). This is to represent the Br2 formation via reac-tive uptake of ozone onto frozen seawater in the dark (Oumet al., 1998; Wren et al., 2010). Theoretically, this leads toa build up of Br2 at about 4 pmol mol−1, which is withinthe measured range in the Arctic surface air during the polarnight (Foster et al., 2001), in the 400 m deep boundary layersolely as a result of dry deposition of ozone at 40 nmol mol−1
over 5 days. It turns out, however, that81 must be muchlarger for our model to simulate ODEs realistically as ob-served at stations in the high Arctic (see Sect.3.1). We find
Atmos. Chem. Phys., 11, 3949–3979, 2011 www.atmos-chem-phys.net/11/3949/2011/
K. Toyota et al.: 3-D modeling of boundary-layer bromine and ozone in the Arctic 3955
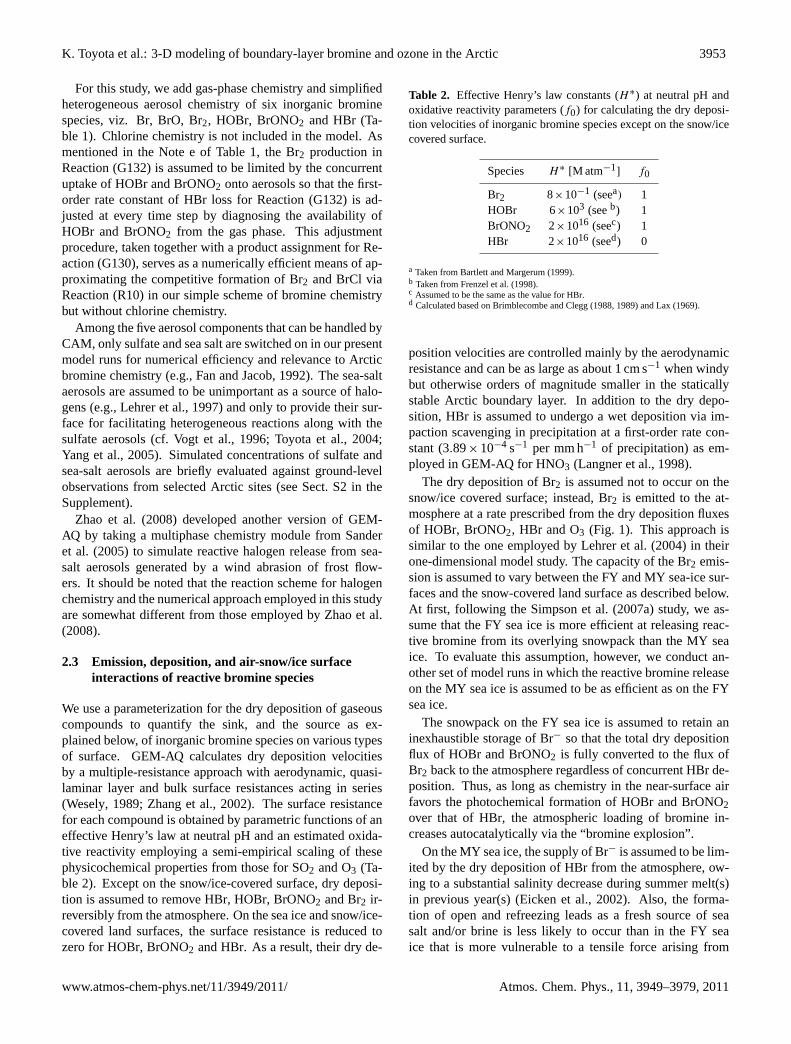
Fig. 2. (a) A circumpolar map showing the location of observation sites for surface meteorology (red stars), surface ozone and aerosolchemistry (blue dots) and ozonesonde sounding (blue open squares) used for evaluating the model simulations. ALT: the Canadian ForcesStation (CFS) and the Global Atmosphere Watch (GAW) station at Alert, Ellesmere Island, Canada (66 and 210 m a.s.l., respectively);BRW: Barrow NOAA/ESRL Observatory, Alaska, USA (8 m a.s.l.); ERK: Eureka, Ellesmere Island, Canada (10 m a.s.l.); GOL: OstrovGolomjannyj, Russia (8 m a.s.l.); HAL: Hall Land, Greenland (105 m a.s.l.); IVK: Inuvik, Canada (68 m a.s.l.); JCD: J-CAD 3 drifting buoydeployed near the North Pole; KOT: Ostrov Kotelnyj, Russia (8 m a.s.l.); NYA: NyAlesund, Svalbard, Norway (18 m a.s.l.); RST: Resolute,Cornwallis Island, Canada (67 m a.s.l.); SMT: Summit, Greenland (3238 m a.s.l.); VRA: Ostrov Vrangelja, Russia (5 m a.s.l.); and ZEP:Zeppelin, Svalbard, Norway (474 m a.s.l.). Also shown are the areas of higher than the 25 % sea-ice concentration from the CMC analyses(light purple shading) overlaid with the areas of higher than the 25 % multiyear sea-ice concentration from the QuikSCAT data (orangeshading) for 15 April 2001. Both of the sea ice data are regridded to the horizontal resolution of the model. In the cross-hatched grid cells,snowpack on the sea ice is assumed to act in the same manner as the terrestrial snowpack for the air-ice/snow interactions of bromine in themodel because the grid-mean terrain height exceeds 50 m a.s.l. (see text);(b) A regional map focusing on the area around the Alert CFS andGAW sites in Ellesmere Island, Canada and Hall Land in Greenland. For evaluating simulated ozone mixing ratios at Alert, we also use themodel output at the grid cell A′ adjacent to the nearest grid cell for the Alert CFS and GAW sites.
that boundary-layer ODEs and BrO columns can be simu-lated quite reasonably by increasing81 to 0.05∼ 0.1 undersunlight. Hence81 = 0.075 is assumed for SZA≤ 85◦ asour baseline (Runs 3–8, see Table3). We will discuss impli-cations of this fitted value later.
To map the concentrations of MY sea ice on a daily basisfor the model, we use a retrieval from the QuikSCAT satel-lite by scatterometer signals at 13.4 GHz (Ku band) (Kwok,2004). The FY sea ice concentrations are calculated by sub-tracting the MY sea ice concentrations from the total (sea,inland-water and glacier) ice concentrations available dailyas part of a global data assimilation at Canadian Meteorolog-ical Centre (CMC) (Gauthier et al., 1999) with ice fractionsfor inland-water and glacier excluded by using land-use cat-egory data (Fig.2). CMC’s sea ice analyses are largely basedon the Special Sensor Microwave/Imager (SSM/I) satellitedata (Steffen et al., 1992). If grid-mean terrain height ex-ceeds 50 m (hatched areas in Fig.2), the fractional coverageof sea ice in a grid cell is ignored and the snowpack is as-sumed to exist exclusively over land to avoid an unrealistic
upward migration of reactive bromine in the stably stratifiedatmosphere.
As mentioned in the introduction, low temperature con-ditions are believed to be associated somehow with reactivehalogen release in the polar boundary layer. In their observa-tional study,Pohler et al.(2010) concluded that snowpack inthe Amundsen Gulf (in the Canadian Arctic) released reac-tive bromine to the atmosphere when surface air temperaturewas below−15◦C and the rate of bromine release increasedlinearly with decreasing temperature down to−24◦C. Basedon this, we allow the release of Br2 from the snowpack onlywhere surface air temperature is at and below arbitrarily cho-sen “critical temperature” (Tc). We then varyTc between−10◦C and−20◦C to study a sensitivity of simulated re-sults on its choice (see Table3). The snowpack is assumednot to release Br2 but simply to act as a sink for atmosphericbromine where the surface air temperature is aboveTc. Atpresent, the retrieval of MY sea ice from the QuikSCAT be-comes unreliable at surface air temperatures above−10◦Cdue to unmodeled changes in snow and ice properties (Kwok
www.atmos-chem-phys.net/11/3949/2011/ Atmos. Chem. Phys., 11, 3949–3979, 2011
3956 K. Toyota et al.: 3-D modeling of boundary-layer bromine and ozone in the Arctic
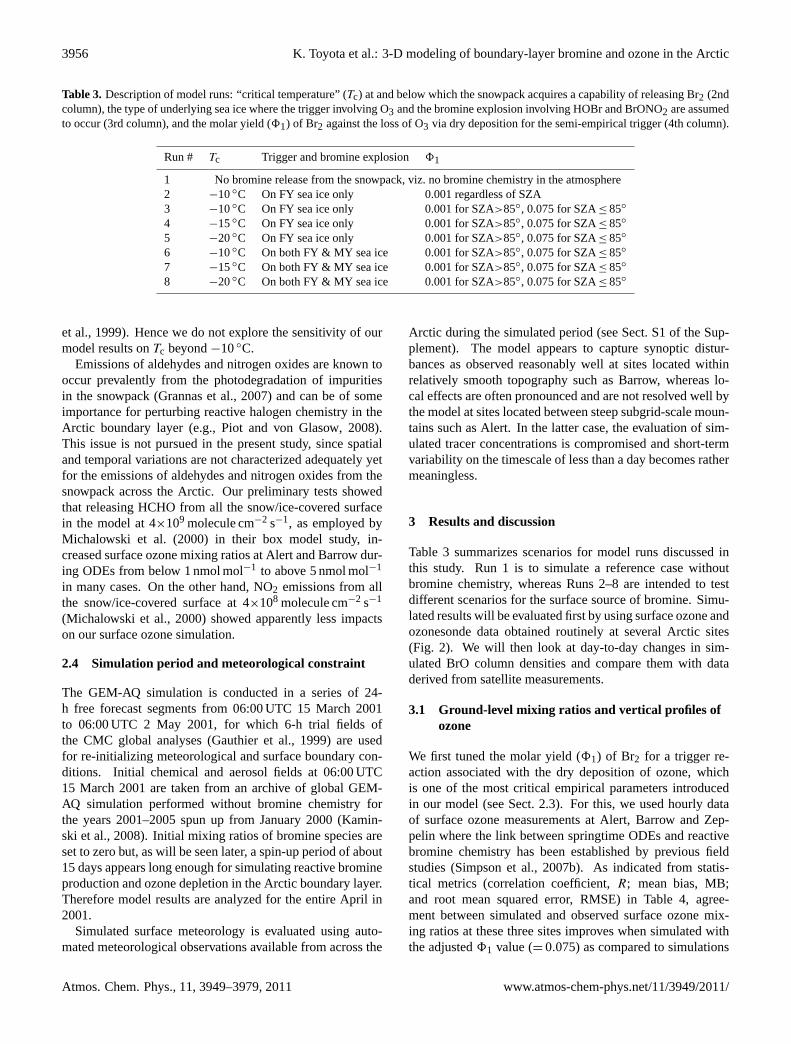
Table 3. Description of model runs: “critical temperature” (Tc) at and below which the snowpack acquires a capability of releasing Br2 (2ndcolumn), the type of underlying sea ice where the trigger involving O3 and the bromine explosion involving HOBr and BrONO2 are assumedto occur (3rd column), and the molar yield (81) of Br2 against the loss of O3 via dry deposition for the semi-empirical trigger (4th column).
Run # Tc Trigger and bromine explosion 81
1 No bromine release from the snowpack, viz. no bromine chemistry in the atmosphere2 −10◦C On FY sea ice only 0.001 regardless of SZA3 −10◦C On FY sea ice only 0.001 for SZA>85◦, 0.075 for SZA≤ 85◦
4 −15◦C On FY sea ice only 0.001 for SZA>85◦, 0.075 for SZA≤ 85◦
5 −20◦C On FY sea ice only 0.001 for SZA>85◦, 0.075 for SZA≤ 85◦
6 −10◦C On both FY & MY sea ice 0.001 for SZA>85◦, 0.075 for SZA≤ 85◦
7 −15◦C On both FY & MY sea ice 0.001 for SZA>85◦, 0.075 for SZA≤ 85◦
8 −20◦C On both FY & MY sea ice 0.001 for SZA>85◦, 0.075 for SZA≤ 85◦
et al., 1999). Hence we do not explore the sensitivity of ourmodel results onTc beyond−10◦C.
Emissions of aldehydes and nitrogen oxides are known tooccur prevalently from the photodegradation of impuritiesin the snowpack (Grannas et al., 2007) and can be of someimportance for perturbing reactive halogen chemistry in theArctic boundary layer (e.g.,Piot and von Glasow, 2008).This issue is not pursued in the present study, since spatialand temporal variations are not characterized adequately yetfor the emissions of aldehydes and nitrogen oxides from thesnowpack across the Arctic. Our preliminary tests showedthat releasing HCHO from all the snow/ice-covered surfacein the model at 4×10⁹ molecule cm−2 s−1, as employed byMichalowski et al. (2000) in their box model study, in-creased surface ozone mixing ratios at Alert and Barrow dur-ing ODEs from below 1 nmol mol−1 to above 5 nmol mol−1
in many cases. On the other hand, NO2 emissions from allthe snow/ice-covered surface at 4×10⁸ molecule cm−2 s−1
(Michalowski et al., 2000) showed apparently less impactson our surface ozone simulation.
2.4 Simulation period and meteorological constraint
The GEM-AQ simulation is conducted in a series of 24-h free forecast segments from 06:00 UTC 15 March 2001to 06:00 UTC 2 May 2001, for which 6-h trial fields ofthe CMC global analyses (Gauthier et al., 1999) are usedfor re-initializing meteorological and surface boundary con-ditions. Initial chemical and aerosol fields at 06:00 UTC15 March 2001 are taken from an archive of global GEM-AQ simulation performed without bromine chemistry forthe years 2001–2005 spun up from January 2000 (Kamin-ski et al., 2008). Initial mixing ratios of bromine species areset to zero but, as will be seen later, a spin-up period of about15 days appears long enough for simulating reactive bromineproduction and ozone depletion in the Arctic boundary layer.Therefore model results are analyzed for the entire April in2001.
Simulated surface meteorology is evaluated using auto-mated meteorological observations available from across the
Arctic during the simulated period (see Sect. S1 of the Sup-plement). The model appears to capture synoptic distur-bances as observed reasonably well at sites located withinrelatively smooth topography such as Barrow, whereas lo-cal effects are often pronounced and are not resolved well bythe model at sites located between steep subgrid-scale moun-tains such as Alert. In the latter case, the evaluation of sim-ulated tracer concentrations is compromised and short-termvariability on the timescale of less than a day becomes rathermeaningless.
3 Results and discussion
Table 3 summarizes scenarios for model runs discussed inthis study. Run 1 is to simulate a reference case withoutbromine chemistry, whereas Runs 2–8 are intended to testdifferent scenarios for the surface source of bromine. Simu-lated results will be evaluated first by using surface ozone andozonesonde data obtained routinely at several Arctic sites(Fig. 2). We will then look at day-to-day changes in sim-ulated BrO column densities and compare them with dataderived from satellite measurements.
3.1 Ground-level mixing ratios and vertical profiles ofozone
We first tuned the molar yield (81) of Br2 for a trigger re-action associated with the dry deposition of ozone, whichis one of the most critical empirical parameters introducedin our model (see Sect.2.3). For this, we used hourly dataof surface ozone measurements at Alert, Barrow and Zep-pelin where the link between springtime ODEs and reactivebromine chemistry has been established by previous fieldstudies (Simpson et al., 2007b). As indicated from statis-tical metrics (correlation coefficient,R; mean bias, MB;and root mean squared error, RMSE) in Table4, agree-ment between simulated and observed surface ozone mix-ing ratios at these three sites improves when simulated withthe adjusted81 value (= 0.075) as compared to simulations
Atmos. Chem. Phys., 11, 3949–3979, 2011 www.atmos-chem-phys.net/11/3949/2011/
K. Toyota et al.: 3-D modeling of boundary-layer bromine and ozone in the Arctic 3957
0102030405060
O3 [
nmol
/mol
]
1 2 3 4 5 6 7 8 9 10 11 12 13 14 15 16 17 18 19 20 21 22 23 24 25 26 27 28 29 30Date of April 2001
(a) Alert (Ellesmere Island, Canada): 82.50°N, 62.30°W, 210 m a.s.l.RUN 1RUN 4RUN 4 (at A’)OBS
0102030405060
O3 [
nmol
/mol
]
1 2 3 4 5 6 7 8 9 10 11 12 13 14 15 16 17 18 19 20 21 22 23 24 25 26 27 28 29 30Date of April 2001
(b) Barrow (Alaska): 71.32°N, 156.61°W, 8 m a.s.l.RUN 1RUN 4OBS
0102030405060
O3 [
nmol
/mol
]
1 2 3 4 5 6 7 8 9 10 11 12 13 14 15 16 17 18 19 20 21 22 23 24 25 26 27 28 29 30Date of April 2001
(c) Zeppelin Mountain (Svalbard, Norway): 78.90°N, 11.88°E, 474 m a.s.l.RUN 1RUN 4OBS
0102030405060
O3 [
nmol
/mol
]
1 2 3 4 5 6 7 8 9 10 11 12 13 14 15 16 17 18 19 20 21 22 23 24 25 26 27 28 29 30Date of April 2001
(d) Summit (Greenland): 72.57°N, 38.48°W, 3238 m a.s.l.RUN 1RUN 4OBS
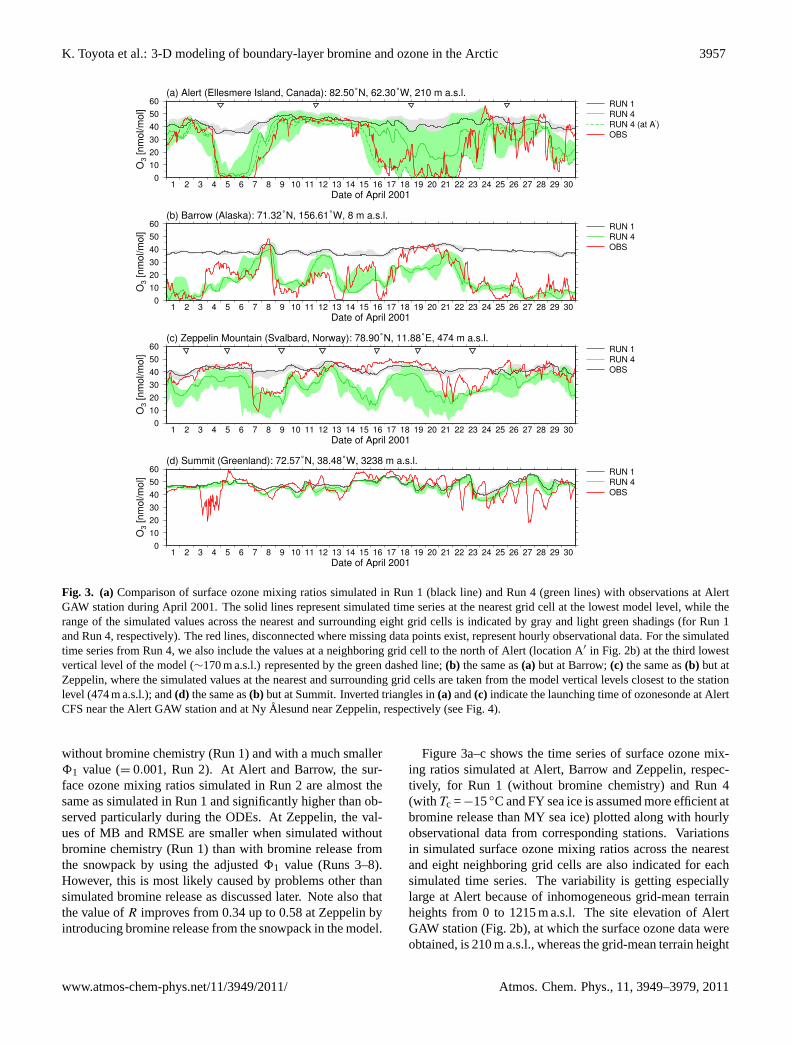
Fig. 3. (a) Comparison of surface ozone mixing ratios simulated in Run 1 (black line) and Run 4 (green lines) with observations at AlertGAW station during April 2001. The solid lines represent simulated time series at the nearest grid cell at the lowest model level, while therange of the simulated values across the nearest and surrounding eight grid cells is indicated by gray and light green shadings (for Run 1and Run 4, respectively). The red lines, disconnected where missing data points exist, represent hourly observational data. For the simulatedtime series from Run 4, we also include the values at a neighboring grid cell to the north of Alert (location A′ in Fig. 2b) at the third lowestvertical level of the model (∼170 m a.s.l.) represented by the green dashed line;(b) the same as(a) but at Barrow;(c) the same as(b) but atZeppelin, where the simulated values at the nearest and surrounding grid cells are taken from the model vertical levels closest to the stationlevel (474 m a.s.l.); and(d) the same as(b) but at Summit. Inverted triangles in(a) and(c) indicate the launching time of ozonesonde at AlertCFS near the Alert GAW station and at NyAlesund near Zeppelin, respectively (see Fig.4).
without bromine chemistry (Run 1) and with a much smaller81 value (= 0.001, Run 2). At Alert and Barrow, the sur-face ozone mixing ratios simulated in Run 2 are almost thesame as simulated in Run 1 and significantly higher than ob-served particularly during the ODEs. At Zeppelin, the val-ues of MB and RMSE are smaller when simulated withoutbromine chemistry (Run 1) than with bromine release fromthe snowpack by using the adjusted81 value (Runs 3–8).However, this is most likely caused by problems other thansimulated bromine release as discussed later. Note also thatthe value ofR improves from 0.34 up to 0.58 at Zeppelin byintroducing bromine release from the snowpack in the model.
Figure3a–c shows the time series of surface ozone mix-ing ratios simulated at Alert, Barrow and Zeppelin, respec-tively, for Run 1 (without bromine chemistry) and Run 4(with Tc =−15◦C and FY sea ice is assumed more efficient atbromine release than MY sea ice) plotted along with hourlyobservational data from corresponding stations. Variationsin simulated surface ozone mixing ratios across the nearestand eight neighboring grid cells are also indicated for eachsimulated time series. The variability is getting especiallylarge at Alert because of inhomogeneous grid-mean terrainheights from 0 to 1215 m a.s.l. The site elevation of AlertGAW station (Fig.2b), at which the surface ozone data wereobtained, is 210 m a.s.l., whereas the grid-mean terrain height
www.atmos-chem-phys.net/11/3949/2011/ Atmos. Chem. Phys., 11, 3949–3979, 2011
3958 K. Toyota et al.: 3-D modeling of boundary-layer bromine and ozone in the Arctic
0123456
Altit
ude
[km
]
0 20 40 60 80O3 [nmol/mol]
(a) Alert (Ellesmere Island, Canada)2001-04-05 00UTC
0 20 40 60 80O3 [nmol/mol]
2001-04-12 00UTC
0 20 40 60 80O3 [nmol/mol]
2001-04-19 00UTC
0 20 40 60 80O3 [nmol/mol]
2001-04-26 00UTC
0123456
Altit
ude
[km
]
0 20 40 60 80O3 [nmol/mol]
(b) Resolute (Cornwallis Island, Canada)2001-04-07 00UTC
0 20 40 60 80O3 [nmol/mol]
2001-04-21 00UTC
0 20 40 60 80O3 [nmol/mol]
2001-04-27 00UTC
0123456
Altit
ude
[km
]
0 20 40 60 80O3 [nmol/mol]
(c) Ny Ålesund (Svalbard, Norway)2001-04-02 11UTC
0 20 40 60 80O3 [nmol/mol]
2001-04-05 11UTC
0 20 40 60 80O3 [nmol/mol]
2001-04-09 11UTC
0 20 40 60 80O3 [nmol/mol]
2001-04-12 11UTC
0123456
Altit
ude
[km
]
0 20 40 60 80O3 [nmol/mol]
2001-04-16 11UTC
0 20 40 60 80O3 [nmol/mol]
2001-04-19 11UTC
0 20 40 60 80O3 [nmol/mol]
2001-04-23 11UTC
RUN 1RUN 3RUN 4RUN 5RUN 7
Ozonesonde
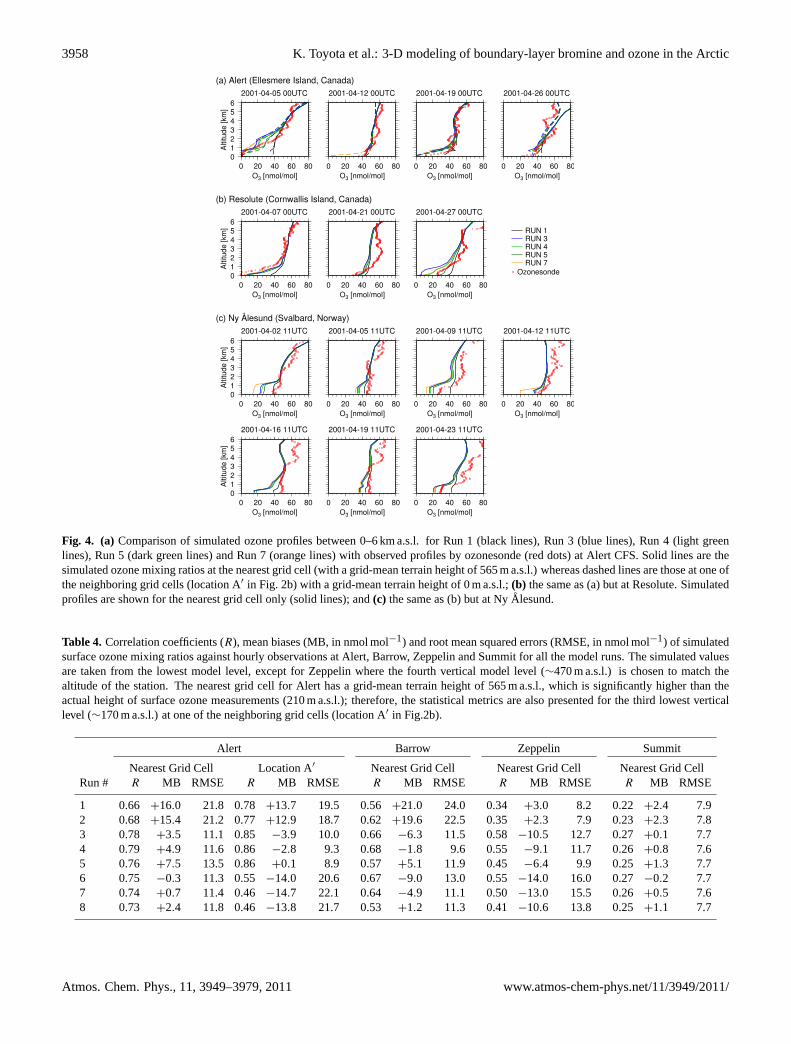
Fig. 4. (a) Comparison of simulated ozone profiles between 0–6 km a.s.l. for Run 1 (black lines), Run 3 (blue lines), Run 4 (light greenlines), Run 5 (dark green lines) and Run 7 (orange lines) with observed profiles by ozonesonde (red dots) at Alert CFS. Solid lines are thesimulated ozone mixing ratios at the nearest grid cell (with a grid-mean terrain height of 565 m a.s.l.) whereas dashed lines are those at one ofthe neighboring grid cells (location A′ in Fig. 2b) with a grid-mean terrain height of 0 m a.s.l.;(b) the same as (a) but at Resolute. Simulatedprofiles are shown for the nearest grid cell only (solid lines); and(c) the same as (b) but at NyAlesund.
Table 4. Correlation coefficients (R), mean biases (MB, in nmol mol−1) and root mean squared errors (RMSE, in nmol mol−1) of simulatedsurface ozone mixing ratios against hourly observations at Alert, Barrow, Zeppelin and Summit for all the model runs. The simulated valuesare taken from the lowest model level, except for Zeppelin where the fourth vertical model level (∼470 m a.s.l.) is chosen to match thealtitude of the station. The nearest grid cell for Alert has a grid-mean terrain height of 565 m a.s.l., which is significantly higher than theactual height of surface ozone measurements (210 m a.s.l.); therefore, the statistical metrics are also presented for the third lowest verticallevel (∼170 m a.s.l.) at one of the neighboring grid cells (location A′ in Fig.2b).
Alert Barrow Zeppelin Summit
Nearest Grid Cell Location A′ Nearest Grid Cell Nearest Grid Cell Nearest Grid CellRun # R MB RMSE R MB RMSE R MB RMSE R MB RMSE R MB RMSE
1 0.66 +16.0 21.8 0.78 +13.7 19.5 0.56 +21.0 24.0 0.34 +3.0 8.2 0.22 +2.4 7.92 0.68 +15.4 21.2 0.77 +12.9 18.7 0.62 +19.6 22.5 0.35 +2.3 7.9 0.23 +2.3 7.83 0.78 +3.5 11.1 0.85 −3.9 10.0 0.66 −6.3 11.5 0.58 −10.5 12.7 0.27 +0.1 7.74 0.79 +4.9 11.6 0.86 −2.8 9.3 0.68 −1.8 9.6 0.55 −9.1 11.7 0.26 +0.8 7.65 0.76 +7.5 13.5 0.86 +0.1 8.9 0.57 +5.1 11.9 0.45 −6.4 9.9 0.25 +1.3 7.76 0.75 −0.3 11.3 0.55 −14.0 20.6 0.67 −9.0 13.0 0.55 −14.0 16.0 0.27 −0.2 7.77 0.74 +0.7 11.4 0.46 −14.7 22.1 0.64 −4.9 11.1 0.50 −13.0 15.5 0.26 +0.5 7.68 0.73 +2.4 11.8 0.46 −13.8 21.7 0.53 +1.2 11.3 0.41 −10.6 13.8 0.25 +1.1 7.7
Atmos. Chem. Phys., 11, 3949–3979, 2011 www.atmos-chem-phys.net/11/3949/2011/

K. Toyota et al.: 3-D modeling of boundary-layer bromine and ozone in the Arctic 3959
is 565 m a.s.l. at the nearest grid cell of the model. Such adifference in height can be an important source of discrep-ancy between simulated and observed ozone mixing ratiosin the stably stratified boundary layer prevailing in the highArctic. The vertical extent of boundary-layer ODEs has beenobserved to vary between episodes from less than 100 m toas thick as 2000 m at and around Alert (Anlauf et al., 1994;Hopper et al., 1998; Bottenheim et al., 2002). Since oneof the neighboring grid cells (location A′ in Fig. 2b) doesnot contain mountains (but is located entirely on the oceancovered mostly with MY sea ice), simulated ozone mixingratios at the third lowest vertical level (∼170 m a.s.l.) fromthis neighboring grid cell are examined closely as well as atthe lowest vertical level from the nearest grid cell. For thesame reason, we look at simulated ozone mixing ratios forthe nearest grid cell at the fourth lowest vertical level whencompared with surface ozone data obtained at Zeppelin lo-cated on the crest of a mountain (474 m a.s.l.) unresolved byour model grid. Correlation coefficients between simulatedand observed hourly ozone mixing ratios at Alert (R = 0.79at the nearest grid cell andR = 0.86 at location A′), Bar-row (R = 0.68) and Zeppelin (R = 0.55) are satisfactorilyhigh for Run 4 with a general improvement from Run 1 (Ta-ble 4). Combined with much improved MB and RMSE val-ues for Alert and Barrow, this result indicates that the modelis quite reasonably simulating the location and timing of re-active bromine release from the surface snowpack and sub-sequent ozone loss across the Arctic during the simulated pe-riod.
Ozonesonde data from across the Arctic provide additionalinsights into our simulations. In Fig.4a–c, we compare ob-served and simulated ozone profiles between 0–6 km a.s.l. atAlert CFS, Resolute and NyAlesund, respectively. Unfor-tunately, no ozonesonde data were reported for April 2001from Barrow, where we find the most tractable meteorology,among the coastal stations studied here, being less suscepti-ble to topography (see Sect. S1 of the Supplement) and wherethe simulated variability in surface ozone levels is reasonable(see above).
At Alert CFS (66 m a.s.l.), located only 6 km away fromthe Alert GAW station (see Fig.2b), two out of the fourozone soundings in April 2001 were obtained during majorODEs lasting longer than 2 days. On 5 April, observed ozonemixing ratios were below 5 nmol mol−1 from the ground upto 684 m a.s.l. and then gradually increased with altitude toreach 40 nmol mol−1 at 2 km a.s.l. On 19 April, the verticalextent of the ozone-depleted layer was much smaller, with12 nmol mol−1 from the ground up to 183 m a.s.l. and thenincreased sharply to 36 nmol mol−1 at 519 m a.s.l. Thesechanges in the observed ozone profiles are simulated quitewell when bromine chemistry is included in the model, al-though the ozone mixing ratios are underpredicted notablybetween 1–3 km a.s.l. on 5 April. According to the wind datafrom the ozonesonde and from the model, air mass originson 5 April were vastly different between the ground level and
above 1 km a.s.l.; near the ground level the air came mainlyfrom the north while at 1 km a.s.l. and higher the air camefrom the south (not shown). As discussed in Sect.3.2, themodel appears to have a tendency to overestimate the releaseof reactive bromine in Baffin Bay and the narrows betweenGreenland and Ellesmere Island located to the south of Alert.At Resolute, located about 1100 km to the southwest of Alert,the observed profile on 7 April showed a near-completeozone depletion (O3<1 nmol mol−1) below 400 m a.s.l. buthad increased to 40 nmol mol−1 by 1.2 km a.s.l. This pro-file is simulated quite reasonably by the model with brominechemistry. Other two ozonesonde profiles from Resolute inApril 2001 exhibited an indication of minor ODEs with adecrease in boundary-layer ozone mixing ratios towards theground level. Although ozone profiles in these two casesare not simulated as well in detail as the profile for 7 April,but the model with bromine chemistry does yield decreasingozone mixing ratios towards the ground level in a more con-sistent manner than the model without bromine chemistry.Finally, simulated ozone profiles at NyAlesund are also inreasonable agreement with observed profiles especially withregard to the vertical extent of boundary-layer air partiallydepleted in ozone; however, the model often underpredictsozone mixing ratios not only in the boundary layer but alsoin the free troposphere.
ChangingTc from −15◦C to either−10◦C (Run 3) or−20◦C (Run 5) does not drastically impact the simulatedsurface ozone mixing ratios at Alert. However, the impactsare quite significant at Barrow and Zeppelin. Especially atBarrow, all the statistical metrics indicate a better model per-formance withTc = −15◦C than with otherTc values (Ta-ble 4). Figure5 shows the simulated time series of surfaceozone mixing ratios for Runs 3 and 5 along with hourly ob-servational data at Barrow. Run 3, assumingTc = −10◦C,captures the observed ODEs nearly as well as Run 4, whileresulting in too much ozone depletion during some of theperiods when surface ozone at Barrow actually recovered to30 nmol mol−1 or higher (e.g., 14–15 April, 21–23 April).On the other hand, withTc = −20◦C (Run 5), the modelsimulates the decrease in surface ozone levels barely as in-tense as observed at Barrow after early April. These resultsare consistent with a recent observational study byPohleret al.(2010), in which they concluded that reactive brominewas released from the snow/ice surface to the atmospheremost likely at surface air temperatures below−15◦C in theAmundsen Gulf.
At Zeppelin, the values ofR suggest a better model per-formance in Runs 3 and 4 (Tc = −10◦C or −15◦C) thanin Run 5 (Tc = −20◦C), but trends in the MB and RMSEvalues are somewhat contradictory (Table4). As shown inFig. 3c, the model underpredicts the ozone mixing ratios al-most all the time in Run 4 and simulates a false occurrenceof a surface ozone dip during 14–16 April. Nonetheless,two episodes of relatively low ozone mixing ratios between10∼30 nmol mol−1 during 7–9 April and 21–23 April are
www.atmos-chem-phys.net/11/3949/2011/ Atmos. Chem. Phys., 11, 3949–3979, 2011
3960 K. Toyota et al.: 3-D modeling of boundary-layer bromine and ozone in the Arctic
0102030405060
O3 [
nmol
/mol
]
1 2 3 4 5 6 7 8 9 10 11 12 13 14 15 16 17 18 19 20 21 22 23 24 25 26 27 28 29 30Date of April 2001
Barrow (Alaska): 71.32°N, 156.61°W, 8 m a.s.l.RUN 3RUN 5OBS
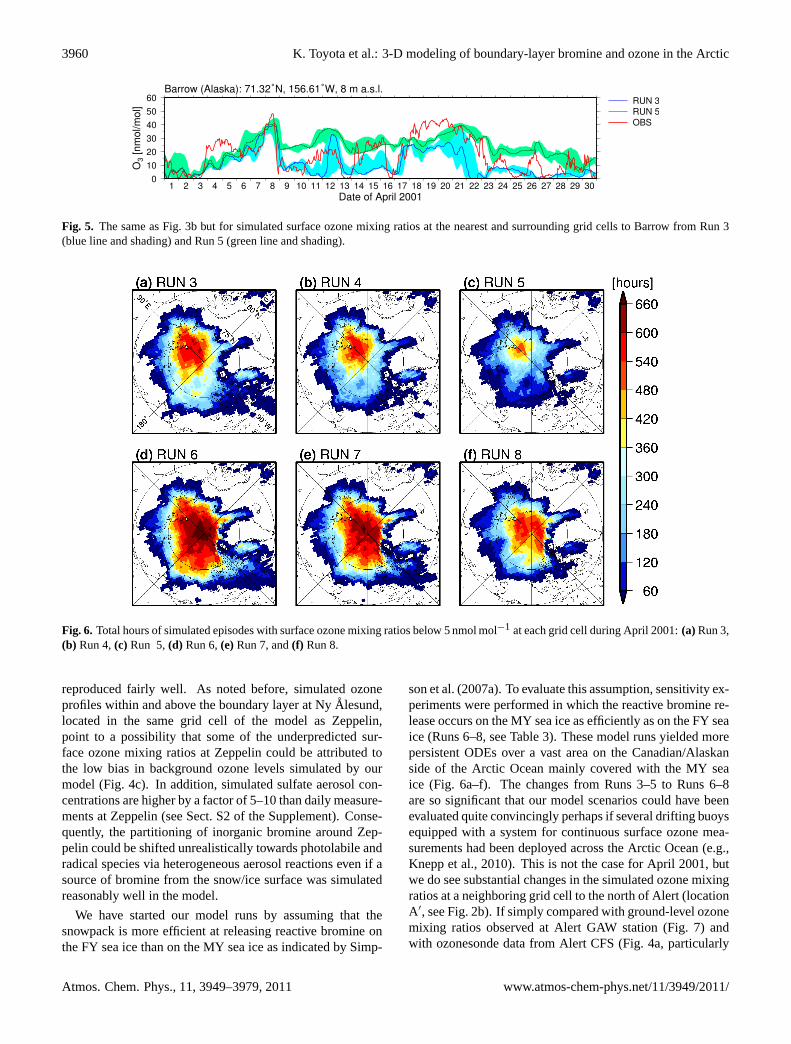
Fig. 5. The same as Fig.3b but for simulated surface ozone mixing ratios at the nearest and surrounding grid cells to Barrow from Run 3(blue line and shading) and Run 5 (green line and shading).
Fig. 6. Total hours of simulated episodes with surface ozone mixing ratios below 5 nmol mol−1 at each grid cell during April 2001:(a) Run 3,(b) Run 4,(c) Run 5,(d) Run 6,(e)Run 7, and(f) Run 8.
reproduced fairly well. As noted before, simulated ozoneprofiles within and above the boundary layer at NyAlesund,located in the same grid cell of the model as Zeppelin,point to a possibility that some of the underpredicted sur-face ozone mixing ratios at Zeppelin could be attributed tothe low bias in background ozone levels simulated by ourmodel (Fig.4c). In addition, simulated sulfate aerosol con-centrations are higher by a factor of 5–10 than daily measure-ments at Zeppelin (see Sect. S2 of the Supplement). Conse-quently, the partitioning of inorganic bromine around Zep-pelin could be shifted unrealistically towards photolabile andradical species via heterogeneous aerosol reactions even if asource of bromine from the snow/ice surface was simulatedreasonably well in the model.
We have started our model runs by assuming that thesnowpack is more efficient at releasing reactive bromine onthe FY sea ice than on the MY sea ice as indicated bySimp-
son et al.(2007a). To evaluate this assumption, sensitivity ex-periments were performed in which the reactive bromine re-lease occurs on the MY sea ice as efficiently as on the FY seaice (Runs 6–8, see Table3). These model runs yielded morepersistent ODEs over a vast area on the Canadian/Alaskanside of the Arctic Ocean mainly covered with the MY seaice (Fig. 6a–f). The changes from Runs 3–5 to Runs 6–8are so significant that our model scenarios could have beenevaluated quite convincingly perhaps if several drifting buoysequipped with a system for continuous surface ozone mea-surements had been deployed across the Arctic Ocean (e.g.,Knepp et al., 2010). This is not the case for April 2001, butwe do see substantial changes in the simulated ozone mixingratios at a neighboring grid cell to the north of Alert (locationA′, see Fig.2b). If simply compared with ground-level ozonemixing ratios observed at Alert GAW station (Fig.7) andwith ozonesonde data from Alert CFS (Fig.4a, particularly
Atmos. Chem. Phys., 11, 3949–3979, 2011 www.atmos-chem-phys.net/11/3949/2011/

K. Toyota et al.: 3-D modeling of boundary-layer bromine and ozone in the Arctic 3961
0102030405060
O3 [
nmol
/mol
]
1 2 3 4 5 6 7 8 9 10 11 12 13 14 15 16 17 18 19 20 21 22 23 24 25 26 27 28 29 30Date of April 2001
Alert (Ellesmere Island, Canada): 82.50°N, 62.30°W, 210 m a.s.l.RUN 7RUN 7 (at A’)OBS
Fig. 7. The same as Fig.3a but for simulated surface ozone mixing ratios at the nearest and surrounding grid cells to Alert from Run 7(orange solid/dashed lines and yellow shading).
on 12 April 2001), the near-surface ozone mixing ratios atlocation A′ are significantly underpredicted most of the timein Run 7 and therefore look unsatisfactory as compared toRun 4 (Fig.3a). The values ofR for simulated ozone atlocation A′ are notably reduced for all theTc ranges testedin Runs 6–8 (R = 0.46∼ 0.55) from Runs 3–5 (R = 0.85∼
0.86) and even lower than that (R = 0.78) obtained in Run 1where bromine chemistry is switched off (Table4). On theother hand, previous field studies have found that ODEs onice floes only 5 to 160 km apart from Alert are obviouslymore persistent than observed at the coastal stations nearby(Hopper and Hart, 1994; Hopper et al., 1998; Morin et al.,2005). It has also been reported that surface snowpack onthe MY sea ice can be substantially enriched in Br− by lateMarch near Alert (Ariya et al., 1999; Toom-Sauntry and Bar-rie, 2002). This could arise from the airborne transport ofgaseous and particulate bromine released from open and/orrefrozen leads located nearby or even from the ones locatedrather distantly if bromine deposited to the snowpack is re-emitted to the atmosphere successively (Simpson et al., 2005;Piot and von Glasow, 2008). It is therefore possible that theozone mixing ratios at location A′ are simulated more realis-tically in Runs 6–8 (i.e., with no distinction between the FYand MY sea ice surfaces for bromine release) than in Runs 3–5. This, however, cannot be assessed unambiguously owingto a lack of field ozone measurements on ice floes near Alertduring the simulated period. Surface ozone and ozonesondedata from other Arctic sites used in this study do not allow usto draw a definitive conclusion about this issue.
We also looked at surface ozone data from Summit, Green-land (3238 m a.s.l.) to evaluate if the simulated ozone lev-els were significantly biased or not in the Arctic free tropo-sphere, with an expectation of minimal impacts due to re-active bromine released on the sea ice. Summit is locatedabove a typical height range where the impacts of brominechemistry on ozone profiles are apparent in our model runs atAlert, Resolute and NyAlesund (Fig.4a–c). Indeed, the sur-face ozone mixing ratios simulated at Summit do not changevery much between our model runs. Also, relatively smallMB and RMSE values to the observed mixing ratios (Ta-ble4) provide some assurance of model credibility for simu-lating background ozone levels around the site. The values of
R, however, are generally low (R < 0.3) in all the model runsbecause of a poor capability of the model to reproduce a largedaytime decrease (sometimes by more than 10 nmol mol−1)observed particularly after 20 April 2001 (Fig.3d). The rea-son for this discrepancy is not clear. At Summit,Helmig et al.(2002) observed a daytime ozone decrease of similar magni-tude occasionally during June 2000. A strong ozone sinkin the local snowpack was also indicated from ozone mea-surements in the interstitial air during another field study atSummit (Helmig et al., 2007a). To reconcile the in-situ mea-surements of HOx radicals at Summit during summer 2003with a box model simulation,Sjostedt et al.(2007) specu-lated an involvement of iodine and bromine photochemistrymost notably when air mass had been transported from themarine boundary layer (not necessarily over sea ice) with lo-cal drifting snow promoting the heterogeneous reactions ofhalogens. More recent field data covered in-snow bromideand ambient BrO radical measurements and showed that thebromine photochemistry can be quite active in the interstitialair of the snowpack and in the ambient air above the snowat Summit in the summer, but not to the extent of causinga large daytime decrease in ozone as observed during April2001 (Dibb et al., 2010; Thomas et al., 2010). On the otherhand,Dibb et al.(2007) measured enhanced concentrationsof dust mineral components in the surface snowpack at Sum-mit particularly between 23–26 April 2001, originating mostlikely from Asian dust storms. As has been shown exper-imentally, certain dust minerals can promote the oxidationof halides into photolabile molecular halogens via heteroge-neous surface reactions (Sadanaga et al., 2001; Anastasio andMozurkewich, 2002).
Finally, it is worth noting results from another version ofGEM-AQ byZhao et al.(2008), which covered the same sim-ulation period as ours. They assumed that frost flowers areabraded by a wind to produce airborne sea-salt particles as asource of reactive halogens in the Arctic boundary layer. Thelocations of the frost flowers were determined based on thePFF data byKaleschke et al.(2004). It appears that surfaceozone mixing ratios at Alert, Barrow and Zeppelin were de-pleted much too frequently in theZhao et al.(2008) modelat least during April 2001 (see Fig. 3 in their paper), indi-cating either that frost flowers are not important as a source
www.atmos-chem-phys.net/11/3949/2011/ Atmos. Chem. Phys., 11, 3949–3979, 2011
3962 K. Toyota et al.: 3-D modeling of boundary-layer bromine and ozone in the Arctic
of reactive bromine or inaccuracy in the PFF algorithm em-ployed byKaleschke et al.(2004). Alternatively, the sourceterm for wind-blown frost flowers byZhao et al.(2008) couldhave been improved simply by scaling it down with some ad-ditional constraints presently unknown. By design, the PFFalgorithm calculates an upper limit for the occurrence of realfrost flowers one could observe in the field.
3.2 Spatial and temporal evolutions of BrO columns
Space-borne measurements of BrO columns provide a use-ful means of evaluating our simulations particularly oversea ice where reactive bromine is actively released to theatmosphere. Here we use tropospheric BrO vertical col-umn densities (VCDs) derived from a combination of totalBrO columns measured by the Global Ozone Monitoring Ex-periment (GOME) instrument and BrO columns above thetropopause simulated by a stratospheric chemical transportmodel (Richter, 2006).
GOME is a UV/visible spectrometer on board the ERS-2 satellite. Slant column densities (SCDs) of atmospherictrace species are retrieved by applying a differential opti-cal absorption algorithm to the measured spectra of sunlightscattered/reflected back from the earth’s atmosphere in near-nadir (±32◦) viewing geometry. For BrO, the spectral fit-ting window in the 345–359 nm wavelength region measuredat 0.2 nm resolution was used (Richter et al., 2002). TheBrO SCDs were then converted to VCDs by using air massfactors (AMFs) for an assumed stratospheric BrO profilewith mixing ratios linearly increasing from 20 to 30 km andconstant above 30 km (Richter et al., 1998). Data obtainedwhere SZA>80◦ were discarded because retrieval sensitivityis shifted towards stratospheric BrO rather than troposphericBrO. To obtain the tropospheric BrO columns, stratosphericBrO SCDs were subtracted from the total BrO SCDs by us-ing output from the SLIMCAT middle-atmosphere chemi-cal transport model (Chipperfield, 1999) at a horizontal res-olution of 7.5◦
×7.5◦. The model was driven by assimi-lated meteorology to address day-to-day changes in strato-spheric dynamics and transport. The tropopause level wasdefined either by the potential temperature of 380 K or bythe potential vorticity of 2 PVU (potential vorticity unit,=10−6 K m2 kg−1 s−1). The version of SLIMCAT used herehad a total inorganic bromine (Bry) loading in the strato-sphere at 21 pmol mol−1 with a source gas represented byCH3Br only (Chipperfield et al., 2005), which, however,most likely underrepresents BrO columns in the lowermoststratosphere as discussed later. Daily tropospheric BrOVCDs thus obtained were gridded at 0.5◦
×0.5◦. Hereafter,we call this product the GOME-SLIMCAT tropospheric BrOVCDs.
For the evaluation of simulated BrO columns, we ac-count for a varying sensitivity of the GOME measurementsto altitude where BrO is actually located, surface reflectivity(albedo) and SZA. As described in Appendix A, the simu-
lated BrO columns are first converted to apparent slant col-umn densities (ASCDs) by applying clear-sky box AMFs andare then divided by geometric AMFs, which approximatethe stratospheric AMFs used for the GOME BrO retrieval.This gives what we call the adapted vertical column densities(AVCDs). To synchronize loosely with GOME’s overpassin the Arctic region, the model-derived AVCDs are sampledonly from 0–1 pm local time slices over 24 h for daily com-parison with the GOME-SLIMCAT tropospheric BrO VCDs.
Figure 8a–d shows the GOME-SLIMCAT troposphericBrO VCDs and the BrO AVCDs simulated by GEM-AQ inRuns 3–5 for each day between 15–22 April 2001. Duringthis period, “BrO clouds” emerged, evolved to spatial scalesof greater than 1000 km, and then diminished at timescalesof about 2 to 4 days. Over the eastern and central ArcticOcean off the coast of Siberia, an arc-shaped “BrO cloud”,which appears to have been initiated on 15 April, maturedbetween 16–17 April. Another event took place a few dayslater in the same area of the Arctic Ocean. A comma-shaped“BrO cloud” that matured on 20 April appears to have beeninitiated on 19 April near the Siberian coast around 135◦ Eand then moved westward to reach Barents Sea on 22 Aprilwhile being deformed and diminished. The shape of the“BrO clouds” in these two prominent cases are best simu-lated in Run 3, in whichTc =−10◦C is assumed (Fig.8b).As shown by the surface air temperature and wind fields at12:00 UTC for each day during the same period (Fig.9a),these events were characterized by relatively “warm” tem-peratures sometimes as high as−10◦C associated with airmass transport from the south. It also appears that strongboundary-layer winds resulted in a break-up of surface inver-sions to raise the surface temperatures further. If we assumethat bromine release from the snowpack is terminated at sur-face temperatures above−15◦C, the model does not yieldthe source of bromine at the right time and in the right placeso that the “BrO clouds” begin to lose a resemblance in theirshape as compared to the GOME-SLIMCAT data (Fig.8c).If Tc =−20◦C is assumed, the “BrO clouds” in their matu-rity on 16–17 April and on 20 April disappear totally in themodel (Fig.8d). On the other side of the Arctic, a region thatcovers Hudson Bay and a southern part of the Canadian Arc-tic Archipelago also exhibited a frequent occurrence of “BrOclouds” during 15–22 April 2001. These events were alsocharacterized by strong surface winds associated with syn-optic disturbances, but surface temperatures did not increaseso obviously as in the eastern Arctic cases described abovebecause of air mass transport mainly from the north (Fig.9a).Again, the “BrO clouds” do not emerge as can be seen in theGOME-SLIMCAT data whenTc =−20◦C is assumed in themodel.
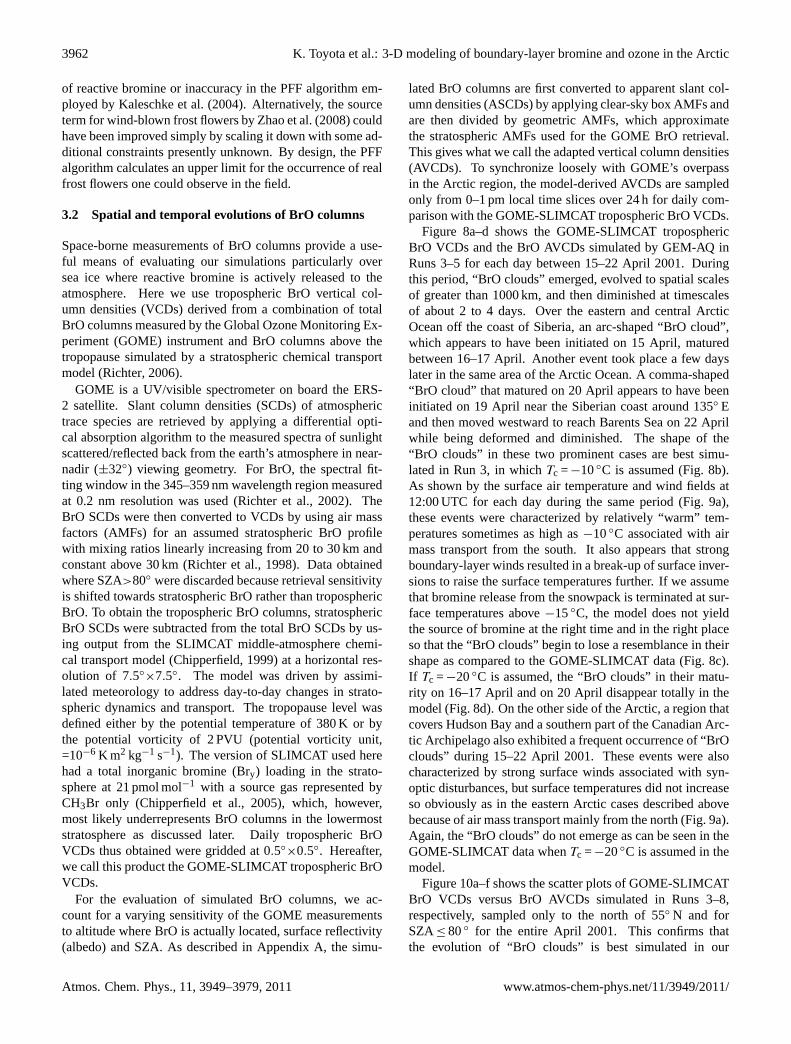
Figure10a–f shows the scatter plots of GOME-SLIMCATBrO VCDs versus BrO AVCDs simulated in Runs 3–8,respectively, sampled only to the north of 55◦ N and forSZA≤ 80◦ for the entire April 2001. This confirms thatthe evolution of “BrO clouds” is best simulated in our
Atmos. Chem. Phys., 11, 3949–3979, 2011 www.atmos-chem-phys.net/11/3949/2011/

K. Toyota et al.: 3-D modeling of boundary-layer bromine and ozone in the Arctic 3963
Fig. 8. (a)GOME-SLIMCAT tropospheric BrO VCDs (in molecule cm−2) for each day between 15–22 April 2001;(b) The same as (a) butfor BrO AVCDs (in molecule cm−2) simulated by GEM-AQ in Run 3;(c) The same as (b) but simulated in Run 4; and(d) The same as (b)but simulated in Run 5. Note different color scales used for the GOME-SLIMCAT BrO VCDs and the GEM-AQ BrO AVCDs.
www.atmos-chem-phys.net/11/3949/2011/ Atmos. Chem. Phys., 11, 3949–3979, 2011

3964 K. Toyota et al.: 3-D modeling of boundary-layer bromine and ozone in the Arctic
Fig. 9. (a)Surface air temperatures (color shade, in◦C) and wind vectors (arrow length for the wind speed of 20 m s−1 is indicated in thetop right corner) at 12:00 UTC each day between 15–22 April 2001 simulated by the model; and(b) The same as (a) but for surface ozonemixing ratios (in nmol mol−1) simulated in Run 4.
model withTc =−10◦C, somewhat underrepresented if sim-ulated withTc =−15◦C and significantly undermined withTc =−20◦C. Implications of this result will be discussedin Sect.3.4. Next, agreement between the model and theGOME-SLIMCAT data is modestly better when bromine re-lease is assumed to be more efficient on the FY sea ice thanon the MY sea ice forTc =−15∼−10◦C. As discussed pre-viously when evaluating the boundary-layer ozone simula-tions, the potential of reactive bromine release to the atmo-sphere may not be very different in reality between the FYsea ice and the MY sea ice as assumed in Runs 3–5, be-cause bromide would also likely be enriched in the surface
snow widely on the MY sea ice (and in the coastal snowsurface) in the spring as a result of the airborne transportof bromine involving successive re-emissions across the ice-covered ocean from original sources such as refreezing leads(Ariya et al., 1999; Toom-Sauntry and Barrie, 2002; Simpsonet al., 2005). Nevertheless, the improvement in the simulatedBrO columns from Runs 6–7 to Runs 3–4 suggests that someadvantageous physical and/or chemical mechanisms exist onthe FY sea ice for an enhanced bromine release to the atmo-sphere.
We note that, even in Run 3 which simulates the mor-phological evolutions of “BrO clouds” most successfully,
Atmos. Chem. Phys., 11, 3949–3979, 2011 www.atmos-chem-phys.net/11/3949/2011/
K. Toyota et al.: 3-D modeling of boundary-layer bromine and ozone in the Arctic 3965
Fig. 10. Scatter plots of GEM-AQ BrO AVCDs versus GOME-SLIMCAT tropospheric BrO VCDs to the north of 55◦ N and for SZA≤ 80◦
during 1–30 April 2001. The GEM-AQ output (at the resolution of 0.88◦×0.88◦ in the Arctic core) is regridded to 0.5◦
×0.5◦ used for theGOME-SLIMCAT dataset:(a) Run 3,(b) Run 4,(c) Run 5,(d) Run 6,(e)Run 7, and(f) Run 8.
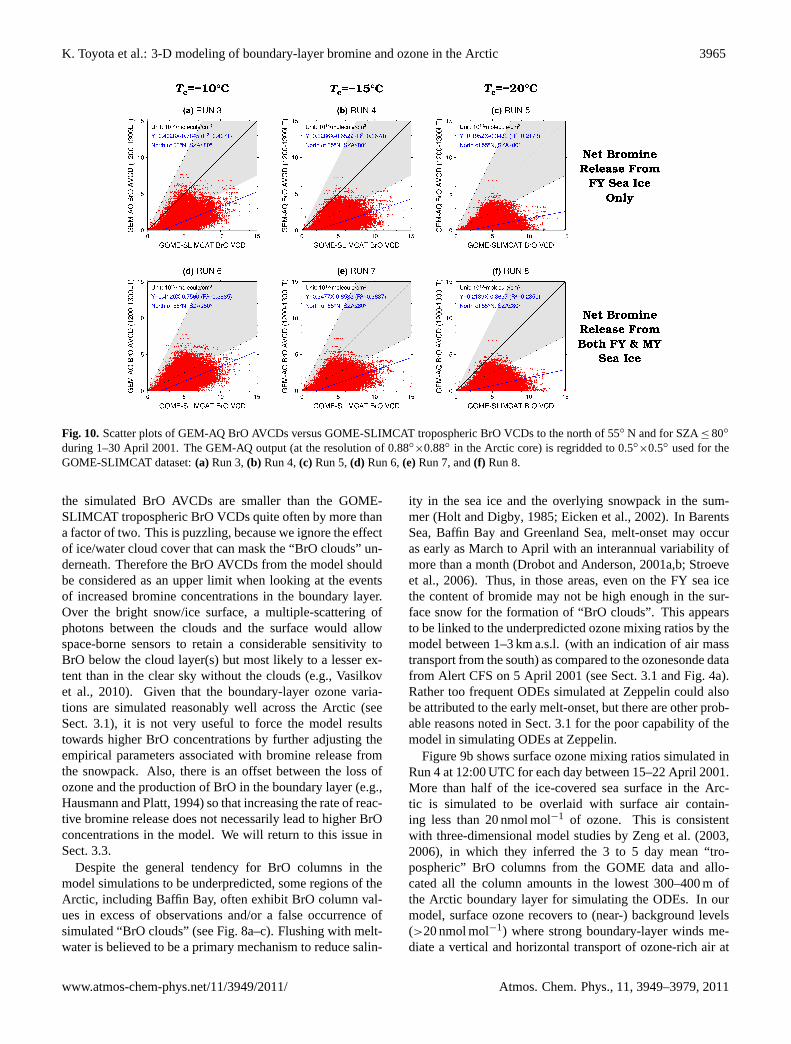
the simulated BrO AVCDs are smaller than the GOME-SLIMCAT tropospheric BrO VCDs quite often by more thana factor of two. This is puzzling, because we ignore the effectof ice/water cloud cover that can mask the “BrO clouds” un-derneath. Therefore the BrO AVCDs from the model shouldbe considered as an upper limit when looking at the eventsof increased bromine concentrations in the boundary layer.Over the bright snow/ice surface, a multiple-scattering ofphotons between the clouds and the surface would allowspace-borne sensors to retain a considerable sensitivity toBrO below the cloud layer(s) but most likely to a lesser ex-tent than in the clear sky without the clouds (e.g.,Vasilkovet al., 2010). Given that the boundary-layer ozone varia-tions are simulated reasonably well across the Arctic (seeSect.3.1), it is not very useful to force the model resultstowards higher BrO concentrations by further adjusting theempirical parameters associated with bromine release fromthe snowpack. Also, there is an offset between the loss ofozone and the production of BrO in the boundary layer (e.g.,Hausmann and Platt, 1994) so that increasing the rate of reac-tive bromine release does not necessarily lead to higher BrOconcentrations in the model. We will return to this issue inSect.3.3.
Despite the general tendency for BrO columns in themodel simulations to be underpredicted, some regions of theArctic, including Baffin Bay, often exhibit BrO column val-ues in excess of observations and/or a false occurrence ofsimulated “BrO clouds” (see Fig.8a–c). Flushing with melt-water is believed to be a primary mechanism to reduce salin-
ity in the sea ice and the overlying snowpack in the sum-mer (Holt and Digby, 1985; Eicken et al., 2002). In BarentsSea, Baffin Bay and Greenland Sea, melt-onset may occuras early as March to April with an interannual variability ofmore than a month (Drobot and Anderson, 2001a,b; Stroeveet al., 2006). Thus, in those areas, even on the FY sea icethe content of bromide may not be high enough in the sur-face snow for the formation of “BrO clouds”. This appearsto be linked to the underpredicted ozone mixing ratios by themodel between 1–3 km a.s.l. (with an indication of air masstransport from the south) as compared to the ozonesonde datafrom Alert CFS on 5 April 2001 (see Sect.3.1 and Fig.4a).Rather too frequent ODEs simulated at Zeppelin could alsobe attributed to the early melt-onset, but there are other prob-able reasons noted in Sect.3.1 for the poor capability of themodel in simulating ODEs at Zeppelin.
Figure9b shows surface ozone mixing ratios simulated inRun 4 at 12:00 UTC for each day between 15–22 April 2001.More than half of the ice-covered sea surface in the Arc-tic is simulated to be overlaid with surface air contain-ing less than 20 nmol mol−1 of ozone. This is consistentwith three-dimensional model studies byZeng et al.(2003,2006), in which they inferred the 3 to 5 day mean “tro-pospheric” BrO columns from the GOME data and allo-cated all the column amounts in the lowest 300–400 m ofthe Arctic boundary layer for simulating the ODEs. In ourmodel, surface ozone recovers to (near-) background levels(>20 nmol mol−1) where strong boundary-layer winds me-diate a vertical and horizontal transport of ozone-rich air at
www.atmos-chem-phys.net/11/3949/2011/ Atmos. Chem. Phys., 11, 3949–3979, 2011

3966 K. Toyota et al.: 3-D modeling of boundary-layer bromine and ozone in the Arctic
synoptic scales as suggested previously from field observa-tions (Gong et al., 1997; Hopper et al., 1998; Strong et al.,2002; Jacobi et al., 2010). High surface ozone levels andstrong surface winds are both conducive in our model to theefficient release of reactive bromine from the surface snow,because the bromine release is triggered by ozone at greaterrates, while the bromine explosion is promoted by a greaterpartitioning of HOBr (and BrONO2 to a lesser extent) for agiven amount of total inorganic bromine (e.g.,Tang and Mc-Connell, 1996), and the dry deposition velocities of HOBrand BrONO2 increase substantially by a shear-induced turbu-lence in the otherwise statically stable boundary layer. Thereasonable agreement between the simulated evolutions of“BrO clouds” and the GOME-SLIMCAT data indicates that,at least in April, a potential source of bromine to the at-mosphere exists ubiquitously on the ice-covered ocean (es-pecially in areas covered with the FY sea ice) across theArctic and that the timing and location of bromine releaseare controlled mainly by a meteorological forcing on ozonetransport and surface wind speed. The photochemical pro-cessing and movement of air mass containing “BrO clouds”will be smeared significantly if averaged over 3–5 days aswas done byZeng et al.(2003, 2006). This may explainwhy their correlation coefficients between simulated and ob-served surface ozone mixing ratios were somewhat smaller(R = 0.52∼ 0.59 at Alert andR = 0.58∼ 0.67 at Barrow forthe spring 2000) than our present results (see Table4).
Under the influence of common mechanisms such as adownward diffusion near the surface and a horizontal ad-vection from the south, the transport of ozone and sensibleheat often appears to be correlated in the springtime Arcticboundary layer. Thus, on the ice-covered ocean across theArctic, a simulated recovery of the ozone mixing ratio tendsto be collocated with an increase in surface air temperature(Fig. 9a–b). This also means that the release of bromine tothe atmosphere is simulated to occur at greater rates wherethe surface temperature is relatively high, sometimes as highas a prescribed upper limit for the bromine release from thesnow in our model (e.g.,−10◦C for Runs 3 and 6). On theother hand, a coincidence of ODEs and decreasing tempera-tures has been often observed at Arctic coastal sites such asAlert and Zeppelin (Bottenheim et al., 1990; Solberg et al.,1996; Tarasick and Bottenheim, 2002). Can we reconcilesuch observations with the behavior of our model?
Bottenheim and Chan(2006) suggested that a majority ofODEs at Alert and Zeppelin could have been initiated oversea ice several days upwind along trajectories across the cen-tral Arctic Ocean. Our model runs are not designed to reveala link between specific “BrO clouds” and ODEs at down-wind locations unambiguously. Such a link, however, isindicated for some cases from backward trajectories calcu-lated by the CMC trajectory model using three-dimensionalwind data from an operational GEM model (see Sect. S3 inthe Supplement for details). For example, the arc-shaped“BrO cloud” that matured off the coast of Siberia during 16–
17 April 2001 appears to have been an origin of the ODEat Alert on 20 April 2001 whereas the comma-shaped “BrOcloud” that matured on 20 April 2001 appears to have carriedair partially depleted in ozone to Zeppelin a few days later.Air masses depleted in ozone, once warmed adiabatically viavertical mixing while bromine chemistry is activated, can becooled down by more than 10 K in a day or two as a resultof infrared radiative cooling during the transport in the stableboundary layer if the underlying ice surface does not con-tain a lot of open/refrozen leads (Curry, 1983; Piot and vonGlasow, 2008). Thus, some of the coincidence of ODEs anddecreasing temperatures in the Arctic spring may reflect along transit time after ozone is destroyed at upwind locationsrather than a measure of low temperature conditions requiredfor activating bromine chemistry.
3.3 Additional BrO unaccounted for in the model
So far, we have examined the simulated BrO AVCDs with-out any offset applied when compared with the GOME-SLIMCAT tropospheric BrO VCDs. But it is probablyreasonable to assume the presence of background BrOlevels on the order of 1×10¹³ molecule cm−2 (or about0.5∼1 pmol mol−1) in the Arctic troposphere arising fromsources neglected in our model runs such as the photodegra-dation of organic bromine and volatilization from sea-saltaerosols (Fitzenberger et al., 2000; Yang et al., 2005; Hen-drick et al., 2007). The background BrO levels in the freetroposphere can be underpredicted also because a moist con-vection over open leads and polynyas in the sea ice is under-represented in large-scale meteorological models but wouldlikely carry reactive bromine compounds as well as mois-ture upwards from the near-surface boundary layer quite ef-ficiently (McElroy et al., 1999; Salawitch et al., 2010).
In addition, the BrO concentrations in the lowermoststratosphere are most likely underestimated by the SLIM-CAT model used here becauseChipperfield et al.(2005)did not account for very short-lived (VSL) organic brominecompounds such as CH2Br2 and CHBr3 but representedthe decomposition of organic source gases solely byCH3Br + OH/hν. The “mean age of air”, or an average timespent by air parcels after entering the stratosphere, is about6 to 24 months in the Arctic lowermost stratosphere (e.g.,Chipperfield, 2006), so that a fraction of CH3Br already de-composed into inorganic bromine may change significantlywith altitude (Dvortsov et al., 1999). On the other hand,two main VSL organic bromine compounds, CHBr3 andCH2Br2, have photochemical lifetimes of around 30 days and6 months, respectively, and are believed to enter the strato-sphere in the tropics via deep convective transport as well asrelatively slow large-scale upwelling motion in the tropicaltroposphere (Hossaini et al., 2010). It is therefore reason-able to assume that these VSL organic bromine compoundsare totally converted to inorganic bromine by the time airis mixed to high latitudes in the stratosphere. Most recent
Atmos. Chem. Phys., 11, 3949–3979, 2011 www.atmos-chem-phys.net/11/3949/2011/
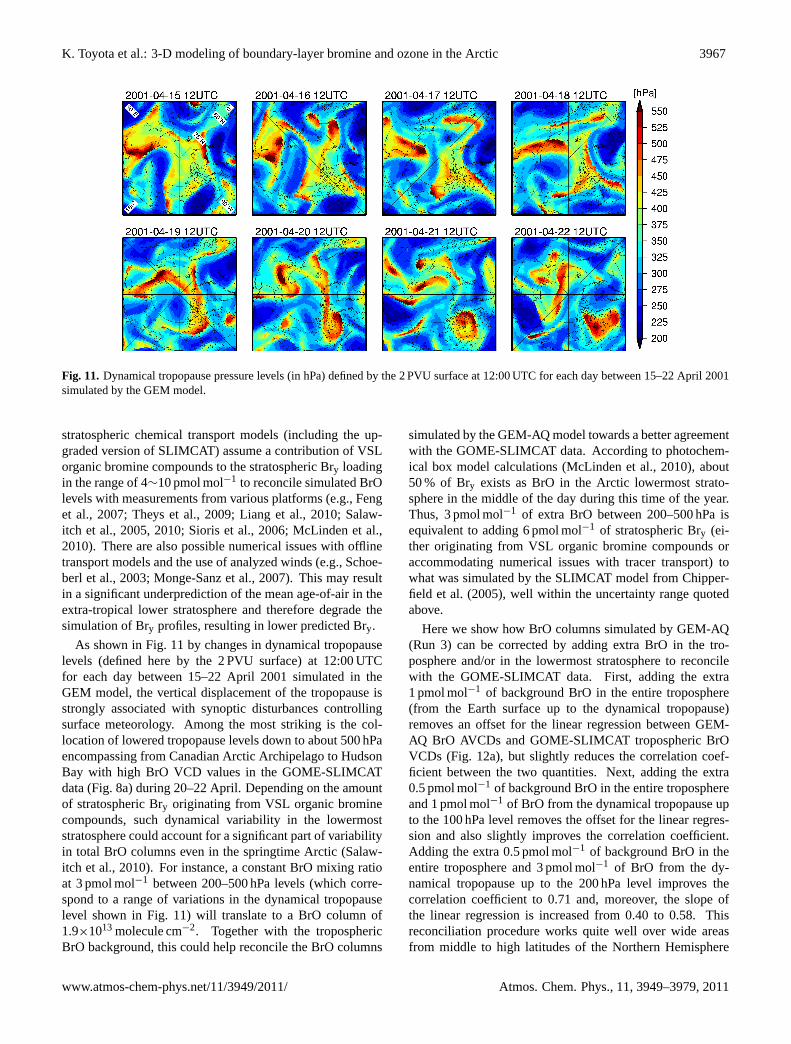
K. Toyota et al.: 3-D modeling of boundary-layer bromine and ozone in the Arctic 3967
Fig. 11. Dynamical tropopause pressure levels (in hPa) defined by the 2 PVU surface at 12:00 UTC for each day between 15–22 April 2001simulated by the GEM model.
stratospheric chemical transport models (including the up-graded version of SLIMCAT) assume a contribution of VSLorganic bromine compounds to the stratospheric Bry loadingin the range of 4∼10 pmol mol−1 to reconcile simulated BrOlevels with measurements from various platforms (e.g.,Fenget al., 2007; Theys et al., 2009; Liang et al., 2010; Salaw-itch et al., 2005, 2010; Sioris et al., 2006; McLinden et al.,2010). There are also possible numerical issues with offlinetransport models and the use of analyzed winds (e.g.,Schoe-berl et al., 2003; Monge-Sanz et al., 2007). This may resultin a significant underprediction of the mean age-of-air in theextra-tropical lower stratosphere and therefore degrade thesimulation of Bry profiles, resulting in lower predicted Bry.
As shown in Fig.11 by changes in dynamical tropopauselevels (defined here by the 2 PVU surface) at 12:00 UTCfor each day between 15–22 April 2001 simulated in theGEM model, the vertical displacement of the tropopause isstrongly associated with synoptic disturbances controllingsurface meteorology. Among the most striking is the col-location of lowered tropopause levels down to about 500 hPaencompassing from Canadian Arctic Archipelago to HudsonBay with high BrO VCD values in the GOME-SLIMCATdata (Fig.8a) during 20–22 April. Depending on the amountof stratospheric Bry originating from VSL organic brominecompounds, such dynamical variability in the lowermoststratosphere could account for a significant part of variabilityin total BrO columns even in the springtime Arctic (Salaw-itch et al., 2010). For instance, a constant BrO mixing ratioat 3 pmol mol−1 between 200–500 hPa levels (which corre-spond to a range of variations in the dynamical tropopauselevel shown in Fig.11) will translate to a BrO column of1.9×1013 molecule cm−2. Together with the troposphericBrO background, this could help reconcile the BrO columns
simulated by the GEM-AQ model towards a better agreementwith the GOME-SLIMCAT data. According to photochem-ical box model calculations (McLinden et al., 2010), about50 % of Bry exists as BrO in the Arctic lowermost strato-sphere in the middle of the day during this time of the year.Thus, 3 pmol mol−1 of extra BrO between 200–500 hPa isequivalent to adding 6 pmol mol−1 of stratospheric Bry (ei-ther originating from VSL organic bromine compounds oraccommodating numerical issues with tracer transport) towhat was simulated by the SLIMCAT model fromChipper-field et al.(2005), well within the uncertainty range quotedabove.
Here we show how BrO columns simulated by GEM-AQ(Run 3) can be corrected by adding extra BrO in the tro-posphere and/or in the lowermost stratosphere to reconcilewith the GOME-SLIMCAT data. First, adding the extra1 pmol mol−1 of background BrO in the entire troposphere(from the Earth surface up to the dynamical tropopause)removes an offset for the linear regression between GEM-AQ BrO AVCDs and GOME-SLIMCAT tropospheric BrOVCDs (Fig. 12a), but slightly reduces the correlation coef-ficient between the two quantities. Next, adding the extra0.5 pmol mol−1 of background BrO in the entire troposphereand 1 pmol mol−1 of BrO from the dynamical tropopause upto the 100 hPa level removes the offset for the linear regres-sion and also slightly improves the correlation coefficient.Adding the extra 0.5 pmol mol−1 of background BrO in theentire troposphere and 3 pmol mol−1 of BrO from the dy-namical tropopause up to the 200 hPa level improves thecorrelation coefficient to 0.71 and, moreover, the slope ofthe linear regression is increased from 0.40 to 0.58. Thisreconciliation procedure works quite well over wide areasfrom middle to high latitudes of the Northern Hemisphere
www.atmos-chem-phys.net/11/3949/2011/ Atmos. Chem. Phys., 11, 3949–3979, 2011

3968 K. Toyota et al.: 3-D modeling of boundary-layer bromine and ozone in the Arctic
Fig. 12. The same as Fig.10 but GEM-AQ BrO AVCDs from Run 3 are recalculated by adding extra BrO to the original model output:(a) 1 pmol mol−1 from the surface up to GEM’s dynamical tropopause;(b) 0.5 pmol mol−1 from the surface up to GEM’s dynamicaltropopause and 1 pmol mol−1 from the dynamical tropopause up to the 100 hPa level; and(c) 0.5 pmol mol−1 from the surface up to GEM’sdynamical tropopause and 3 pmol mol−1 from the dynamical tropopause up to the 200 hPa level.
(see Figs.13–14). But the conclusion that “BrO clouds”are boundary-layer phenomena still appears robust particu-larly over the eastern and central Arctic Ocean, because thehorizontal structure of the vertical tropopause displacement(Fig.11) does not necessarily agree with that of the enhancedBrO VCDs in the GOME-SLIMCAT data (Fig.8a).
3.4 Potential influences from temperature and acidityon bromine activation in the polar boundary layer
Our model simulations are consonant with the idea that re-active bromine is released from the saline snow/ice surfaceapparently at temperatures as high as−10∼−15◦C, or possi-bly even higher, over an extensive area across the springtimeArctic. However, the issue is not clear cut as there are re-sults which suggest that a heterogeneous bromine activationin the polar boundary layer is favored at lower temperatures.For example, the concentrations of Br− relative to Cl− areincreased in freezing salt solutions especially below−20◦Cdue to the precipitation of NaCl· 2H2O and MgCl2 · 12H2O(Koop et al., 2000; Morin et al., 2008). Also, the equilibriumconstants of Reactions (R10) would shift towards a forma-tion of Br2 as suggested bySander et al.(2006). Carbonateprecipitation from a freezing brine (Dieckmann et al., 2010;Sander and Morin, 2010) leads to a decrease in total alka-linity of the brine, increasing a likelihood of acid-assistedbromine release from the saline snow. For the recycling ofgaseous bromine reservoirs into photolabile species, coldertemperatures appear to increase the capacity of aerosols toaccommodate reactants from the gas phase (Piot and vonGlasow, 2008). However, in the latter case, if the aerosolsubstrate retains a liquid water content as large as cloud wa-ter droplets, it may rather end up deactivating bromine chem-istry by a dilution of reactants in the condensed phase aftertaken up from the gas phase (Piot and von Glasow, 2008). Inthis context we note the occurrence of mixed-phase cloudsis very common in the Arctic boundary layer. Their liquidwater fraction increases, in general, notably with tempera-
ture between−30∼−10◦C (e.g.,Shupe et al., 2006) and thusthe bromine activation process by any of these mechanismswould be offset. In favor of a mechanism that is active atwarmer temperatures, we note that photolysis of dissolvedimpurities such as H2O2, NO−
3 and unknown organic chro-mophores leads to an in-snow formation of OH radicals (e.g.,Anastasio and Jordan, 2004; Anastasio et al., 2007). Thesemay subsequently produce Br2 in the Br−-containing snowespecially if it is acidic (e.g.,Abbatt et al., 2010). Labora-tory experiments have shown that such photolytic reactionswill proceed at greater yields of the products, viz. OH andBr2, with increasing temperature in the frozen solutions (Chuand Anastasio, 2003, 2005; Abbatt et al., 2010). Thus, de-pending on which physical and chemical mechanisms ac-tually exert a major influence on the activation of brominechemistry, reactive bromine release from the snow and sub-sequent ozone depletion in the atmospheric boundary layerwill respond to changing temperature and acidity conditionsquite differently.
In the end our scheme is semi-empirical while attemptingto incorporate the main observational features of bromine re-lease, viz. it is valid across the entire Arctic, can be activeup to −10◦C or higher (e.g.,Bottenheim et al., 2009), andappears to be limited by the disappearance of ozone (e.g.,Impey et al., 1997; Morin et al., 2005). By employing a sim-ple scheme that is controlled and limited by an uptake of O3,HOBr and BrONO2 to the snow surface via dry depositionfrom the atmosphere, it is possible that the model fortuitouslyapproximated the whole processes of greater complexity oc-curring in reality. However, the reasonable success of oursimulation with regard to a synoptic-scale variability in thelower-tropospheric concentrations of BrO and O3 suggeststhat it has captured some of the features of the complex pro-cesses occurring during the evolution of bromine and the de-struction of ozone.
Oum et al.(1998) conducted laboratory experiments fora reactive ozone uptake on the frozen salt solution at pH 8for temperatures between−5∼−1◦C. The rate of the Br2
Atmos. Chem. Phys., 11, 3949–3979, 2011 www.atmos-chem-phys.net/11/3949/2011/
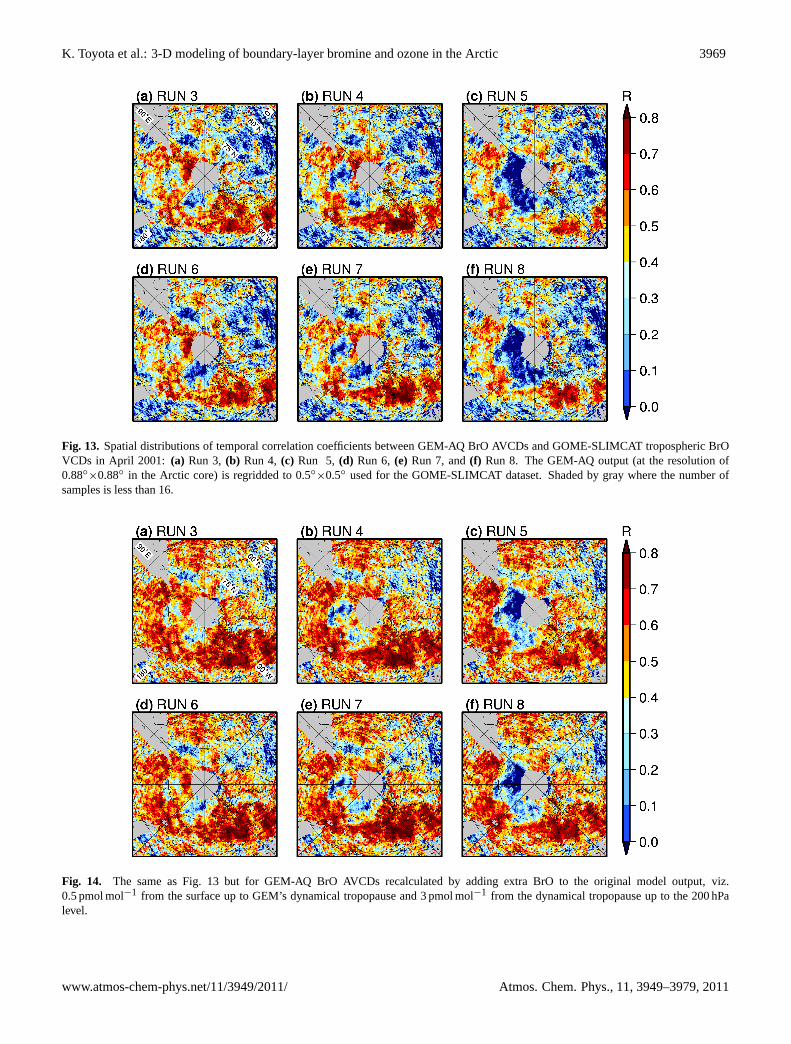
K. Toyota et al.: 3-D modeling of boundary-layer bromine and ozone in the Arctic 3969
Fig. 13. Spatial distributions of temporal correlation coefficients between GEM-AQ BrO AVCDs and GOME-SLIMCAT tropospheric BrOVCDs in April 2001: (a) Run 3,(b) Run 4,(c) Run 5,(d) Run 6,(e) Run 7, and(f) Run 8. The GEM-AQ output (at the resolution of0.88◦×0.88◦ in the Arctic core) is regridded to 0.5◦
×0.5◦ used for the GOME-SLIMCAT dataset. Shaded by gray where the number ofsamples is less than 16.
Fig. 14. The same as Fig.13 but for GEM-AQ BrO AVCDs recalculated by adding extra BrO to the original model output, viz.0.5 pmol mol−1 from the surface up to GEM’s dynamical tropopause and 3 pmol mol−1 from the dynamical tropopause up to the 200 hPalevel.
www.atmos-chem-phys.net/11/3949/2011/ Atmos. Chem. Phys., 11, 3949–3979, 2011

3970 K. Toyota et al.: 3-D modeling of boundary-layer bromine and ozone in the Arctic
Fig. 15. The net air-surface exchange rate of bromine integrated over 24 h between 00:00–24:00 UTC on 20 April 2001 as simulated inRun 3 and the separate contribution of each operating mechanism:(a) the total net exchange of all the inorganic bromine species;(b) Br2release via dry deposition of ozone on the FY sea ice;(c) wet deposition of HBr integrated over the atmospheric column;(d) the net rate ofair-surface bromine exchange via “explosion” chemistry as represented by the sum of(e)and(f); (e)Br2 release via dry deposition of HOBrand BrONO2; and(f) dry deposition of all the inorganic bromine species. Positive values represent a net release to the atmosphere whereasnegative values represent a net loss from the atmosphere (in atom (Br) cm−2 day−1).
release estimated from their experimental result was appar-ently not high enough to explain the abundance of reactivebromine observed in the field, although it could effectivelytrigger the “bromine explosion”.Oldridge and Abbatt(2011)found a significant increase in the reactive uptake coefficient(γ ) of ozone onto a frozen salt solution at pH 5.6 by raisingtemperature from−40◦C to−15◦C. Theγ value close to thehigher end of whatOldridge and Abbattreported had beenobtained byWren et al.(2010) for the heterogeneous surfacereaction of ozone on a non-acidified frozen NaBr solution at−20◦C. The latter authors showed that the reaction proceedsapparently at a similar rate at−10◦C as well. However, theγvalues on the order of 10−8 as derived in these studies againindicate that the heterogeneous surface reaction of ozone byitself is unlikely to account for a buildup of reactive brominefast enough as observed in the field. Clearly, as discussedlater in Sect.3.5, the semi-empirical reactive uptake of ozoneon the snow surface in our model is a proxy for other morecomplex processes which can be parameterized as functionsof the surface ozone level.
For the reactive uptake of HOBr onto frozen salt solu-tions, previous laboratory experiments have been conductedonly at temperatures between−43∼−20◦C (Kirchner et al.,1997; Huff and Abbatt, 2002; Adams et al., 2002). At thesetemperatures, acidity is not required for the release of Br2
and/or BrCl to take place efficiently via HOBr uptake on thefrozen sea-salt solution unlike at room temperature (Fickertet al., 1999). For the reactive uptake of BrONO2, experimen-tal studies have not been conducted at the temperature andsubstrate conditions pertinent to polar snowpack. Bulk solu-tions melted from Arctic snowfall and snowpack have beenfound to be moderately acidic during the springtime (Gjess-ing, 1977; Semb et al., 1984; Cho et al., 2002; Toom-Sauntryand Barrie, 2002; Douglas and Sturm, 2004), reflecting thelong-range transport of sulfur and nitrogen oxides of anthro-pogenic origin. It thus seems that an alkaline brine on thesnowpack will often be acidified to levels necessary for re-active bromine release via the mechanism studied byFick-ert et al.(1999). In the springtime Arctic boundary layer,acidic gases and aerosols are transported mainly from Eura-sia (e.g.,Christensen, 1997). If the bromine release from thesaline snow is prone to proceed via acid-assisted reactionswith increasing temperature, it may explain the potential re-gional difference in activity implied from our model runs;the model performed best where the temperature thresholdfor bromine release was relaxed and raised toTc =−10◦C(Run 3) for simulating BrO columns particularly over theeastern and central Arctic Ocean, while surface ozone at Bar-row was simulated somewhat better whereTc =−15◦C wasassumed (Run 4).
Atmos. Chem. Phys., 11, 3949–3979, 2011 www.atmos-chem-phys.net/11/3949/2011/

K. Toyota et al.: 3-D modeling of boundary-layer bromine and ozone in the Arctic 3971
Since the volume and chemical composition of a liquid-like layer at the surface of frozen salt solutions change sub-stantially with temperature (e.g.,Cho et al., 2002; Abbatt,2003), it is desirable to perform laboratory experiments con-sistently to explore if any changes occur in the reactive up-take coefficient and product yields of each heterogeneousreaction of interest over wide ranges of substrate tempera-ture and acidity conditions for characterizing the chemistryof halogens in the polar boundary layer.
3.5 Budget analysis of the parameterized mechanismsfor air-surface bromine exchange
As discussed in Sect.3.2, reactive bromine release from thesnow/ice surface is strongly influenced by changing meteo-rological conditions. Figure15a shows thenet surface fluxof Bry integrated over 24 h on 20 April 2001 as simulated inRun 3. The maximum net surface-to-air flux of Bry was sim-ulated to reach greater than 4×10¹³ atom (Br) cm−2 day−1
in the eastern and central Arctic Ocean as well as in be-tween Canadian Arctic Archipelago, contributing to a buildup of “BrO clouds” located in those areas on the sameday (Fig.8a–b). Note, however, that the net surface-to-airBry flux was most likely overestimated in Baffin Bay (seeSect.3.3). A breakdown of the total net flux from each con-tributing mechanism (Fig.15b–f) points to a revealing resultfrom our simulation. Contrary to our original expectation,the ozone trigger (Fig.15b) contributed primarily to a buildup of atmospheric bromine whereas the bromine explosioncaused by HOBr and BrONO2 (Fig. 15e) was of secondaryimportance in the simulation. Thus the tuning parameter forthe ozone trigger (81 = 0.075, see Sect.2.3) seems to be areasonable measure of the complex processes that actuallyoccur at (or near) the air-snow interface in the Arctic envi-ronment.
Sander et al.(2006) suggested that wind-abraded grainsfrom the saline snowpack (drifting/blowing snow) wouldserve as a major salinity source to the polar boundary layerwhich would then lead to the bromine explosion and ODEs.Such a process seems consistent with ground-based opticalmeasurements at Neumayer station, Antarctica byFrieß et al.(2004). They found enhanced overhead BrO columns of-ten occurring simultaneously with enhanced slant columnsof O2 dimer (as an indicator of aerosol multiple scattering).Jones et al.(2009) also reported a compelling case whereblowing snow was most likely involved in the occurrence ofhigh BrO column and surface ozone depletion from ground-based observations at Halley station, Antarctica. Also in theArctic, the occurrence of ODEs is sometimes accompaniedby increased concentrations of sea-salt aerosols (e.g.,Hop-per and Hart, 1994). However, as has been pointed out fre-quently (e.g.,McConnell et al., 1992), the concentrations ofbromine in either gaseous or particulate form are generallyfar in excess of what could be expected from sea-salt com-position (or sodium) in aerosols during the Arctic spring at
least near coastal/island sites such as Alert, Barrow and NyAlesund (Berg et al., 1983; Sturges and Barrie, 1988; Olt-mans et al., 1989; Barrie et al., 1994; Impey et al., 1997;Lehrer et al., 1997). This indicates that a source other thanairborne sea-salt aerosols should account for most of the re-active bromine observed in the air. Nonetheless,Yang et al.(2008, 2010) implemented an algorithm to simulate gaseousbromine release from sea-salt aerosols that originate from asublimation of wind-blown snow after detached from salinesnowpack in their three-dimensional tropospheric chemicaltransport model with bromine chemistry. They concludedthat the amount of bromine originating from the wind-blownsnow could be abundant enough to account for the occur-rence of “BrO clouds” in the springtime Arctic boundarylayer. A key assumption byYang et al.was that Br− is de-pleted relative to Na+ in the snow-derived sea-salt aerosolsto provide a source of gaseous bromine. This, however, iscontradictory to aerosol chemistry observations in the Arcticcited above, implying that the aerosols had, de facto, alreadybeen “seeded” with bromine sufficient to cause the gaseous“BrO clouds” in theYang et al.model. It still seems that thebromine release occurs directly from the wind-blown snowbefore sublimation, as suggested byJones et al.(2009). Theinclusion of this process could have raised simulated BrOcolumns particularly when windy in our model to give a fur-ther improvement in the correlation and the slope of linear re-gression between simulated and measured BrO columns dis-cussed in Sect.3.3. In our present setup, the wind-inducedenhancement of the efficiency for bromine release from thesnow occurs mainly by an increase in dry deposition veloci-ties for HOBr and BrONO2 as a result of decrease in aerody-namic resistance. However, its effect on the overall brominerelease from the snow is probably not large enough to ap-proximate the process associated with blowing/drifting snow.
On the other hand, if the bromine explosion takes place inthe interstitial air of the snowpack, it can produce a largeamount of Br2 while ozone imported from the overlyingatmosphere is lost via gas-phase bromine chemistry. Thisprocess appears likely to be happening because ozone de-struction in the interstitial air, often enhanced by sunlight,has been inferred from ozone measurements in the polarsnowpack (Peterson and Honrath, 2001; Albert et al., 2002;Helmig et al., 2007a). Our air-snowpack interaction schemeimplicitly expresses such a linkage by relating the dry depo-sition of ozone onto the snow surface to the release of Br2into the atmosphere. We note that the molar yield of Br2released to the atmosphere per mole of O3 imported fromthe ambient air and destroyed via gas-phase bromine chem-istry in the interstitial air of snowpack could be as high as100 %, if all the BrO radicals formed via Reaction (R1) un-dergo subsequent reactions only to form HOBr and BrONO2in the gas phase, heterogeneously converted to Br2 (Reac-tions R4–R5) and finally released to the atmosphere. Themolar yield of Br2 could be even higher if there is a photo-chemical ozone production in the interstitial air as a result of
www.atmos-chem-phys.net/11/3949/2011/ Atmos. Chem. Phys., 11, 3949–3979, 2011

3972 K. Toyota et al.: 3-D modeling of boundary-layer bromine and ozone in the Arctic
NO2 and/or HONO release via NO−3 photolysis in the snow-pack surface (e.g.,Grannas et al., 2007), but it would morelikely be smaller than 100 % considering a possibility of al-ternative reaction pathways such as the self-reaction of BrO(ReactionR2) to destroy ozone catalytically and the forma-tion of HBr followed by its uptake to the ice surface beforeBr2 is exported to the overlying ambient air. The pumpingof air into and out of the snowpack is expected to increasewith surface wind speed (e.g.,Cunningham and Waddington,1993), perhaps facilitating the Br2 release from the snowpackif it is associated indeed with the ozone loss in the interstitialair. While such a wind-speed dependence is virtually absentfor the ozone trigger in our semi-empirical scheme, photo-chemistry in the snowpack interstitial air could thus have astrong connection to the evolution of bromine in the polarboundary layer.
In summary, given the agreement of the simulations withobservations and the nature of the semi-empirical ozone trig-ger in our model, it seems quite plausible to assume thatbromine release and ozone destruction in the near-surfaceambient air loaded with wind-blown snow and/or in thesnowpack interstitial air are approximately collocated. A de-pendence on the wind speed associated with these processeswould likely be underrepresented in our present model con-figuration. This could be another reason for rather too lowBrO columns simulated by our model, even after applyingthe offset to correct possible contributions from BrO near thetropopause, as compared to the GOME-SLIMCAT data (seeSect.3.2–3.3).
4 Conclusions
Gas-phase and heterogeneous bromine chemistry and a sim-ple scheme of air-snowpack chemical interactions have beenimplemented in an online air-quality model, GEM-AQ, tosimulate the production of reactive bromine species andthe destruction of ozone in the springtime Arctic boundarylayer. A comparison of model runs with observations forApril 2001 suggests that Br− was retained in the snowpackubiquitously on sea ice across the high Arctic and that itwas accessible to the overlying ambient air and led to therelease of reactive bromine gases such as Br2. The timingand location of the bromine release appeared to be controlledmainly by the horizontal and vertical transport of ozone-richair masses, which facilitate the oxidation of Br− in the snow-pack perhaps via secondary oxidants (such as HOBr) formedin chain reactions involving ozone. Such transport eventsnormally result from synoptic disturbances, which also breakup the surface temperature inversion and raise temperaturesat the air-snowpack interface. The results indicate that thesnowpack could be actively releasing bromine at tempera-tures as high as−10∼−15◦C or possibly even higher. This,however, does not necessarily preclude the importance oflower temperature conditions for the Arctic bromine chem-
istry, because some pre-conditioning processes such as abrine expulsion on the top of refreezing leads may occur onlybelow−20◦C (Martin et al., 1996). While the opening andrefreezing of leads and the concomitant brine expulsion ontothe sea ice are probably the most active in the winter, thisactivity seems to be significant also during the spring (Fettet al., 1994). The overall process, viz. from the brine ex-pulsion on the sea ice to the bromine release into the atmo-sphere, may be occurring at ambient temperatures changingextensively even at the timescale of synoptic disturbances.The present model study also corroborates conclusions fromother recent studies that indicated a critical role of transportprocesses associated with synoptic disturbances in the occur-rence of high tropospheric BrO column events in the Arctic(Begoin et al., 2010) and in the Antarctic (Jones et al., 2010)using the variability in the observed ozone and BrO levels.
In our scheme of air-snow chemical interactions, the ma-jority of bromine input to the atmosphere occurs via a semi-empirically formulated coupling between Br2 release and thedry deposition of ozone on the snow/ice surface. The successof this parameterization in capturing much of the synopticbehavior of BrO indicates that it is necessary to scrutinize thechemical and physical, presumably multiple-step, processesinvolved in the transformation of Br− at the snow/ice surfaceinto volatile gaseous bromine species. We speculate that thepumping of ambient air into and out of the snowpack (e.g.,McConnell et al., 1992) and the blowing/drifting snow loftedfrom the surface (e.g.,Sander et al., 2006) are both playing arole especially under the strong surface wind.
The evaluation of our model scenarios indicated the likeli-hood that physical and/or chemical conditions on the FY seaice are more advantageous for Br2 release relative to the con-ditions on the MY sea ice. While the FY sea ice is certainlymore prone to the formation of open and refrozen leads asa source of salinity than the MY sea ice (e.g.,Kwok, 2006),the chemically labile nature of bromine assists its transportover an extended distance via successive depositions andre-emissions between the atmosphere and the surface snow(Simpson et al., 2005). Clearly, a better understanding ofthe “life cycle” of bromine in the polar ocean-atmosphere-seaice-snowpack system will increase our capacity to simu-late bromine chemistry in the high-latitude boundary layerafter polar sunrise towards the beginning of the summer andalso to predict how it will change under a different climate inthe future (e.g.,Voulgarakis et al., 2009).
In this study, we did not deal with the chemistry of chlo-rine and iodine. While they appear rather unimportant forozone budget in the springtime Arctic boundary layer, itmay not necessarily be the case under the future climate.Even under the present climate, reactive chlorine chemistryis known to be very important for the loss of hydrocarbons(but not ozone) in the springtime polar boundary layer. How-ever, quite often chlorine activation is neither collocated norsynchronized with bromine activation and the mechanism isquite uncertain (e.g.,Impey et al., 1997; Tuckermann et al.,
Atmos. Chem. Phys., 11, 3949–3979, 2011 www.atmos-chem-phys.net/11/3949/2011/
K. Toyota et al.: 3-D modeling of boundary-layer bromine and ozone in the Arctic 3973
1997). The rare occurrence of high IO levels in the spring-time Arctic is probably related to a small source strength oforganic iodine compounds of marine biogenic origin (Ma-hajan et al., 2010). However, it is not known whether thiswill remain the same under the future climate with a signifi-cantly reduced thickness of sea ice and the predominance ofthe FY sea ice (Overland and Wang, 2007; Wang and Over-land, 2009). There is also a suggestion that iodide (I−) couldcatalyze the release of bromine and chlorine from sea-salt so-lutions in certain conditions (Enami et al., 2007). Hence it ispotentially important to understand the source and the chem-istry of chlorine, bromine and iodine altogether to project thefuture of the chemical environment in the Arctic boundarylayer.
Appendix A
Air mass factors applied to simulated BrO profiles
Vertically-resolved, or box, air mass factors (AMFb) are cal-culated using the VECTOR (VECTor Orders-of-scatteringRadiative transfer) model (McLinden et al., 2002, 2006).VECTOR accounts for the diurnal variation in BrO concen-trations along the incoming solar beam, an effect that be-comes important as twilight is approached, and was foundto agree well with other models in an AMF-intercomparisonstudy (Wagner et al., 2007). The AMFb values are calculatedby successively perturbing the BrO concentration in a layerand assessing its impact on the 350 nm nadir radiance.
A background atmosphere for 15 April at 65◦ N is em-ployed. The profile is a combination of a photochemical boxmodel-calculated stratospheric BrO profile (McLinden et al.,2000, 2010), and 1 pmol mol−1 BrO in the troposphere. Theuse of a single BrO profile is justified as the AMFs are ver-tically resolved and hence independent of the profile shape,and also because BrO is optically thin. A background level ofstratospheric sulfate aerosol at the optical depth of 0.02 anda tropospheric aerosol profile with a number density profileconstant in altitude at the optical depth of 0.2 (Tomasi et al.,2007) are assumed. Based on this, a look-up table is gen-erated as a function of altitude (1 km increments), surfacealbedo (0.2 increments), and solar zenith angle (13 between0◦ and 90◦, with the majority between 75◦ and 90◦). A view-ing zenith angle (θv) is set to 0◦ (pure nadir geometry). Multi-linear interpolation is used to determine the AMFb for a givenaltitude (z), surface albedo (α, taken from broadband albedofor solar radiation in the GEM model), and solar zenith angle(θs).
Model apparent slant column densities (ASCDs) are thencalculated by vertically integrating the BrO number densi-ties, weighted with the appropriate AMFb. Finally, theseASCDs are converted to adapted vertical column densities
(AVCDs) by dividing them with geometric AMFs (AMFg):
[BrO AVCD] =
∫nBrO(z)AMFb(z,α,θs)dz
AMFg(θv,θs)(A1)
wherenBrO is a vertical profile of simulated BrO numberdensities in molecule cm−3 and AMFg is given by
AMFg(θv,θs) =1
cos(θv)+
1
cos(θs)(A2)
with θv = 0◦ assumed again. This AMFg approximatescolumn-integrated AMFs for a purely stratospheric BrO pro-file used for the GOME-SLIMCAT tropospheric BrO VCDdataset within 15 % forθs≤ 80◦.
Supplement related to this article is available online at:http://www.atmos-chem-phys.net/11/3949/2011/acp-11-3949-2011-supplement.pdf.
Acknowledgements.We thank A. Hussain and M. Neish for theirassistance with computer programing for GEM-AQ, E. Chanof Environment Canada for providing surface ozone data fromAlert, A. Platt of Environment Canada for the maintenanceof meteorological equipments at Alert GAW station, and A.-G. Hjellbrekke of Norwegian Institute for Air Research forproviding meteorological data from Zeppelin. Surface ozonedata for Barrow and Summit were obtained from NOAA/ESRLGlobal Monitoring Division (http://www.esrl.noaa.gov/gmd/)and for Zeppelin from the EMEP Chemical Coordi-nating Centre at Norwegian Institute of Air Research(http://tarantula.nilu.no/projects/ccc/emepdata.html). Ozonesondedata were obtained from World Ozone and Ultraviolet RadiationData Centre (http://exp-studies.tor.ec.gc.ca/e/WOUDC.htm). Wealso thank M. Samaali and J. Racine of the Canadian Meteoro-logical Centre for assistance with back-trajectory analysis. KT isindebted to L. Kaleschke, T. L. Zhao, H. K. Roscoe, A. Dastoor,D. Durnford, T. Kikuchi, J. Inoue, J. Zhang and B. Johnson foruseful comments and discussion. This study was supported byCanadian Foundation for Climate and Atmospheric Sciences,Ontario Ministry of the Environment, Canada Foundation forInnovation, Ontario Innovation Trust, and Natural Sciences andEngineering Research Council of Canada. Analysis of the GOMEBrO data was funded by the University of Bremen and the EuropeanUnion THALOZ project. The SLIMCAT modeling work at Leadswas supported by the UK NCEO.
Edited by: J. W. Bottenheim
References
Abbatt, J.: Interactions of atmospheric trace gases with ice surfaces:Adsorption and reaction, Chem. Rev., 103, 4783–4800, 2003.
Abbatt, J., Oldridge, N., Symington, A., Chukalovskiy, V.,McWhinney, R. D., Sjostedt, S., and Cox, R. A.: Release of gas-phase halogens by photolytic generation of OH in frozen halide-nitrate solutions: An active halogen formation mechanism?, J.Phys. Chem. A, 114, 6527–6533, 2010.
www.atmos-chem-phys.net/11/3949/2011/ Atmos. Chem. Phys., 11, 3949–3979, 2011

3974 K. Toyota et al.: 3-D modeling of boundary-layer bromine and ozone in the Arctic
Adams, J. W., Holmes, N. S., and Crowley, J. N.: Uptake and re-action of HOBr on frozen and dry NaCl/NaBr surfaces between253 and 233 K, Atmos. Chem. Phys., 2, 79–91,doi:10.5194/acp-2-79-2002, 2002.
Albert, M. R., Grannas, A. M., Bottenheim, J., Shepson, P. B., andPerron, F. E.: Processes and properties of snow-air transfer in thehigh Arctic with application to interstitial ozone at Alert, Canada,Atmos. Environ., 36, 2779–2787, 2002.
Anastasio, C. and Jordan, A. L.: Photoformation of hydroxyl radicaland hydrogen peroxide in aerosol particles from Alert, Nunavut:implications for aerosoland snowpack chemistry in the Arctic,Atmos. Environ., 38, 1153–1166, 2004.
Anastasio, C. and Mozurkewich, M.: Laboratory studies of bromideoxidation in the presence of ozone: Evidence for a glass-surfacemediated reaction, J. Atmos. Chem., 41, 135–162, 2002.
Anastasio, C., Galbavy, E. S., Hutterli, M. A., Burkhart, J. F., andFriel, D. K.: Photoformation of hydroxyl radical on snow grainsat Summit, Greenland, Atmos. Environ., 41, 5110–5121, 2007.
Anlauf, K. G., Mickle, R. E., and Trivett, N. B. A.: Measurement ofozone during Polar Sunrise Experiment 1992, J. Geophys. Res.,99, 25345–25353, 1994.
Ariya, P. A., Hopper, J. F., and Harris, G. W.: C2-C7 hydrocar-bon concentrations in Arctic snowpack interstitial air: Potentialpresence of active Br within the snowpack, J. Atmos. Chem., 34,55–64, 1999.
Atkinson, R., Baulch, D. L., Cox, R. A., Crowley, J. N., Hamp-son, R. F., Hynes, R. G., Jenkin, M. E., Rossi, M. J., Troe, J.,and IUPAC Subcommittee: Evaluated kinetic and photochemi-cal data for atmospheric chemistry: Volume II - gas phase re-actions of organic species, Atmos. Chem. Phys., 6, 3625–4055,doi:10.5194/acp-6-3625-2006, 2006.
Atkinson, R., Baulch, D. L., Cox, R. A., Crowley, J. N., Hamp-son, R. F., Hynes, R. G., Jenkin, M. E., Rossi, M. J., and Troe, J.:Evaluated kinetic and photochemical data for atmospheric chem-istry: Volume III - gas phase reactions of inorganic halogens, At-mos. Chem. Phys., 7, 981–1191,doi:10.5194/acp-7-981-2007,2007.
Barrie, L. A., Bottenheim, J. W., Schnell, R. C., Crutzen, P. J., andRasmussen, R. A.: Ozone destruction and photochemical reac-tions at polar sunrise in the lower Arctic troposphere, Nature,334, 138–141, 1988.
Barrie, L. A., Li, S.-M., Toom, D. L., Landsberger, S., and Sturges,W.: Lower tropospheric measurements of halogens, nitrates, andsulphur oxides during Polar Sunrise Experiment 1992, J. Geo-phys. Res., 99, 25453–25467, 1994.
Bartlett, W. P. and Margerum, D. W.: Temperature dependenciesof the Henry’s law constant and the aqueous phase dissociationconstant of bromine chloride, Environ. Sci. Technol., 33, 3410–3414, 1999.
Begoin, M., Richter, A., Weber, M., Kaleschke, L., Tian-Kunze,X., Stohl, A., Theys, N., and Burrows, J. P.: Satellite observa-tions of long range transport of a large BrO plume in the Arctic,Atmos. Chem. Phys., 10, 6515–6526,doi:10.5194/acp-10-6515-2010, 2010.
Berg, W., Sperry, P., Rahn, K., and Gladney, E.: Atmosphericbromine in the Arctic, J. Geophys. Res., 88(C11), 6719–6736,1983.
Bottenheim, J. W. and Chan, E.: A trajectory study into the origin ofspring time Arctic boundary layer ozone depletion, J. Geophys.
Res., 111, D19301,doi:10.1029/2006JD007055, 2006.Bottenheim, J. W., Gallant, A. G., and Brice, K. A.: Measurements
of NOy species and O3 at 82◦ N latitude, Geophys. Res. Lett.,13, 113–116, 1986.
Bottenheim, J. W., Barrie, L. A., Atlas, E., Heidt, L. E., Niki, H.,Rasmussen, R. A., and Shepson, P. B.: Depletion of lower tro-pospheric ozone during Arctic spring: The Polar Sunrise Exper-iment 1988, J. Geophys. Res., 95, 18555–18568, 1990.
Bottenheim, J. W., Fuentes, J. D., Tarasick, D. W., and Anlauf,K. G.: Ozone in the Arctic lower troposphere during winter andspring 2000 (ALERT2000), Atmos. Environ., 36, 2535–2544,2002.
Bottenheim, J. W., Netcheva, S., Morin, S., and Nghiem, S. V.:Ozone in the boundary layer air over the Arctic Ocean: mea-surements during the TARA transpolar drift 2006–2008, At-mos. Chem. Phys., 9, 4545–4557,doi:10.5194/acp-9-4545-2009,2009.
Brimblecombe, P. and Clegg, S. L.: The solubility and behaviourof acid gases in the marine aerosol, J. Atmos. Chem., 7, 1–18,1988.
Brimblecombe, P. and Clegg, S. L.: Erratum, 8, p. 95, 1989.Chance, K.: Analysis of BrO measurements from the Global Ozone
Monitoring Experiment, Geophys. Res. Lett., 25, 3335–3338,1998.
Chipperfield, M. P.: Multiannual simulations with a three-dimensional chemical transport model, J. Geophys. Res., 104,1781–1805, 1999.
Chipperfield, M. P.: New version of the TOMCAT/SLIMCAT off-line chemical transport model: Intercomparison of stratospherictracer experiments, Q. J. Roy. Meteorol. Soc., 132, 1179–1203,2006.
Chipperfield, M. P., Feng, W., and Rex, M.: Arctic ozone lossand climate sensitivity: Updated three-dimensional model study,Geophys. Res. Lett., 32, L11813,doi:10.1029/2005GL022674,2005.
Cho, H., Shepson, P. B., Barrie, L. A., Cowin, J. P., and Zaveri, R.:NMR investigation of the quasi-brine layer in ice/brine mixtures,J. Phys. Chem. B, 106, 11226–11232, 2002.
Christensen, J. H.: The Danish Eulerian hemispheric model – Athree-dimensional air pollution model used for the Arctic, At-mos. Environ., 31, 4169–4191, 1997.
Chu, L. and Anastasio, C.: Quantum yields of hydroxyl radical andnitrogen dioxide from the photolysis of nitrate on ice, J. Phys.Chem. A, 107, 9594–9602, 2003.
Chu, L. and Anastasio, C.: Formation of hydroxyl radical from thephotolysis of frozen hydrogen peroxide, J. Phys. Chem. A, 109,6264–6271, 2005.
Cote, J., Gravel, S., Mehot, A., Patoine, A., Roch, M., and Stan-iforth, A.: The Operational CMC.MRB Global EnvironmentalMultiscale (GEM) Model, Part I: Design Considerations and For-mulation, Mon. Weather Rev., 126, 1373–1395, 1998.
Cunningham, J. and Waddington, E. D.: Air flow and dry depositionof non-sea salt sulfate in polar firn: Paleoclimatic implications,Atmos. Environ., 27A, 2943–2956, 1993.
Curry, J.: On the formation of continental polar air, J. Atmos. Sci.,40, 2278–2292, 1983.
DeMore, W. B., Sander, S. P., Golden, D. M., Hampson, R. F.,Kurylo, M. J., Howard, C. J., Ravishankara, A. R., Kolb, C. E.,and Molina, M. J.: Chemical Kinetics and Photochemical Data
Atmos. Chem. Phys., 11, 3949–3979, 2011 www.atmos-chem-phys.net/11/3949/2011/

K. Toyota et al.: 3-D modeling of boundary-layer bromine and ozone in the Arctic 3975
for Use in Stratospheric Modeling, Evaluation 12, JPL Publica-tion 97-4, Jet Propulsion Laboratory, Pasadena, California, USA,1997.
Dibb, J. E., Whitlow, S. I., and Arsenault, M.: Seasonal variationsin the soluble ion content of snow at Summit. Greenland: Con-straints from three years of daily surface snow samples, Atmos.Environ., 41, 5007–5019, 2007.
Dibb, J. E., Ziemba, L. D., Luxford, J., and Beckman, P.: Bromideand other ions in the snow, firn air, and atmospheric boundarylayer at Summit during GSHOX, Atmos. Chem. Phys., 10, 9931–9942,doi:10.5194/acp-10-9931-2010, 2010.
Dieckmann, G. S., Nehrke, G., Uhlig, C., Gottlicher, J., Gerland,S., Granskog, M. A., and Thomas, D. N.: Brief Communica-tion: Ikaite (CaCO3·6H2O) discovered in Arctic sea ice, TheCryosphere, 4, 227–230,doi:10.5194/tc-4-227-2010, 2010.
Douglas, T. A. and Sturm, M.: Arctic haze, mercury and the chem-ical composition of snow across northwestern Alaska, Atmos.Environ., 38, 805–820, 2004.
Drobot, S. D. and Anderson, M. R.: Comparison of interan-nual snowmelt-onset dates with atmospheric conditions, Ann.Glaciol., 33, 79–84, 2001a.
Drobot, S. D. and Anderson, M. R.: An improved method for de-termining snowmelt onset dates over Arctic sea ice using scan-ning multichannel microwave radiometer and Special SensorMicrowave/Imager data, J. Geophys. Res., 106, 24033–24049,2001b.
Dvortsov, V. L., Geller, M. A., Solomon, S., Schauffler, S. M., Atlas,E. L., and Blake, D. R.: Rethinking reactive halogen budgets inthe midlatitude lower stratosphere, Geophys. Res. Lett., 26(12),1699–1702, 1999.
Eicken, H., Krouse, H. R., Kadko, D., and Perovich, D. K.: Tracerstudies of pathways and rates of meltwater transport throughArctic summer sea ice, J. Geophys. Res., 107(C10), 8046,doi:10.1029/2000JC000583, 2002.
Enami, S., Vecitis, C. D., Cheng, J., Hoffmann, M. R., and Colussi,A. J.: Global inorganic source of atmospheric bromine, J. Phys.Chem. A, 111, 8749–8752, 2007.
Fan, S.-M. and Jacob, D. J.: Surface ozone depletion in Arcticspring sustained by bromine reactions on aerosols, Nature, 359,522–524, 1992.
Feng, W., Chipperfield, M. P., Dorf, M., Pfeilsticker, K., and Ri-caud, P.: Mid-latitude ozone changes: studies with a 3-D CTMforced by ERA-40 analyses, Atmos. Chem. Phys., 7, 2357–2369,doi:10.5194/acp-7-2357-2007, 2007.
Fett, R. W., Burk, S. D., Thompson, W. T., and Kozo, T. L.: En-vironmental phenomena of the Beaufort Sea observed during theLeads Experiment, B. Am. Meteorol. Soc., 75, 2131–2145, 1994.
Fickert, S., Adams, J. W., and Crowley, J. N.: Activation of Br2 andBrCl via uptake of HOBr onto aqueous salt solutions, J. Geophys.Res., 104, 23719–23727, 1999.
Fitzenberger, R., Bosch, H., Camy-Peyret, C., Chipperfield, M. P.,Harder, H., Platt, U., Sinnhuber, B.-M., Wagner, T., and Pfeil-sticker, K.: First profile measurements of tropospheric BrO, Geo-phys. Res. Lett., 27, 2921–2924, 2000.
Foster, K. L., Plastridge, R. A., Bottenheim, J. W., Shepson, P. B.,Finlayson-Pitts, B. J., and Spicer, C. W.: The role of Br2 andBrCl in surface ozone destruction at polar sunrise, Science, 291,471–474, 2001.
Frenzel, A., Scheer, V., Sikorski, R., George, C., Behnke, W., and
Zetzsch, C.: Heterogeneous interconversion reactions of BrNO2,ClNO2, Br2, and Cl2, J. Phys. Chem. A, 102, 1329–1337, 1998.
Frieß, U., Wagner, T., Pundt, I., Pfeilsticker, K., and Platt, U.: Spec-troscopic measurements of tropospheric iodine oxide at Neu-mayer Station, Antarctica, Geophys. Res. Lett., 28, 1941–1944,2001.
Frieß, U., Hollwedel, J., Koonig-Langlo, G., Wagner, T., and Platt,U.: Dynamics and chemistry of tropospheric bromine explosionevents in the Antarctic coastal region, J. Geophys. Res., 109,D06305,doi:10.1029/2003JD004133, 2004.
Gauthier, P., Charette, C., Fillion, L., Koclas, P., and Laroche,S.: Implementation of a 3-D assimilation system at the Cana-dian Meteorological Centre, Part I: The global analysis, Atmos.-Ocean, 37, 103–156, 1999.
Gjessing, Y. T.: Episodic variations of snow contamination of anArctic snowfield, Atmos. Environ., 11, 643–647, 1977.
Gong, S. L., Walmsley, J. L., Barrie, L. A., and Hopper, J. F.: Mech-anisms for surface ozone depletion and recovery during polarsunrise, Atmos. Environ., 31, 969–981, 1997.
Gong, S. L., Barrie, L. A., Blanchet, J. P., von Salzen, K.,Lohmann, U., Lesins, G., Spacek, L., Zhang, L. M., Girard,E., Lin, H., Leaitch, R., Leighton, H., Chylek, P., and Huang,P.: Canadian Aerosol Module: A size-segregated simulation ofatmospheric aerosol processes for climate and air quality mod-els 1, Module development, J. Geophys. Res., 108(D1), 4007,doi:10.1029/2001JD002002, 2003.
Grannas, A. M., Jones, A. E., Dibb, J., Ammann, M., Anastasio, C.,Beine, H. J., Bergin, M., Bottenheim, J., Boxe, C. S., Carver, G.,Chen, G., Crawford, J. H., Domine, F., Frey, M. M., Guzman,M. I., Heard, D. E., Helmig, D., Hoffmann, M. R., Honrath, R.E., Huey, L. G., Hutterli, M., Jacobi, H. W., Klan, P., Lefer, B.,McConnell, J., Plane, J., Sander, R., Savarino, J., Shepson, P.B., Simpson, W. R., Sodeau, J. R., von Glasow, R., Weller, R.,Wolff, E. W., and Zhu, T.: An overview of snow photochem-istry: evidence, mechanisms and impacts, Atmos. Chem. Phys.,7, 4329–4373,doi:10.5194/acp-7-4329-2007, 2007.
Hausmann, M. and Platt, U.: Spectroscopic measurement ofbromine oxide and ozone in the high Arctic during Polar SunriseExperiment 1992, J. Geophys. Res., 99, 25399–25413, 1994.
Helmig, D., Boulter, J., David, D., Birks, J. W., Cullen, N. J., Stef-fen, K., Johnson, B. J., and Oltmans, S. J.: Ozone and meteoro-logical boundary-layer conditions at Summit, Greenland, during3–21 June 2000, Atmos. Environ., 36, 2595–2608, 2002.
Helmig, D., Bocquet, F., Cohen, L., and Oltmans, S. J.: Ozoneuptake to the polar snowpack at Summit, Greenland, Atmos. En-viron., 41, 5061–5076, 2007a.
Helmig, D., Ganzeveld, L., Butler, T., and Oltmans, S. J.: The roleof ozone atmosphere-snow gas exchange on polar, boundary-layer tropospheric ozone - a review and sensitivity analysis, At-mos. Chem. Phys., 7, 15–30,doi:10.5194/acp-7-15-2007, 2007b.
Hendrick, F., Van Roozendael, M., Chipperfield, M. P., Dorf, M.,Goutail, F., Yang, X., Fayt, C., Hermans, C., Pfeilsticker, K.,Pommereau, J.-P., Pyle, J. A., Theys, N., and De Maziere,M.: Retrieval of stratospheric and tropospheric BrO profilesand columns using ground-based zenith-sky DOAS observa-tions at Harestua, 60◦ N, Atmos. Chem. Phys., 7, 4869–4885,doi:10.5194/acp-7-4869-2007, 2007.
Holt, B. and Digby, S. A.: Processes and Imagery of First-Year FastSea Ice During the Melt Season, J. Geophys. Res., 90, 5045–
www.atmos-chem-phys.net/11/3949/2011/ Atmos. Chem. Phys., 11, 3949–3979, 2011

3976 K. Toyota et al.: 3-D modeling of boundary-layer bromine and ozone in the Arctic
5062, 1985.Hopper, J. F. and Hart, W.: Meteorological aspects of the 1992 Polar
Sunrise Experiment, J. Geophys. Res., 99, 25315–25328, 1994.Hopper, J. F., Barrie, L. A., Silis, A., Hart, W., Gallant, A. J., and
Dryfhout, H.: Ozone and meteorology during the 1994 PolarSunrise Experiment, J. Geophys. Res., 103, 1481–1492, 1998.
Hossaini, R., Chipperfield, M. P., Monge-Sanz, B. M., Richards,N. A. D., Atlas, E., and Blake, D. R.: Bromoform and dibro-momethane in the tropics: A 3D model study of chemistry andtransport, Atmos. Chem. Phys., 10, 719–735,doi:10.5194/acp-10-719-2010, 2010.
Huff, A. K. and Abbatt, J. P. D.: Kinetics and product yields in theheterogeneous reactions of HOBr with ice surfaces containingNaBr and NaCl, J. Phys. Chem. A, 106(21), 5279–5287, 2002.
Impey, G. A., Shepson, P. B., Barrie, L. A., and Anlauf, K. G.:Measurements of photolyzable chlorine and bromine during thePolar Sunrise Experiment 1995, J. Geophys. Res., 102, 16005–16010, 1997.
IUPAC: IUPAC Subcommittee on Gas Kinetic Data Evaluation,Data Sheet oBrOx15, 3rd July 2005,http://www.iupac-kinetic.ch.cam.ac.uk/, 2005.
Jacobi, H.-W., Morin, S., and Bottenheim, J. W.: Observation ofwidespread depletion of ozone in the springtime boundary layerof the central Arctic linked to mesoscale synoptic conditions, J.Geophys. Res., 115, D17302,doi:10.1029/2010JD013940, 2010.
Jobson, B. T., Niki, H., Yokouchi, Y., Bottenheim, J., Hopper, F.,and Leaitch, R.: Measurements of C2-C6 hydrocarbons duringthe Polar Sunrise 1992 Experiment: Evidence for Cl atom andBr atom chemistry, J. Geophys. Res., 99, 25355–25368, 1994.
Jockel, P., Tost, H., Pozzer, A., Bruhl, C., Buchholz, J., Ganzeveld,L., Hoor, P., Kerkweg, A., Lawrence, M. G., Sander, R., Steil,B., Stiller, G., Tanarhte, M., Taraborrelli, D., van Aardenne, J.,and Lelieveld, J.: The atmospheric chemistry general circulationmodel ECHAM5/MESSy1: consistent simulation of ozone fromthe surface to the mesosphere, Atmos. Chem. Phys., 6, 5067–5104,doi:10.5194/acp-6-5067-2006, 2006.
Jones, A. E., Anderson, P. S., Begoin, M., Brough, N., Hutterli, M.A., Marshall, G. J., Richter, A., Roscoe, H. K., and Wolff, E. W.:BrO, blizzards, and drivers of polar tropospheric ozone depletionevents, Atmos. Chem. Phys., 9, 4639–4652,doi:10.5194/acp-9-4639-2009, 2009.
Jones, A. E., Anderson, P. S., Wolff, E. W., Roscoe, H. K., Mar-shall, G. J., Richter, A., Brough, N., and Colwell, S. R.: Verticalstructure of Antarctic tropospheric ozone depletion events: char-acteristics and broader implications, Atmos. Chem. Phys., 10,7775–7794,doi:10.5194/acp-10-7775-2010, 2010.
Kaleschke, L., Richter, A., Burrows, J., Afe, O., Heygster, G.,Notholt, J., Rankin, A. M., Roscoe, H. K., Hollwedel, J., Wag-ner, T., and Jacobi, H. W.: Frost flowers on sea ice as a sourceof sea salt and their influence on tropospheric halogen chemistry,Geophys. Res. Lett., 31, L16114,doi:10.1029/2004GL020655,2004.
Kaminski, J. W., Neary, L., Struzewska, J., McConnell, J. C., Lupu,A., Jarosz, J., Toyota, K., Gong, S. L., Cote, J., Liu, X., Chance,K., and Richter, A.: GEM-AQ, an on-line global multiscalechemical weather modelling system: model description and eval-uation of gas phase chemistry processes, Atmos. Chem. Phys., 8,3255–3281,doi:10.5194/acp-8-3255-2008, 2008.
Kirchner, U., Benter, T. H., and Schindler, R. N.: Experimental ver-
ification of gas phase bromine enrichment in reactions of HOBrwith sea salt doped ice surfaces, Ber. Bunsenges. Phys. Chem.,101, 975–977, 1997.
Knepp, T. N., Bottenheim, J., Carlsen, M., Carlson, D., Donohoue,D., Friederich, G., Matrai, P. A., Netcheva, S., Perovich, D. K.,Santini, R., Shepson, P. B., Simpson, W., Valentic, T., Williams,C., and Wyss, P. J.: Development of an autonomous sea icetethered buoy for the study of ocean-atmosphere-sea ice-snowpack interactions: the O-buoy, Atmos. Meas. Tech., 3, 249-261,doi:10.5194/amt-3-249-2010, 2010.
Koop, T., Kapilashrami, A., Molina, L. T., and Molina, M. J.: Phasetransitions of sea-salt/water mixtures at low temperatures: Impli-cations for ozone chemistry in the polar marine boundary layer,J. Geophys. Res., 105, 26393–26402, 2000.
Kreher, K., Johnston, P. V., Wood, S. W., Nardi, B., and Platt, U.:Ground-based measurements of tropospheric and stratosphericBrO at Arrival Heights, Antarctica, Geophys. Res. Lett., 24,3021–3024, 1997.
Kwok, R.: Annual cycles of multiyear sea ice coverage of theArctic Ocean: 1999–2003, J. Geophys. Res., 109, C11004,doi:10.1029/2004JC002238, 2004.
Kwok, R.: Contrasts in sea ice deformation and production in theArctic seasonal and perennial ice zones, J. Geophys. Res., 111,C11S22,doi:10.1029/2005JC003246, 2006.
Kwok, R., Cunningham, G. F., and Yueh, S.: Area balance of theArctic Ocean perennial ice zone: October 1996 to April 1997, J.Geophys. Res., 104, 25747–25759, 1999.
Langner, J., Robertson, L., Persson, C., and Ullerstig, A.: Validationof the operational emergency response model at the Swedish Me-teorological and Hydrological Institute using data from etex andthe chernobyl accident, Atmos. Environ., 32, 4325–4333, 1998.
Lax, E.: Taschenbuch fur Chemiker und Physiker, Springer Verlag,Berlin, 1969.
Lehrer, E., Wagenbach, D., and Platt, U.: Aerosol chemi-cal composition during tropospheric ozone depletion at NyAlesund/Svalbard, Tellus, 49B, 486–495, 1997.
Lehrer, E., Honninger, G., and Platt, U.: A one dimensional modelstudy of the mechanism of halogen liberation and vertical trans-port in the polar troposphere, Atmos. Chem. Phys., 4, 2427–2440,doi:10.5194/acp-4-2427-2004, 2004.
Li, S.-M., Yokouchi, Y., Barrie, L. A., Muthuramu, K., Shepson,P. B., Bottenheim, J. W., Sturges, W. T., and Landsberger, S.: Or-ganic and inorganic bromine compounds and their compositionin the Arctic troposphere during polar sunrise, J. Geophys. Res.,99, 25415–25428, 1994.
Liang, Q., Stolarski, R. S., Kawa, S. R., Nielsen, J. E., Douglass, A.R., Rodriguez, J. M., Blake, D. R., Atlas, E. L., and Ott, L. E.:Finding the missing stratospheric Bry: a global modeling studyof CHBr3 and CH2Br2, Atmos. Chem. Phys., 10, 2269–2286,doi:10.5194/acp-10-2269-2010, 2010.
Light, B., Maykut, G. A., and Grenfell, T. C.: Effects of temperatureon the microstructure of first-year Arctic sea ice, J. Geophys.Res., 108(C2), 3051,doi:10.1029/2001JC000887, 2003.
Lupu, A., Kaminski, J. W., Neary, L., McConnell, J. C., Toyota,K., Rinsland, C. P., Bernath, P. F., Walker, K. A., Boone, C.D., Nagahama, Y., and Suzuki, K.: Hydrogen cyanide in theupper troposphere: GEM-AQ simulation and comparison withACE-FTS observations, Atmos. Chem. Phys., 9, 4301–4313,doi:10.5194/acp-9-4301-2009, 2009.
Atmos. Chem. Phys., 11, 3949–3979, 2011 www.atmos-chem-phys.net/11/3949/2011/
K. Toyota et al.: 3-D modeling of boundary-layer bromine and ozone in the Arctic 3977
Mahajan, A. S., Shaw, M., Oetjen, H., Hornsby, K. E., Carpen-ter, L. J., Kaleschke, L., TianKunze, X., Lee, J. D., Moller,S. J., Edwards, P., Commane, R., Ingham, T., Heard, D. E.,and Plane, J. M. C.: Evidence of reactive iodine chemistryin the Arctic boundary layer, J. Geophys. Res., 115, D20303,doi:10.1029/2009JD013665, 2010.
Martin, S., Yu, Y., and Drucker, R.: The temperature dependenceof frost flower growth on laboratory sea ice and the effect of theflowers on infrared observations of the surface, J. Geophys. Res.,101(C5), 12111–12125, 1996.
McConnell, J. C., Henderson, G. S., Barrie, L., Bottenheim, J., Niki,H., Langford, C. H., and Templeton, E. M. J.: Photochemicalbromine production implicated in Arctic boundary-layer ozonedepletion, Nature, 355, 150–152, 1992.
McElroy, C. T., McLinden, C. A., and McConnell, J. C.: Evidencefor bromine monoxide in the free troposphere during the Arcticpolar sunrise, Nature, 397, 338–341, 1999.
McLinden, C. A., Olsen, S., Hannegan, B., Wild, O., Prather, M. J.,and Sundet, J.: Stratospheric ozone in 3-D models: A simplechemistry and the cross-tropopause flux, J. Geophys. Res., 105,14653–14665, 2000.
McLinden, C. A., McConnell, J. C., Griffioen, E., and McElroy,C. T.: A vector radiative transfer model for the Odin/OSIRISproject, Can. J. Phys., 80, 375–393, 2002.
McLinden, C. A., Haley, C. S., and Sioris, C. E.: Diurnal effectsin limb scatter observations, J. Geophys. Res., 111, D14302,doi:10.1029/2005JD006628, 2006.
McLinden, C. A., Haley, C. S., Lloyd, N., Hendrick, F., Rozanov,A., Sinnhuber, B.-M., Goutail, F., Degenstein, D., Llewellyn, E.,Sioris, C. E., Roozendael, M. V., Pommereau, J. P., Lotz, W., andBurrows, J. P.: Odin and OSIRIS observations of stratosphericBrO: Retrieval methodology, climatology, and inferred Bry, J.Geophys. Res., 115, D15308,doi:10.1029/2009JD012488, 2010.
Michalowski, B. A., Francisco, J. S., Li, S. M., Barrie, L. A., Bot-tenheim, J. W., and Shepson, P. B.: A computer model study ofmultiphase chemistry in the Arctic boundary layer during polarsunrise, J. Geophys. Res., 105, 15131–15145, 2000.
Millero, F. J., Feistel, R., Wright, D. G., and McDougall, T. J.:The composition of Standard Seawater and the definition of theReference-Composition Salinity Scale, Deep-Sea Res. I, 55, 50–72, 2008.
Monge-Sanz, B., Chipperfield, M. P., Simmons, A., and Uppala,S.: Mean age of air and transport in a CTM: Comparison ofdifferent ECMWF analyses, Geophys. Res. Lett., 34, L04801,doi:10.1029/2006GL028515, 2007.
Morin, S., Honninger, G., Staebler, R. M., and Bottenheim, J. W.:A high time resolution study of boundary layer ozone chemistryand dynamics over the Arctic Ocean near Alert, Nunavut, Geo-phys. Res. Lett., 32, L08809,doi:10.1029/2004GL022098, 2005.
Morin, S., Marion, G. M., von Glasow, R., Voisin, D., Bouchez, J.,and Savarino, J.: Precipitation of salts in freezing seawater andozone depletion events: a status report, Atmos. Chem. Phys., 8,7317–7324,doi:10.5194/acp-8-7317-2008, 2008.
Mozurkewich, M.: Mechanisms for the release of halogens fromsea-salt particles by free radical reactions, J. Geophys. Res., 100,14199–14207, 1995.
Murayama, S., Nakazawa, T., Tanaka, M., Aoki, S., andKawaguchi, S.: Variations in tropospheric ozone concentrationover Syowa Station, Antarctica, Tellus, 44B, 262–272, 1992.
Oldridge, N. W. and Abbatt, J. P. D.: Formation of gas-phasebromine from interaction of ozone with frozen and liquidNaCl/NaBr solutions: Quantitative separation of surficial chem-istry from bulk-phase reaction, J. Phys. Chem. A, 115, 2590–2598,doi:10.1021/jp200074u, 2011.
Oltmans, S. J.: Surface ozone measurements in clean air, J. Geo-phys. Res., 86, 1174–1180, 1981.
Oltmans, S. J., Schnell, R. C., Sheridan, P. J., Peterson, R. E., Li,S.-M., Winchester, J. W., Tans, P. P., Sturges, W. T., Kahl, J. D.,and Barrie, L. A.: Seasonal surface ozone and filterable brominerelationship in the high Arctic, Atmos. Environ., 23, 2431–2441,1989.
O’Neill, N. T., Campanelli, M., Lupu, A., Thulasiraman, S., Reid,J. S., Aube, M., Neary, L., Kaminski, J. W., and McConnell,J. C.: Evaluation of the GEM-AQ air quality model during theQuebec smoke event of 2002: Analysis of extensive and inten-sive optical disparities, Atmos. Environ., 40, 3737–3749, 2006.
Oum, K. W., Lakin, M. J., and Finlayson-Pitts, B. J.: Bromine acti-vation in the troposphere by the dark reaction of O3 with seawa-ter ice, Geophys. Res. Lett., 25, 3923–3926, 1998.
Overland, J. E. and Wang, M.: Future regional Arc-tic sea ice declines, Geophys. Res. Lett., 34, L17705,doi:10.1029/2007GL030808, 2007.
Perovich, D. K. and Richter-Menge, J. A.: Surface characteristicsof lead ice, J. Geophys. Res., 99, 16341–16350, 1994.
Peterson, M. and Honrath, R.: Observations of rapid photochemicaldestruction of ozone in snowpack interstitial air, Geophys. Res.Lett., 28, 511–514, 2001.
Piot, M. and von Glasow, R.: The potential importance of frostflowers, recycling on snow, and open leads for ozone depletionevents, Atmos. Chem. Phys., 8, 2437–2467,doi:10.5194/acp-8-2437-2008, 2008.
Pohler, D., Vogel, L., Frieß, U., and Platt, U.: Observation of halo-gen species in the Amundsen Gulf, Arctic, by active long-pathdifferential optical absorption spectroscopy, Proc. Nat. Acad.Sci., 107, 6582–6587,doi:10.1073/pnas.0912231107, 2010.
Ramacher, B., Rudolph, J., and Koppmann, R.: Hydrocarbon mea-surements during tropospheric ozone depletion events: Evidencefor halogen atom chemistry, J. Geophys. Res., 104, 3633–3653,1999.
Rankin, A. M., Wolff, E. W., and Martin, S.: Frost flowers: Im-plications for tropospheric chemistry and ice core interpretation,J. Geophys. Res., 107(D23), 4683,doi:10.1029/2002JD002492,2002.
Richter, A.: GOME tropospheric BrO columns Version 1, avail-able at:http://www.iup.uni-bremen.de/doas/gomebro data.htm,2006.
Richter, A., Wittrock, F., Eisinger, M., and Burrows, J. P.: GOMEobservations of tropospheric BrO in northern hemispheric springand summer 1997, Geophys. Res. Lett., 25, 2683–2686, 1998.
Richter, A., Wittrock, F., Ladstatter-Weißenmayer, A., and Bur-rows, J.: GOME measurements of stratospheric and troposphericBrO, Adv. Space Res., 29, 1667–1672, 2002.
Richter-Menge, J. A. and Jones, K. F.: The tensible strength of first-year sea ice, J. Glaciol., 39, 609–618, 1993.
Sadanaga, Y., Hirokawa, J., and Akimoto, H.: Formation of molec-ular chlorine in dark condition: Heterogeneous reaction of ozonewith sea salt in the presence of ferric ion, Geophys. Res. Lett.,28, 4433–4436, 2001.
www.atmos-chem-phys.net/11/3949/2011/ Atmos. Chem. Phys., 11, 3949–3979, 2011

3978 K. Toyota et al.: 3-D modeling of boundary-layer bromine and ozone in the Arctic
Saiz-Lopez, A., Mahajan, A. S., Salmon, R. A., Bauguitte, S. J.-B.,Jones, A. E., Roscoe, H. K., and Plane, J. M. C.: Boundary layerhalogens in coastal Antarctica, Science, 317, 348–351, 2007.
Salawitch, R. J., Weisenstein, D. K., Kovalenko, L. J., Sioris, C. E.,Wennberg, P. O., Chance, K., Ko, M. K. W., and McLinden,C. A.: Sensitivity of ozone to bromine in the lower stratosphere,Geophys. Res. Lett., 32, L05811,doi:10.1029/2004GL021504,2005.
Salawitch, R. J., Canty, T., Kurosu, T., Chance, K., Liang, Q.,da Silva, A., Pawson, S., Nielsen, J. E., Rodriguez, J., Bhartia, P.,Liu, X., Huey, L., Liao, J., Stickel, R., Simpson, W., Donohoue,D., Weinheimer, A., Flocke, F., Knapp, D., Montzka, D., Neu-man, J., Nowak, J., Ryerson, T., Oltmans, S., Blake, D., Atlas,E. L., Kinnison, D., Tilmes, S., Pan, L., Hendrick, F., Roozen-dael, M. V., Kreher, K., Johnston, P., Gao, R. S., Johnson, B.,Bui, T., Chen, G., Pierce, R. B., Crawford, J. H., and Jacob, D. J.:A New Interpretation of Total Column BrO during Arctic Spring,Geophys. Res. Lett., 37, L21805,doi:10.1029/2010GL043798,2010.
Sammonds, P. R., Murrell, S. A. F., and Rist, M. A.: Fracture ofmultiyear sea ice, J. Geophys. Res., 103, 21795–21815, 1998.
Sander, R. and Morin, S.: Introducing the bromide/alkalinity ratiofor a follow-up discussion on “Precipitation of salts in freezingseawater and ozone depletion events: a status report”, by Morinet al., published in Atmos. Chem. Phys., 8, 7317-7324, 2008,Atmos. Chem. Phys., 10, 7655-7658,doi:10.5194/acp-10-7655-2010, 2010.
Sander, R., Kerkweg, A., Jockel, P., and Lelieveld, J.: Technicalnote: The new comprehensive atmospheric chemistry moduleMECCA, Atmos. Chem. Phys., 5, 445–450,doi:10.5194/acp-5-445-2005, 2005.
Sander, R., Burrows, J., and Kaleschke, L.: Carbonate precipita-tion in brine - a potential trigger for tropospheric ozone depletionevents, Atmos. Chem. Phys., 6, 4653–4658,doi:10.5194/acp-6-4653-2006, 2006.
Schoeberl, M. R., Douglass, A. R., Zhu, Z., and Pawson, S.: Acomparison of the lower stratospheric age spectra derived froma general circulation model and two data assimilation systems,J. Geophys. Res., 108(D3), 4113,doi:10.1029/2002JD002652,2003.
Schonhardt, A., Richter, A., Wittrock, F., Kirk, H., Oetjen, H.,Roscoe, H. K., and Burrows, J. P.: Observations of iodinemonoxide columns from satellite, Atmos. Chem. Phys., 8, 637–653,doi:10.5194/acp-8-637-2008, 2008.
Semb, A., Brækkan, R., and Joranger, E.: Major ions in Spitsbergensnow samples, Geophys. Res. Lett., 11, 445–448, 1984.
Shupe, M. D., Matrosov, S. Y., and Uttal, T.: Arctic mixed-phasecloud properties derived from surface-based sensors at SHEBA,J. Atmos. Sci., 63, 697–711, 2006.
Simpson, W. R., Alvarez-Aviles, L., Douglas, T. A., Sturm,M., and Domine, F.: Halogens in the coastal snow packnear Barrow, Alaska: Evidence for active bromine air-snowchemistry during springtime, Geophys. Res. Lett., 32, L04811,doi:10.1029/2004GL021748, 2005.
Simpson, W. R., Carlson, D., Honninger, G., Douglas, T. A., Sturm,M., Perovich, D., and Platt, U.: First-year sea-ice contact predictsbromine monoxide (BrO) levels at Barrow, Alaska better thanpotential frost flower contact, Atmos. Chem. Phys., 7, 621–627,doi:10.5194/acp-7-621-2007, 2007a.
Simpson, W. R., von Glasow, R., Riedel, K., Anderson, P., Ariya, P.,Bottenheim, J., Burrows, J., Carpenter, L., Frieß, U., Goodsite,M. E., Heard, D., Hutterli, M., Jacobi, H.-W., Kaleschke, L.,Neff, B., Plane, J., Platt, U., Richter, A., Roscoe, H., Sander, R.,Shepson, P., Sodeau, J., Steffen, A., Wagner, T., and Wolff, E.:Halogens and their role in polar boundary-layer ozone depletion,Atmos. Chem. Phys., 7, 4375–4418, 2007b.
Sioris, C. E., Kovalenko, L. J., McLinden, C. A., Salawitch,R. J., Roozendael, M. V., Goutail, F., Dorf, M., Pfeilsticker, K.,Chance, K., von Savigny, C., Liu, X., Kurosu, T. P., Pommereau,J.-P., Bosch, H., and Frerick, J.: Latitudinal and vertical distribu-tion of bromine monoxide in the lower stratosphere from Scan-ning Imaging Absorption Spectrometer for Atmospheric Char-tography limb scattering measurements, J. Geophys. Res., 111,D14301,doi:10.1029/2005JD006479, 2006.
Sjostedt, S. J., Huey, L. G., Tanner, D. J., Peischl, J., Chen, G., Dibb,J. E., Lefer, B., Hutterli, M. A., Beyersdorf, A. J., Blake, N. J.,Blake, D. R., Sueper, D., Ryerson, T., Burkhart, J., and Stohl,A.: Observations of hydroxyl and the sum of peroxy radicals atSummit, Greenland during summer 2003, Atmos. Environ., 41,5122–5137, 2007.
Solberg, S., Schmidbauer, N., Semb, A., Stordal, F., and Hov, O.:Boundary-layer ozone depletion as seen in the Norwegian Arcticin spring, J. Atmos. Chem., 23, 301–332, 1996.
Spicer, C. W., Plastridge, R. A., Foster, K. L., Finlayson-Pitts, B. J.,Bottenheim, J. W., Grannas, A. M., and Shepson, P. B.: Molec-ular halogens before and during ozone depletion events in theArctic at polar sunrise: concentrations and sources, Atmos. Env-iron., 36, 2721–2731, 2002.
Steffen, A., Douglas, T., Amyot, M., Ariya, P., Aspmo, K., Berg,T., Bottenheim, J., Brooks, S., Cobbett, F., Dastoor, A., Dom-mergue, A., Ebinghaus, R., Ferrari, C., Gardfeldt, K., Goodsite,M. E., Lean, D., Poulain, A. J., Scherz, C., Skov, H., Sommar,J., and Temme, C.: A synthesis of atmospheric mercury deple-tion event chemistry in the atmosphere and snow, Atmos. Chem.Phys., 8, 1445–1482,doi:10.5194/acp-8-1445-2008, 2008.
Steffen, K. and DeMaria, T.: Surface energy fluxes of Arctic win-ter sea ice in Barrow Strait, J. Appl. Meteorol., 35, 2067–2079,1996.
Steffen, K., Key, J., Cavalieri, D. J., Comiso, J., Gloersen, P., Ger-main, K. S., and Rubinstein, I.: The Estimation of Geophysi-cal Parameters Using Passive Microwave Algorithms, in: Mi-crowave Remote Sensing of Sea Ice, edited by: Carsey, F. D.,vol. 68, chap. 10, Geophysical Monograph, American Geophys-ical Union, 1992.
Stockwell, W. R. and Lurmann, F. W.: Intercomparison of theADOM and RADM Gas-Phase Chemistry Mechanisms, Re-port prepared for the Electric Power Research Institute, ElectricPower Research Institute, Palo Alto, California, USA, 1989.
Stroeve, J., Markus, T., Meier, W. N., and Miller, J.: Recent changesin the Arctic melt season, Ann. Glaciol., 44, 367–374, 2006.
Strong, C., Fuentes, J. D., Davis, R. E., and Bottenheim, J. W.:Thermodynamic attributes of Arctic boundary layer ozone de-pletion, Atmos. Environ., 36, 2641–2652, 2002.
Struzewska, J. and Kaminski, J. W.: Formation and transport ofphotooxidants over Europe during the July 2006 heat wave -observations and GEM-AQ model simulations, Atmos. Chem.Phys., 8, 721–736,doi:10.5194/acp-8-721-2008, 2008.
Sturges, W. T. and Barrie, L. A.: Chlorine, bromine and iodine in
Atmos. Chem. Phys., 11, 3949–3979, 2011 www.atmos-chem-phys.net/11/3949/2011/
K. Toyota et al.: 3-D modeling of boundary-layer bromine and ozone in the Arctic 3979
arctic aerosols, Atmos. Environ., 22, 1179–1194, 1988.Tang, T. and McConnell, J. C.: Autocatalytic release of bromine
from Arctic snow pack during polar sunrise, Geophys. Res. Lett.,23, 2633–2636, 1996.
Tarasick, D. W. and Bottenheim, J. W.: Surface ozone depletionepisodes in the Arctic and Antarctic from historical ozonesonderecords, Atmos. Chem. Phys., 2, 197–205,doi:10.5194/acp-2-197-2002, 2002.
Theys, N., Van Roozendael, M., Errera, Q., Hendrick, F., Daerden,F., Chabrillat, S., Dorf, M., Pfeilsticker, K., Rozanov, A., Lotz,W., Burrows, J. P., Lambert, J.-C., Goutail, F., Roscoe, H. K.,and De Maziere, M.: A global stratospheric bromine monoxideclimatology based on the BASCOE chemical transport model,Atmos. Chem. Phys., 9, 831–848,doi:10.5194/acp-9-831-2009,2009.
Thomas, J. L., Stutz, J., Lefer, B., Huey, L. G., Toyota, K.,Dibb, J. E., and von Glasow, R.: Modeling chemistry in andabove snow at Summit, Greenland Part 1: Model descriptionand results, Atmos. Chem. Phys. Discuss., 10, 30 927–30 970,doi:10.5194/acpd-10-30927-2010, 2010.
Tomasi, C., Vitale, V., Lupi, A., Carmine, C. D., Campanelli, M.,Herber, A., Treffeisen, R., Stone, R. S., Andrews, E., Sharma, S.,Radionov, V., von Hoyningen-Huene, W., Stebel, K., Hansen,G. H., Myhre, C. L., Wehrli, C., Aaltonen, V., Lihavainen,H., Virkkula, A., Hillamo, R., Strom, J., Toledano, C., Ca-chorro, V. E., Ortiz, P., de Frutos, A. M., Blindheim, S., Frioud,M., Gausa, M., Zielinski, T., Petelski, T., and Yamanouchi, T.:Aerosols in polar regions: A historical overview based on opticaldepth and in situ observations, J. Geophys. Res., 112, D16205,doi:10.1029/2007JD008432, 2007.
Toom-Sauntry, D. and Barrie, L. A.: Chemical composition ofsnowfall in the high Arctic: 1990-1994, Atmos. Envion., 36,2683–2693, 2002.
Toyota, K., Kanaya, Y., Takahashi, M., and Akimoto, H.: Abox model study on photochemical interactions between VOCsand reactive halogen species in the marine boundary layer, At-mos. Chem. Phys., 4, 1961–1987,doi:10.5194/acp-4-1961-2004,2004.
Tuckermann, M., Ackermann, R., Goltz, C., Lorenzen-schmidt,H., Senne, T., Stutz, J., Trost, B., Unold, W., and Platt, U.:DOAS-observation of halogen radical-catalysed arctic boundarylayer ozone destruction during the ARCTOC-campaigns 1995and 1996 in Ny-Alesund, Spitsbergen, Tellus, 49B, 533–555,1997.
Vasilkov, A. P., Joiner, J., Haffner, D., Bhartia, P. K., and Spurr,R. J. D.: What do satellite backscatter ultraviolet and visi-ble spectrometers see over snow and ice? A study of cloudsand ozone using the A-train, Atmos. Meas. Tech., 3, 619–629,doi:10.5194/amt-3-619-2010, 2010.
Vogt, R., Crutzen, P. J., and Sander, R.: A mechanism for halo-gen release from sea-salt aerosol in the remote marine boundarylayer, Nature, 383, 327–330, 1996.
Voulgarakis, A., Yang, X., and Pyle, J. A.: How different wouldtropospheric oxidation be over an ice-free Arctic?, Geophys. Res.Lett., 36, L23807,doi:10.1029/2009GL040541, 2009.
Wagner, T. and Platt, U.: Satellite mapping of enhanced BrO con-centrations in the troposphere, Nature, 395, 486–490, 1998.
Wagner, T., Leue, C., Wenig, M., Pfeilsticker, K., and Platt, U.: Spa-tial and temporal distribution of enhanced boundary layer BrO
concentrations measured by the GOME instrument aboard ERS-2, J. Geophys. Res., 106, 24225–24235, 2001.
Wagner, T., Burrows, J. P., Deutschmann, T., Dix, B., von Friede-burg, C., Frieß, U., Hendrick, F., Heue, K.-P., Irie, H., Iwabuchi,H., Kanaya, Y., Keller, J., McLinden, C. A., Oetjen, H., Palazzi,E., Petritoli, A., Platt, U., Postylyakov, O., Pukite, J., Richter,A., van Roozendael, M., Rozanov, A., Rozanov, V., Sinreich,R., Sanghavi, S., and Wittrock, F.: Comparison of box-air-mass-factors and radiances for Multiple-Axis Differential Opti-cal Absorption Spectroscopy (MAX-DOAS) geometries calcu-lated from different UV/visible radiative transfer models, At-mos. Chem. Phys., 7, 1809–1833,doi:10.5194/acp-7-1809-2007,2007.
Wang, M. and Overland, J. E.: A sea ice free summer Arc-tic within 30 years?, Geophys. Res. Lett., 36, L07502,doi:10.1029/2009GL037820, 2009.
Wennberg, P.: Atmospheric chemistry – Bromine explosion, Na-ture, 397, 299–301, 1999.
Wesely, M. L.: Parameterization of surface resistances to gaseousdry deposition in regional-scale numerical models, Atmos. Env-iron., 23, 1293–1304, 1989.
Wessel, S., Aoki, S., Winkler, P., Weller, R., Herber, A., Gernandt,H., and Schrems, O.: Tropospheric ozone depletion in polar re-gions. A comparison of observations in the Arctic and Antarctic,Tellus, 50B, 34–50, 1998.
Wren, S. N., Kahan, T. F., Jumaa, K. B., and Donaldson, D. J.:Spectroscopic studies of the heterogeneous reaction betweenO3(g) and halides at the surface of frozen salt solutions, J. Geo-phys. Res., 115, D16 309,doi:10.1029/2010JD013929, 2010.
Yang, X., Cox, R. A., Warwick, N. J., Pyle, J. A., Carver, G. D.,O’Connor, F. M., and Savage, N. H.: Tropospheric brominechemistry and its impacts on ozone: A model study, J. Geophys.Res., 110, D23311,doi:10.1029/2005JD006244, 2005.
Yang, X., Pyle, J. A., and Cox, R. A.: Sea salt aerosol productionand bromine release: Role of snow on sea ice, Geophys. Res.Lett., 35, L16815,doi:10.1029/2008GL034536, 2008.
Yang, X., Pyle, J. A., Cox, R. A., Theys, N., and Van Roozen-dael, M.: Snow-sourced bromine and its implications for po-lar tropospheric ozone, Atmos. Chem. Phys., 10, 7763–7773,doi:10.5194/acp-10-7763-2010, 2010.
Yurganov, L. N.: Surface layer ozone above the Weddell Sea duringthe Antarctic spring, Antarctic Science, 2, 169–174, 1990.
Zeng, T., Wang, Y., Chance, K., Browell, E. V., Ridley, B. A., andAtlas, E. L.: Widespread persistent near-surface ozone depletionat northern high latitude in spring, Geophys. Res. Lett., 30(24),2298,doi:10.1029/2003GL018587, 2003.
Zeng, T., Wang, Y., Chance, K., Blake, N., Blake, D., and Ridley,B.: Halogen-driven low-altitude O3 and hydrocarbon losses inspring at northern high latitudes, J. Geophys. Res., 111, D17313,doi:10.1029/2005JD006706, 2006.
Zhang, L., Moran, M. D., Makar, P. A., Brook, J. R., and Gong,S.: Modelling gaseous dry deposition in AURAMS: a unifiedregional air-quality modelling system, Atmos. Environ., 36, 537–560, 2002.
Zhao, T. L., Gong, S., Bottenheim, J. W., McConnell, J. C., Sander,R., Kaleschke, L., Richter, A., Kerkweg, A., Toyota, K., and Bar-rie, L. A.: A three-dimensional model study on the productionof BrO and Arctic boundary layer ozone depletion, J. Geophys.Res., 113, D24304,doi:10.1029/2008JD01063, 2008.
www.atmos-chem-phys.net/11/3949/2011/ Atmos. Chem. Phys., 11, 3949–3979, 2011

![88106102 - IB Documents PAST PAPERS... · (c) Identify the structural formula of an isomer of but-2-ene which does not decolourize bromine water, Br2 (aq). [1] (d) The polymerization](https://img.dokumen.tips/doc/110x75/5eb7e185668f3c5ee60b5a22/88106102-ib-documents-past-papers-c-identify-the-structural-formula-of.jpg)