Embed Size (px)
Citation preview

© 2014. Akinsanola A. A & Ogunjobi K. O. This is a research/review paper, distributed under the terms of the Creative Commons Attribution-Noncommercial 3.0 Unported License http://creativecommons.org/licenses/by-nc/3.0/), permitting all non-commercial use, distribution, and reproduction in any medium, provided the original work is properly cited.
Global Journal of HUMAN-SOCIAL SCIENCE: B Geography, Geo-Sciences, Environmental Disaster Management Volume 14 Issue 3 Version 1.0 Year 2014 Type: Double Blind Peer Reviewed International Research Journal Publisher: Global Journals Inc. (USA) Online ISSN: 2249-460x & Print ISSN: 0975-587X
Analysis of Rainfall and Temperature Variability Over Nigeria By Akinsanola A. A & Ogunjobi K. O
Federal University of Technology, Nigeria Abstract- This study investigates rainfall and temperature variabilities in Nigeria using observations of air temperature (oC) and rainfall (mm) from 25 synoptic stations from 1971-2000 (30years). The data were analyzed for the occurrences of abrupt changes in temperature and rainfall values over Nigeria while temporal and spatial trends were also investigated. Statistical approach was deployed to determine the confidence levels, coefficients of kurtosis, skewness and coefficient of variations. Analysis of air temperature indicated that in the first decade of 1971-1980 anomalies between -0.2 and -1.6 were predominant, in the second decade of 1981-1990, only five stations (Lokoja, Kaduna, Bida, Bauchi and Warri) shows positive anomaly while greater portion of the country were normal with evidence of warming in the third decade of 1991-2000. Results further indicated that there have been statistically significant increases in precipitation and air temperature in vast majority of the country. Analyses of long time trends and decadal trends in the time series further suggest a sequence of alternately decreasing and increasing trends in mean annual precipitation and air temperature in Nigeria during the study period.
Keywords: rainfall, temperature, coefficient of skewness, kurtosis and variations.
GJHSS-B Classification : FOR Code : 969999p, 760101
AnalysisofRainfallandTemperatureVariabilityOverNigeria
Strictly as per the compliance and regulations of:

Analysis of Rainfall and Temperature Variability Over Nigeria
Akinsanola A. A α & Ogunjobi K. O σ
Abstract- This study investigates rainfall and temperature variabilities in Nigeria using observations of air temperature (oC) and rainfall (mm) from 25 synoptic stations from 1971-2000 (30years). The data were analyzed for the occurrences of abrupt changes in temperature and rainfall values over Nigeria while temporal and spatial trends were also investigated. Statistical approach was deployed to determine the confidence levels, coefficients of kurtosis, skewness and coefficient of variations. Analysis of air temperature indicated that in the first decade of 1971-1980 anomalies between -0.2 and -1.6 were predominant, in the second decade of 1981-1990, only five stations (Lokoja, Kaduna, Bida, Bauchi and Warri) shows positive anomaly while greater portion of the country were normal with evidence of warming in the third decade of 1991-2000. Results further indicated that there have been statistically significant increases in precipitation and air temperature in vast majority of the country. Analyses of long time trends and decadal trends in the time series further suggest a sequence of alternately decreasing and increasing trends in mean annual precipitation and air temperature in Nigeria during the study period. Keywords: rainfall, temperature, coefficient of skewness, kurtosis and variations.
I. Introduction
he knowledge of climate variability over the period of instrumental records and beyond on different temporal and spatial scale is important to
understand the nature of different climate systems and their impact on the environment and society (Oguntunde et al. 2012). Most of the observational and numerical simulation studies on climate are based on the instrumental records of about a century which are aimed at the understanding of the natural variability of climate system and to identify processes and forcings that contribute to this variability. This is essential if we are to predict global and regional climate variations, determine the extent of human influence on the climate and make sound projections of human induced climate change. The climate of a location can be understood most easily in terms of annual or seasonal averages of temperature and precipitation.
The global climate has changed rapidly with the global mean temperature increasing by 0.7oC within the last century (IPCC 2007). However, the rates of change are significantly different among regions (IPCC 2007). This is primarily due to the varied types of land surfaces Author α σ: Department of Meteorology Federal University of Technology, Akure. Nigeria. e-mail: [email protected]
with different surface albedo, evapotranspiration and carbon cycle affecting the climate in different ways (Meissner et al. 2003; Snyder et al. 2004). Several studies have been carried out at different temporal scales and in different part of the globe. For example, Hasanean (2001) examined trends and periodicity of air temperature from eight meteorological stations in the east Mediterranean and observed positive significant trends in Malta and Tripoli, and negative trend in Amman. Turkes et al. (2002) evaluated mean, maximum and minimum air temperature data in Turkey during the period 1929–1999. Their analysis revealed spatio-temporal patterns of long-term trends, change points, and significant warming and cooling periods. Easterling 1997, Fan et al. 2010 reported separately that diurnal temperature range (DTR) has been on the decrease in most region of the world. Karl et al. (1993) analyzed temperature data from 37% of global land mass and found high increment in the minimum compared to the maximum temperature. Studies on the spatio-temporal variability and trend in temperature are very limited in Africa.
Increasing flood risk is now being recognized as the most important sectoral threat from climate change in most parts of the region which has prompted public debate on the apparent increased frequency of extreme, and in particular, on perceived increase in rainfall intensities (Oriola, 1994). Several studies have adduced extreme rainfall to be the major cause of flood worldwide. Such studies include Bunting et al. (1976), Folland et al. (1986), Odekunle (2001), and Ologunorisa (2004). Other studies have identified the characteristics of extreme rainfall that are associated with flood frequency to include duration, intensity, frequency, seasonality, variability, trend and fluctuation (Olaniran, 1983, Ologunorisa, 2001). Adefolalu (1986) studied the rainfall trends for periods of 1911–1980 over 28 meteorological stations in Nigeria with 40 years moving average showing appearance of declining rainfall. Eludoyin et al. (2009) studied monthly rainfall distribution in Nigeria between 1985-1994 and 1995-2004 and noticed some fluctuations in most months within the decades. Ayansina et al. (2009) also investigated the seasonal rainfall variability in Guinea savannah part of Nigeria and concluded that rainfall variability continues to be on the increase as an element of climate change.
T
1
(B
)Year
2014
Globa
l Jo
urna
l of H
uman
Soc
ial Sc
ienc
e
© 2014 Global Journals Inc. (US)
-
V
olum
e XIV
Issu
e III
Versio
n I

II. Study Area, Data and Methods
Nigeria which lies between 40 and 140N latitude and longitude 40 to 140E, it is bounded on the north by the Republic of Niger, east by Cameroon and west by Benin Republic while the southern boundary is Gulf of Guinea which is an arm of the Atlantic ocean (see Figure 1). The Nigerian climate is characterized mainly by the interplay between the dry north-easterly and the moist south-westerly winds. The main ecological zones are the tropical rainforest along the coast, savannah in the middle belt and semi-arid zones in the northern fringes. Quality-controlled monthly rainfall and temperature (maximum and minimum) data over twenty five meteorological stations in Nigeria were extracted from the archive of the Nigerian Meteorological Agency (NIMET), which spans for a period of thirty years each (1971–2000). The stations selected have less than 10% of the daily values were missing in each year. The annual rainfall and temperature values were computed for each station from the monthly rainfall amount using equations 1 & 2.
𝐴𝐴𝑅𝑅 =1
12�𝑅𝑅𝑖𝑖
12
𝑖𝑖=1
𝐴𝐴𝑇𝑇 =1
12�𝑇𝑇𝑖𝑖12
𝑖𝑖=1
Where R is the monthly rainfall amount at each station, T is the monthly temperature amount for each station, i is the months of the year, and AR is the annual rainfall amount at that station, AT is the annual temperature amount at that station.
The mean monthly rainfall and temperature amount for the period of thirty years were computed for each station using equation 3 & 4 respectively.
RRj����� =∑ Rj
30j=1
30
𝐓𝐓𝐓𝐓𝐣𝐣����� =∑ 𝐓𝐓𝐣𝐣𝟑𝟑𝟑𝟑𝐣𝐣=𝟏𝟏
𝟑𝟑𝟑𝟑
Where 𝑅𝑅𝑅𝑅𝐽𝐽 ����� and TTj����� represents the mean monthly rainfall and temperature amount respectively for each station over the 30 – year period, while j is the period of thirty years.
The standardized values were calculated for all the years from the use of the long-term mean, yearly mean and the standard deviation using equation 5.
φ =x − x�σ
Where φ represents the standardized departure, x is the actual value of each parameters (air temperature and rainfall), x ̅ is the long term mean value of each parameters (air temperature and rainfall), σ is the standard deviation.
Confidence test was performed on the dataset used and it was verified using 95% confidence interval. Coefficients of skewness, kurtosis and variation were also investigated.
III. Results and Discussion
a) Variability in Temperature The results of statistical analysis performed on
air temperature dataset over the selected stations are shown in Table 2. Generally peaked distribution occurred in most cases (positive coefficient of skewness) with most stations having a distribution with an asymmetric tail extending towards more negative values as evident in the negative coefficient of kurtosis. Air temperature were observed to be significant at 95% or 99% confidence level in most part of the stations.
Monthly mean air temperature over Nigeria from 1971-2000 for the months of January to June are shown in Figures 2 while Figure 3 illustrates the air temperature pattern for the months of July to December. Temperature is observed to increase southward during the months of January to March with temperature ranging from 21.1OC to 30OC. However there is a little variation in air temperature in the month of April with corresponding increase northward in May and June only. Also generally observed is a northward increase in temperature extending from July to September before a reverse in trend in the month of October (i.e. decreasing southward). It was observed that air temperature values are generally lower in the Northern part of Nigeria during dry season when compared with the wet season. This implies that temperature variation is higher over northern part of the country than over the southern part. This can be attributed to the equator ward incursion of mid-latitude systems (with alternating cool and warm air masses) which has greater influence on temperature variation over the northern part than over the southern part of Nigeria (Adefolalu, 2007). Secondly, the influence of the tropical maritime air mass from Gulf of Guinea moderates temperature fluctuations along the coastal region (Folland, et al. 1986., Charney, 1975., Adefolalu, 2007).
Analyses of standardized decadal anomalies of air temperature over Nigeria are clearly shown in Figure 4a-c. Result shows that in the first decade of 1971-1980 the whole country has negative anomalies. However in the second decade, stations like Jos, Maiduguri, Ikeja, Oshodi and Warri were cooler than normal with corresponding negative anomalies while Nguru, Calabar and Benin show positive anomalies. The third decade of 1991-2000, station such as Yelwa, Osogbo, Ikeja, Nguru all has negative anomalies while larger part of the country shows positive anomalies. Related studies in Nigeria have similarly shown different periods of warming and cooling phases over the last century Oguntunde et al. (2012). Figure 5 shows the decadal
Analysis of Rainfall and Temperature Variability over Nigeria
2
(B
)Year
2014
Globa
l Jo
urna
l of H
uman
Soc
ial Sc
ienc
e
© 2014 Global Journals Inc. (US)
-
1
2
3
4
5
V
olum
e XIV
Issu
e III
Versio
n I
V
olum
e XIV
Issu
e III
Versio
n I
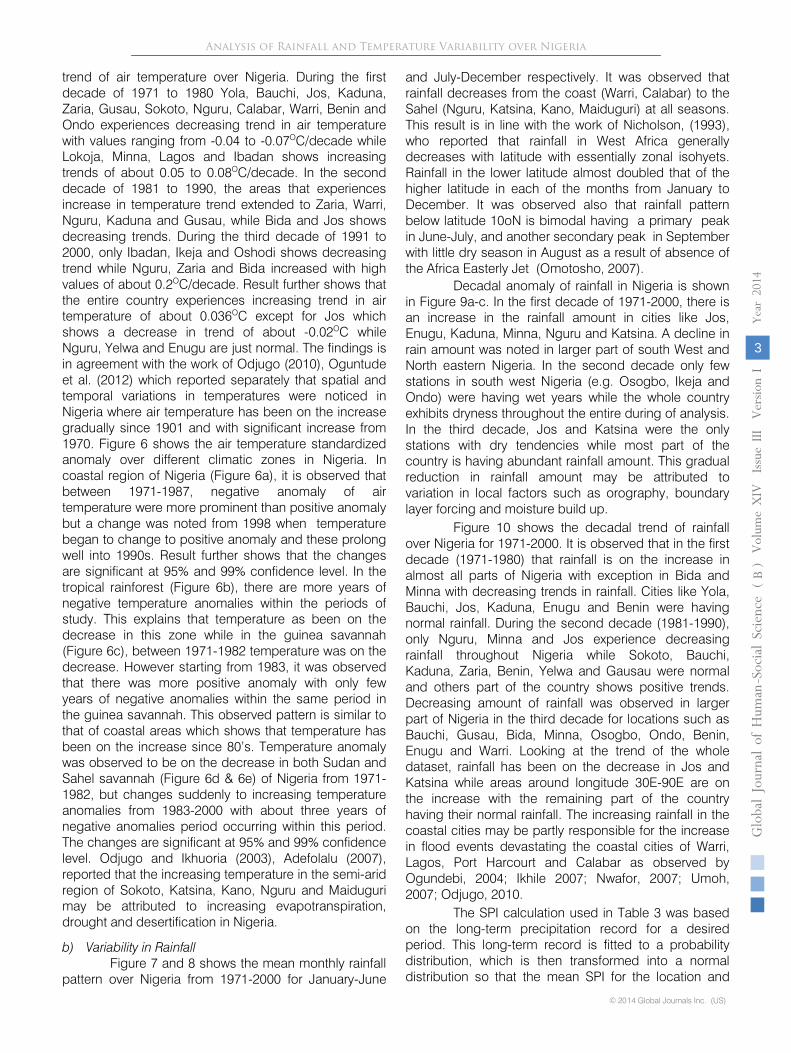
trend of air temperature over Nigeria. During the first decade of 1971 to 1980 Yola, Bauchi, Jos, Kaduna, Zaria, Gusau, Sokoto, Nguru, Calabar, Warri, Benin and Ondo experiences decreasing trend in air temperature with values ranging from -0.04 to -0.07OC/decade while Lokoja, Minna, Lagos and Ibadan shows increasing trends of about 0.05 to 0.08OC/decade. In the second decade of 1981 to 1990, the areas that experiences increase in temperature trend extended to Zaria, Warri, Nguru, Kaduna and Gusau, while Bida and Jos shows decreasing trends. During the third decade of 1991 to 2000, only Ibadan, Ikeja and Oshodi shows decreasing trend while Nguru, Zaria and Bida increased with high values of about 0.2OC/decade. Result further shows that the entire country experiences increasing trend in air temperature of about 0.036OC except for Jos which shows a decrease in trend of about -0.02OC while Nguru, Yelwa and Enugu are just normal. The findings is in agreement with the work of Odjugo (2010), Oguntude et al. (2012) which reported separately that spatial and temporal variations in temperatures were noticed in Nigeria where air temperature has been on the increase gradually since 1901 and with significant increase from 1970. Figure 6 shows the air temperature standardized anomaly over different climatic zones in Nigeria. In coastal region of Nigeria (Figure 6a), it is observed that between 1971-1987, negative anomaly of air temperature were more prominent than positive anomaly but a change was noted from 1998 when temperature began to change to positive anomaly and these prolong well into 1990s. Result further shows that the changes are significant at 95% and 99% confidence level. In the tropical rainforest (Figure 6b), there are more years of negative temperature anomalies within the periods of study. This explains that temperature as been on the decrease in this zone while in the guinea savannah (Figure 6c), between 1971-1982 temperature was on the decrease. However starting from 1983, it was observed that there was more positive anomaly with only few years of negative anomalies within the same period in the guinea savannah. This observed pattern is similar to that of coastal areas which shows that temperature has been on the increase since 80’s. Temperature anomaly was observed to be on the decrease in both Sudan and Sahel savannah (Figure 6d & 6e) of Nigeria from 1971-1982, but changes suddenly to increasing temperature anomalies from 1983-2000 with about three years of negative anomalies period occurring within this period. The changes are significant at 95% and 99% confidence level. Odjugo and Ikhuoria (2003), Adefolalu (2007), reported that the increasing temperature in the semi-arid region of Sokoto, Katsina, Kano, Nguru and Maiduguri may be attributed to increasing evapotranspiration, drought and desertification in Nigeria.
b) Variability in Rainfall
Figure 7 and 8 shows the mean monthly rainfall pattern over Nigeria from 1971-2000 for January-June
and July-December respectively. It was observed that rainfall decreases from the coast (Warri, Calabar) to the Sahel (Nguru, Katsina, Kano, Maiduguri) at all seasons. This result is in line with the work of Nicholson, (1993), who reported that rainfall in West Africa generally decreases with latitude with essentially zonal isohyets. Rainfall in the lower latitude almost doubled that of the higher latitude in each of the months from January to December. It was observed also that rainfall pattern below latitude 10oN is bimodal having a primary peak in June-July, and another secondary peak in September with little dry season in August as a result of absence of the Africa Easterly Jet (Omotosho, 2007).
Decadal anomaly of rainfall in Nigeria is shown in Figure 9a-c. In the first decade of 1971-2000, there is an increase in the rainfall amount in cities like Jos, Enugu, Kaduna, Minna, Nguru and Katsina. A decline in rain amount was noted in larger part of south West and North eastern Nigeria. In the second decade only few stations in south west Nigeria (e.g. Osogbo, Ikeja and Ondo) were having wet years while the whole country exhibits dryness throughout the entire during of analysis. In the third decade, Jos and Katsina were the only stations with dry tendencies while most part of the country is having abundant rainfall amount. This gradual reduction in rainfall amount may be attributed to variation in local factors such as orography, boundary layer forcing and moisture build up.
Figure 10 shows the decadal trend of rainfall over Nigeria for 1971-2000. It is observed that in the first decade (1971-1980) that rainfall is on the increase in almost all parts of Nigeria with exception in Bida and Minna with decreasing trends in rainfall. Cities like Yola, Bauchi, Jos, Kaduna, Enugu and Benin were having normal rainfall. During the second decade (1981-1990), only Nguru, Minna and Jos experience decreasing rainfall throughout Nigeria while Sokoto, Bauchi, Kaduna, Zaria, Benin, Yelwa and Gausau were normal and others part of the country shows positive trends. Decreasing amount of rainfall was observed in larger part of Nigeria in the third decade for locations such as Bauchi, Gusau, Bida, Minna, Osogbo, Ondo, Benin, Enugu and Warri. Looking at the trend of the whole dataset, rainfall has been on the decrease in Jos and Katsina while areas around longitude 30E-90E are on the increase with the remaining part of the country having their normal rainfall. The increasing rainfall in the coastal cities may be partly responsible for the increase in flood events devastating the coastal cities of Warri, Lagos, Port Harcourt and Calabar as observed by Ogundebi, 2004; Ikhile 2007; Nwafor, 2007; Umoh, 2007; Odjugo, 2010.
The SPI calculation used in Table 3 was based on the long-term precipitation record for a desired period. This long-term record is fitted to a probability distribution, which is then transformed into a normal distribution so that the mean SPI for the location and
Analysis of Rainfall and Temperature Variability over Nigeria
3
(B
)Year
2014
Globa
l Jo
urna
l of H
uman
Soc
ial Sc
ienc
e
© 2014 Global Journals Inc. (US)
-
V
olum
e XIV
Issu
e III
Versio
n I

desired period is zero (Edwards and McKee, 1997). Positive SPI values indicate greater than median precipitation, and negative values indicate less than median precipitation. Because the SPI is normalized, wetter and drier climates can be represented in the same way, and wet periods can also be monitored using the SPI.
Figure 11 shows the standardized rainfall anomaly over different climatic zones in Nigeria from1971-2000. In the coastal, tropical rainforest, guinea and Sudan savannah areas it was observed that there are more wet years than dry years (see Table 4). But for the Sahel savannah, the dry years were more than the wet years during the 30years study period. The result corresponds to IPCC projection stating that the coastal areas are prone to more wet years leading to the occurrence of flooding while region around the Sahel will experience more of drought as a result of reduction in the total precipitation.
IV. Conclusion
This study provides valuable insight on the spatial and temporal patterns of temperature and rainfall in Nigeria. The results revealed that there is significant increase (positive trend) in temperature in the country at 95% confidence level. Also, rainfall has been on the increase within the year of consideration. The rainfall anomaly over all the stations revealed that there was a composite nature in which some of dry years were mixed with wet years and vice versa and this occurred in all seasons in all stations. The decrease in rainfall may be due to failure of rain-producing mechanism such as ITD, AEJ, TEJ, to organise thunderstorm, squall line that are responsible for over 70% of the total annual precipitation.
References Références Referencias
1. Adefolalu, D. O. (2007). “Climate change and economic sustainability in Nigeria”, Paper presented at the International Conference on Climate Change and Economic Sustainability held at Nnamdi Azikiwe University, Enugu, Nigeria. 12-14 June 2007 pp
1-12.
2. Adefolalu, D. O., Pam, J. L. and Habbi, H. M. (2007). Climate change and safety of air transportation-a Nigerian perspective. In: Proceedings of the international conference on the impacts of extreme weather and climate on socio-economic development in Africa held at the Federal University of Technology, Akure, Nigeria, 11–15 Nov 2007, pp 1–15.
3. Adefolalu, D. O. (1986). Rainfall trends in Nigeria. Theoretical and Applied Climatology 37, 205-219.
4.
Adejuwon, S. A. (2004). Impact of climate variability
and change on crop yield in Nigeria. A paper presented at the stakeholders’ workshop on
assessment of impacts and adaptation to climate change, (AIACC) conference, Ile-Ife, 15pp.
5. Ayansina A., and Ogunbo, S. (2009). GIS Approach in Assessing Seasonal Rainfall Variability in Guinea Savanna Part of Nigeria, 7th FIG Regional Conference, Vietnam, 19-22 October 2009 16pp.
6. Ayoade, J. O. (1983). Introduction to Climatology for the Tropics John Wisley, London pp 125 – 139.
7. Babatola, J. S. (1996). Recent Changes in Rainfall Patterns and its Implication for Flood Occurrence in Ondo, Nigeria. Ondo Journal of Arts and Social Sciences, 1 (1), pp. 125 – 136.
8. Bunting, A. H., Dennett, M. D., Eliston, J. and Milford, J. R. (1976). Rainfall trends in the West Africa Sahel. Q.J.R. Meteorological Society. 102, pp.56-64.
9. Charney, J. G. (1975). Dynamics of deserts and drought in the Sahel. Q.J.R. Meteorological Society. 101, pp.193-202.
10. Chindo A, Nyelong PN (2005) Lake Chad: from Megalake to Minilake. Arid Wetland Bull 6:24–27.
11. Easterling, D. R. (1997) Maximum and minimum temperature trends for the global. Science 277: 364–367.
12. Edwards, D. C. and T. B. McKee. (1997). Characteristics of 20th century drought in the United States at multiple time scales. Climatology Report Number 97–2, Colorado State University, Fort Collins, Colorado.
13. Eludoyin (2009). Monthly variation in the 1985-1994 and 1995-2004 rainfall distribution over five selected synoptic stations in western Nigeria. Journal of Meteorology and Climate Science.7:11-22
14. Fan, Z., Brauning, A., Thomas, A., Li, J., and Cao, K. (2010). Spatial and temporal temperature trends on the Yunnan Plateau (Southwest China) during 1961–2004. Int J Climatol. doi:10.1002/joc.2214.
15. Folland, C. K., Palmer, T. N. and Parker, D. E. (1986) Sahel rainfall and worldwide sea temperatures 1901-85; Observational, modelling. And simulation studies. Nature, 320, pp. 602-607.
16. Hasanean, H. M. (2001). Fluctuations of surface air temperature in the east Mediterranean. Theoret Appl Climatol 68 (1–2):75–87.
17. Hulme M, Doherty R, Ngara T, New M, Lister D (2001) African climate change: 1900–2100. Clim Res 17:145–168.
18. Ikhile, C. I. (2007). “Impacts of climate variability and change on the hydrology and water resources of the Benin-Owena River Basin”,. Ph. D thesis submitted to the Department of Geography and Regional Planning, University of Benin, Benin City, Nigeria.
19. IPCC, (1992): Climate change. Proceedings of a workshop on assessing technologies and management systems for agriculture and forestry in relation to global climate change. Canberra, Australia.
Analysis of Rainfall and Temperature Variability over Nigeria
4
(B
)Year
2014
Globa
l Jo
urna
l of H
uman
Soc
ial Sc
ienc
e
© 2014 Global Journals Inc. (US)
-
V
olum
e XIV
Issu
e III
Versio
n I

20. Intergovernmental Panel on Climate (IPCC) (2001). The report of working Group 1 of the Intergovernmental Panel on climate change, survey for policymakers. Intergovernmental Panel on Climate (IPCC), 2007, “Climate change 2007: Synthesis report. Summary for policy makers”, available at: http://www.ipcc-wg1-ucar.edu/wg1/wg- 1- report.htm, (accessed 26 October 2009)
21. IPCC (2007). Climate change and world food security: a new assessment, Global Environmental Change 9:S51–S67.
22. Karl, T. R., Janes, P. D., Knight, R. W., Kukla, J., Plummer, N., Razuvayev, V., Gallo, K. P., Lindesay, J., Charlson, R. J. and Peterson, T. C. (1993). A symmetric trends of daily maximum and minimum temperatures: empirical evidence and possible causes. Bull Am Math Soc 74:1007–1023.
23. Liu, X. D., Yin, Z. Y., Shao, X. M. and Qin, N. S. (2006). Temporal trends and variability of daily maximum and minimum, extreme temperature events, and growing season length over the eastern and central Tibetan Plateau during 1961–2003. J Geophys Res Atmos 111:D19109. doi:10.1029/ 2005JD006915.
24. McKee, T. B., Doesken, N. J. and Kleist, J. (1993). The relationship of drought frequency and duration to time scales. Preprints, 8th Conference on Applied Climatology, pp. 179–184. January 17–22, Anaheim, California.
25. Meissner K, Weaver A, Matthews H, Cox P (2003) The role of land surface dynamics in glacial inception: a study with the UVic earth system model. Clim Dyn 21:515–537.
26. Nasrallah HA, Nieplova E, Ramadan E (2004) Warm season extreme temperature events in Kuwait. J Arid Environ 56:357–371.
27. Nicholson, S. E., (1993). An overview of African rainfall fluctuations of the last decade. Journal of Climate, 6, 1463–1466.
28. Nicholson, S. E., (1994). Recent rainfall fluctuations in Africa and their relationship to past conditions over the continent. Holocene, 4, 121– 131.
29. Nwafor, J. C. (2006). Environmental impact assessment for sustainable development: the Nigerian perspective. Environmental and development policy centre for Africa, Enugu, pp 372–385.
30. Nwafor, J. C. (2007). “Global climate change: The driver of multiple causes of flood intensity in Sub-Saharan Africa”, paper presented at the International Conference on Climate Change and Economic Sustainability held at Nnamdi Azikiwe University, Enugu, Nigeria, 12- 14 June 2007.
31. Odekunle, T. O. (2001). The magnitude – Frequency Characteristic of Rainfall in Ondo, Southwestern Nigeria. Ife Research Publications in Geography, Vol. 8, pp. 36 – 41.
32. Odjugo, P.A.O and Ikhuoria, A. I. (2003). “The impact of climate change and anthropogenic factors on desertification in the semi-arid region of Nigeria”, Global Journal of Environmental Science 2(2): 118-126.
33. Odjugo, P.A.O. (2010). General overview of climate change impacts in Nigeria. Journal of Human Ecology. 29(1): 47-55.
34. Ogundebi, A.O. (2004). “Socio-economic impacts of Flooding in Lagos State”, Environmental Impact Analysis 12 (1): 16-30.
35. Oguntunde, P. G., Friesen, J., van de Giesen, N., and Savenije H.H.G. (2006). Hydroclimatology of the Volta River Basin in West Africa: trends and variability from 1901 to 2002. Phys Chem Earth 31:1180–1188.
36. Oguntunde, P. G., Abiodun, B. J., Gunnar L. (2012). Spatial and temporal temperature trends in Nigeria, 1901–2000. Meteorology and Atmospheric Physics 118:95–105.
37. Olaniran, O J (1983). Flood Generating Mechanism at Ilorin, Nigeria. GeoJournal, 7.3, pp. 271 – 27.
38. Ologunorisa, E. T. (2001). An Assessment of Flood Risk in the Niger Delta, Nigeria. Unpublished Ph. D Thesis Department of Geography and Environmental Management, University of Port Harcourt, Port Harcourt, 303 pp.
39. Ologunorisa, E. T. (2004). Rainfall Flood Prediction in the Niger Delta, Nigeria (Abstract), International Conference in Hydrology: Science and Practice for the 21st Century, London, U.K.
40. Oluleye, (2009). Change detection in rainfall anomalies across climatic zones in Nigeria. J. Met. & Clim. Sci 7:6-10(2009).
41. Omotosho, J.B. (2007). Pre-rainy season moisture build-up and storm precipitation delivery in the West Africa Sahel. International Journal of Climatology. 28:937-946. DOL. 10.1002/joc.1548.
42. Omotosho, J. B. and Abiodun, B. J. (2007). A numerical study of moisture build-up and rainfall over West Africa. Meteorology Application 14:209-225. DOL. 10.1002/met.11.
43. Oriola,
E.
O. (1994). Strategies for Combating Urban
Flooding in a Developing Nation: A Case Study of Ondo, Niger. The Environmentalist Vol. 14, pp.
57 – 62.
44. Snyder, P.
K., Delire, C. and Foley, J.
A. (2004).
Evaluating the influence of different vegetation biomes on the global climate. Clim Dyn 23:279–302.
45. Turkes M, Sumer UM, Demir I (2002) Re-evaluation of trends and changes in mean, maximum and minimum temperatures of Turkey for the period 1929–1999. Int J Climatol 22:947–977.
46. Umoh, E. (2007), “Flooding problems in Rivers state”, Journal of
Environmental Science 4(2):
44-60.
Analysis of Rainfall and Temperature Variability over Nigeria
5
(B
)Year
2014
Globa
l Jo
urna
l of H
uman
Soc
ial Sc
ienc
e
© 2014 Global Journals Inc. (US)
-
V
olum
e XIV
Issu
e III
Versio
n I
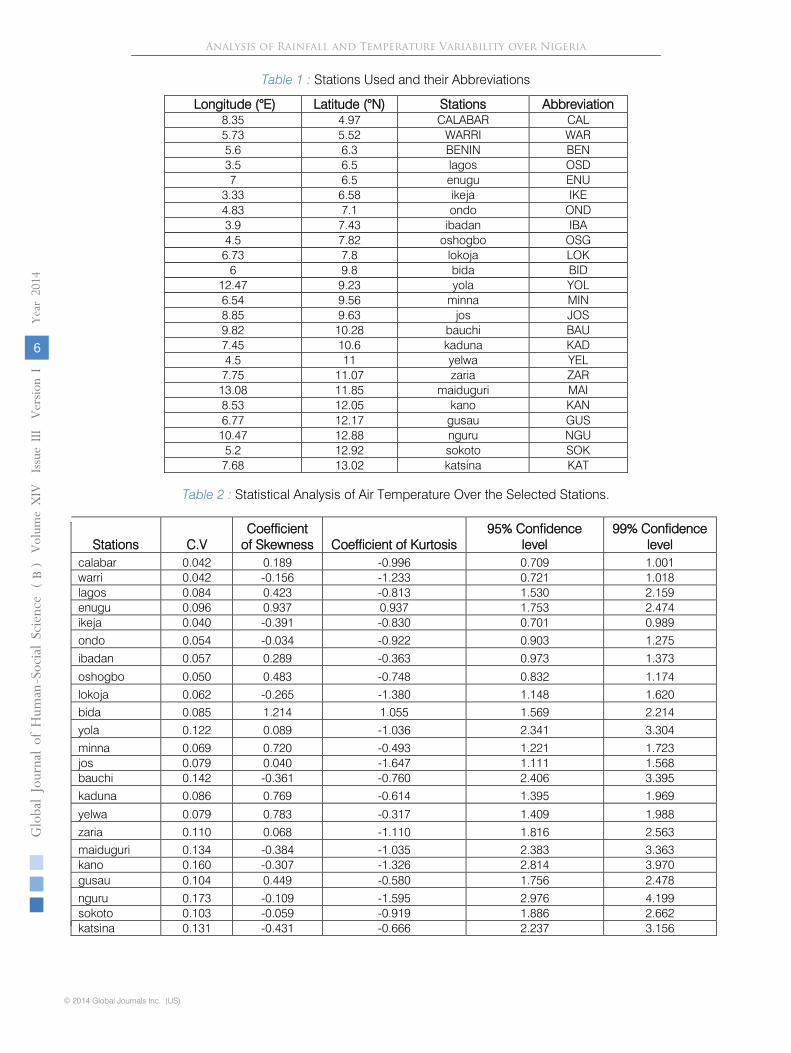
Table 1 : Stations Used and their Abbreviations
Longitude (°E) Latitude (°N) Stations Abbreviation 8.35 4.97 CALABAR CAL 5.73 5.52 WARRI WAR 5.6 6.3 BENIN BEN 3.5 6.5 lagos OSD 7 6.5 enugu ENU
3.33 6.58 ikeja IKE 4.83 7.1 ondo OND 3.9 7.43 ibadan IBA 4.5 7.82 oshogbo OSG
6.73 7.8 lokoja LOK 6 9.8 bida BID
12.47 9.23 yola YOL 6.54 9.56 minna MIN 8.85 9.63 jos JOS 9.82 10.28 bauchi BAU 7.45 10.6 kaduna KAD 4.5 11 yelwa YEL
7.75 11.07 zaria ZAR 13.08 11.85 maiduguri MAI 8.53 12.05 kano KAN 6.77 12.17 gusau GUS
10.47 12.88 nguru NGU 5.2 12.92 sokoto SOK
7.68 13.02 katsina KAT
Table 2 : Statistical Analysis of Air Temperature Over the Selected Stations.
Stations
C.V
Coefficient of Skewness
Coefficient of Kurtosis
95% Confidence level
99% Confidence level
calabar
0.042
0.189
-0.996
0.709
1.001 warri
0.042
-0.156
-1.233
0.721
1.018
lagos
0.084
0.423
-0.813
1.530
2.159 enugu
0.096
0.937
0.937
1.753
2.474
ikeja
0.040
-0.391
-0.830
0.701
0.989
ondo
0.054
-0.034
-0.922
0.903
1.275
ibadan
0.057
0.289
-0.363
0.973
1.373
oshogbo
0.050
0.483
-0.748
0.832
1.174
lokoja
0.062
-0.265
-1.380
1.148
1.620 bida
0.085
1.214
1.055
1.569
2.214
yola
0.122
0.089
-1.036
2.341
3.304
minna
0.069
0.720
-0.493
1.221
1.723 jos
0.079
0.040
-1.647
1.111
1.568
bauchi
0.142
-0.361
-0.760
2.406
3.395
kaduna
0.086
0.769
-0.614
1.395
1.969
yelwa
0.079
0.783
-0.317
1.409
1.988
zaria
0.110
0.068
-1.110
1.816
2.563 maiduguri
0.134
-0.384
-1.035
2.383
3.363
kano
0.160
-0.307
-1.326
2.814
3.970 gusau
0.104
0.449
-0.580
1.756
2.478
nguru
0.173
-0.109
-1.595
2.976
4.199
sokoto
0.103
-0.059
-0.919
1.886
2.662 katsina
0.131
-0.431
-0.666
2.237
3.156
Analysis of Rainfall and Temperature Variability over Nigeria
6
(B
)Year
2014
Globa
l Jo
urna
l of H
uman
Soc
ial Sc
ienc
e
© 2014 Global Journals Inc. (US)
-
V
olum
e XIV
Issu
e III
Versio
n I
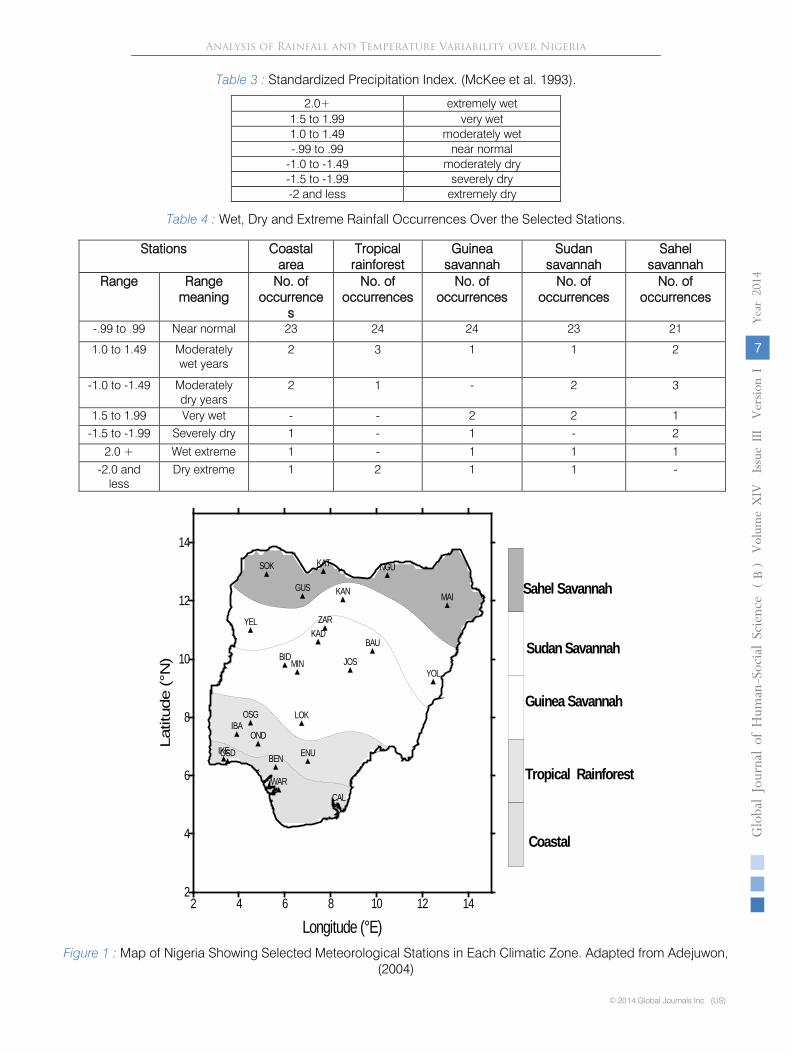
Table 3 : Standardized Precipitation Index. (McKee et al. 1993).
2.0+ extremely wet 1.5 to 1.99 very wet 1.0 to 1.49 moderately wet -.99 to .99 near normal
-1.0 to -1.49 moderately dry -1.5 to -1.99 severely dry -2 and less extremely dry
Table 4 : Wet, Dry and Extreme Rainfall Occurrences Over the Selected Stations.
Figure 1 : Map of Nigeria Showing Selected Meteorological Stations in Each Climatic Zone. Adapted from Adejuwon, (2004)
2 4 6 8 10 12 14
Longitude (°E)
2
4
6
8
10
12
14
Latit
ude
(°N
)
CALWAR
BENOSD ENUIKEOND
IBAOSG LOK
BID
YOLMIN JOS
BAUKAD
YEL ZAR
MAIKANGUS
NGUSOK KAT
Coastal
Tropical Rainforest
Guinea Savannah
Sudan Savannah
Sahel Savannah
Stations
Coastal area
Tropical rainforest
Guinea savannah
Sudan savannah
Sahel savannah
Range
Range meaning
No. of occurrence
s
No. of occurrences
No. of occurrences
No. of occurrences
No. of occurrences
-.99 to .99
Near normal
23
24
24
23
21
1.0 to 1.49
Moderately wet years
2
3
1
1
2
-1.0 to -1.49
Moderately dry years
2
1
-
2
3
1.5 to 1.99
Very wet
-
-
2
2
1
-1.5 to -1.99
Severely dry
1
-
1
-
2
2.0 +
Wet extreme
1
-
1
1
1
-2.0 and less
Dry extreme
1
2
1
1
-
Analysis of Rainfall and Temperature Variability over Nigeria
7
(B
)Year
2014
Globa
l Jo
urna
l of H
uman
Soc
ial Sc
ienc
e
© 2014 Global Journals Inc. (US)
-
V
olum
e XIV
Issu
e III
Versio
n I

Figure 2 : Monthly Mean Air Temperature (OC) Over Nigeria from (1971-2000) for January – June.
Analysis of Rainfall and Temperature Variability over Nigeria
8
(B
)Year
2014
Globa
l Jo
urna
l of H
uman
Soc
ial Sc
ienc
e
© 2014 Global Journals Inc. (US)
-
V
olum
e XIV
Issu
e III
Versio
n I

Figure 3 : Same as Figure 2 but for July-December.
Analysis of Rainfall and Temperature Variability over Nigeria
9
(B
)Year
2014
Globa
l Jo
urna
l of H
uman
Soc
ial Sc
ienc
e
© 2014 Global Journals Inc. (US)
-
V
olum
e XIV
Issu
e III
Versio
n I

Figure 4 : Decadal Anomaly of Air Temperature Over Nigeria for (A) First Decade (1971-1980, (B) Second Decade (1981-1990) and (C) Third Decade (1991-2000).
Analysis of Rainfall and Temperature Variability over Nigeria
10
(B
)Year
2014
Globa
l Jo
urna
l of H
uman
Soc
ial Sc
ienc
e
© 2014 Global Journals Inc. (US)
-
V
olum
e XIV
Issu
e III
Versio
n I
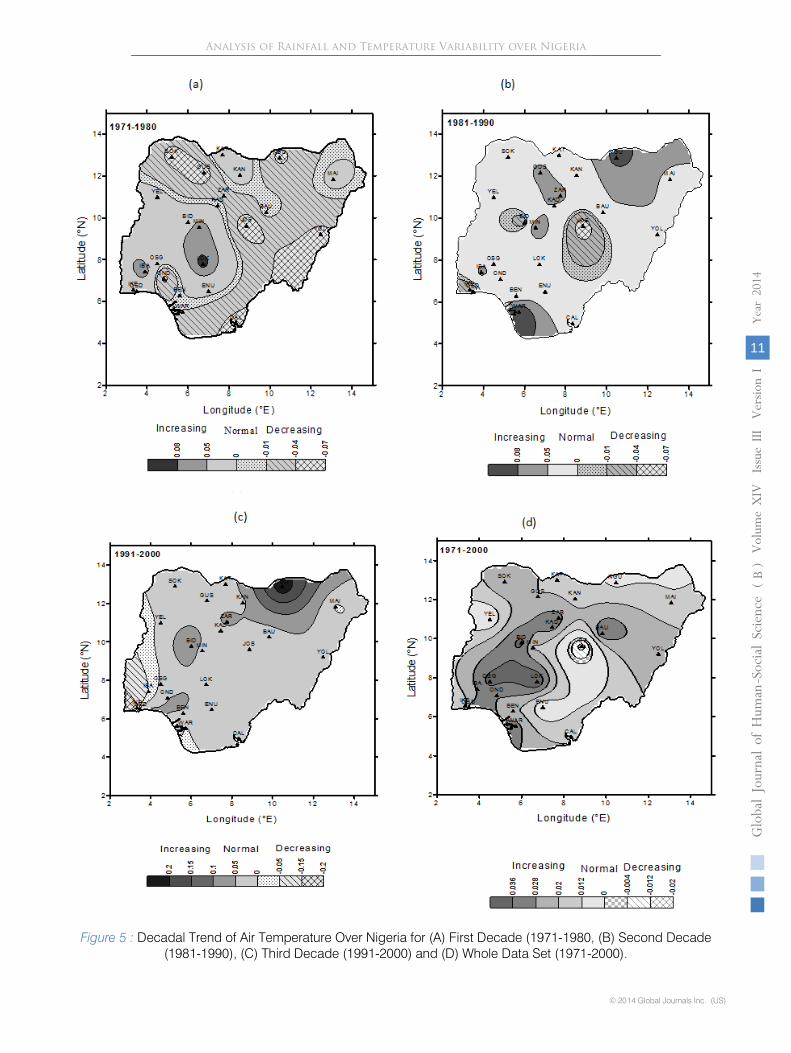
Figure 5 : Decadal Trend of Air Temperature Over Nigeria for (A) First Decade (1971-1980, (B) Second Decade (1981-1990), (C) Third Decade (1991-2000) and (D) Whole Data Set (1971-2000).
Analysis of Rainfall and Temperature Variability over Nigeria
11
(B
)Year
2014
Globa
l Jo
urna
l of H
uman
Soc
ial Sc
ienc
e
© 2014 Global Journals Inc. (US)
-
V
olum
e XIV
Issu
e III
Versio
n I
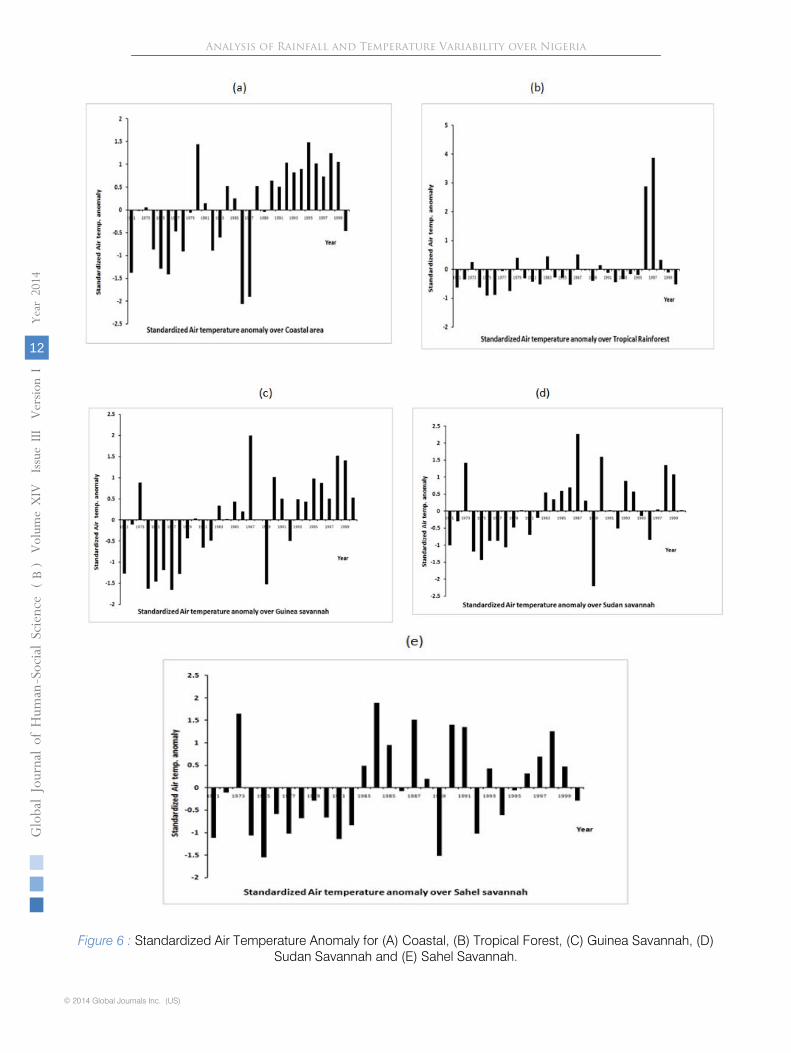
Figure 6 : Standardized Air Temperature Anomaly for (A) Coastal, (B) Tropical Forest, (C) Guinea Savannah, (D) Sudan Savannah and (E) Sahel Savannah.
Analysis of Rainfall and Temperature Variability over Nigeria
12
(B
)Year
2014
Globa
l Jo
urna
l of H
uman
Soc
ial Sc
ienc
e
© 2014 Global Journals Inc. (US)
-
V
olum
e XIV
Issu
e III
Versio
n I
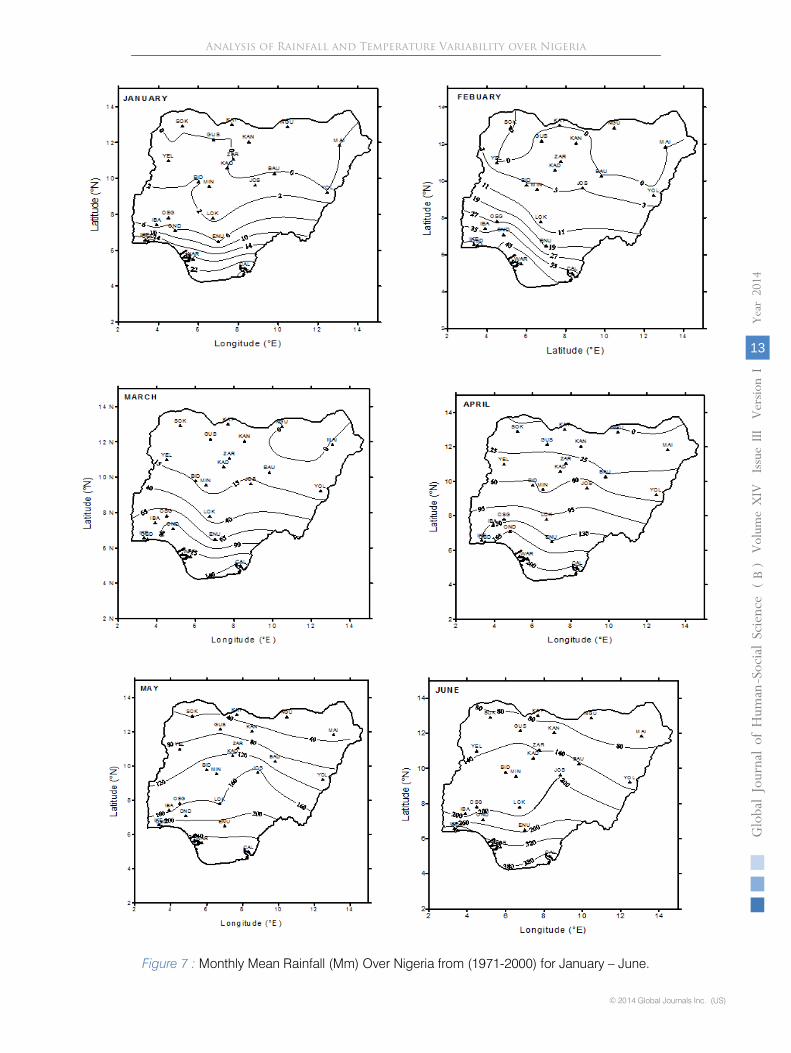
Figure 7 : Monthly Mean Rainfall (Mm) Over Nigeria from (1971-2000) for January – June.
Analysis of Rainfall and Temperature Variability over Nigeria
13
(B
)Year
2014
Globa
l Jo
urna
l of H
uman
Soc
ial Sc
ienc
e
© 2014 Global Journals Inc. (US)
-
V
olum
e XIV
Issu
e III
Versio
n I
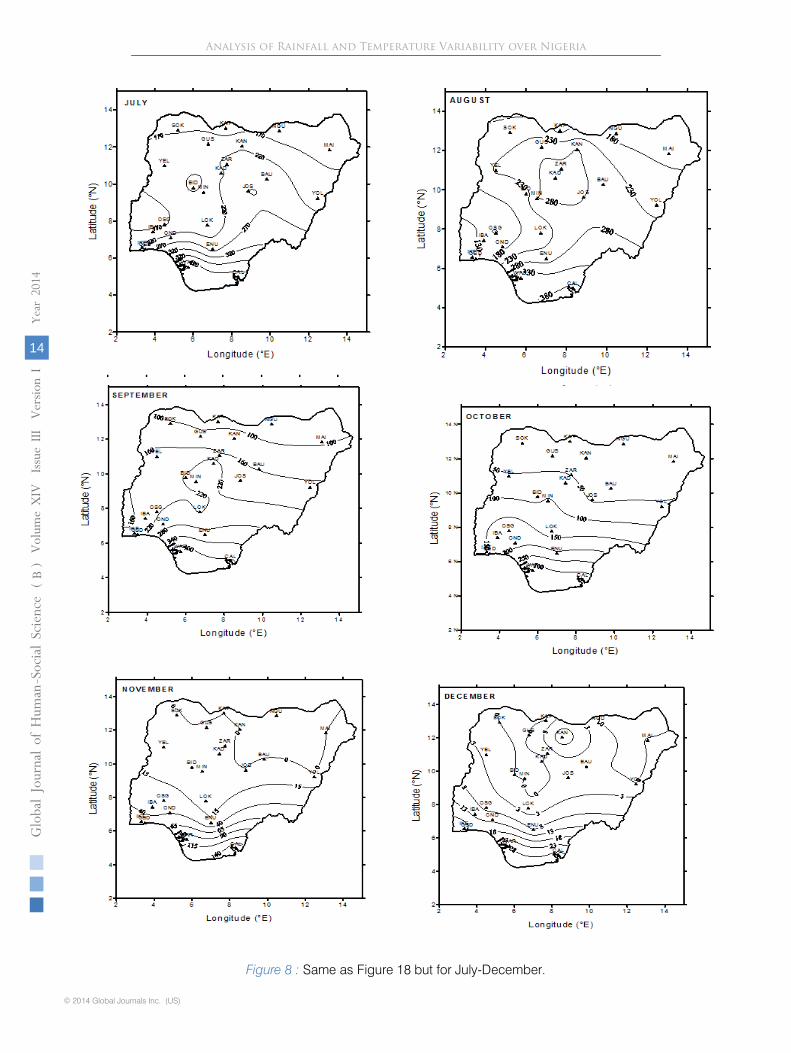
Figure 8 : Same as Figure 18 but for July-December.
Analysis of Rainfall and Temperature Variability over Nigeria
14
(B
)Year
2014
Globa
l Jo
urna
l of H
uman
Soc
ial Sc
ienc
e
© 2014 Global Journals Inc. (US)
-
V
olum
e XIV
Issu
e III
Versio
n I

Figure 9 : Decadal Anomaly of Rainfall Over Nigeria for (A) First Decade (1971-1980, (B) Second Decade (1981-1990) and (C) Third Decade (1991-2000).
Analysis of Rainfall and Temperature Variability over Nigeria
15
(B
)Year
2014
Globa
l Jo
urna
l of H
uman
Soc
ial Sc
ienc
e
© 2014 Global Journals Inc. (US)
-
V
olum
e XIV
Issu
e III
Versio
n I
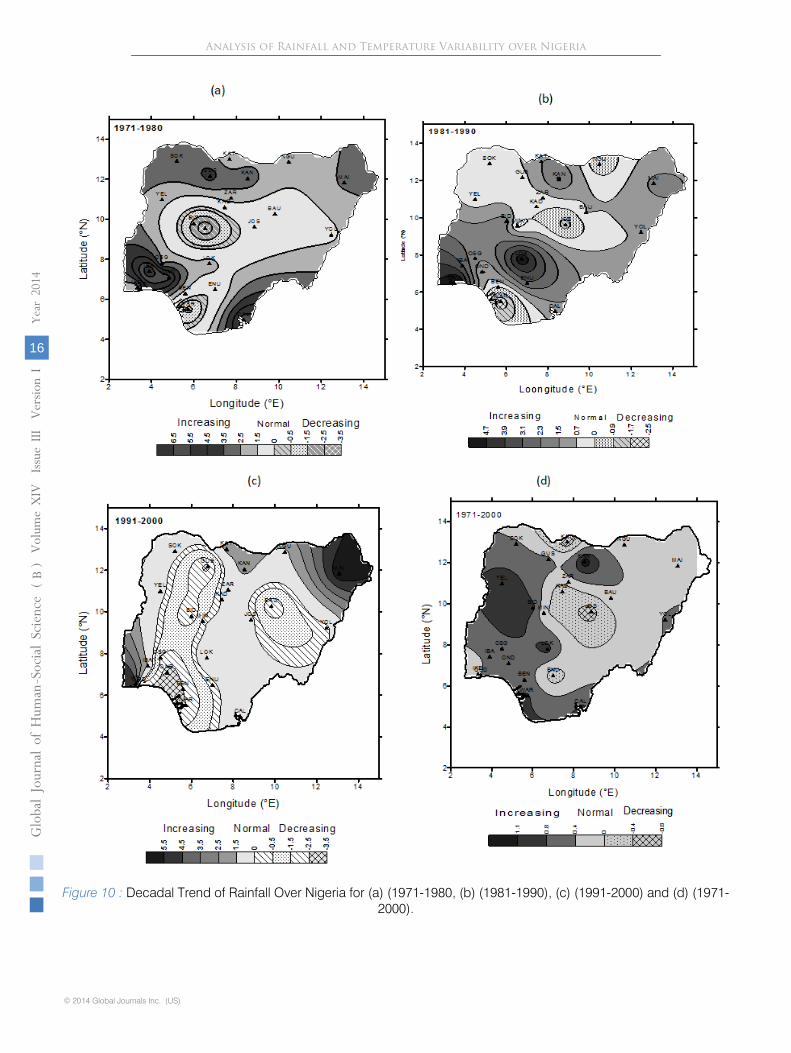
Figure 10 : Decadal Trend of Rainfall Over Nigeria for (a) (1971-1980, (b) (1981-1990), (c) (1991-2000) and (d) (1971-2000).
Analysis of Rainfall and Temperature Variability over Nigeria
16
(B
)Year
2014
Globa
l Jo
urna
l of H
uman
Soc
ial Sc
ienc
e
© 2014 Global Journals Inc. (US)
-
V
olum
e XIV
Issu
e III
Versio
n I
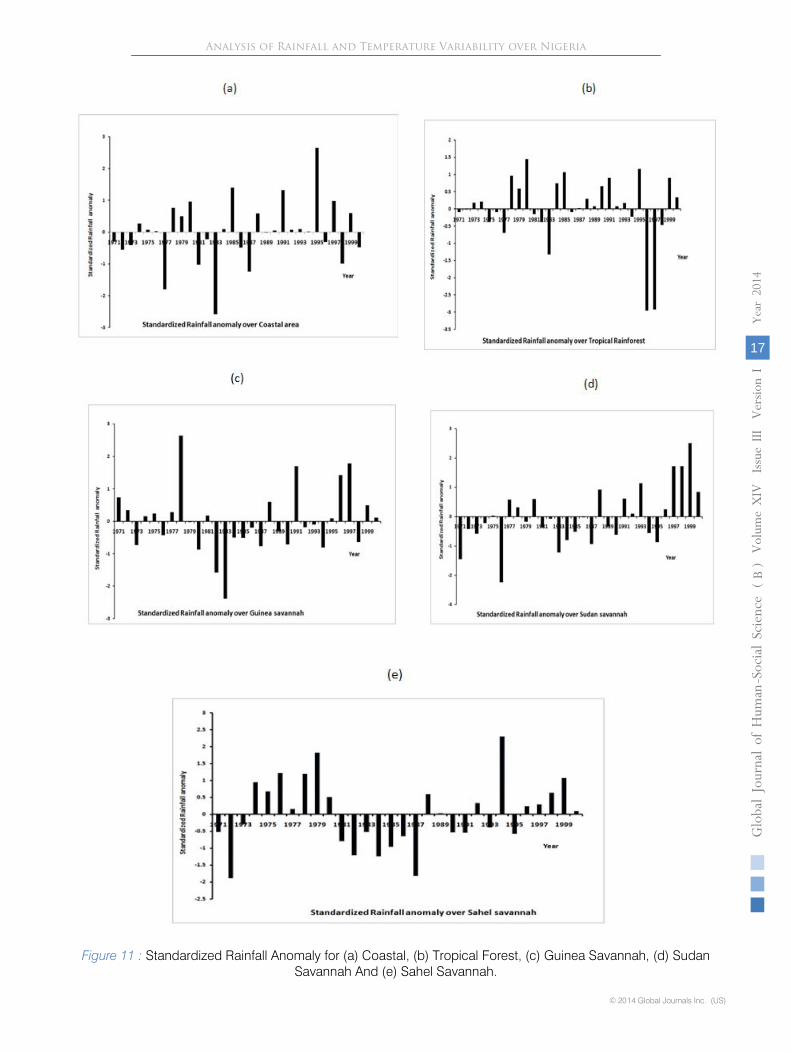
Figure 11 : Standardized Rainfall Anomaly for (a) Coastal, (b) Tropical Forest, (c) Guinea Savannah, (d) Sudan Savannah And (e) Sahel Savannah.
Analysis of Rainfall and Temperature Variability over Nigeria
17
(B
)Year
2014
Globa
l Jo
urna
l of H
uman
Soc
ial Sc
ienc
e
© 2014 Global Journals Inc. (US)
-
V
olum
e XIV
Issu
e III
Versio
n I

Analysis of Rainfall and Temperature Variability over Nigeria
18
(B
)Year
2014
Globa
l Jo
urna
l of H
uman
Soc
ial Sc
ienc
e
© 2014 Global Journals Inc. (US)
-
This page is intentionally left blank
3
Volum
e XIV
Issu
e III
Versio
n I