Embed Size (px)
Citation preview

Louisiana State UniversityLSU Digital Commons
LSU Doctoral Dissertations Graduate School
2013
Analysis of Protein Aggregates and SyntheticNanoparticles Using Capillary Electrophoresis withLight Scattering and Fluorescence DetectionSuresh Chandra RegmiLouisiana State University and Agricultural and Mechanical College, [email protected]
Follow this and additional works at: https://digitalcommons.lsu.edu/gradschool_dissertations
Part of the Chemistry Commons
This Dissertation is brought to you for free and open access by the Graduate School at LSU Digital Commons. It has been accepted for inclusion inLSU Doctoral Dissertations by an authorized graduate school editor of LSU Digital Commons. For more information, please [email protected].
Recommended CitationRegmi, Suresh Chandra, "Analysis of Protein Aggregates and Synthetic Nanoparticles Using Capillary Electrophoresis with LightScattering and Fluorescence Detection" (2013). LSU Doctoral Dissertations. 4079.https://digitalcommons.lsu.edu/gradschool_dissertations/4079

ANALYSIS OF PROTEIN AGGREGATES AND SYNTHETIC
NANOPARTICLES USING CAPILLARY ELECTROPHORESIS WITH LIGHT
SCATTERING AND FLUORESCENCE DETECTION
A Dissertation
Submitted to the Graduate Faculty of the
Louisiana State University and
Agricultural and Mechanical College
in partial fulfillment of the
requirements for the degree of
Doctor of Philosophy
in
The Department of Chemistry
by
Suresh Chandra Regmi
M.Sc., Tribhuwan University, 1994
M.S., East Tennessee State University, 2008
December 2013

ii
ACKNOWLEDGEMENTS
I would like to sincerely thank Dr. Gilman for agreeing to be my research supervisor and
guiding me throughout the projects. His warm spirit, deep sense of caring for his students, and
willingness to help any time will be long remembered. He not only taught me chemistry but also
some important aspects of life. By his constant persistence, I understood the meaning of
perfection.
I would also like to thank my Advisory Committee members Dr. McCarley, Dr.
Nesterov, and Dr. Magnaughtan, who inspired me during the difficult times of my research work.
This inspiration led me to realizations about myself that ultimately enhanced my learning ability.
Their comments, suggestions, and encouragement played important roles toward the completion
of Ph.D. dissertation.
Special thanks to all my previous and current labmates: Ryan, Rachel, Funda, Sherrisse,
and Andrew for helping me to accomplish this goal.
My deepest gratitude to my parents, Shiv Lal Regmi and Khima Kumari Regmi, for their
love, prayers, and blessings. As long as I can remember, they instilled in me a love for learning
and a deep respect for education. Lastly, I am forever grateful to my wife Sarita and son
Sandesh. Sarita has encouraged me down this road from the beginning, thank you for being part
of my life and many selfless sacrifices. Sandesh not only is my son but also my inspirer. Thank
you for the prayers, patience, and understanding.

iii
TABLE OF CONTENTS
ACKNOWLEDGEMENTS ............................................................................................................ ii
LIST OF TABLES ......................................................................................................................... vi
LIST OF FIGURES ...................................................................................................................... vii
ABSTRACT .................................................................................................................................. xii
CHAPTER 1. INTRODUCTION ....................................................................................................1
1.1 Protein Aggregation ....................................................................................................... 1
1.2 Amyloid Proteins and Amyloidogenesis ........................................................................ 3
1.3 Aggregation of Aβ Peptide and Alzheimer’s disease ..................................................... 4
1.4 Characterization of Particles Including Aβ Fibrils ......................................................... 7
1.4.1 Separation and Detection Methods for Aβ Aggregates ..............................................9
1.5 Capillary Electrophoresis ............................................................................................. 14
1.5.1 UV Absorbance Detection ........................................................................................17
1.5.2 Laser-Induced Fluorescence Detection .....................................................................18
1.5.3 Laser Light Scattering Detection ..............................................................................18
1.5.4 Multiangle Laser Light Scattering and Laser-Induced Fluorescence Detection .......20
1.6 Goals of this Research .................................................................................................. 20
CHAPTER 2. FLUORESCENCE ENHANCEMENT OF THIOFLAVIN T ADSORBED TO
POLYSTYRENE BEADS ............................................................................................23
2.1 Introduction .................................................................................................................. 23
2.2 Experimental Section ................................................................................................... 26
2.2.1 Chemicals ..................................................................................................................26
2.2.2 Microplate Studies ....................................................................................................26
2.2.3 Spectrophotometry and Spectrofluorometry .............................................................27
2.2.4 ThT Adsorption Studies ............................................................................................28
2.2.5 ThT Micelle Studies ..................................................................................................30
2.3 Results and Discussion ................................................................................................. 31
2.3.1 Effect of Bead Diameter on ThT Fluorescence ........................................................32
2.3.2 Spectroscopic Studies of ThT Fluorescence Enhancement with PS Beads and
Aβ Fibrils ..................................................................................................................34
2.3.3 Adsorption of ThT on PS Beads ...............................................................................36
2.3.4 ThT and Micelles ......................................................................................................38
2.4 Conclusions .................................................................................................................. 42

iv
CHAPTER 3. DEVELOPMENT OF A THREE-CHANNEL LIGHT SCATTERING AND
FLUORESCENCE DETECTOR FOR CAPILLARY ELECTROPHORESIS AND
ITS APPLICATION TO THE ANALYSIS OF INDIVIDUAL AMYLOID
AGGREGATES ............................................................................................................43
3.1 Introduction .................................................................................................................. 43
3.2 Experimental Section ................................................................................................... 45
3.2.1 Chemicals ..................................................................................................................45
3.2.2 Aβ Peptide Sample Preparation and Characterization ..............................................46
3.2.3 Capillary Electrophoresis ..........................................................................................48
3.2.4 CE-UV Absorbance Detection ..................................................................................49
3.2.5 CE with Two Channel Laser Light Scattering and Laser-Induced Fluorescence
Detection (CE-LLS2-LIF) detection .........................................................................49
3.3 Results and Discussion ................................................................................................. 51
3.3.1 Development and Characterization of the CE-LLS2-LIF System .............................52
3.3.2 Separation and Detection of Individual Aβ Aggregates ...........................................60
3.4 Conclusions .................................................................................................................. 68
CHAPTER 4. PARTICLES ANALYSIS USING CAPILLARY ELECTROPHORESIS
WITH LASER-INDUCED FLUORESCENCE AND LASER LIGHT
SCATTERING DETECTION .......................................................................................69
4.1 Introduction .................................................................................................................. 69
4.2 Experimental Section ................................................................................................... 72
4.2.1 Chemicals ..................................................................................................................72
4.2.2 Synthetic Particles .....................................................................................................72
4.2.3 CE-LLS2-LIF ............................................................................................................75
4.2.4 Spectrophotometry and Spectrofluorometry .............................................................76
4.2.5 Electron Microscopy .................................................................................................76
4.3 Results and Discussion ................................................................................................. 76
4.3.1 Separation and Detecton of Individual Nanoparticles Using CE-LLS2-LIF ............77
4.3.2 Comparison of the Ratio of Signal Intensities from Different Detection
Channels ....................................................................................................................87
4.4 Conclusions .................................................................................................................. 90
CHAPTER 5. CONCLUSIONS AND FUTURE DIRECTIONS .................................................91
5.1 Conclusions .................................................................................................................. 91
5.2 Future Directions .......................................................................................................... 93
REFERENCES ..............................................................................................................................96

v
APPENDIX A. FOLIC ACID ANALYSIS USING CAPILLARY ELECTROPHORESIS
WITH UV ABSORBANCE AND LASER-INDUCED FLUORESCENCE
DETECTION ...............................................................................................................109
APPENDIX B. FLUORESCENCE OF FOLIC ACID SAMPLES STUDIED BY
CAPILLARY ELECTROPHORESIS .........................................................................139
APPENDIX C. OXIDATIVE DERIVATIZATION OF FOLIC ACID MONITORED BY
CAPILLARY ELECTROPHORESIS WITH UV ABSORBANCE AND
FLUORESCENCE DETECTION ...............................................................................160
VITA…………. ...........................................................................................................................189
vi
LIST OF TABLES
Table 3.1. Signal intensity ratios of fluorescent PS beads from CE-LLS2-LIF system .................54
Table 3.2. Detection efficiency of CE-LLS2-LIF system ..............................................................56
Table 3.3. Signal to noise ratio of different size PS beads for the signals obtained from CE-
LLS2-LIF system ...........................................................................................................57
Table 3.4. Number of beads detected in different detection channels of CE-LLS2-LIF system ...59
Table 3.5. Signal intensity ratios of Aβ fibrils from CE-LLS2-LIF system ...................................63

vii
LIST OF FIGURES
Figure 1.1. Aggregation of Aβ peptides. ........................................................................................ 5
Figure 1.2. Schematic of capillary electrophoresis instrument. .................................................... 15
Figure 2.1. Thioflavin T. ............................................................................................................... 23
Figure 2.2. Fluorescence of 15.0 µM ThT with PS beads of varying diameter. Fluorescence
was measured with excitation at 440±12 nm and emission at 485±12 nm in a
microplate reader. Three replicate wells containing 250 µL of each sample was
used and 3 measurements were made for each well. For each well that contained
PS beads with ThT, a control sample of PS beads without ThT was used to account
for scattered light from the PS beads. Averages values for each sample were
plotted after subtracting the scattered light. Fluorescence of ThT in presence of (A)
1.26×109 µm
2/mL of PS beads () and (B) 1.26×10
8 µm
2/mL of PS beads (). ..........33
Figure 2.3. Contour plots of EEMS of 15.0 μM ThT (A), 15.0 μM ThT in presence of Aβ
fibrils (B), 15.0 μM ThT in presence of 1.26×108 µm
2/mL 535 nm beads (C), and
15.0 μM ThT in presence of 1.26×108 µm
2/mL 108 nm PS beads (D). All samples
were in 10.0 mM Tris buffer at pH 7.80. ......................................................................35
Figure 2.4. Adsorption isotherms for ThT on (A) 505 nm () and (B) 108 nm () PS beads.
The solid lines are fits to the Langmuir adsorption model. The concentration of PS
beads used was 6.28×109 μm
2/mL (total surface area per mL). The solutions were
prepared in 10.0 mM Tris buffer at pH 7.80. The solutions of ThT with PS beads
and corresponding solutions without ThT were prepared using same procedure in
identical glassware and filtered through individual 0.02 µm syringe filters. ................37
Figure 2.5. Fluorescence of ThT solutions at different concentrations in 10.0 mM Tris buffer
at pH 7.80 (A). (B) is 10× enhancement of lower concentration part of A.
Fluorescence emission of ThT solutions was measured at 482 nm with the
excitation at 450 nm. .....................................................................................................39
Figure 2.6. Data from Figure 2.5 plotted with a break in the x-axis from 2.5 to 7.0 µM ThT as
was done in Figure 2B from Khurana et al.76
................................................................39
Figure 2.7. Absorbance spectra of different concentrations of ThT solutions in 10.0 mM Tris
buffer at pH 7.80. ..........................................................................................................40
viii
Figure 2.8. Contour plots of EEMs of 1.98 μM ThT (A) and 49.5 μM ThT (B) in 10.0 mM
Tris buffer at pH 7.80. Inner filter correction was performed before plotting the
data. ...............................................................................................................................41
Figure 3.1. Schematic of CE system with three channel laser light scattering and laser-
induced fluorescence detection. Abbreviations are: ND - neutral density filter, MO
- microscope objective, BD - beam dump, DM - dichroic mirror, LP - longpass
filter, BP - bandpass filter, L - plano-convex lens, PH - pinhole, PMT -
photomultiplier tube. RC - 1 KHz lowpass RC filter, and ADC - analog-to-digital
converter. .......................................................................................................................51
Figure 3.2. Separation and detection of individual 700 nm diameter fluorescent PS beads
using CE-LLS2-LIF. (A) Electropherograms obtained from all 3 detection channels
for one injection. (B) An expanded view of the electropherogram with all 3
channels in one plot. The excitation laser power was 0.4 mW. The bead suspension
was prepared in TBE buffer at pH 8.40 and electrokinetically injected for 3.0 s at
385 V/cm. The calculated number of particles injected was 76. The same TBE
buffer was used as the separation buffer, and the electrophoretic current was 0.34
µA. .................................................................................................................................54
Figure 3.3. Separation and detection of individual 80 nm diameter PS beads (nonfluorescent)
using the CE-LLS2-LIF system. The inset shows an expanded view of the 1 s
region of the electropherogram from the 90° LLS channel. The excitation laser
power was 0.6 mW. The calculated number of particles injected was 111. All other
conditions are the same as in Figure 3.2. ......................................................................55
Figure 3.4. Separation of individual 310 nm diameter blue fluorescent PS beads using CE-
LLS2-LIF system. The bead solution was prepared in TBE buffer at pH 8.40 and
electrokinetically injected for 3 s at 385 V/cm. The separation was performed in
TBE buffer at pH 8.40. The current was 0.32 µA. The detection conditions were
same as in Figure 3.3. The number of particles injected was 110. The CE
electropherograms obtained from the three channels are shown separately. ................57
Figure 3.5. Electrophorograms of a mixture of fluorescent PS beads (310 nm) and
nonfluorescent PS beads (356 and 505 nm) using the CE-LLS2-LIF system. The
calculated numbers of particles injected were 61, 102, and 109 particles for 310,
356, and 505 nm PS beads, respectively. All other conditions are the same as in
Figure 3.3. ......................................................................................................................59

ix
Figure 3.6. Electropherograms of Aβ fibrils (A) and Aβ monomer (B) samples with UV
absorbance detection at 190 nm. The NM and Aβ fibrils or Aβ monomer samples
were injected for 5.0 s at 0.5 psi. The separation was performed in 10.0 mM Tris
buffer at pH 7.80 at 417 V/cm. Current was 4.43 µA. The first peak in both
electropherograms are from neutral marker Mesityl oxide (NM). The peaks labeled
M are from FAM-Aβ (1-40) and Aβ (1-40) peptide monomers and the peak labeled
F is from the Aβ fibrils. .................................................................................................61
Figure 3.7. CE-LIF electropherogram of fully formed fibrils of a 1:4 mixture of FAM-Aβ (1-
40):unlabeled Aβ (1-40) sampled on Day 0. Both the neutral marker (NM,
coumarin 500) and Aβ samples were injected for 3.0 s at 25.0 kV (385 V/cm), and
the separation was performed in 10.0 mM Tris buffer at pH 7.80 at 385 V/cm. The
current was 4.45 µA. The detection conditions were same as in Figure 3. (A) and
(B) are LLS signals from the 20° and 90° channels of CE-LLS2-LIF system where
the spikes represent individual fibrils. (C) Fluorescence signals from LIF channel.
The peak at 180 s is from NM. (D) Extended view of a 2 s region of overlapping
signals from all three channels. .....................................................................................64
Figure 3.8. Electropherograms of a 1:4 (w/w) mixture of FAM-Aβ (1-40) peptide:unlabeled
Aβ (1-40) peptide monomer. All the injection, separation, and detection conditions
are same as in Figure 3.7. (A) LLS signals from 20° LLS channel. (B) LLS signals
from 90° LLS channel. (C) Fluorescent signals from LIF channel. ..............................65
Figure 3.9. Fibrillation kinetics of a mixture of FAM-Aβ (1-40) with Arctic Aβ (1-40) (1:1)
Injection, separation, and detection conditions as in Figure 3.7. The
electropherograms in row 1, 2, and 3 correspond to the aggregating samples of day
1, 3, and 6 respectively and the electropherograms in column 1, 2, and 3
correspond to the 20° LLS, 90° LLS, and LIF channels respectively. The peaks
near 180 s in the electropherograms from LIF channel are from NM, coumarin
500. ................................................................................................................................67
Figure 4.1. Separation and detection of individual 310 nm diameter Fluoro-Max blue
fluorescent PS beads using CE-LLS2-LIF system. The bead solution was prepared
in TBE buffer at pH 8.40 and electrokinetically injected for 3 s at 385 V/cm. The
separation was performed in TBE buffer at pH 8.40. The current was 0.34 µA. The
number of particles injected was 82. A 404 nm diode laser was used as an
excitation source, the laser power was attenuated to 0.6 mW before hitting the
capillary window. The fluorescent signals were detected after filtering through a
440 nm longpass filter and scattering signals were detected after filtering through
405±10 nm bandpass filter. ...........................................................................................78

x
Figure 4.2. Separation and detection of individual CdS nanocrystals using CE-LLS-LIF
system. A stock solution prepared by dissolving 3.07 mg of QD sample in 1.60 mL
double filtered TBE buffer at pH 8.40 was diluted 100× before injection and
analysis by CE-LLS2-LIF system. The sample solution was vortexed immediately
before the injection. All other injection, separation, and detection conditions are
same as in Figure 4.1 except individual ND filters were used in 20° LLS and 90°
LLS channels to bring the peaks on scale and later the y axis values were
multiplied by the corresponding attenuation factors. The peak at 120 s in the
electropherogram from LIF channel is due to the neutral marker (NM, coumarin
500) and other peaks are from the QD sample. .............................................................80
Figure 4.3. TEM images of CdS quantum dots (A), [TC][BETI] rods (B), and [PIC][BETI]
rods (C). .........................................................................................................................81
Figure 4.4. Separation and detection of individual cyanine based organic particles using CE-
LLS2-LIF system. All injection separation and detection conditions are same as in
Figure 4.2. A coumarin 500 solution (1.00 µM in TBE buffer) was injected before
the sample injection as a neutral marker. (A) [TC][BETI] particles. A stock
solution of particles prepared by adding 100 µM [TC][BETI] salt in 5 mL was
injected for 3 s before applying separation voltage. (B) [PIC][BETI] particles. A
stock solution of [PIC][BETI] particles prepared by adding 30 µM [PIC][BETI]
salt into 5 mL TBE buffer at pH 8.40 was electrokinetically injected for 3 s before
applying separation voltage. The sample solutions were vortexed immediately
before the injection. A peak near 110 s in both electropherograms are due to
neutral marker (NM). ....................................................................................................83
Figure 4.5. Separation and detection of individual CdS quantum dots and [TC][BETI]
particles using CE-LLS2-LIF system. The samples of CdS QDs and [PIC][BETI]
particles used in Figure 4.2 and 4.4B were injected one after another from separate
vials. A 1.00 µM solution of coumarin 500 solution in TBE buffer (NM) was
injected before the particle samples. The particles sample solutions were vortexed
immediately before the injection. All other injection separation and detection
conditions are same as in Figure 4.2. ............................................................................85
Figure 4.6. Separation and detection of individual CdS quantum dots, [PIC][BETI] particles,
and 310 nm PS beads using CE-LLS2-LIF system. A stock solution QDs prepared
by dissolving 3.07 mg of QD sample in 1.60 mL double filtered TBE buffer and
diluted 100×, a solution of [PIC][BETI] particles prepared by adding 30 µM
[PIC][BETI] salt into 5 mL TBE buffer, a solution of 310 nm blue fluorescent PS
beads containing 6103125 beads/mL, and 1 µM coumarin 500 (NM) solutions

xi
were injected one after another from separate vials. All the stock solutions and
working solutions were prepared in TBE buffer at pH 8.40. The particle sample
solution was vortexed immediately before the injection. All other injection
separation and detection conditions are same as in Figure 4.1. The peak at 120 s is
due to the NM and other peaks are from the particles. ..................................................86
Figure 4.7. Ratios of signal intensities of mixture of CdS quantum dots and [TC][BETI] rods
from the electropherograms shown in Figure 4.5, plotted against their elution time.
The CdS quantum dots and [TC][BETI] rods were injected together and analyzed
using CE-LLS2-LIF system. ..........................................................................................88
Figure 4.8. Ratios of signal intensities in Figure 4.6 were plotted against their elution time.
Figure 4.6 was the separation and detection of individual CdS quantum dots,
[PIC][BETI] particles, and 310 nm PS beads using CE-LLS-LIF system. (A) All
three ratios shown together. (B) Ratios of 20˚ LLS and 90˚ LLS. ................................89
xii
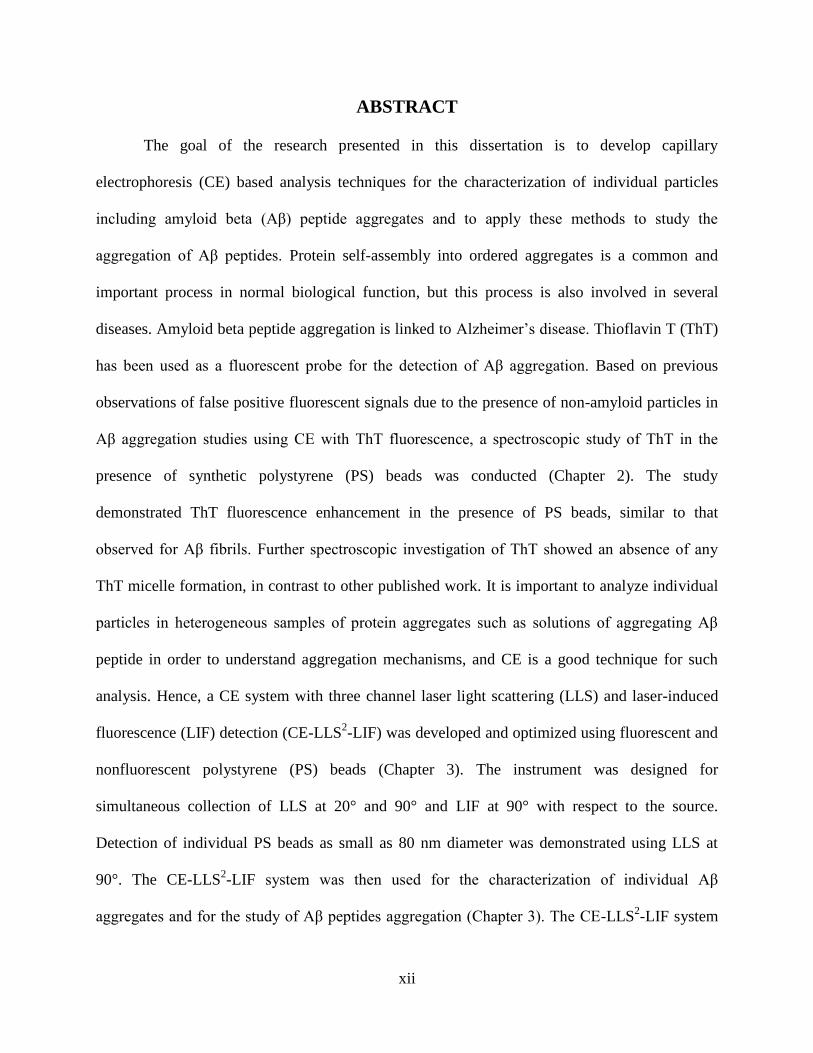
ABSTRACT
The goal of the research presented in this dissertation is to develop capillary
electrophoresis (CE) based analysis techniques for the characterization of individual particles
including amyloid beta (Aβ) peptide aggregates and to apply these methods to study the
aggregation of Aβ peptides. Protein self-assembly into ordered aggregates is a common and
important process in normal biological function, but this process is also involved in several
diseases. Amyloid beta peptide aggregation is linked to Alzheimer’s disease. Thioflavin T (ThT)
has been used as a fluorescent probe for the detection of Aβ aggregation. Based on previous
observations of false positive fluorescent signals due to the presence of non-amyloid particles in
Aβ aggregation studies using CE with ThT fluorescence, a spectroscopic study of ThT in the
presence of synthetic polystyrene (PS) beads was conducted (Chapter 2). The study
demonstrated ThT fluorescence enhancement in the presence of PS beads, similar to that
observed for Aβ fibrils. Further spectroscopic investigation of ThT showed an absence of any
ThT micelle formation, in contrast to other published work. It is important to analyze individual
particles in heterogeneous samples of protein aggregates such as solutions of aggregating Aβ
peptide in order to understand aggregation mechanisms, and CE is a good technique for such
analysis. Hence, a CE system with three channel laser light scattering (LLS) and laser-induced
fluorescence (LIF) detection (CE-LLS2-LIF) was developed and optimized using fluorescent and
nonfluorescent polystyrene (PS) beads (Chapter 3). The instrument was designed for
simultaneous collection of LLS at 20° and 90° and LIF at 90° with respect to the source.
Detection of individual PS beads as small as 80 nm diameter was demonstrated using LLS at
90°. The CE-LLS2-LIF system was then used for the characterization of individual Aβ
aggregates and for the study of Aβ peptides aggregation (Chapter 3). The CE-LLS2-LIF system

xiii
was also used to analyze individual Aβ aggregates, PS beads, quantum dot nanocrystals, and
cyanine based organic functional particles. Different particle types were separated, detected
individually and characterized based on their electrophoretic mobilities, fluorescence and light
scattering at 20° and 90° (Chapter 4).

1
CHAPTER 1. INTRODUCTION
1.1 Protein Aggregation
Protein aggregation is a process in which peptides self-associate into larger and often less
soluble structures [1, 2]. In general, there are many different pathways for protein aggregation,
but usually a specific protein follows a specific pathway for aggregation. Most of the major
aggregation pathways follow the nucleation-propagation mechanism [3]. Oosawa et al. initiated
the determination of protein aggregation mechanisms approximately 50 years ago [4]. The
authors investigated the aggregation of native state G-actin protein to form F-actin and observed
that the aggregation process resembled a condensation reaction, which occurred only above a
critical concentration [4]. In 1974, Hofrichter et al. studied the kinetics of sickle-cell hemoglobin
gelation and proposed a sequential monomer addition mechanism [5]. This study showed that the
addition steps are thermodynamically unfavorable until a critical nucleus is formed, called the
nucleation step, which is followed by a thermodynamically favorable polymerization step [5].
After these two breakthrough studies, many researchers suggested numerous modifications to
this protein polymerization mechanism, but the core concepts are still valid.
Initially, it was believed that denaturation is a basic requirement for protein aggregation
[2]. According to this hypothesis, the hydrophobic surfaces of protein molecules are exposed
during denaturation. This provides favorable conditions for intermolecular interactions in
aqueous solutions, which may lead to protein aggregation and precipitation [1, 2]. Recent studies
have shown protein aggregation not only due to denaturation but also as a result of only a small
change in protein structure, which exposes hydrophobic surfaces [1, 3]. An increase in
electrostatic interactions is considered to be responsible for the aggregation of monoclonal
antibodies [1, 3]. Solution conditions such as temperature, protein concentration, pH, and ionic

2
strength can affect the extent of protein aggregation [3]. Interaction with specific ligands,
including ions, may enhance aggregation [3]. Stresses applied to proteins such as freezing,
exposure to air, interactions with metal surfaces, or other mechanical stresses may result in
denaturation, which can in turn lead to the formation of aggregates [3]. Each of these
environmental factors can be encountered during bioprocessing and cause aggregation [1, 3].
There are different types of protein aggregates and different ways to classify them.
Generally protein aggregates are classified based on the properties of aggregates or the
aggregation process. Protein aggregates are commonly classified as soluble or insoluble,
covalent or noncovalent, and reversible or irreversible [2, 3]. Aggregates which are not visible
with unaided eye and cannot be removed by filtering through a normal pore size filter (0.2 μm)
are referred to as soluble aggregates, and aggregates that are visible with unaided eye and can be
removed by filtration are considered as insoluble aggregates [3, 6-8]. Covalent bonds between
two protein monomers generally result in stable protein structures, but sometime covalent bonds
can also result in aggregation. The aggregates formed by covalent bonds between monomers are
called covalent aggregates. One of the common mechanisms for covalent aggregation is the
formation of disulfide bonds between monomers containing thiols [3, 8]. Normally, covalent
aggregation is irreversible, and noncovalent aggregates held together by relatively weak
noncovalent interactions such as van der Waals forces, hydrogen bonding, and electrostatic
forces, are reversible [3]. Reversible aggregates are generally formed by the self-assembly of
protein molecules, which can be induced by environmental factors such as changes in
concentration or pH of the protein solution [3, 8, 9].
Morris et al. have classified protein aggregation based on the nature of the aggregation
[2]. The first type is naturally occurring, or productive aggregation, which involves a native state

3
of a protein molecule such as the aggregation of G-actin to form F-actin, which is required for
controlling the mobility and shape of cells in human body as well as in other organisms [2]. The
second type of aggregation is unwanted aggregation in biology such as aggregation of
polyglutamine proteins, which cause Huntington’s disease. Similarly, aggregation of amyloid
beta (Aβ) peptide, which is suspected of playing a causative role in Alzheimer’s disease, is an
example of unwanted aggregation in biology. This type of aggregation generally involves
aggregation of proteins in a non-native state [2]. Unwanted aggregation in an industrial setting is
another type of aggregation in which amorphous protein aggregates are formed in
pharmaceutical products. The practical effects of unwanted protein aggregation in
pharmaceutical products has not been assessed yet and needs extensive study [2].
Different proteins have their own specific functions, which require that they adopt correct
three dimensional structures. The inability of a protein to adopt its native conformation is
referred to as protein misfolding, which may result in aggregation of a protein. The misfolding
and aggregation of proteins are related to different diseases such as Alzheimer’s, Parkinson’s,
Huntington’s, prion diseases, and type II diabetes [2, 10, 11]. Misfolding and aggregation of Aβ
proteins results in neuronal dysfunction and cell death, which are linked to Alzheimer’s disease
[12, 13]. This phenomenon will be discussed in detail in the next section.
1.2 Amyloid Proteins and Amyloidogenesis
The proteins which self-assemble and form aggregates with cross β sheet structures are
called amyloid proteins, and the process of aggregation to form these structures is called
amyloidosis or amyloidogenesis [12, 13]. The aggregation of amyloidogenic proteins eventually
leads to the formation of insoluble fibers, called amyloid fibrils, as a final product. There are
more than 20 known amyloid forming proteins; however, they do not have common amino acid

4
sequences, native three-dimensional structures, or function [11]. Despite these dissimilarities, the
morphologies of cross β sheet containing amyloid fibrils obtained from different proteins are
remarkably similar. Amyloid fibrils typically consist of several concentric protofilaments, which
in turn are formed by one or more β pleated sheets with each β sheet consisting of polypeptide β
strands usually arranged in an antiparallel configuration [11]. The kinetics and products of
amyloid protein aggregation have been measured using at least 18 different analytical
techniques, each having its own advantages and disadvantages [14]. Despite the extensive
research and thousands of publications in the field, the amyloid aggregation mechanism still
remains unclear. It is clear that the deposition of amyloid is organ specific and linked to different
diseases. Similarly, aggregation of different peptides is linked to different diseases. For example,
deposition of amylin protein in the pancreas is considered to be a cause of type II diabetes, and
deposition different proteins in the central nervous system is thought to be the cause of different
diseases such as Alzheimer’s disease (A peptide), Parkinson’s disease (α-synuclein protein),
Huntington’s disease (Huntington protein), Creutzfeldt-Jakob disease (prion protein), and mad
cow disease (prion protein) [2, 11, 14].
1.3 Aggregation of Aβ Peptide and Alzheimer’s disease
Among the many diseases linked to the aggregation of amyloid proteins, Alzheimer’s
disease (AD) is the most well-known and impacts millions of people [12]. When amyloid
precursor protein (APP) is cut by the enzymes, beta-secretase and gamma-secretase, Aβ peptide
is released into the extracellular matrix [3, 14, 15]. Amyloid precursor protein is a large type I
transmembrane glycoprotein expressed on the cell surface. It contains 695 amino acids and is
abundantly expressed in neuronal tissues, but its actual function is still unknown [16, 17].
Although APP is highly enriched in the brain, it is also detected in other tissues [12, 17]. The

5
proteolysis of APP produces different length Aβ peptides from 39 to 43 amino acids, but the
peptides with 40 and 42 amino acid molecules are the most abundant type of Aβ isoforms
produced by the cleavage of APP [12, 14, 17]. The Aβ protein has been found at a high
concentration in the cerebrospinal fluid obtained from AD patients [12-14]. Similarly, increased
accumulations of neurofibrillary tangles in neurons and Aβ fibrils in neuritic plaques and in the
wall of blood vessels of AD patients have been observed. Hence, researchers believe that the
aggregation of Aβ peptides in the human brain is linked to AD for which no cure has been found
[12-14].
Figure 1.1. Aggregation of Aβ peptides.
The name Alzheimer’s disease was derived from the name of German Physiologist, Alois
Alzheimer, who first described the AD pathology based on his work on analysis of slices of
neuronal tissues using microscopy in 1906 [18]. Alzheimer’s disease is the most common type of

6
dementia, which results in loss of brain function that gradually gets worse over time. The
greatest known risk factor of Alzheimer’s disease is increasing age, since most of the people with
the disease are 65 or older [14, 19]. It is not only a disease of old age. About 5 percent of people
with the disease have early-onset Alzheimer’s disease. Early-onset Alzheimer’s disease often
appears when patients are in their 40’s or 50’s [14].
The aggregation of Aβ peptide proceeds through the formation of paranuclei, oligomers,
protofibrils, and finally to the fibrils as shown in Figure 1.1. Previously, the final product of
aggregation, the fibrils, was thought to be responsible for Alzheimer’s disease pathology [20],
but the recent research points to oligomeric species as the neurotoxic form of Aβ aggregates [1,
19, 21-23]. There is no clear distinction between the soluble oligomers and protofibrils except in
the chain length. They are curvilinear in structure as indicated in Figure 1.1 with strings of
spherical particles of 2.7 to 4.2 nm in diameter [19, 24]. Generally, the spherical particles are
considered as paranuclei, and their strings are called oligomers or protofibrils [19, 24]. The
oligomers and protofibrils are also considered as protein micelles formed above a critical
concentration of the peptide because of their hydrophobic chain [19]. Soluble Aβ oligomers are
found in cerebrospinal fluid of patients with Alzheimer’s disease (AD) [12-14]. The core of
amyloid aggregates contains interwoven fibrils that are mainly composed of 40 and 42 amino
acid peptides denoted as Aβ (1-40) and Aβ (1-42). Despite the small structural difference
between these two peptides, they display distinct clinical, biological, and biophysical behavior.
Normally, the concentration of Aβ (1-42) is about 5-10% that of Aβ (1-40) in the human body.
An increase in the Aβ (1-42)/Aβ (1-40) concentration ratio increases the risk of AD [19, 25].
Additionally, it has been found that in vitro, Aβ (1-42) forms fibrils significantly faster than Aβ
(1-40) [12]. The normal physiological concentration of Aβ in the brain is less than 10 nM .This

7
concentration is lower than the critical concentration of Aβ (1-40), 6-40 µM, for aggregation in
vitro [26]. The critical concentration of Aβ (1-42) is at least five-fold lower than the critical
concentration of Aβ (1-40) [27]. A study by Sengupta et al. showed that the critical
concentrations of Aβ (1-40) and Aβ (1-42) in vitro are 15±1 m and 2 m, respectively [28].
Although there are several hypotheses to explain how aggregation is possible in vivo, it is
extremely challenging even to study this process in vitro. The complexity of the aggregation
process accounts for the fact that no effective disease-modifying treatments for these disorders
are currently available [29].
There are several strategies used in attempts to interfere with Aβ peptide aggregation and
related toxicity, including inhibition of accumulation of the monomeric peptide, control of
protein misfolding, reduction of soluble oligomer levels, promotion of fibril clearance, and
inhibition of fibril/oligomer-mediated cell toxicity [29]. Several small molecules have been
reported to reduce or stop the oligomerization and/or fibrillization of several amyloidogenic
peptides and proteins, including Aβ peptide [30, 31]. The Aβ aggregation process has been
studied in vitro using different analytical techniques, including turbidimetry, light scattering,
analytical ultracentrifugation, circular dichroism spectroscopy, electron microscopy, atomic
force microscopy, polyacrylamide gel electrophoresis, HPLC, and quantitative fluorometry [12].
These analytical techniques will be discussed in the following sections.
1.4 Characterization of Particles Including Aβ Fibrils
Particles of micrometer to nanometer dimensions hold the promise of exciting
applications due to their small size, large surface-to-mass ratio, and high reactivity; however, the
same properties produce potentially harmful consequences because of their reactivity and
accessibility to normally inaccessible locations in living systems. Also, both the desirable and
8
undesirable properties of nanoparticles are often size-dependent. Properties of particle samples,
including standard particles purchased from commercial sources, may change during storage,
sample handling, dilution or sample preparation. Such changes may have a significant effect on
the interpretation of results for experiments with these particles. Poorly characterized samples
have the potential to lead to confusing results, at best, and incorrect conclusions in the worst
case. Hence, it is important to characterize particles samples before use [7, 32].
There are three primary approaches for the characterization of micro/nanoparticles:
ensemble methods, direct counting methods, and separations. In ensemble methods, the
population of nanoparticles is analyzed together in solution, and average properties of the
particles are computed based on the properties of the population. Elastic, inelastic, and quasi-
elastic light scattering are the major ensemble techniques for microparticle and nanoparticle
analysis. Ensemble techniques are most effective for monodisperse particles [32, 33]. Many
particle samples, including synthetic particles and protein particles such as Aβ aggregates, are
not monodisperse; hence, ensemble techniques are not effective for such samples without prior
fractionation [34]. In direct counting techniques, individual particles are observed, and their
specific characteristics are recorded to build a database of information about the size, shape, and
other physical and chemical properties of the population of particles. Transmission electron
microscopy (TEM), scanning electron microscopy (SEM), atomic force microscopy (AFM),
scanning tunneling microscopy (STM), and optical microscopy are the major examples of direct
counting techniques used for particle analysis [6, 33, 34]. Generally, these techniques can
characterize only the particles that are immobilized on the detection platform, which is a
significant limitation of these techniques. Some of the recently developed optical microscopy
based techniques such as micro-flow imaging and flow particle imaging analyzers are designed

9
for particle counting and characterization, but they seem to have limited size ranges and require
complex instrumentation [6]. Commonly used separation-based particle characterization
techniques are size-exclusion chromatography (SEC), field flow fractionation (FFF),
hydrodynamic chromatography (HDC), and capillary electrophoresis (CE) [34]. Different
detection techniques such as laser-induced fluorescence (LIF), laser-light scattering (LLS), UV
absorbance, and electrochemical detection can be coupled with these separation methods.
Capillary electrophoresis is emerging as a promising tool among these separation based
techniques for the analysis of various kind of particles including Aβ aggregates. Simple and low
cost instrumentation, ease of automation, short analysis times, and small sample volume
requirements are some of the advantages of CE applicable for particle analysis [33-35].
1.4.1 Separation and Detection Methods for Aβ Aggregates
Quantitative and qualitative analysis of soluble and insoluble Aβ aggregates throughout
the aggregation process is essential in order to clearly define the role that Aβ aggregation plays
in AD and effectively develop molecules to interfere with this process. Many different
techniques are being used for the analysis of Aβ peptides and their aggregates [19]. Major
techniques used for the characterization of Aβ peptide monomers and their intermediate as well
as fully formed aggregates are polyacrylamide gel electrophoresis (PAGE), Western blotting,
CE, MS, SEC, centrifugation, and fluorescence correlation spectroscopy [19] Currently, there is
no suitable analytical technique for the characterization of all species present in Aβ aggregates
due to their high polydispersity, which is a major challenge for researchers working in this field.
Separation techniques used for characterization of protein aggregates can be classified into three
categories: liquid chromatography based, field flow fractionation based, and electrophoresis
based techniques [34].
10
Liquid chromatography (LC) based techniques are among the most commonly used
techniques for the characterization of protein particles [19]. Although, traditional LC or HPLC
are commonly used for the characterization many particle types, other modern techniques based
on different separation mechanisms such as SEC and HDC are emerging as promising techniques
for particle characterization. In size-exclusion chromatography, the separation of the particles is
carried out based on their differences in hydrodynamic radii [19, 34]. Separation by SEC mainly
depends on the average diameter of the porous particles used for column packing. Large
molecules or particles, which cannot penetrate the defined size pores of the column packing
material, elute with the mobile phase, and the small molecules or particles, which travel through
the pores, elute later [19]. Size-exclusion chromatography has been used in Aβ aggregates
analysis [36, 37]. Development of an SEC based enzyme assay for the selective detection of Aβ
oligomers by Fukumoto et al. is one recent and important application of SEC in Aβ amyloid
studies [36]. Size-exclusion chromatography has been found to cause disruption of weakly bound
particles, and particles may adsorb irreversibly on an SEC stationary phase [34]. Hydrodynamic
chromatography is a less common LC technique in which the separation of particles is due to the
interaction of particles with the wall of the capillary or interstitial space between the packing
materials. The center of mass of larger particles will not be able to approach the wall of the
capillary as close as the center of mass of the smaller size particles will. This results in faster
elution of larger particles compared to smaller particles because the larger particles remain away
from the capillary wall where mobile phase flow is slower [34, 38]. Although the principle of
separation in HDC is different than SEC, it also suffers from similar limitations as SEC [34].
Field flow fractionation (FFF) is currently used as an alternative to SEC for the
quantification of particles with diameters from 10-3
to 10-6
m. [39-41]. In FFF, separation of

11
particles is carried out by the combined effect of an applied physical field and the mobile phase
flow. In this technique the particle sample flows through a long narrow channel and an external
field (gravitational, centrifugal, thermal gradient, electrical, or magnetic) is applied perpendicular
to the direction of fluidflow [39, 41]. Recently, Rambaldy et al. have demonstrated the
application of FFF to study time dependent aggregation of Aβ (1-42) peptide [40]. There are
various sub-techniques of FFF such as asymmetric FFF, thermal FFF, and sedimentation FFF [6,
34, 39, 40]. Particle loss inside the column and complex instrumentation are the major
drawbacks of the FFF based techniques [34, 39].
Electrophoresis techniques such as capillary electrophoresis, gel electrophoresis, and
dielectrophoresis are important particle characterization techniques because most of particles are
charged [3, 19]. Gel electrophoresis is commonly used for the analysis of biological particles
such as Aβ fibrils [3, 19]. Sodium dodecyl sulfate-polyacrylamide gel electrophoresis (SDS-
PAGE) has been successfully used for the separation of Aβ aggregates and characterization of
intermediate species [3, 19]. In SDS-PAGE, negatively charged detergent molecules uniformly
attach to the total length of the protein molecules, resulting a charge approximately proportional
to the length of the protein molecule and enabling their size-based separation [19]. Many
researchers have combined SDS-PAGE with Western blotting to analyze different Aβ aggregates
[19]. Dielectrophoresis is a newly emerging technique for the characterization of particles in
which separation of particles is carried out under the influence of a non-uniform electric field
[42, 43]. Staton et al. demonstrated a unique technique for the manipulation and concentration of
Aβ fibrils using DC insulating gradient dielectrophoresis (DC-iGDEP) [42]. This work showed
an enrichment of ~400% in fibril concentration using DC-iGDEP [42]. Electrophoresis based
techniques require an electric field for particle separation, which could change the properties of

12
particles, and particle aggregation inside the column can be problematic for these techniques
[19]. Capillary electrophoresis will be discussed in next section (Section 1.5).
Fluorescence, UV absorbance, light scattering, refractive index, and mass spectroscopy
are the most commonly used detection techniques for protein aggregates, including Aβ fibrils [3,
19, 34]. Ultraviolet absorbance detection is one of the most commonly used detection techniques
for studying protein aggregates with separations; however, due to its poor detection limits, UV
absorbance is not suitable for characterization of individual aggregates [19, 34]. Large
aggregates scatter more incident light compared to molecular analytes, and this light scattering is
not easily discriminated from absorbance. This increases inaccuracy in the absorbance detection
of particles [34]. Fluorescence is a more preferred detection technique than absorbance because
of its higher selectivity and lower detection limits, but many proteins, including Aβ proteins, are
nonfluorescent. Hence, fluorescence detection is used either after offline labeling of the protein
molecules with fluorophores [44] or with online thioflavin T labeling [19, 45, 46]. Light
scattering has been used for the characterization of Aβ aggregates [19, 47]. Light scattering
detection offers the advantage of being a more general detection technique compared to
fluorescence detection, which is useful for the characterization of protein aggregates because
many proteins are nonfluorescent.
Dynamic light scattering (DLS) is an ensemble technique with a wide detection range for
particles (0.1 nm to 3 mm), which could be suitable for characterizing highly polydispersed Aβ
protein particles. Unfortunately, DLS has poor size resolution. In order to distinguish two
population of particles they must differ in size by at least a factor of five [19]. Dynamic light
scattering measures the hydrodynamic size of particles but not the direct size; hence, the size of
the particles determined by DLS is highly affected by the shape of the particles. Many

13
researchers have used multi-angle light scattering (MALS) for the characterization of Aβ species
at different stages of the aggregation process, which was recently reviewed by Pryor et al. [19].
In addition, coupling of MALS with various separation techniques such as FFF or SEC has
become a common practice for the characterization of Aβ species [19].
Mass spectrometry (MS) is a widely used detection technique for almost all types of
analytes due to its low detection limits, small sample volume requirements and ability to provide
molecular mass as well as structural information; hence, it is also a common detection technique
for Aβ proteins. Mass spectrometry has been used for the detection of monomeric and oligomeric
species of Aβ peptide [19, 48]. In MS, the samples are vaporized and ionized before separating
them based on their mass-to-charge ratio and detecting them. Electrospray ionization (ESI),
matrix-assisted laser desorption ionization (MALDI), and laser desorption ionization (LDI) are
commonly used ion sources for MS. Although all three ion sources have been combined with
analytical techniques such as gel electrophoresis or CE for the analysis of Aβ peptides, MALDI-
MS is the most commonly used method for such analysis [19].
One of the most significant disadvantages of existing techniques for the analysis of Aβ
peptides and their aggregates is that none of the techniques are able to characterize all the species
in aggregating samples. Lack of appropriate reference standards for Aβ protein aggregates is
another major factor hindering their characterization. An ideal analytical technique for studying
Aβ aggregation would be capable of selectively detecting and characterizing of all species in an
aggregating Aβ aggregates sample, including monomer, intermediate species and fully formed
fibrils. If coupled with suitable detection techniques, CE has the potential to approach the ideal
for an analytical method to study Aβ aggregation.

14
1.5 Capillary Electrophoresis
Capillary electrophoresis is an effective separation technique for molecular analytes due
to its low sample consumption, fast analysis times, ease of automation, and high separation
efficiency [49]. Capillary electrophoresis has been used for the separation and detection of
individual particles [19, 34, 50]. The electrophoretic mobility of particles depends on their size,
shape, counter ion double layer, zeta potential at the particle surface, and surface composition
[50]. Analysis of particles is considerably different than that for molecular analytes because of
the more complicated electrophoresis process for particles. Particles have wider distributions of
charge, size, and shape compared to molecular analytes; therefore, their electrophoretic
mobilities have higher heterogeneity. In addition, the tendency of the particles to adhere with
each other at a close proximity and to adsorb on the inner wall of the capillary increases the
chances of capillary clogging. Despite these disadvantages, CE has been increasingly used for
the analysis of particles [50]. Researchers have developed many experimental approaches such
as use of capillary wall coatings and pretreatments, use of dilute polymer additives, and
compatible buffers to find appropriate conditions suitable for particle analysis [50]. Capillary
electrophoresis is especially suitable for Aβ aggregate analysis because of the absence of column
packing, resulting in a gentler separation technique, which could preserve the unstable structures
of smaller Aβ aggregates. A previous report has shown CE to be less destructive to peptide
aggregates compared to SEC [51].
The basic components of a CE instrument are shown in Figure 1.2. It contains two buffer
vials, an inlet and outlet. The two buffer vials are connected with the positive and negative
terminals of a high voltage power supply with two platinum electrodes as shown in Figure 1.2.
The two ends of a narrow capillary are dipped into the two buffer vials, and the analytes are

15
injected at the inlet end of the capillary electrokinetically or with pressure. After that,
electrophoretic separation is carried out with the application of high voltage. Capillary
electrophoresis commonly uses an open tubular capillary; hence, it is also called capillary zone
electrophoresis. In order to increase the strength of the capillary they are usually coated on the
outside with polyimide. The most commonly used capillaries sizes are 50-75 µm inner diameter
and 60-70 cm total length.
Figure 1.2. Schematic of capillary electrophoresis instrument.
The material used for CE capillaries (fused silica, SiO2) is amorphous. There are many
theories about the molecular arrangement of fused silica, but according to the most convincing
theory, it comprises SiO4 tetrahedrons linked together by shared O2-
ions at the corners [52, 53].
Hence, the fused silica surface contains mainly siloxane (Si-O-Si) groups. Silica melts at
approximately 1700°C, and it is resistant to most solvents. Its solubility in water is low but
significant and increases strongly at pH values above 10. When the siloxane group of the fused
silica surface comes in contact with water or moisture in alkaline solution, it hydrolyzes to
silanol (-Si-OH) groups [52, 53]. Righetti et al. and Watzig et al. have reported two different pKa

16
values of silanol, 5.3 and 6.3 [52, 53]. Due to the ionization of silanol group, the capillary
surface is negatively charged above pH 5. The capillary is conditioned with basic solutions
(usually NaOH) before the analysis of samples. An ionic double layer is formed at the inner wall
of the capillary when it is filled with a basic buffer. As a result, a potential called the zeta
potential (ζ) is developed. When a separation voltage is applied, the positively charged layer
moves from anode to cathode carrying the bulk buffer solution toward cathode as shown in
Figure 1.2. This results in a bulk flow called electroosmotic flow (EOF). When analytes are
injected in the capillary at the anode end (inlet) and a voltage is applied across the capillary,
neutral species move towards the cathode (outlet) with the flow of buffer due to EOF. Charged
species will migrate towards an oppositely charged pole (electrode), which is described by their
electrophoretic mobility. The EOF is typically higher than the electrophoretic mobility.
Negatively charged species electrophoretically migrate towards anode (opposite direction of
EOF), but their net velocity is towards cathode and smaller than the EOF. Positively charged
species will move towards cathode with higher net migration rate than the negatively charged
species due to the combined effect of electrophoretic mobility and EOF. Hence, the general order
of net mobility of the species towards cathode is cations, neutrals, and anions. The total charge
and hydrodynamic radius of the analytes determines their electrophoretic mobility, which effects
their net mobility. A positively charged species with a higher positive charge will have a higher
electrophoretic mobility and higher net mobility towards the cathode compared to a species with
lower positive charge. A positively charged species with a larger hydrodynamic radius will have
lower mobility towards the cathode compared to a positively charged species with a smaller
hydrodynamic radius. Similarly, a negatively charged species with a smaller hydrodynamic
radius or higher negative charge have higher electrophoretic mobility towards anode (opposite of

17
EOF) compared to a negatively charged species with a larger hydrodynamic radius or lower
negative charge, but this reduces the net mobility towards cathode. Hence, analytes with different
charge-to-size ratios are separated in CE due to differences in their electrophoretic mobilities.
Capillary electrophoresis has been combined with most detection techniques also used for
HPLC. Optical detection techniques such as UV absorbance, LIF, and LLS are commonly used
for CE. [54]. Refractive index and chemiluminescence detection are less commonly used for CE
[50, 54]. Electrochemical detection is an alternative to the optical detection, but it is necessary to
isolate the detector from high voltage applied for the electrophoretic separation [54]. Although,
several techniques have been developed for the elimination of the effect of the separation
voltage, electrochemical detection is not common with commercial CE instruments.
Conductivity detection is also used for CE [54]. Mass spectrometry has been coupled with CE
both online and offline. Although MS detection has been used with CE for over 20 years, it is not
common [54]. Among all these detection techniques, UV absorbance, fluorescence, and light
scattering detection are being used for the detection of Aβ monomers, intermediate aggregates,
fibrils and other non-amyloid particles.
1.5.1 UV Absorbance Detection
Among the optical detection methods used with CE, UV absorbance detection is the most
frequently used. This detection technique is attractive because most molecules will absorb at UV
wavelengths. It also has limitations with CE such as a short optical pathlength due to the small
inner diameter of the capillary. Capillary electrophoresis with UV absorbance detection has been
used for the characterization of particles including Aβ fibrils [19, 35].

18
1.5.2 Laser-Induced Fluorescence Detection
Laser-induced fluorescence (LIF) offers important advantages as a detection method for
microscale separation techniques such as CE. Laser-induced fluorescence detection typically
provides lower detection limits and better selectivity than UV absorbance detection for CE [19,
34, 49, 55]. Laser-induced fluorescence has been applied for the detection of individual
fluorescent particles including Aβ aggregates [34, 43, 45, 46]. Due to the high selectivity of LIF
detection, less interference is expected during the detection of individual particles. There are a
number of literature reports describing the advantages of CE-LIF over many other separation and
detection combinations [19, 34, 55, 56]. Capillary electrophoresis with LIF detection was found
to provide at least a 25 times higher S/N than flow cytometry for all types of particles [35].
Quantification of individual particles can be achieved based on the number and area of
fluorescent peaks, but it requires that the particles are fluorescent. Unfortunately, many particles
of interest do not fluoresce significantly. Derivatization of particles to increase their fluorescence
is common. For CE, this can be accomplished oncolumn, precolumn or postcolumn [35, 49, 57].
Alternative detection techniques for the characterization of particles that do not require
derivatization are desirable. Laser light scattering is an excellent alternative to LIF detection for
particles, and it is a suitable detection technique for CE.
1.5.3 Laser Light Scattering Detection
Light scattering has been applied to studies of Aβ fibrillogenesis as a good optical
method capable of monitoring fibril length and structure [19]. Laser light scattering (LLS)
detection offers several advantages for the detection of individual particles, including protein
aggregates. It is a more general detection technique compared to LIF. Because almost all
particles can produce LLS signal this technique is well suited for particle detection and
19
characterization. Laser light scattering has been used for counting and sizing of individual
particles [58-62]. The intensity of light scattered by a single particle depends on the scattering
angle, size, shape, and refractive index of the particle, as well as the wavelength and polarization
of the light source used [63].
If the size of the particle is much smaller than the wavelength of the incident light, the
scattering is considered to be Rayleigh scattering. The Rayleigh scattering intensity is
proportional to the sixth power of the particle radius (r6) and the inverse fourth power of the
source wavelength (λ-4
). For Rayleigh scattering, the intensity of light scattered by a particle is
equal in all directions.
Light scattering by particles of equal or larger size than the wavelength of the incident
light is considered to be Mie scattering. In Mie scattering, the scattered light intensity is
generally highest in forward direction and lowest at 180° with respect to the light source. For
Mie scattering, the intensity is a complex function of the particle size and the interference of
scattered light from electrons in different regions of the particle [63]. In general, the intensity of
scattered light in the forward direction is independent of the shape of the particle due to
constructive interference of the scattered light; however, the scattered light intensity at higher
angles relative to the axis of incidence of the light source is affected by the shape of the particle
due to destructive interference between light scattered from different parts of the particle [63]. In
the case of non-spherical particles, the orientation of the particle is also an important factor
affecting the intensity of scattered light [63, 64]. Hence, measurement of the intensity of
scattered light at different angles is characteristic of the size and shape of the particle. The
intensity of light scattered by particles of different chemical compositions is different due to the
difference in their refractive index [63]. The scattered light intensity may also depend on surface

20
morphology of the particles. For a plane surface, the intensity of light scattered by a smooth
surface is higher than the intensity of light scattered by a rough surface [65]. The impact of
surface roughness on light scattering by particles of micrometer to nanometer dimensions is not
well documented in the literature or easy to study.
1.5.4 Multiangle Laser Light Scattering and Laser-Induced Fluorescence
Detection
As discussed in the previous sections, both LIF and LLS detection are compatible with
CE and are useful for characterizing particles, including Aβ fibrils; however, both of these
detection techniques have certain limitations. Laser-induced fluorescence detection is applicable
only for fluorescent particles, and LLS detection is less selective than LIF. Simultaneous use of
both detection techniques can minimize these limitations. Multichannel LLS and LIF detection is
common in flow cytometry [66] but not commonly practiced in CE. Compared to flow
cytometry, CE can characterize particles based on their electrophoretic migration in addition to
their detection response. Simultaneous detection of LIF and LLS signals in CE [67] and LLS
signals at two angles in microfluidic CE [58] have been reported. Andreyev et al. have
demonstrated simultaneous use of LIF and LLS to detect individual particles separated by CE
and also applied this technique for monitoring changes in mitochondrial morphology during
cryogenic storage [67]. For many particle analysis problems, combining LLS and LIF may not be
necessary, but analysis of samples of aggregating amyloid peptides is very challenging, and any
extra characteristic information about separated aggregates is helpful.
1.6 Goals of this Research
The overall goal of this research is to develop analytical techniques based on CE for the
quantification and characterization of particulate analytes and to apply these techniques to study
Aβ peptide aggregation. Quantitative and qualitative analysis of Aβ peptide aggregates

21
throughout the aggregation process is essential for both clearly defining the role that Aβ
aggregation plays in AD and for effective development of molecules to interfere with this
process. Hence, there is a need for methods that are capable of rapidly quantifying and
characterizing the heterogeneous mixture of aggregated species present during fibril formation.
Capillary electrophoresis is known to be an excellent separation technique that preserves the
structure of weakly bound aggregates. Hence, an important objective of this research was to
apply the newly developed CE based techniques for the analysis of different sample types. The
research performed in Chapter 2-4 towards the overall goal is described below.
Chapter 2. The main goal of the study presented in Chapter 2 is to explore the possibility
of interference by non-amyloid particles for thioflavin T fluorescence, which can produce false
positive results in amyloid aggregation studies. Thioflavin T fluorescence is considered to be a
gold standard technique for the detection of Aβ aggregates [68, 69]. Many researchers use ThT
for the detection of Aβ aggregates and to monitor Aβ aggregation kinetics. Previous studies of
Aβ aggregates using ThT for on-column labeling and CE-LIF analysis of individual Aβ
aggregates [45] suggested that ThT could produce false positive fluorescence signals in the
presence of non-amyloid particles (Picou and Gilman, unpublished observations). In Chapter 2
we investigated the effect of polystyrene (PS) beads on ThT fluorescence, where the PS beads
serve as a model for nonamyloid particles that cause changes in ThT fluorescence that could be
mistaken for fluorescence enhancement due to amyloid aggregates. Both the size and
concentration of PS beads were varied in this study. A fluorescence spectroscopic study was
performed to compare ThT fluorescence enhancement due to the presence of Aβ aggregates with
that due to PS beads. The adsorption behavior of ThT on PS beads and its micellar behavior were
also investigated.

22
Chapter 3. The main goal of the work presented in Chapter 3 was to develop a CE
system with three channel LLS and LIF detection for the characterization of protein aggregates
detected individually after CE separation. The instrument was designed for the simultaneous
collection of both scattered light and fluorescence produced by individual particles passing
through the detection window of a CE capillary. The detection system was constructed in the
laboratory and optimized using fluorescent and nonfluorescent PS beads of several diameters.
Mixtures of carboxyfluorescein (FAM) labeled Aβ (1-40) peptide with unlabeled Aβ (1-40)
peptide (1:4) and Arctic Aβ (1-40) peptide (1:1) were analyzed using the newly developed
instrument.
Chapter 4. The goal of the work presented in Chapter 4 was to analyze different types of
particles samples using the CE instrument developed in Chapter 3. Particles made up of different
materials (PS beads, Aβ fibrils, CdS quantum dots, and cyanine based organic particles) were
analyzed individually to observe their mobility as well as relative signal intensities in three
detection channels. The ability of the instrument to distinguish signals of different particle types
was explored by injecting more than one type particles together. Signal intensity ratios of
different detection channels and the electrophoretic mobility of particles were used to distinguish
the signals for different particle types.

23
CHAPTER 2. FLUORESCENCE ENHANCEMENT OF THIOFLAVIN T
ADSORBED TO POLYSTYRENE BEADS
2.1 Introduction
Thioflavin T (ThT) is a benzothiazole fluorescent dye that has been used extensively to
study aggregation of peptides and proteins to form amyloid fibrils [68, 70]. The structure of ThT
is shown in the Figure 2.1. After binding to amyloid aggregates, ThT undergoes a red shift of
both its excitation and emission maxima as well as an increase in fluorescence intensity relative
to unbound ThT [68, 71, 72]. These two characteristics of ThT are often referred to in the
literature as “ThT fluorescence enhancement” [68, 71, 73-75]. For most amyloid aggregation
studies in the literature, ThT fluorescence is only measured at fixed wavelengths near the
excitation and emission maxima of ThT bound to amyloid fibrils. Thioflavin T fluorescence
enhancement has been observed in the presence of many aggregated amyloid proteins, and it is
believed that the β-sheet structural motif, which is common to amyloid aggregates, is the binding
site of ThT [68, 70, 71, 76].
Figure 2.1. Thioflavin T.
The mechanism of ThT fluorescence enhancement in the presence of amyloid fibrils is
not well understood. According to the most common hypothesis, ThT fluorescence enhancement
is due to restriction in the rotation of the torsional angle between the benzylamine and
benzothiazole rings when the ThT molecules are bound to amyloid fibrils [68, 77]. When ThT is
bound, the torsional angle between its ring structures is rigid and small, i.e. the rings are more

24
coplanar and less mobile relative to when ThT is unbound. This reduces the energy difference
between excited state and ground state, resulting in the red shift observed in ThT fluorescence
enhancement. While this mechanism is plausible, it is also plausible that ThT fluorescence
enhancement could be observed in the presence of structures other than amyloid fibrils that can
bind and stabilize the coplanar conformation of ThT.
In unbound ThT molecules, formation of the twisted internal charge transfer (TICT)
conformation takes place in the excited state, resulting in nonfluorescent relaxation (fluorescence
quenching). This process effectively competes with radiative transition from the excited to
ground state and is responsible for the significant quenching of unbound ThT fluorescence [70,
78]. When ThT molecules are bound to Aβ fibrils, the angle between benzothiazole and the
benzylamine ring becomes more rigid; hence, formation of TICT conformation is less probable,
resulting in a higher fluorescence quantum yield [70, 78].
When a fluorescent molecule absorbs a photon, it enters an excited electronic state before
releasing energy as fluorescence. Several processes compete with fluorescence, such as
vibrational relaxation and/or internal conversion, solvent relaxation, and intramolecular charge
transfer (ICT) or TICT. These processes result in loss of energy, producing a difference in
excitation and emission maxima called Stoke’s shift [70]. The polar nature of ThT molecules is
associated with Stoke’s shift due to solvent relaxation and ICT, which could be the reason for the
unusually large Stoke’s shift in both bound and unbound ThT molecules [70, 78].
Thioflavin T has been used as a label for fluorescence detection of amyloid beta (Aβ)
aggregates with capillary electrophoretic separations by adding ThT to the electrophoresis buffer
[45, 46, 79]. Gilman and coworkers demonstrated the detection of individual aggregates using
this approach [45, 79]. For some early experiments during these studies, fluorescence peaks were

25
observed with the same characteristics as peaks due to individual amyloid fibrils, but they were
also observed when no Aβ peptide had been injected (unpublished observations). Eventually it
was determined that these false positive peaks could be nearly eliminated by more careful
filtering of all electrophoresis solutions with 0.02 μm syringe filters. This raised questions about
the nature of these unexpected fluorescence peaks. Importantly, these peaks were not observed in
buffer that did not include ThT, suggesting that ThT fluorescence enhancement was involved and
that whatever was causing the peaks was not natively fluorescent.
Despite the widespread use of thioflavin T for studying amyloid aggregation and the
perception that ThT fluorescence enhancement is highly selective for amyloid aggregates, false
positive responses due to ThT interaction with biological particles and molecules not containing
amyloid aggregates have been observed [80-82]. Bacteria, which can grow readily under the
conditions used for amyloid beta (Aβ) aggregation studies, can bind with ThT and produce false
positive responses [82]. The interaction of ThT with different molecular assemblies such as
cyclodextrins [73, 81] and cucurbit[n]uril [80] also produce ThT fluorescence enhancement
similar to Aβ-ThT interaction. Binding of ThT with negatively charged surfaces, especially clay
surfaces, has been studied [83]. Non-Coulombic forces are considered to play a primary role in
the adsorption of ThT with negatively charged surfaces; however, it is unclear if such
interactions enhances ThT fluorescence since fluorescence was not investigated in that study
[83]. Polystyrene (PS) beads are also considered to have negatively charged surfaces [84].
Hence, an adsorption interaction similar to that for ThT and clay might be expected for ThT and
PS beads.
In this Chapter we tested the hypothesis that the adsorption of ThT to non-biological
particles of sizes similar to amyloid fibrils could cause ThT fluorescence enhancement and false

26
positive results in amyloid aggregation studies. Commercial PS beads were used for this
investigation. Fluorescence spectroscopy was used to examine ThT fluorescence enhancement in
the presence of PS beads of different sizes and at different bead concentrations. These results
were compared to ThT enhancement for amyloid fibrils. Adsorption of ThT to polystyrene
spheres was studied, and micelle formation of ThT was investigated since it has been proposed to
be important for ThT fluorescence enhancement in the presence of amyloid fibrils [75].
2.2 Experimental Section
2.2.1 Chemicals
Polystyrene beads (1072±19, 771±25, 535±08, 505±10 356±14, 202±10, and 108±4.5
nm) were purchased from Polysciences (Warrington, PA). Bead concentrations and the number
of particles in samples were calculated using the values for concentration (% w) of polymer and
density of the beads provided by the manufacturer [85]. Thioflavin T was purchased from Sigma
(St. Louis, MO). Tris(hydroxymethyl) aminomethane (Tris) was from Acros (Geel, Belgium),
and HCl was purchased from Fisher Scientific (Pittsburgh, PA). A 10.0 mM Tris buffer was
prepared in ultrapure water (>18 MΩ·cm) from a Modulab water purification system (United
States Filter; Palm Desert, CA) and adjusted to pH 7.80 with HCl. Suspensions of PS beads were
prepared in 10.0 mM Tris buffer at pH 7.80. All suspensions containing PS beads were vortexed
just prior to use. All Tris buffer used was filtered twice with a 0.02 µm Anotop 25 syringe filter
(Fisher Scientific).
2.2.2 Microplate Studies
Fluorescence was measured using a FLUOstar 430 microplate reader (BMG Lab
Technologies; Offenberg, Germany). Fluorescence was measured from the top of a black 96 well
plate (Corning 3650) (Corning, Inc.; Corning, NY) with excitation at 440±12 nm and emission at

27
485±12 nm. Prior to measurement, the microplate was orbitally shaken for 60 s to ensure that the
sample was homogeneous. Three replicate wells containing 250 µL of each sample were used,
and three measurements were made for each well. For each well that contained PS beads with
ThT, a control sample of PS beads without ThT was used to account for scattered light from the
PS beads.
2.2.3 Spectrophotometry and Spectrofluorometry
Absorbance spectra (200-800 nm) were obtained with a Cary 50 UV-Vis
spectrophotometer (Varian; Palo Alto, CA) using matched 1-cm quartz cuvettes. Absorbance
spectra were collected at room temperature with slit widths of 1 nm at an interval of 0.5 nm, and
a blank was subtracted from each spectrum.
Excitation-emission spectra and excitation-emission matrices (EEMs) were obtained
using a SPEX Fluorolog-3 spectrofluorometer (model FL3-22TAU3; HORIBA Jobin Yvon;
Edison, NJ) equipped with a 450 W Xenon lamp and an R928P photomultiplier tube (PMT).
Both excitation-emission spectra and EEMs were collected at room temperature using a 1-cm
quartz cuvette with both excitation and emission slit widths of 5 nm. For the collection of EEMs,
the excitation wavelength was varied in 5 nm intervals, while the emission spectra were collected
at 2 nm intervals. For simple excitation and emission spectra, scanning was at 1 nm intervals for
both excitation and emission spectra. All fluorescence spectra were corrected for inner-filter
effects [86]. After the inner filter correction, spectra for blank samples (without ThT) were
subtracted from the sample fluorescence to minimize scattering signals. Contour plots of EEM
data and excitation-emission spectra were plotted using OriginPro 7.5 (Origin Lab;
Northampton, MA).

28
The Aβ fibrils used for EEM studies were from a batch of mature fibrils prepared at 0.5
µM (monomer equivalent concentration) in 10.0 mM Tris buffer at pH 7.80 and characterized
extensively in two previous studies [45, 87].
2.2.4 ThT Adsorption Studies
Adsorption of ThT on the surface of PS beads was studied based on the method described
by Margulies et al. for ThT adsorption on clay [83]. Briefly, 7.00 mL suspensions of 108 nm or
505 nm PS beads with various concentrations of ThT (1.0, 3.0, 7.0, 15.0, 30.0, 45.0, and 60.0
µM) were prepared in 10.0 mM Tris buffer at pH 7.80. The concentrations of 505 nm and 108
nm PS beads used were 7.84×10⁹ bead/mL and 1.74×10
11 beads/mL, respectively. The
concentrations were selected so that the total surface area of the different size beads would be
identical. Identical blank solutions were also prepared, containing ThT but no PS beads. All
samples and blanks were prepared in identical 30 mL clean glass vials that had been rinsed with
filtered (0.02 µm syringe filter) ultrapure water and oven dried. Buffer solutions were filtered
twice through a 0.02 µm syringe filter prior to use. Both samples and blanks were left
undisturbed to equilibrate for 12 hr. After the first 12 hr they were vortexed and again left
undisturbed for another 12 hr. Next, the suspensions were filtered through individual 0.02 µm
syringe filters to remove all beads, and absorbance spectra were collected as described in Section
2.2.3 for the filtered solutions. The amount of ThT adsorbed on the surface of PS beads was
calculated based on the absorbance of the filtered solutions and blanks and plotted against the
corresponding concentrations of ThT (µM) using OriginPro 7.5 (Origin Lab; Northapton, MA)
and IGOR Pro 4 (WaveMetrices, Portland, OR). The absorbance of a solution can be represented
as-

29
( )
( )
Where, A is the absorbance (AU), Ɛ is the molar absorptivity (AUcm-1
M-1
), b is the path length in
cm, and C is the molar concentration of the solution. Ablank is the absorbance of blank solutions,
Aeq mix is the absorbance of the filtrate of the equilibrated PS beads and ThT mixture, and Adiff is
their difference. After calculating the amount of ThT adsorbed on the PS beads surfaces the
Langmuir isotherm equation was used to explain the experimental data assuming the following.
( )
Where, B represents total surface area of PS beads in solution and B•ThT represents the surface
area of beads covered by ThT. The following equation can be written for the above equilibrium
according to the law of mass action.
( )
Where, Keq is the equilibrium constant, Kad is the adsorption constant, and k1 and k2 are the
forward and backward reaction rate constants. After a simple rearrangement, Equation 2.4 can be
written as-
⁄
( ) ⁄ ( )
Equation 2.5 can be expressed in the form of Langmuir isotherm equation as-
( ) ( )

30
Where, 𝜭 represents the fraction of total beads surface covered by ThT, and Ce represents the
equilibrium concentration of ThT, which is the concentration of ThT in equilibrated filtrate.
Again, Equation 2.6 can be rearranged as-
( ) ( )
Under the experimental conditions, it is more desirable to work with the total amount of ThT
adsorbed on the surface of beads (x) instead of the fraction of surface covered (𝜭).
( )
Where, xm is maximum amount of ThT that can be adsorbed on the surface of PS beads. Equation
2.7 is the equation of Langmuir adsorption isotherm. It can be expressed in terms of amount of
ThT adsorbed (x) on PS bead surfaces by combining Equations 2.7 and 2.8.
( ) ( )
For the curve fitting, theoretical values of x were obtained using estimated values of Kad and xm
in Equation 2.9. After that the error was minimized using linear regression in Excel Solver. The
experimental data were then fitted by IGOR Pro 4, which provided best fit values of parameters
(Kad and xm). Using those best fit values of parameters best fit curves were generated shown as
solid lines in Figures 2.4A and 2.4B.
2.2.5 ThT Micelle Studies
Dynamic light scattering experiments to study ThT micelle formation were performed
using a Zetasizer Nano ZS (Malvern Instruments; Westborough, MA) equipped with a HeNe
laser (633 nm). The scattering signals were collected at 173° at room temperature. To minimize

31
particle contamination of solutions, ThT was dissolved in 10.0 mM Tris buffer at pH 7.80 and
then filtered through a 0.02 µm Anotop 25 syringe filter directly into the cuvette, which had been
rinsed several times with filtered buffer. To prevent a decrease in ThT concentration due to the
adsorption on the filter, the first 5 mL of the filtrate was discarded before collecting 1 mL of the
ThT sample in the cuvette for analysis.
Surface tension was measured with a CSC Sigma 703 Tensiometer (CSC Scientific
Company; Fairfax, VA) using the DuNouy ring method. A ring with a circumference of 5.99 cm
and R/r of 53.6 was used. All the data were collected in R mode. To avoid contamination with
particulate impurities during the surface tension measurements, all solutions used were filtered
through 0.02 µm syringe filter, including water and Tris buffer used to rinse the ring and watch
glass. Thioflavin T solutions were prepared in 10.0 mM Tris buffer at pH 7.80.
2.3 Results and Discussion
Previous unpublished observations in our laboratory when using thioflavin T as a buffer
additive for fluorescence detection of individual Aβ aggregates separated by capillary
electrophoresis [45] indicated that ThT fluorescence might be enhanced by particle contaminants
of unknown origin. This led to the investigation of ThT fluorescence in the presence of
polystyrene beads to test the hypothesis that non-biological organic particles with dimensions
comparable to amyloid fibrils could lead to false positive responses when using ThT for studying
amyloid aggregation. Polystyrene beads were selected for this study because they are common in
research laboratories and are available as relatively monodisperse suspensions in a wide range of
diameters ranging from nanometers to micrometers. Polystyrene is an organic polymer, but
otherwise is not chemically similar to amyloid peptides. The ThT concentration used in these
studies (15.0 µM) was selected because it has been used successfully before in our laboratory to

32
study Aβ aggregation and is close to the concentration used in similar studies [45, 46, 70, 75,
88]. Preliminary experiments indicated that PS beads did indeed cause apparent ThT
fluorescence enhancement (data not shown) and inspired more detailed investigation of this
phenomenon.
2.3.1 Effect of Bead Diameter on ThT Fluorescence
Enhancement of ThT fluorescence by PS beads was first investigated as a function of
bead diameter. For these experiments, fluorescence was measured in microplates at fixed
excitation and emission wavelengths (excitation, 440 nm; emission, 485 nm), as is common
when ThT is used to study amyloid peptide aggregation. The concentrations of PS beads
(beads/mL) used were adjusted to account for differences in surface area per bead for different
bead diameters. Bead concentrations were selected to provide the same amount of bead surface
area per mL, assuming the fluorescence enhancement is related to ThT interaction with the PS
bead surface, similar to the proposed ThT interaction with the β-sheet motif of amyloid
aggregates [68, 70, 71, 76, 89]. Bead concentrations (beads/mL) in manufacturer stock samples
were calculated as discussed previously [85] using the values for PS bead concentration (%
solids) and PS bead density provided by the manufacturer. To prepare working samples, bead
suspensions were diluted in 10.0 mM Tris buffer (pH 7.80).
Figure 2.2 presents plots of ThT fluorescence versus bead diameter for two different PS
bead concentrations (surface area/volume), 1.26×109 µm
2/mL (Figure 2.2A) and 1.26×10
8
µm2/mL (Figure 2.2B). At both concentrations, the fluorescence enhancement increases initially
with bead diameter and then plateaus at larger bead diameters. For both concentrations used, the
maximum fluorescence intensity is approximately 3-fold that of the smallest bead size tested
(108 nm). At the higher concentration (Figure 2.2A), the fluorescence enhancement is

33
approaching the maximum for the 202 or 356 nm beads while at lower bead concentration
(Figure 2.2B), the maximum fluorescence enhancement is approached for the 356 or 535 nm
beads. It is important to note that a larger number of smaller beads was used to obtain the same
concentration in terms of surface area (µm2/mL) compared to larger beads. For example,
8.63×10¹⁰
beads/mL of the 108 nm beads have a surface area concentration of 1.26×108 µm
2/mL,
while 3.46×10⁹ beads/mL of the 535 nm beads are needed for the same surface area
concentration.
Figure 2.2. Fluorescence of 15.0 µM ThT with PS beads of varying diameter. Fluorescence was
measured with excitation at 440±12 nm and emission at 485±12 nm in a microplate reader. Three
replicate wells containing 250 µL of each sample was used and 3 measurements were made for
each well. For each well that contained PS beads with ThT, a control sample of PS beads without
ThT was used to account for scattered light from the PS beads. Averages values for each sample
were plotted after subtracting the scattered light. Fluorescence of ThT in presence of (A)
1.26×109 µm
2/mL of PS beads () and (B) 1.26×10
8 µm
2/mL of PS beads ().
There are several possible explanations for the reduced fluorescence enhancement
observed for the smaller bead diameters. One possible explanation is the increased curvature of
the smaller beads leads to a decrease in the amount of ThT adsorbed on the bead surface. The
34
ThT molecule is 1.5 nm in length for its longest axis [68]. Another possible explanation is that
the bead surface differs chemically as function of bead diameter. Unexpected PS bead
aggregation that differed with bead size could also play a part in the shape of these curves.
Finally, error in the density of the PS beads or bead concentration provided by the manufacturer
would lead to errors in the calculated concentrations.
2.3.2 Spectroscopic Studies of ThT Fluorescence Enhancement with PS Beads and
Aβ Fibrils
Most measurements of ThT fluorescence enhancement for studying amyloid peptide
aggregation are carried out at fixed excitation and emission wavelengths that are maxima for
ThT fluorescence in the presence of amyloid fibrils [46]. Similarly the ThT fluorescence
enhancement in the presence of PS beads (presented in Figure 2.2) was measured at fixed
wavelengths. While these experiments support the hypothesis that PS beads of nanometer
dimensions cause ThT fluorescence enhancement and could cause false positive responses in
studies of amyloid peptide aggregation, it is not clear that the nature of the observed fluorescence
enhancement is the same for the two particle types. Fluorescence spectroscopic studies were
carried out in order to investigate this issue further.
Figure 2.3 presents contour plots of EEMs for 15.0 μM ThT (A), 15.0 μM ThT in
presence of Aβ (1-40) fibrils (B), 15.0 μM ThT in the presence of 1.26×108 µm
2/mL 535 nm PS
beads (C), and 15.0 μM ThT in the presence of 1.26×108 µm
2/mL 108 nm PS beads (D). These
two PS bead sizes were selected because the 108 nm beads produce fluorescence enhancement
below the maximum observed and the 535 nm beads produce fluorescence enhancement at the
maximum observed (Figure 2.2). The Aβ (1-40) fibril sample was from a batch of well
characterized fibrils used in previous studies [45, 87]. In the absence of Aβ fibrils or PS beads,
the EEM of ThT shows only one peak at 332:440 nm (ex:em) (Figure 2.3A). In the presence of
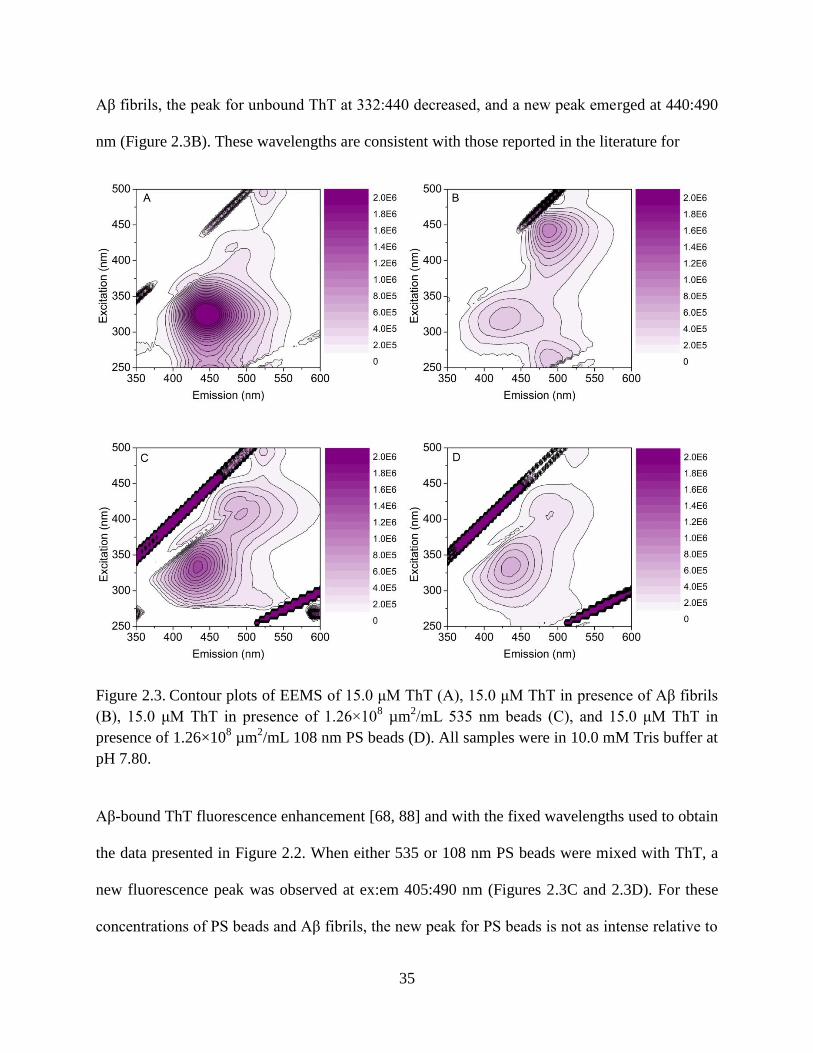
35
Aβ fibrils, the peak for unbound ThT at 332:440 decreased, and a new peak emerged at 440:490
nm (Figure 2.3B). These wavelengths are consistent with those reported in the literature for
Figure 2.3. Contour plots of EEMS of 15.0 μM ThT (A), 15.0 μM ThT in presence of Aβ fibrils
(B), 15.0 μM ThT in presence of 1.26×108 µm
2/mL 535 nm beads (C), and 15.0 μM ThT in
presence of 1.26×108 µm
2/mL 108 nm PS beads (D). All samples were in 10.0 mM Tris buffer at
pH 7.80.
Aβ-bound ThT fluorescence enhancement [68, 88] and with the fixed wavelengths used to obtain
the data presented in Figure 2.2. When either 535 or 108 nm PS beads were mixed with ThT, a
new fluorescence peak was observed at ex:em 405:490 nm (Figures 2.3C and 2.3D). For these
concentrations of PS beads and Aβ fibrils, the new peak for PS beads is not as intense relative to

36
the peak for unbound ThT, and the excitation maximum of this ThT peak in the presence of PS
beads (405 nm) is significantly shorter than that for Aβ fibrils with ThT (440 nm). The EEM
spectra show, however, that this fluorescence can still be excited at 440 nm. Using fixed
excitation and emission wavelengths, it is impossible to distinguish ThT fluorescence
enhancement due to Aβ fibrils or PS
2.3.3 Adsorption of ThT on PS Beads
Adsorption isotherms for ThT on PS beads were determined for 505 and 108 nm PS
beads and are presented in Figure 2.4. The goal of this study was to explore the nature of
interaction between ThT and PS beads surfaces and to determine the concentration of ThT
required for surface saturation of the PS beads. The PS bead concentration used (6.28×10⁹
µm2/mL) was higher than the highest concentration used in the experiments presented in Figure
2.2 (1.26×109 µm
2/mL) to ensure adequate signal-to-noise for these measurements. Overall, the
shapes of the two curves in Figure 2.4 are very similar except that the amount of ThT adsorbed is
approximately two-fold higher for the 505 nm PS beads compared to the 108 nm PS beads. This
is consistent with the data in Figures 2.2 and 2.3, which indicate that the 508 nm PS beads
produce a larger ThT fluorescence enhancement compared to 108 nm PS beads. The most
obvious difference between the two isotherms is the decrease for the highest concentration of
ThT used (60 µM) for the isotherm for 108 nm PS beads. This experiment was repeated, and this
feature is reproducible. Precipitation was observed before filtration for the experiment with 60
µM ThT and 108 nm PS beads, which could explain this result.
The experimental data were fitted to Freundlich and Langmuir adsorption isotherm
models. The adsorption isotherms for ThT with both 505 nm and 108 nm PS beads did not fit the
Freundlich model but the adsorption isotherm for ThT with 505 nm PS beads fits the Langmuir
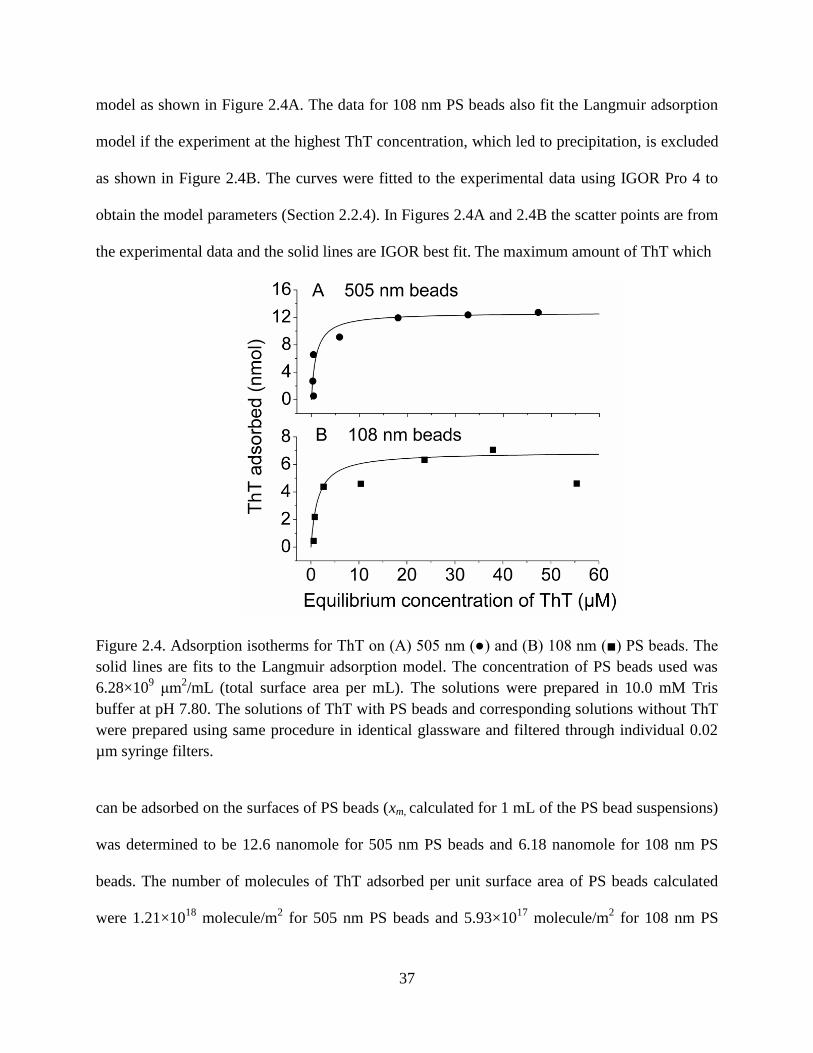
37
model as shown in Figure 2.4A. The data for 108 nm PS beads also fit the Langmuir adsorption
model if the experiment at the highest ThT concentration, which led to precipitation, is excluded
as shown in Figure 2.4B. The curves were fitted to the experimental data using IGOR Pro 4 to
obtain the model parameters (Section 2.2.4). In Figures 2.4A and 2.4B the scatter points are from
the experimental data and the solid lines are IGOR best fit. The maximum amount of ThT which
Figure 2.4. Adsorption isotherms for ThT on (A) 505 nm () and (B) 108 nm () PS beads. The
solid lines are fits to the Langmuir adsorption model. The concentration of PS beads used was
6.28×109 μm
2/mL (total surface area per mL). The solutions were prepared in 10.0 mM Tris
buffer at pH 7.80. The solutions of ThT with PS beads and corresponding solutions without ThT
were prepared using same procedure in identical glassware and filtered through individual 0.02
µm syringe filters.
can be adsorbed on the surfaces of PS beads (xm, calculated for 1 mL of the PS bead suspensions)
was determined to be 12.6 nanomole for 505 nm PS beads and 6.18 nanomole for 108 nm PS
beads. The number of molecules of ThT adsorbed per unit surface area of PS beads calculated
were 1.21×10¹⁸
molecule/m2 for 505 nm PS beads and 5.93×10
17 molecule/m
2 for 108 nm PS

38
beads. For a small size molecule such as ThT the values seem reasonable in comparison to the
number of molecules of insulin adsorbed on polystyrene beads the literature [90].
2.3.4 ThT and Micelles
A recent publication proposes that ThT micelle formation plays a central role in
fluorescence enhancement of ThT in the presence of amyloid fibrils [75]. This led to the
investigation of ThT micelle formation to determine if they might play a role in ThT
fluorescence enhancement in the presence of PS beads. The initial objective was to determine the
critical micelle concentration (cmc) for ThT in the buffer used in this work, 10.0 mM Tris at pH
7.80. Previous cmc values for ThT in the literature have ranged from 3.75 µM to 31.4 µM and
have been measured in unbuffered water as well as buffered solutions from pH 2 to 7 [74, 75].
Both Khurana et al. and Sabate et al. used conductivity measurements to determine cmc values
of ThT in unbuffered water (4.0±0.5µM [75] and 31±2 µM [74]). Using conductivity
measurements to determine the cmc for ThT in the buffer used in this study was not feasible due
to the low expected cmc values and the relatively high concentration and conductivity of the
buffer of interest, 10.0 mM Tris at pH 7.80.
An attempt was made to measure the ThT cmc based on the spectrofluorometric method
reported by Khurana et al. [75]. A plot of fluorescence versus concentration of 12 different
concentrations of ThT (0.391 µM to 49.3 µM) in 10.0 mM Tris buffer at pH 7.80 is presented in
Figures 2.5. No clear break indicating a cmc is observed in this plot. Upon closer inspection of
Figure 2B in the article by Khurana et al., [75] it was determined that apparent break in this plot
is most likely an artifact due to the way the data were plotted. When the data from our study are

39
Figure 2.5. Fluorescence of ThT solutions at different concentrations in 10.0 mM Tris buffer at
pH 7.80 (A). (B) is 10× enhancement of lower concentration part of A. Fluorescence emission of
ThT solutions was measured at 482 nm with the excitation at 450 nm.
plotted in the same fashion (Figure 2.6), it appears that there is a break in the plot at a ThT
concentration of about 3 µM, which could be erroneously attributed to micelle formation. Our
results give no indication of micelle formation over the concentration range studied.
Figure 2.6. Data from Figure 2.5 plotted with a break in the x-axis from 2.5 to 7.0 µM ThT as
was done in Figure 2B from Khurana et al.76
Absorbance spectra and EEMs were obtained for five different concentrations of ThT
from 1.98 µM to 49.6 µM to see if any spectral shifts were observed that could indicate micelle

40
formation. The absorbance spectra are presented in the Figure 2.7. Contour plots for the EEM’s
for the lowest and highest ThT concentrations studied (1.98 µM and 49.5 µM) are shown in
Figure 2.8. No spectral shifts possibly indicating micelle formation were observed in the
absorbance spectra and EEM’s.
Figure 2.7. Absorbance spectra of different concentrations of ThT solutions in 10.0 mM Tris
buffer at pH 7.80.
Dynamic light scattering (DLS) was next used in an attempt to observe the formation of
ThT micelles. The instrument used for DLS measurements could detect aggregates down to
approximately 0.5 nm, but the results in 10.0 mM Tris at pH 7.80 gave no indication of ThT
micelle formation for ThT concentrations up to 150 µM (data not shown). The publication by
Khurana et al. claimed detection of ThT micelles with a diameter of 3 nm diameter using AFM,
[75] and micelles of this size should have been detected in these DLS experiments. Similarly,
this result does not agree with various cmc values for ThT reported by Sabate et al. in buffered
solutions using fluorescence anisotropy measurements [74]. The study by Sabate et al. concluded
that micelle formation was not important for ThT fluorescent enhancement because it could be

41
observed well below the cmc values they determined with fluorescence anisotropy in buffered
solutions (13.5 µM at pH 2, 8.0 µM at pH 7).
Figure 2.8. Contour plots of EEMs of 1.98 μM ThT (A) and 49.5 μM ThT (B) in 10.0 mM Tris
buffer at pH 7.80. Inner filter correction was performed before plotting the data.
Because the spectrofluorometric, spectrophotometric and DLS results disagreed with
previous literature reports claiming ThT micelle formation at micromolar concentrations, surface
tension measurements were used to confirm our finding. Formation of micelles will reduce the
surface tension of a solution [91]. We measured surface tension of solutions of ThT in 10.0 mM
Tris buffer at pH 7.80 at 21 different concentrations from1.00 µM to 100 µM. Ultrapure water
was used for the calibration of the instrument at the beginning of each set of measurements. As
discussed in Section 2.2.5, care was taken to prepare clean solutions and to avoid particle
contamination. The measured surface tension of all the solutions containing ThT were within
79.3±0.4 mN/m2 (data not shown), indicating no micelle formation. Although none of the
experiments carried out here suggested micelle formation, fluorescence anisotropy studies
suggest some type of self-association for ThT as micromolar concentrations [74, 75].

42
2.4 Conclusions
This work demonstrates that polystyrene beads can cause Thioflavin T fluorescence
enhancement similar to that produced by Aβ fibrils. This shows that the non-amyloid particles
can produce false positive signals in amyloid aggregation studies using ThT fluorescence. While
there are some spectral differences between ThT fluorescence enhancement due to PS beads and
amyloid fibrils, these differences will not be apparent at the fixed excitation and emission
wavelengths typically used with ThT for studying amyloid aggregation. Thioflavin T adsorption
on PS beads is consistent with the Langmuir adsorption isotherm. There was no indication of
ThT micelle formation at micromolar concentrations using four different methods, despite
literature reports of ThT micelle formation [74]. This result supports researchers who have
questioned the role of micelles in ThT enhancement in the presence of amyloid aggregates [74].
While ThT fluorescence enhancement is a valuable tool for studying amyloid formation, this
work demonstrates that there are significant limitations to the selectivity of this method for
amyloid.

43
CHAPTER 3. DEVELOPMENT OF A THREE-CHANNEL LIGHT
SCATTERING AND FLUORESCENCE DETECTOR FOR CAPILLARY
ELECTROPHORESIS AND ITS APPLICATION TO THE ANALYSIS OF
INDIVIDUAL AMYLOID AGGREGATES
3.1 Introduction
Protein aggregation is a process in which monomeric peptides self-assemble to form
larger and often insoluble structures [29]. Although protein aggregation is sometimes an
important part of normal biological pathways, it is also closely linked to many diseases [19, 29].
For example, aggregation of amyloid beta (Aβ) peptide to form oligomers, protofibrils, and
fibrils is thought to be responsible for Alzheimer’s disease (AD) pathology [19, 20, 29, 92, 93].
Recent research points to oligomeric species as the most neurotoxic form of Aβ peptide [14, 19,
21-23, 29, 94, 95]; however, multiple research reports have shown that oligomers, protofibrils,
and fibrils all exhibit toxicity [12, 19, 21, 93].
Scientists studying Aβ aggregation and its relationship to AD, ideally would like to
quantify and know the structure of all of the different aggregated forms of Aβ present as a
function of time. This would lead to a better understanding of the aggregation process, which
aggregates are toxic and how to block, alter or reverse aggregation in order to treat AD [19, 29].
No one analytical technique is up to this challenge. Most commonly used techniques for Aβ
aggregation analysis - thioflavin T (ThT) fluorescence, transmission electron microscopy (TEM),
and atomic force microscopy (AFM) - provide qualitative or indirect information about the
aggregation state of Aβ peptide [3, 19, 68]. Spectroscopic techniques such as nuclear magnetic
resonance (NMR), mass spectrometry (MS), and x-ray crystallography have been able to
elucidate secondary and tertiary structures of Aβ peptide aggregates [96]. Separation techniques
such as HPLC, size-exclusion chromatography (SEC), gel electrophoresis, and centrifugation

44
techniques are well suited for analyzing relatively stable aggregates, but these methods likely
disrupt or alter many aggregated species of potential interest [3, 51, 97]. Capillary
electrophoresis is emerging as an effective separation tool studying Aβ aggregation [45, 46, 79,
87, 98-105].
Capillary electrophoresis has been used with UV absorbance detection for the analysis of
monomeric Aβ peptides, intermediate aggregates of Aβ peptides and fully formed fibrils [87, 98,
99, 102, 105]. Capillary electrophoresis with laser-induced fluorescence (LIF) detection has been
used with thioflavin T (ThT) in the separation buffer to study Aβ peptide aggregation and its
inhibition [45, 46, 79]. Kato et al. demonstrated the separation and detection of Aβ peptide
monomer and aggregates using this approach [46]. Picou and coworkers used CE-LIF with ThT
in the separation buffer for the separation and detection of individual Aβ aggregates [45]. Picou
and coworkers also explored the use of CE with laser-induced fluorescence anisotropy (LIFA)
detection to separate, detect, and characterize individual Aβ aggregates [45, 79, 106].
Laser light scattering (LLS) has been used for the detection of individual particles similar
in size to Aβ fibrils [58-62, 67, 85]. The intensity of light scattered by a single particle of these
dimensions depends on the scattering angle, size and shape of the particle, and the wavelength
and polarization of the light source used to produce scattering signals [63]. Laser-induced
fluorescence and LLS are commonly combined in flow cytometry, and this combination has
played an important role in characterizing cells and other biological particles of similar size [107,
108]. Multiangle detection is not commonly practiced in CE. Pamme et al. have reported
collection of LLS signals at 15° and 45° with respect to the incident light for CE in a microchip
device applied to the analysis of latex beads of 3 and 6 µm diameter [58]. Andreyev et al.
demonstrated simultaneous LIF and LLS detection for CE. This CE-LIF-LLS instrument was
45
used to detect individual fluorescent particles separated by CE and also was applied for
monitoring changes in mitochondrial morphology during cryogenic storage [67]. The
combination of multiangle LLS and LIF detection with CE separations has not been reported.
In this Chapter we report the development of a three-channel detector for CE and its
application to analyze individual A aggregates. The detector was designed for simultaneous
collection of scattered light at two angles (20° and 90°) and fluorescence at 90° with respect to
the incident laser light. The instrument was first characterized by analyzing fluorescently labeled
and unlabeled polystyrene (PS) beads. Then the instrument was used to analyze samples of
aggregated and fluorescently labeled Apeptide.
3.2 Experimental Section
3.2.1 Chemicals
Polystyrene (PS) beads of different diameters (1072±19, 771±25, 535±08, 505±10
356±14, 202±10, 108±4.5, and 59±2.3 nm) were purchased from Polysciences (Warrington, PA).
Blue fluorescent PS beads (310 nm diameter) and nonfluorescent PS beads (80 nm diameter)
were purchased from Duke Scientific (Palo Alto, CA). Fluoro-Max blue fluorescent PS beads
with diameters of 700, 480, and 100 nm were purchased from Thermo Scientific (Fremont, CA).
Tris (hydroxymethyl) aminomethane (Tris) was purchased from Acros (Geel, Belgium).
Hydrochloric acid, boric acid, and disodium ethylenediaminetetraacetate (EDTA) were
purchased from Fisher Scientific (Pittsburgh, PA). A 10.0 mM Tris buffer was prepared in
ultrapure water (>18 MΩ·cm) from a Modulab water purification system (United States Filter;
Palm Desert, CA) and adjusted to pH 7.80 with HCl. A buffer containing 1.40 mM borate, 1.40
mM Tris, and 0.314 mM disodium EDTA (TBE) was prepared in ultrapure water, and the pH
was adjusted to 8.40 with HCl. Both Tris and TBE buffers were first vacuum filtered using a 0.1

46
µm nylon filter (Fisher Scientific; Pittsburgh, PA) and again filtered twice with a 0.02 µm
syringe filter (Fisher Scientific) before use. The concentration of beads in the samples was
determined using the polymer concentration provided by the manufacturer and the density of the
PS beads as described previously [85]. Suspensions of PS beads were prepared by diluting the
stock suspension in TBE buffer. All samples were homogenized by vortexing, just prior to use. A
1.40 mM stock solution of coumarin 500 was prepared in methanol, and 1.00 µM working
solutions of coumarin 500 were prepared by diluting the stock solution in 10.0 mM Tris buffer or
TBE buffer. Similarly 0.1% (v/v) working solutions of mesityl oxide were prepared by diluting
the original solution either in 10.0 mM Tris buffer or TBE buffer.
3.2.2 Aβ Peptide Sample Preparation and Characterization
Unlabeled Aβ (1-40) peptide was purchased from the W.M Keck Foundation
Biotechnology Research Laboratory (Yale University, New Haven, CT). Aβ (1-40) peptide
labeled with carboxyfluorescein (FAM-Aβ (1-40)) was purchased from Anaspec (Fremont, CA).
The arctic Aβ (1-40) was purchased from BioSource (Grand Island, NY). Each Aβ peptide
monomer in FAM-Aβ (1-40) is covalently labeled with a single carboxyfluorescein on the first
aspartic acid on the amine terminus of the peptide chain as shown below.
FAM-D1AEFRHDSGYEVHHQKLVFF
20AEDVGSNKGAIIGLMVGGVV
40
The Arctic Aβ (1-40) is a variant of the normal Aβ (1-40) peptide in which the Glutamic acid (E)
at position 22 of the peptide chain is replaced by Glycine (G) as shown below.
D1AEFRHDSGYEVHHQKLVFF
20AGDVGSNKGAIIGLMVGGVV
40
The monomeric peptide solutions of labeled, unlabeled, and arctic Aβ (1-40) were prepared
independently as described previously [45, 69]. Briefly, Aβ peptides were first treated with
trifluoroacetic acid (TFA) and hexafluoroisopropanol (HFIP) to dissolve any preexisting

47
aggregates. For the Aβ monomer sample the TFA and HFIP were evaporated off and the peptide
sample was dissolved in 10.0 mM Tris buffer at pH 7.80. For the fibrils and the samples for
aggregation study the TFA and HFIP were evaporated off and the peptide samples were
dissolved stepwise in equal volumes of 2.0 mM NaOH and 2× phosphate-buffered saline (PBS)
containing 22.8 mM phosphate, 274 mM NaCl, 5.4 mM KCl, and 0.1% NaN3 at pH 7.4. The
samples were centrifuged at 50,000g for a minimum of 10 h at 4 °C. The concentration of
respective Aβ in the supernatant was determined using HPLC [69]. After the concentrations were
determined, the FAM-Aβ (1-40) was mixed at a mass ratio of 1:4 or 1:1 with unlabeled Aβ (1-
40) or Arctic Aβ (1-40) respectively, to give final total monomeric equivalent Aβ concentrations
between 20 and 25 µM. The total mixture prepared was 1 mL. The Aβ peptide monomeric
mixtures were incubated at 37 °C and ambient pressure for 7 days to prepare fully formed Aβ
fibrils. The fibrils sample of the mixture of FAM-Aβ (1-40) and Aβ (1-40) used in this study was
prepared for another study. An aliquot of the sample was snap frozen by liquid nitrogen and
stored at -80 °C until thawed for this study. A 200 µL aliquot of the thawed sample was lightly
vortexed to homogenize the mixture and suspend any aggregates that may have settled to the
bottom of the centrifuge tube and was buffer exchanged from PBS buffer into the 10.0 mM Tris
buffer at pH 7.80 for CE analysis as discussed below. For the aggregation study the Aβ peptide
monomeric mixture was incubated at 37 °C and ambient pressure and aliquots of the sample
were taken out of the aggregating mixture on day 1, 3, and 6. For this, the sample was removed
from the incubator, lightly vortexed to resuspend and homogenize any aggregates which may
have settled at the bottom of the centrifuge tube. The 200 µL aliquots were taken out for the
analysis and remaining portion of the mixture was returned to the incubator to continue the
aggregation process. The removed aliquots were buffer exchanged from PBS buffer into 10.0

48
mM Tris buffer at pH 7.80 for the CE analysis as discussed below. The aliquots of the
aggregating mixture were carefully used in a previous study and saved at -20 °C until reused in
this study.
For the buffer exchange, the sample was placed in a 3000 molecular weight cutoff
Microcon filter cartridge and centrifuged at 14,000 rpm (approximately 20,000g) at 4 °C for 60
min. The retained portion of the sample was resuspended in Tris buffer. This process was
performed until the theoretical volume % of PBS was below 5% which typically required 3
cycles of centrifuging. Then, the Microcon filter was inverted into a clean centrifuge tube and
spun at 3000 rpm for 1 min to collect the Aβ fibrils sample. The sample was transferred to a 200
µL thermowell polypropylene tube (Corning Incorporated; Corning, NY) and put on ice until CE
analysis, which was performed approximately 2 hr after completing the buffer exchange. To
minimize photobleaching of the fluorophore-labeled peptide during sample preparation, buffer
exchange, storage, and CE analysis, exposure of the sample to ambient light was minimized by
wrapping with aluminum foil when feasible.
3.2.3 Capillary Electrophoresis
Fused-silica capillaries with a 52 µm i.d. and 362 µm o.d. (Polymicro Technologies;
Phoenix, AZ) were used for all CE experiments. For all CE experiments, the detection window
was made by removing the polyimide coating using a window maker (MicroSolv Technology;
Eatontown, NJ). Each new capillary was rinsed before use with 1.0 M NaOH, ultrapure water,
and then the separation buffer using 20.0 psi applied by the P/ACE MDQ for 10.0 min each or
using a manual syringe pump with the laboratory-constructed instrument described below. For
all CE experiments, the separation buffer was either 10.0 mM Tris at pH 7.80 or TBE at pH 8.40.

49
3.2.4 CE-UV Absorbance Detection
A commercial CE system (P/ACE MDQ; Beckman Coulter; Fullerton, CA) was used for
CE experiments with UV absorbance detection. The CE instrument was equipped with a
deuterium lamp and a PDA detector. A fused-silica capillary with a 60.0 cm total length and 50.0
cm length to the detection window (effective length) was used. Sample solutions were injected
for 5.0 s at 0.5 psi, and separations were performed at a field strength of 417 V/cm. The sample
vials and capillary were thermostatted at 20 °C. Data were acquired using 32 KaratTM
Software
Verson 5.0 from Beckman Coulter at an acquisition rate 32 Hz. The data were plotted using
OriginLab 7.5 (Northampton, MA).
3.2.5 CE with Two Channel Laser Light Scattering and Laser-Induced
Fluorescence Detection (CE-LLS2-LIF) detection
For experiments with LLS and LIF detection, a CE instrument was designed and
constructed in house. The CE portion of the instrument was similar to an instrument described
previously [109]. A fused-silica capillary with a 65.0 cm total length and 45.0 cm length to the
detection window (effective length) was used. A Spellman CZE1000R high-voltage power
supply (Hauppauge, NY) was used to apply the electrophoretic potential. Samples were
electrokinetically injected at the inlet end of the capillary using 385 V/cm for 3.0 s unless
otherwise noted, and separation was carried out with TBE buffer for PS bead analysis and Tris
buffer for Aβ sample analysis. The detector was designed for simultaneous collection of
scattered light at two angles (20° and 90°) and fluorescence at 90°. A schematic of the CE-LLS2-
LIF instrument is shown in Figure 3.1. Light from a 404 nm diode laser (Power Technology,
Little Rock, AR) was attenuated to 0.6 mW (unless otherwise noted) using a neutral density filter
(Edmund Industrial Optics; Barrington, NJ) and focused onto the capillary window using a UV
grade achromatic lens (f = 60 mm; Rolyn Optics; Covina, CA). The fluorescence and scattered

50
light at 90° were collected using an infinity corrected microscope objective (MO, 0.28 NA, 10×,
f = 200 mm, working distance = 45 mm) (Optical Product Development; Lexington, MA). The
fluorescence and scattered light were first separated using a 420 nm cutoff dichroic mirror
(Omega Optical; Brattleboro, VT), which reflected the scattered light at 45° with respect to the
dichroic mirror and passed the fluorescence through. The fluorescence and scattered light were
then spectrally filtered by a 440 nm longpass filter (Melles Griot; Carlsbad, Ca) and 405±10 nm
bandpass filter (Melles Griot), respectively. The spectrally filtered light was focused with lenses
(f = 125 mm for scattering and f = 200 mm for fluorescence; Edmund Industrial Optics;
Barrington, NJ) onto an 800 µm aperture (Oriel; Stratford, CT). Light scattered at 20° was
collected using an infinity corrected microscope objective (MO, 0.23 NA, 10×, f = 200 mm,
working distance = 45 mm; Edmund Industrial Optics). A neutral density filter was used to
reduce the signal of the 20° scattering channel, and spectrally filtered using a 405±10 nm
bandpass filter (Melles Griot). The scattered light was then focused onto a 500 nm aperture
(Oriel) using a UV grade plano-convex lens (f = 200 mm; Edmund Industrial Optics). The
spectrally and spatially filtered fluorescence and scattered light was then detected by three
individual PMTs (Hamamatsu; Bridgewater, NJ) biased at 700 V. Additional neutral density
filters were used in front of the PMTs for the two LLS channels to bring the signals on scale
when necessary. The PMT outputs were filtered using individual 1 kHz lowpass RC filters and
sent to a data acquisition board (PCI-6229, National Instruments; Austin, TX). A LabVIEW
(Version 7.1, National Instruments) program written in house was used for data acquisition at 3.0
kHz. The data were analyzed using OriginLab 7.5 (Northampton, MA), Synaptosoft
MiniAnalysis Program (version 6.0.7), and Microsoft Excel 2010.

51
Figure 3.1. Schematic of CE system with three channel laser light scattering and laser-induced
fluorescence detection. Abbreviations are: ND - neutral density filter, MO - microscope
objective, BD - beam dump, DM - dichroic mirror, LP - longpass filter, BP - bandpass filter, L -
plano-convex lens, PH - pinhole, PMT - photomultiplier tube. RC - 1 KHz lowpass RC filter, and
ADC - analog-to-digital converter.
3.3 Results and Discussion
A detector for CE was developed with light scattering detection at two angles (20° and
90°) combined with LIF detection and applied to the analysis of Aβ peptide aggregates (Figure
3.1). Analysis of aggregating samples of amyloid proteins is extremely challenging because the
samples are heterogeneous and complex, and analytical standards for the aggregates do not exist.
The instrument developed here attacks this challenge by providing several types of information
about amyloid aggregates detected individually: electrophoretic mobility, light scattering at 20°
(forward scattering), light scattering at 90° (side scattering), and fluorescence. While the
instrumentation certainly becomes more complex as the number of distinct detection channels is
increased, meeting analytical challenges such as studying amyloid aggregation requires such
complexity.
52
3.3.1 Development and Characterization of the CE-LLS2-LIF System
The design of the two detection channels at 90° with respect to the excitation source (LIF
and 90° LLS) for the CE-LLS2-LIF instrument follows the approach commonly used with CE
instruments for multichannel fluorescence [110, 111], except that the dichroic mirror was used to
separate light scattered at 90° from fluorescence instead of separating fluorescence emission at
two wavelengths. The addition of a second detection angle (20° scattering) required the use of a
second microscope objective. This required the use of microscope objectives with long working
distances (45 mm) so both objective lenses could be physically located near the detection spot of
the CE capillary. Other aspects of the detector such as data collection for individual particles
were similar to earlier instruments [45, 85]. The instrument was aligned using 1 M coumarin
500 for fluorescence and polystyrene beads (59 nm diameter, 2.33×10¹¹
beads mL-1
) for light
scattering.
The LIF channel was aligned using 1 µM solution of coumarin 500 solution adjusting the
positions of microscope objective, focusing lens, and the PMT were to yield maximum
fluorescent signals. The fluorescent signals were filtered through a 440 nm longpass filter before
focusing the beam into the PMT with a lens. The signal was also spatially filtered with an 800
nm pinhole in front of PMT. The 20° LLS was also aligned similarly by replacing the 405±10
nm bandpass filter with a 500 nm longpass filter at first. But, after aligning to yield highest
fluorescent signal, it required fine adjustment of the optics with 405±10 nm bandpass filter to
obtain lowest possible background signal. Hence, the bandpass and longpass filters had to be
switched back and forth multiple times. A ND filter was placed in between the MO and bandpass
filter to reduce high signal intensity of forward LLS detection channel. The scattered light was
then focused into the PMT after filtering through a 500 nm pinhole. For the alignment of 90°

53
LLS optics, first a high concentration suspension of 1072 nm PS beads (3.90×10⁷
beads mL-1
)
were used to roughly focus the scattered light into the PMT. Then, a 1×10⁻³
% suspension
(2.33×10¹¹
bead mL-1
) of 59 nm diameter PS beads was used to align the channel and obtain a
maximum scattered light intensity. This channel also contained a 405±10 nm band pass filter, a
focusing lens and an 800 nm pinhole in front of PMT. Finally, the signals of PS beads from all
three channels were carefully compared by overlapping the data, as shown in Figure 3.2B, to
confirm that both MOs were focused on the same spot of the capillary window. If they were
focused at different spots, the signals would not overlap. A final adjustment of the XYZ
positioner of both MOs was required to make sure both MOs were focused on the same spot of
the capillary window.
The instrument was optimized and characterized using both fluorescent and
nonfluorescent polystyrene beads. Although the main objective of developing the instrument was
to apply it to the analysis of amyloid aggregates, standards for these aggregates do not exist.
Polystyrene beads serve as effective surrogates for development and testing of the instrument
since they are available as reasonably monodisperse suspensions with a wide range of diameters
(nm-m) and in both fluorescent and nonfluorescent forms. Figure 3.2A shows data for 700 nm
fluorescent PS beads detected individually with each of the detection channels plotted as a
separate electropherogram. The PS beads are detected in all three channels, and the appearance
of the electropherograms is similar to earlier work with PS beads using only 90° LLS detection
[85]. Figure 3.2B shows an expanded view (150 ms) of the experiment with all three detection
channels in one plot. Two individual PS nanoparticles were detected during this time period.
Figure 3.2B shows same intensity ratios of signals from different detection channels for each
particle. Table 3.1 shows the average ratios of peak intensities of 89 peaks (from 3 CE runs)

54
Figure 3.2. Separation and detection of individual 700 nm diameter fluorescent PS beads using
CE-LLS2-LIF. (A) Electropherograms obtained from all 3 detection channels for one injection.
(B) An expanded view of the electropherogram with all 3 channels in one plot. The excitation
laser power was 0.4 mW. The bead suspension was prepared in TBE buffer at pH 8.40 and
electrokinetically injected for 3.0 s at 385 V/cm. The calculated number of particles injected was
76. The same TBE buffer was used as the separation buffer, and the electrophoretic current was
0.34 µA.
from 700 nm fluorescent PS beads. The signal intensity ratios are 0.607±0.223, 1.76±0.555, and
3.06±0.539 for 20° LLS/90° LLS, 20° LLS/LIF, and 90° LLS /LIF, respectively. Signal intensity
ratios of 310 nm fluorescent PS beads are also included in Table S1 for comparison, the ratios
are 0.591±0.261, 2.87±0.983, and 5.27±1.56 for 20° LLS/90° LLS, 20° LLS /LIF, and 90° LLS
/LIF, respectively.
Table 3.1. Signal intensity ratios of fluorescent PS beads from CE-LLS2-LIF system
Bead size 20° LLS/90° LLS 20° LLS /LIF 90° LLS /LIF
700 0.607±0.223 1.76±0.555 3.06±0.539
310 0.591±0.261 2.87±0.983 5.27±1.56
The size detection limit (smallest PS bead diameter) was determined for this instrument
in all three detection channels. Figure 3.3 shows an electropherogram for nonfluorescent 80 nm
PS beads detected by LLS at 90°. The inset in Figure 3.3 presents a 1.0 s region of the
electropherogram. The average S/N ratio for these peaks was 20. These beads were not

55
detectable by LLS at 20°. Nonfluorescent PS beads with a diameter of 59 nm were not detectable
individually by LLS at 90° or 20°. This size detection limit (80 nm diameter) is an improvement
of the 110 nm detection limit reported by Rezenom et al. for CE with LLS detection at 90° [85],
and it is similar to the size detection limits for PS beads using LLS detection reported by other
research groups. Steen et al. have reported a detection limit of 74 nm diameter at 16° using flow
cytometer [112], Zarrin et al. have reported a detection limit of 88 nm diameter at 90°, using
capillary hydrodynamic chromatography with sheath flow cuvette [61]. and Hercher et al. have
reported detection limit of 91 nm diameter at 90° using flow cytometer [113].
Figure 3.3. Separation and detection of individual 80 nm diameter PS beads (nonfluorescent)
using the CE-LLS2-LIF system. The inset shows an expanded view of the 1 s region of the
electropherogram from the 90° LLS channel. The excitation laser power was 0.6 mW. The
calculated number of particles injected was 111. All other conditions are the same as in Figure
3.2.

56
The smallest PS beads detectable individually by LLS at 20° had a diameter of 202 nm
diameter with an average S/N value of 19 (electropherograms not shown) The average S/N
values for PS beads near the size detection limits for the three detection channels are presented in
the Table 3.2. The smallest fluorescent PS beads detected individually in this study had a
diameter of 310 nm and an average S/N of 217. Electropherograms for the 310 nm beads are
presented in the Figure 3.4. The next smallest size fluorescent PS bead tested had a diameter of
100 nm and could not be detected individually. It is difficult to quantitatively compare the size
detection limit for fluorescent PS beads to the other two detection channels or to other reports in
the literature in a meaningful way. Duffy et al. have reported analysis of fluorescently labeled PS
beads using CE-LIF with sheath flow detection, the smallest size PS beads detected was 200 nm
diameter using 488 nm Ar+ laser as excitation source [114]. This detection limit will be highly
dependent on the fluorophore used and the loading of this dye in the PS bead. Such information
from manufacturers is often limited. It is not surprising that the size detection limit for LLS at
20° is higher than that for LLS at 90°. Generally forward scattering (20°) is more intense for
larger particles while side scattering (90°) is more intense for smaller particles [61, 63]. The
dependence of scattering at 90° is known to be a complex function of bead diameter for particles
of these dimensions [85, 115, 116], while forward scattering intensity increases more regularly
with increasing particle size [63].
Table 3.2. Detection efficiency of CE-LLS2-LIF system
Bead diameter
(µm)
Number of
beads injected
Detection efficiency (%)
20° LLS 90° LLS LIF 10.700 73 53 66 66
10.310 109 31 42 42
20.108 73 0 42 NA
20.080 112 0 17 NA
Note: 1- fluorescent PS beads, 2- nonfluorescent PS beads
Given values are averages of 5 CE injections.

57
Figure 3.4. Separation of individual 310 nm diameter blue fluorescent PS beads using CE-LLS2-
LIF system. The bead solution was prepared in TBE buffer at pH 8.40 and electrokinetically
injected for 3 s at 385 V/cm. The separation was performed in TBE buffer at pH 8.40. The
current was 0.32 µA. The detection conditions were same as in Figure 3.3. The number of
particles injected was 110. The CE electropherograms obtained from the three channels are
shown separately.
Table 3.3. Signal to noise ratio of different size PS beads for the signals obtained from CE-LLS2-
LIF system
Bead diameter (µm) S/N
20° LLS 90° LLS LIF 10.310 122 770 217
20.202 19 542 NA
20.108 NA 85 NA
20.080 NA 20 NA
Note: 1- fluorescent PS beads, 2- nonfluorescent PS beads
Given values are averages of 5 CE injections.
The detection efficiency of the CE-LLS2-LIF system for individual particles was
investigated, and the results are presented in Table 3.2. The number of peaks detected for each
bead size examined with a S/N ≥ 5 was divided by the calculated number of peaks injected. For
both the 700 nm and 310 nm PS beads, the detection efficiencies in the to 90° detection channels

58
(LIF and LLS) were identical, while the detection efficiency of the 20° LLS channel was ~12%
lower. The average S/N for detection of individual 310 nm PS beads with the 20° LLS channel
was 122 (Table 3.3), so it is unlikely that this is the cause of the relatively low detection
efficiency for this channel. The detection efficiencies for all 3 channels are~23% lower for 310
nm PS beads compared to 700 nm PS beads (Table 3.2), but again it is unlikely that poor S/N is
the cause of this difference (Table 3.3). As discussed in previous work [85] the calculated
number beads injected depends on the accuracy of the bead concentration and bead density data
provided by the manufacturer as well as the accuracy of calculations for electrokinetic injections.
The other factor impacting the detection efficiency is the size of the focused laser spot relative to
the capillary i.d. The calculated spot size was 6 m while the capillary i.d. was 52 m, but the
actual spot size was certainly somewhat larger due to distortions by the curved fused-silica
capillary and imperfections in the objective lens and alignment. Overall, these detection
efficiency values compare favorably to those obtained for an earlier single channel CE-LLS
instrument and a CE-LIF instrument [85, 114]. Not only the detection efficiency but also the %
of peaks detected in all the detection channels indicates the quality of the detector. Table 3.4
shows the number as well as % of peaks detected in different detection channels for two size
(700 nm and 310 nm) fluorescent PS beads. 85.6% 700 nm and 55.3% 310 nm PS beads were
detected in all three detection channels. Only 13.8% 700 nm PS beads could not be detected in
20° LLS channel, which could be due to the relatively higher size detection limit of 20° LLS
channel. But, higher % of 310 nm PS beads (43.5%) were not detected in 20° LLS channel,
which is obvious because of their smaller size. Only 0.60% 700 nm PS beads were detected only
in LLS channels which could be due to nonfluorescent dust particles contamination. 1.24% of

59
310 nm PS beads were detected only in 90° LLS channel, which is obvious for such a small size
PS beads.
Table 3.4. Number of beads detected in different detection channels of CE-LLS2-LIF system
Bead diameter
(nm)
Number of peaks detected
Total in all three
channels
in 90° LLS
and LIF
in 90° LLS
and 20° LLS
in 90° LLS
only
700 152 130 (85.6%) 21 (13.8%) 1 (0.658%) 0
310 161 89 (55.3%) 70 (43.5%) 0 2 (1.24%)
Figure 3.5 shows CE a separation of a mixture of fluorescent (310 nm) and
nonfluorescent (356 nm and 505 nm) PS beads. The three detection channels are plotted as
separate electropherograms. The electropherograms from 20° and 90° LLS detection channels
show that the three bead types are well separated electrophoretically. The LIF channel shows
Figure 3.5. Electrophorograms of a mixture of fluorescent PS beads (310 nm) and nonfluorescent
PS beads (356 and 505 nm) using the CE-LLS2-LIF system. The calculated numbers of particles
injected were 61, 102, and 109 particles for 310, 356, and 505 nm PS beads, respectively. All
other conditions are the same as in Figure 3.3.

60
that the fluorescent PS beads eluted from 280-292 s. Importantly, there are no signals in the LIF
channel for the two populations of nonfluorescent beads, demonstrating the effectiveness of
spectral filtering for eliminating scattered light in this detection channel. The nonfluorescent 356
nm beads (303-312 s) and 505 nm beads (324-340 s) produced signals in both LLS channels, but
the peaks had to be identified by injecting them individually. The intensity ratios of 20° and 90°
LLS signal of 310 nm (0.558 ± 0.227), 356 nm (0.417 ± 0.219) and 505 nm (0.901 ± 0.485)
clearly shows the effect of size. The values of 20° LLS/90° LLS of 310 nm and 356 nm PS beads
are close, reflecting the close PS beads diameter. The higher values of 20° LLS/90° LLS for 505
nm PS beads shows the effect of size on the forward scattering signal intensity.
3.3.2 Separation and Detection of Individual Aβ Aggregates
The development of this CE-LLS2-LIF instrument was inspired by the challenge of
analyzing aggregated Aβ peptide samples in order to obtain a better understanding of Aβ peptide
aggregation and the effect of molecules designed to inhibit and reverse this process. As a first
step towards applying this instrument to study Aβ aggregation, three different Aβ sample types
were analyzed with the CE-LLS2-LIF instrument: a mixture of FAM-Aβ (1-40) and unlabeled
Aβ (1-40) monomer, mature fibrils (aggregated) from a similar mixture of FAM-Aβ (1-40) and
unlabeled Aβ (1-40). The monomer sample was prepared specifically for this study, and
aggregated Aβ samples were prepared for a previous study and stored at -80 ˚C for use in this
work [106]. The samples from previous studies were characterized at the time of preparation and
initial use. All samples analyzed by CE-LLS2-LIF were analyzed by CE-UV as part of this study
to verify the condition of the samples after preparation and storage (Figure 3.6). Previous work
has shown CE-UV to be an effective tool for analyzing Aβ peptide monomer preparations as
well as aggregated samples [45, 87, 98].

61
In the samples used for the study of aggregation kinetics, the arctic Aβ peptide was used
to increase the stability of smaller aggregates or intermediate species. Arctic Aβ is a variant of
wild type Aβ where an amino acid Glutamic acid at the 22nd
position of the peptide chain is
replaced by Glycine. Replacement of this single amino acid has been shown to promote and
stabilize smaller Aβ aggregates such as oligomers and protofibrils [117, 118]. These smaller
soluble Aβ aggregates are known to play an important role in Alzheimer’s disease than the fully
formed fibrils [14]. For the study of aggregation kinetics, monomeric FAM-Aβ (1-40) was mixed
with monomeric arctic Aβ (1-40) at a mass ratio 1:1 and samples of day 1, 3, and 6 were
analyzed in this study.
Figure 3.6. Electropherograms of Aβ fibrils (A) and Aβ monomer (B) samples with UV
absorbance detection at 190 nm. The NM and Aβ fibrils or Aβ monomer samples were injected
for 5.0 s at 0.5 psi. The separation was performed in 10.0 mM Tris buffer at pH 7.80 at 417
V/cm. Current was 4.43 µA. The first peak in both electropherograms are from neutral marker
Mesityl oxide (NM). The peaks labeled M are from FAM-Aβ (1-40) and Aβ (1-40) peptide
monomers and the peak labeled F is from the Aβ fibrils.
The panel A of Figure 3.6 shows a CE-UV absorbance electropherogram of fibrils of
prepared from the mixture of FAM-Aβ (1-40) and Aβ (1-40) peptide (1:4). In the

62
electropherogram, the peak at 168 s is due to the neutral marker (mesityl oxide, NM) and other
peaks at longer migration times are due to Aβ fibril sample. The two peaks labeled with M are
from the remaining FAM-Aβ (1-40) and Aβ (1-40) monomers, ratio of their peak area agrees
with the mass ratio in the monomeric mixture. The broad peak at 260 s is due to the fibrils and
the sharp spikes after the broad peaks are due to the individual mature fibrils. Hence, the CE-UV
absorbance electropherogram shows the existence of both monomer as well as fibrils in the
sample. Figure 3.7 shows the electropherograms of the same fibrils sample used in CE-UV
analysis which was prepared from the mixture of FAM-Aβ (1-40) and Aβ (1-40) (1:4). Panel A
shows the electropherogram of 20° LLS channel and has less spikes than in the electropherogram
included in panel B, which is from 90° LLS channel. This is because the detection limit of the
90° LLS channel is lower than that of the 20° LLS channel. Panel C in Figure 3.7 shows an
electropherogram from the LIF channel of the system. The peak at 180 s is from the NM
(coumarin 500) and other peaks are due to the sample. It is interesting to observe that almost all
of peaks in the electropherogram from LIF channel are in earlier part of the electropherogram
(250-300 s). The electropherograms from 20° LLS and 90° LLS also contain one major
population of signals in the same region but they have a second plug between 350-450 s, which
is absent in the signals from the LIF channel. This indicates that the first population is due to the
fluorescent particles and the second population is from the nonfluorescent particles. This shows
that all of the fluorescent aggregates elute together at the shorter elution time, suggesting either
fluorescent fibrils have spherical shape or smaller size than the nonfluorescent fibrils. The signal
intensity ratios of fluorescent and nonfluorescent peaks of Aβ fibrils samples are shown in Table
3.5. Only the peaks of fibrils present in all three channels were included to determine the signal
intensity ratios of fluorescent fibrils and the peaks present in the latter part of the

63
electropherograms in LLS channels were used to calculate intensity ratios of nonfluorescent
fibrils.
Table 3.5. Signal intensity ratios of Aβ fibrils from CE-LLS2-LIF system
Aβ fibrils fractions 20° LLS/90° LLS 20° LLS/LIF 90° LLS/LIF
Fluorescent 0.181±0.141 3.04±2.15 19.5±7.91
Nonfluorescent 0.509±0.788 NA NA
The signal intensity ratios of 20° LLS/90° LLS for fluorescent (0.181±0.141) and
nonfluorescent (0.509±0.788) fibrils are significantly different, indicating a difference in
structure or shape between those two type of fibrils. The 20° LLS/90° LLS value of fluorescent
fibrils is close to 20° LLS/90° LLS value of 202 nm PS beads (data not shown) and 20° LLS/90°
LLS value of nonfluorescent fibrils is close to the 20° LLS/90° LLS value of larger size PS beads
(700 nm and 310 nm) as shown in Table 3.1. But, 90° LLS /LIF value of fluorescent fibrils is
much higher than the similar value of 310 or 700 nm fluorescent PS beads which could represent
dissimilarity in the shape of the particles. If this is true, the labeling of the peptides alters the
aggregation pattern and the composition of the aggregates which may not be very helpful to
understand the Aβ aggregation in vivo. Panel D of Figure 3.7 shows a 2 s region of the
overlapping signals from all three channels. It shows a perfect alignment of the signals from all
three channels except some small signals from 90° LLS channel due to its lower detection limit.
Again, the inset of the panel D of Figure 3.7 shows the 0.3 s region of the overlapping signals. It
shows the same ratio of signal intensities of each particle from all three channels. A CE-UV
absorbance electropherogram of monomeric mixture of FAM-Aβ (1-40) and Aβ (1-40) peptide
(1:4) is shown in Figure 3.6B. In the electropherogram the peak at 208 s is due to the neutral
marker (mesityl oxide, NM) and other peaks at longer migration times are from the monomeric

64
Figure 3.7. CE-LIF electropherogram of fully formed fibrils of a 1:4 mixture of FAM-Aβ (1-
40):unlabeled Aβ (1-40) sampled on Day 0. Both the neutral marker (NM, coumarin 500) and Aβ
samples were injected for 3.0 s at 25.0 kV (385 V/cm), and the separation was performed in 10.0
mM Tris buffer at pH 7.80 at 385 V/cm. The current was 4.45 µA. The detection conditions were
same as in Figure 3. (A) and (B) are LLS signals from the 20° and 90° channels of CE-LLS2-LIF
system where the spikes represent individual fibrils. (C) Fluorescence signals from LIF channel.
The peak at 180 s is from NM. (D) Extended view of a 2 s region of overlapping signals from all
three channels.
mixture of FAM-Aβ (1-40) and Aβ (1-40). The two peaks labeled with M are from the FAM-Aβ
(1-40) and Aβ (1-40) monomer, ratio of their peak area agrees with the mass ratio in the
monomeric mixture. Other minor peaks are from the synthetic impurities as discussed previously
by Picou et al. [98]. Electropherograms of the monomeric mixture from the three detection

65
channels of the CE-LLS2-LIF system are shown in Figure 3.8. Panels A and B of Figure 3.8
represent the signals from 20° and 90° LLS detection channels and show a significant number of
spikes, which was not expected from a monomer sample. Panel C shows an electropherogram
from the LIF channel. The peak at 180 s is from the neutral marker (coumarin 500, NM) and the
other peak at 250 s is due to the monomer sample. As expected, there is a single monomer peak
with a small shoulder which could be due to a synthetic impurity or small amount of aggregates.
Comparison of the elution time of major peaks in all three panels shows that the major LLS
peaks have longer migration times than the single peak in the LIF channel. This suggests that the
Figure 3.8. Electropherograms of a 1:4 (w/w)
mixture of FAM-Aβ (1-40) peptide:unlabeled
Aβ (1-40) peptide monomer. All the injection,
separation, and detection conditions are same
as in Figure 3.7. (A) LLS signals from 20° LLS
channel. (B) LLS signals from 90° LLS
channel. (C) Fluorescent signals from LIF
channel.

66
spikes in the LLS signals could be due to the small aggregates, possibly oligomers, which was
not observed before by any researcher due to the higher detection limit of the instruments used.
However, these spikes could also be due to contaminants or dust particles. The bead samples
prepared for the analysis by the CE-LLS2-LIF system were always prepared in buffer filtered
through a 0.02 µm syringe filter multiple times and all the containers including micropipette tips
were rinsed multiple times with the buffer. Hence, no signals from dust contamination can be
seen in the elelctropherograms of bead samples. The monomer samples used in this study was
prepared by our collaborator unaware of the detection limit of the instrument. Hence, all or some
of the spikes in the signal could be from the dust contamination.
In this study we attempted to characterize different species formed during the aggregation
using the newly developed CE-LLS2-LIF system. Figure 3.9 shows the electropherograms of
aggregating mixture of FAM-Aβ (1-40) and Arctic Aβ (1-40) (1:1). The monomeric mixture was
prepared and placed for aggregation as discussed in Experimental Section. Aliquots of the
aggregating mixture on day 1, 3, and 6 were analyzed and are shown in Figure 3.9. The
electropherograms of the sample on the same day from the three channels of the system are
included in a row and the electropherograms of the same detection channel for the samples from
the different days are included in a column. The figure clearly shows an increase in the number
of spikes at the latter part of the electropherogram and reduction in the spikes in the earlier part
of the electropherograms with the increase in aggregation time. This trend is clearly visible in the
electropherograms from all three detection channels. Considering an increase in the total
negative charge in aggregates with the increase in their size, a smaller mobility or an increase in
the migration time is obvious [84]. Hence, the trend of increasing number of spikes in the latter
part of the electropherograms can be attributed to the increase in the size of the aggregates. With

67
the increase in the aggregation time, the number of larger aggregates which could be fully
formed fibrils, increased. A significant number of spikes can be observed in the earlier part of the
electropherograms even in the day 6 aliquot indicating the presence of smaller aggregates for
longer times than concluded in the previous studies using ThT fluorescence [79].
Figure 3.9. Fibrillation kinetics of a mixture of FAM-Aβ (1-40) with Arctic Aβ (1-40) (1:1)
Injection, separation, and detection conditions as in Figure 3.7. The electropherograms in row 1,
2, and 3 correspond to the aggregating samples of day 1, 3, and 6 respectively and the
electropherograms in column 1, 2, and 3 correspond to the 20° LLS, 90° LLS, and LIF channels
respectively. The peaks near 180 s in the electropherograms from LIF channel are from NM,
coumarin 500.
Another interesting aspect of this study is the comparison of the aggregation pattern of
two Aβ samples included in this study. A mixture of FAM-Aβ (1-40) and Aβ (1-40) (1:4) and
another mixture of FAM-Aβ (1-40) and Arctic Aβ (1-40) (1:1) were analyzed in this study. The
electropherograms of fully formed fibrils of the two samples are included in Figures 3.7 and 3.9.
Figure 3.7 shows electropherograms of Aβ aggregates formed from the mixture of FAM-Aβ (1-

68
40) and Aβ (1-40) (1:4) which sows the elution of all the fluorescent aggregates at the earlier part
of the electropherograms. Although the elctropherograms included in Figure 3.9 have Aβ
aggregates from 6th
day on aggregation process, which is nearly the time period required for
mature fibrils, the fluorescent as well as nonfluorescent aggregates can be observed with both
shorter as well as longer elution times. It indicates a significant difference in the aggregation
pattern of Aβ peptides with a small change in the composition of peptide chain.
3.4 Conclusions
The development and characterization of a three detection channel CE-LLS2-LIF system
was demonstrated. Fluorescent PS beads could be detected individually in all three detection
channels: 20° LLS (forward scattering) 90° LLS (side scattering) and LIF. Detection efficiencies
of 20° LLS, 90° LLS, and LIF channels of the system was 53, 66, and 66% respectively for 700
nm beads. A size detection limit of 80 nm (diameter) was obtained for 90° LLS although 20°
LLS and LIF could not detect PS particles of this size. After demonstrating detection efficiency
and detection limit of the newly developed system to detect individual fluorescent and
nonfluorscent particles, it was used to analyze the monomeric mixture of fluorescently labeled
FAM-Aβ (1-40) and unlabeled Aβ (1-40) and the fibrils prepared from similar monomeric
mixture. Aggregation of 1:1 mixture of FAM-Aβ (1-40) and arctic Aβ (1-40) was also studied
which showed a change in the size of the aggregates with the progression of aggregation. It also
demonstrated the presence of smaller size aggregates along with the fully formed fibrils in the
Aβ peptide samples incubated long enough for complete fibrillation.

69
CHAPTER 4. PARTICLES ANALYSIS USING CAPILLARY
ELECTROPHORESIS WITH LASER-INDUCED FLUORESCENCE AND
LASER LIGHT SCATTERING DETECTION
4.1 Introduction
Over the past 20 years there has been an explosion of research investigating synthetic
particles ranging in size from a few nanometers to several micrometers [119-121]. Synthetic
nanoparticles demonstrate a broad range of intriguing and useful physical and chemical
properties including photonic, electronic, magnetic, and catalytic properties. As scientists have
explored the fundamental properties of synthetic nanoparticles and their many potential
applications, they have also discovered that there are many interesting naturally occurring
nanoparticles and microparticles in biology and the environment [122-124]. In biology, these
natural nanoparticles can be an essential part of normal biological function, or they can be toxic
species related to devastating diseases as in the case of amyloid protein aggregates [7, 29, 32,
34]. The climate and environmental health impacts of both natural nanoparticles and those made
inadvertently by humans are recognized as important and are under intense study. As scientists
increasingly apply synthetic nanoparticles to medicine and for other practical applications,
concerns about potential human health risks and toxicity are emerging and being investigated
[123, 124].
Analysis and characterization of synthetic nanoparticles typically focuses on determining
the size, shape and the chemical composition of the population of particles as well as some basic
properties of interest such as catalytic properties, optical properties or magnetic properties. In
most cases it is desirable to synthesize a monodisperse population of particles [123, 124]. The
most commonly used analytical techniques for characterizing synthetic nanoparticles include size
exclusion chromatography (SEC), dynamic light scattering (DLS), transmission electron

70
microscopy (TEM), scanning electron microscopy (SEM), and atomic force microscopy (AFM)
[34, 123]. The analysis and characterization of synthetic nanoparticles is certainly a substantial
challenge, but it is relatively simple compared to the challenge of analyzing nanoparticles in
biological systems or the environment. In such cases, the mixture of nanoparticles present can be
very diverse in terms of size, shape, composition and properties. This challenges analytical
scientists to develop new tools capable of dealing with this diversity. For example, aerosol
particles in the atmosphere are known to negatively impact human health. Scientists have
developed analytical techniques for the characterization of single aerosol particles based on mass
spectrometry that can provide information about the morphology and chemistry of individual
aerosol particles [122, 125]. Recently, a capillary electrophoresis method with laser-induced
fluorescence detection (CE-LIF) for studying quantum dots was applied to study the particles in
the environment [126].
Capillary electrophoresis has been used to separate particles based on differences in
electrophoretic mobility, which depends on particle charge, size, shape, and surface chemistry
[35, 50, 84, 127-129]. The most common detection technique for particles separated by CE is
UV-Vis absorbance. Laser-induced fluorescence has also been used to analyze populations of
different particles. For most examples of particle analysis by CE, peaks are produced by
detection of a population of nearly identical particles. For example, Colon and coworkers used
CE-LIF to separate and detect quantum dots. The CE peaks observed in that study were produced
by the total fluorescence of large numbers of homogeneous quantum dots [126]. In most cases,
characteristic information about particles provided by CE analysis has been based mainly on
electrophoretic mobility, which can be complex to interpret [84, 130].
71
Capillary electrophoresis with laser-induced fluorescence and laser light scattering (LLS)
detection have been used for the detection and characterization of individual nanoparticles and
microparticles [35, 50, 54, 67, 85, 127]. A simple CE instrument with a single LIF or LLS
detection channel can serve as an effective analytical tool for individual particles. Rezenom et al.
demonstrated CE with single channel LLS detection and analyzed 57-943 nm diameter PS beads
[85]. Ahmadzadeh et al. used a commercial CE instrument with LIF detection for the analysis of
PS beads [131]. In this experiment the authors used an external I/O beard to increase the data
collection rate from 4.00 Hz to 100 Hz [131]. Although single channel detection for CE has been
useful for characterizing nanoparticles and microparticles, complex samples and related
scientific questions have inspired researchers to develop CE with multichannel detection for
individual particle analysis. Pamme et al. reported collection of LLS signals at 15° and 45° with
respect to incident light, simultaneously, in a microfluidic CE for the analysis of latex beads of 3
and 6 µm diameter [58]. Andreyev et al. demonstrated simultaneous LIF and LLS detection. This
CE-LIF-LLS instrument was used to detect individual fluorescent particles separated by CE and
monitor changes in mitochondrial morphology during cryogenic storage [67]. Gilman and
coworkers have used two-channel LIF detection with CE to determine laser-induced
fluorescence anisotropy (LIFA) of individual amyloid beta (Aβ) peptide aggregates [45, 87,
106]. This group also reported the developed a three channel LLS and LIF detector for CE (CE-
LLS2-LIF) and applied it to the characterization of individual Aβ fibrils [132].
In this Chapter, three different types of particles were analyzed using the CE-LLS2-LIF
system: PS beads (80 nm-1072 nm), QD nanocrystals (~60 nm), and cyanine based organic
functional nanoparticles (thiocyanine bis(pentafluoroethan)-sulphonimide ([TC][BETI])
nanorods (~2400×800 nm), pseudoisocyanine bis(pentafluoroethan)-sulphonimide ([PIC][BETI])

72
nanorods (~1.500×90 nm). The particles were detected individually, and the ability of the CE-
LLS2-LIF instrument to differentiate the different particles based on the combination of their
electrophoretic mobility, fluorescence and light scattering at 20° and 90° was investigated.
4.2 Experimental Section
4.2.1 Chemicals
Polystyrene (PS) beads (1072±19, 771±25, 535±08, 505±10 356±14, 108±4.5, 59±2.3 nm
diameters) were from Polysciences (Warrington, PA). Nonfluorscent PS beads (80 nm diameter)
and fluorescent PS beads (310 nm diameter) were purchased from Duke Scientific (Palo Alto,
CA). Fluoro-Max blue fluorescent PS beads (480 and 700 nm diameter) were obtained from
Thermo Scientific (Fremont, CA). Tris (hydroxymethyl) aminomethane (Tris) was purchased
from Acros (Glee, Belgium), and hydrochloric acid (HCl), boric acid, and disodium
ethylenediaminetetraacetate (EDTA) were purchased from Fisher Scientific (Pittsburgh, PA). All
solutions for CE were prepared in ultrapure water (>18 MΩ·cm) from a Modulab water
purification system (United States Filter; Palm Desert, CA). A buffer containing 1.40 mM
borate, 1.40 mM Tris, and 0.314 mM disodium EDTA (TBE) was prepared, and the pH was
adjusted to 8.40 with 1.0 M HCl. The TBE buffers were first vacuum filtered using a 0.1 µm
nylon filter (Fisher Scientific; Pittsburgh, PA) and again filtered twice with a 0.02 µm syringe
filter (Fisher Scientific; Pittsburgh, PA) before use. All containers and pipette tips used for
dilutions of the particle samples were also rinsed with the filtered buffer.
4.2.2 Synthetic Particles
Suspensions of fluorescent and nonfluorescent polystyrene (PS) microspheres of different
sizes were prepared by diluting the aqueous solutions provided by the manufacturers in TBE
buffer at pH 8.40. The concentration of beads in the samples was determined using the polymer

73
concentration provided by the manufacturer and density of the PS beads as described previously
[85].
The quantum dot nanocrystals (QD) were prepared using the method described by Kho et
al. [133] with a modification. Instead of using ZnSO4, CdSO4 was used to prepare CdS
nanocrystals. Briefly, a 0.25 M cysteine solution was prepared in 1.00 M Tris buffer, and 1.00 M
CdSO4 solution was prepared in 0.01 M HCl. Before the solution preparation both solvents were
degassed and saturated with N2 gas to prevent oxidation of stock solutions. The cysteine solution
(2012.5 L) was mixed with CdSO4 solution (288 L) with continuous stirring to prepare a
mixture containing cysteine to Cd at a 2:1 molar ratio. To this mixture, a 1.00 M aqueous
solution of Na2S (576 L and 662 L) was added with vortexing to achieve an S to Cd molar
ratio of 2:1 and 2.3:1 in two separate vials. The vials containing the mixtures were then sealed
and incubated for 1 hr at 47 °C. They were then flushed with N2 for 10 min to remove any
unreacted sulfide, and freeze dried for an hour. Stock (~10 mM) and working suspensions of
appropriate concentration of CdS nanocrystals were prepared in TBE buffer at pH 8.40 filtered
twice through 0.02 µm syringe filter. The QDs were characterized with fluorescence, UV
absorbance, and TEM. The transmission electron microscopy images of QDs indicate
polydispersity in the size of the spherical nanocrystals, but majority of the particles seem to have
an approximately 60 nm diameter (Figure 4.3A).
Nanorods composed of thiocyanine bis(pentafluoroethan)-supphonimide ([TC][BETI])
were prepared using the method described by de Rooy et al.[134]. Briefly, the thiocyanine salt
called Groups of uniform materials based on organic salts (TC-GUMBOS) was prepared by
reacting 3,3-diethylthiacyanine iodide ([TC0][I]) and lithium bis(pentafluoroethan)-
sulphonimide ([Li][BETI]) at 1:1.1 molar ratio in a mixture of water and dichloromethane (1:5

74
v/v). The reaction mixture was continuously stirred for 24 hr, and the organic phase containing
TC-GUMBOS was separated and washed with water several times to remove LiI byproduct.
Finally, the solvent was removed by rotary evaporation and the product was characterized by
nuclear magnetic resonance (NMR) and high resolution mass spectrometry (HR-MS) to confirm
the formation of TC-GUMBOS. For the preparation of rod shaped particles a 100 µL 0.1 mM
solution of TC-GUMBOS in ethanol was mixed with 5 mL distilled water or TBE buffer at pH
8.40 filtered through 0.02 µm syringe filter drop wise with sonication. The particles were aged
for 1 hr before analyzing by CE. The [TC][BETI] nanorods were characterized by TEM and
scanning electron microscopy (SEM) which show that the [TC][BETI] particles are rod shaped
with dimension ~2.4 × 0.8 µm (Figure 4.3B)
Nanorods composed of pseudoisocyanine bis(pentafluoroethan)-sulphonimide
([PIC][BETI]) were prepared using the method described by Jordan et al. [135]. Briefly,
pseudoisocyanine salt was prepared by reacting pseudoisocyanine iodide ([PIC][I]) with lithium
bis(pentafluoroethan)-sulfonimide ([Li][BETI]) (1:1 eq) in a biphasic solution of
dichloromethane and water (2:1 v/v). The reaction mixture was stirred for one day at room
temperature. The water insoluble product formed was separated as an organic layer and washed
several time with distilled water to remove the LiI byproduct. Then, dichloromethane was
removed from the product under vacuum at 40 °C using rotary evaporator followed by freeze-
drying. The formation of the salt was confirmed by melting point determination, NMR, and
elemental microanalysis. The nanorods were prepared by adding 150 µL ethanolic solution of
[PIC][BETI] (1 mM) into 5 mL distilled water or TBE buffer at pH 8.40 filtered through 0.02
µm syringe filter dropwise under sonication. The [TC][BETI] nanorods were characterized by

75
TEM and SEM, which show that the [PIC][BETI] particles are belt shaped with dimension ~1.5
× 0.09 µm (Figure 4.3C).
4.2.3 CE-LLS2-LIF
Fused-silica capillaries with a 52 µm internal diameter and 362 µm outer diameter
(Polymicro Technologies; Phoenix, AZ) were used for all CE experiments. A detection window
was made in the capillary by removing the polyimide coating using a window maker (MicroSolv
Technology; Eatontown, NJ) for all CE experiments. Before use, each new capillary was rinsed
using a manual syringe pump with 1 ml each of 1.0 M NaOH, ultrapure water, and then the
separation buffer. For all CE experiments, the separation buffer was TBE buffer at pH 8.40. All
buffer solutions used for CE experiments were filtered through a 0.02 µm syringe filter
(Whatman; Hillsboro, OR). A Spellman CZE1000R high-voltage power supply (Hauppauge,
NY) was used to apply the electrophoretic potential.
The development and optimization of the CE-LLS2-LIF instrument was described in
Chapter 3. The instrument was designed for the simultaneous collection of the scattered light at
two angles (20˚ and 90˚) and fluorescence at 90˚ with respect to the incident radiation. A 404 nm
diode laser (Power Technology; Little Rock, AR), attenuated to 0.6 mW was used for excitation.
The fluorescence and scattered light at 90° were first separated using a 420 nm cutoff dichroic
mirror (Omega Optical; Brattleboro, VT), which reflected the scattered light at 45° with respect
to the dichroic mirror and passed the fluorescence through. The fluorescence and scattered light
were then spectrally filtered by a 440 nm longpass filter (Melles Griot; Carlsbad, Ca) and
405±10 nm bandpass filter (Melles Griot), respectively. Light scattered at 20° was spectrally
filtered using a 405±10 nm bandpass filter (Melles Griot). The spectrally and spatially filtered
fluorescence and scattered light was then detected by three individual PMTs (Hamamatsu;

76
Bridgewater, NJ) biased at 700 V The outputs from the PMT for each detection channel were
filtered using individual 1 kHz low-pass filters and sent to the data acquisition board (PCI-6229,
National Instruments; Austin, TX). A LabVIEW (Version 7.1, National Instruments) program
written in house was used for data acquisition at 3.0 kHz. The data were analyzed using
OriginLab 7.5 (Northampton, MA), Synaptosoft MiniAnalysis Program (version 6.0.7) and
Microsoft Excel 2010.
4.2.4 Spectrophotometry and Spectrofluorometry
Absorbance spectra of suspensions of different particles used in this work were collected
with a Cary 50 UV-Vis spectrophotometer (Varian; Palo Alto, CA) using a 1-cm quartz cuvette.
A slit width of 2 nm was used. Absorbance spectra were collected at room temperature, and the
blank was subtracted from each spectrum.
Excitation-emission spectra of suspensions of different particles were collected using a
PTI Quanta Master 4/2006SE spectrofluorometer (Photon Technology International;
Birmingham, NJ) equipped with 75 W Xenon lamp and K170B photomultiplier tube (PMT)
detector. A slit width of 5 nm was used. Excitation-emission spectra were collected at room
temperature using a 1-cm quartz cuvette.
4.2.5 Electron Microscopy
Transmission electron microscopy (TEM) images of the nanoparticles were captured
using a JEOL 100CX transmission electron microscope (JEOL USA; Peabody, MA)
4.3 Results and Discussion
The goal of this work was to use CE-LLS2-LIF to separate, individually detect and
characterize different types of nanoparticles and microparticles in complex mixtures. Previously,
this instrument was developed and tested using mixtures of fluorescent and nonfluorescent PS

77
beads, and then it was applied to study fluorescently labeled Aβ peptide aggregates [132]. A
schematic of the instrument is shown in Figure 3.1. The CE instrument can detect individual
particles simultaneously with LLS at 20° (forward scattering), LLS at 90° and LIF. A forward
scatter light (FSC) was collected at 20°, side scatter light (SSC) was collected at 90°, and also the
LIF signals from individual particles were collected simultaneously at 90° with respect to the
incident laser beam. Three different types of particles, PS beads, CdS quantum dots, and cyanine
based functional organic particles, were analyzed in this study. The analysis of individual type of
particles, mixture of different types of particles, and ratios of their signal intensities will be
discussed separately.
4.3.1 Separation and Detecton of Individual Nanoparticles Using CE-LLS2-LIF
Three different types of particles: PS beads with different diameter, quantum dots with
two different sizes, and two types of cyanine based particles- [PIC][BETI] rods and [TC][BETI]
rods, were analyzed using CE-LLS2-LIF system. As discussed in the Experimental section, these
different types of particles were prepared and diluted using previously established protocols.
Polystyrene (PS) beads are an important class of particles because of their minimal
reactivity and commercial availability with varieties of functional groups and various standard
sizes from low nanometer to several micrometers. After the development of the CE-LLS2-LIF
system, it was optimized and calibrated using fluorescent, as well as nonfluorescent, PS beads of
different diameters and a detection limit of 80 nm diameter PS beads for the 90° LLS channel
was established [132]. A detection efficiency of 53, 66, and 66% were observed in 20° LLS, 90°
LLS, and LIF detection channels respectively for 700 nm blue fluorescent beads [132]. With the
application of a fast data sampling rate (3 KHz) and efficient data filtration devices, the newly
developed CE-LLS2-LIF system was able to detect individual micron and submicron size PS

78
beads as shown in Figure 4.1. The electropherograms shown in Figure 4.1 include the peaks from
individual 310 nm blue fluorescent PS beads from all three channels of the CE-LLS2-LIF system.
The regions of the electropherogram with the sharp spikes from the individual particles are
shown in the Figure 4.1. However, in a full electropherogram, a clean background signal can be
observed as shown in Figure 3.4.
Figure 4.1. Separation and detection of individual 310 nm diameter Fluoro-Max blue fluorescent
PS beads using CE-LLS2-LIF system. The bead solution was prepared in TBE buffer at pH 8.40
and electrokinetically injected for 3 s at 385 V/cm. The separation was performed in TBE buffer
at pH 8.40. The current was 0.34 µA. The number of particles injected was 82. A 404 nm diode
laser was used as an excitation source, the laser power was attenuated to 0.6 mW before hitting
the capillary window. The fluorescent signals were detected after filtering through a 440 nm
longpass filter and scattering signals were detected after filtering through 405±10 nm bandpass
filter.

79
Figure 4.1 also shows that an average distance between the peaks is greater than 3× the
average FWHM of individual peaks, indicating the signals from individual particles are not
affected by the light that is scattered by neighboring particles [63], which means each peak is
from single source excitation. The 310 nm PS beads are expected to be monodispersed as
claimed by the manufacturer, but the heights of all the peaks are not same. This must be due to
the variation in the intensity of the laser light at different region of the laser spot through which
the particles pass [115].
Semiconductor nanoparticles, such as CdS nanocrystals, are an important class of
nanoparticles because of their application in optics, electronics, bio labeling, and photo catalysis
[136-139]. A gram scale production of nanoparticles with simple steps using inexpensive
materials indicates possibility of bulk production for industrial use of these semiconductor
nanoparticles [133, 136]. Practical importance of CdS nanocrystals, their easy preparation, and
solubility in aqueous solvents attracted our attention for use of these particles as one of the types
of nanoparticles for this study. Figure 4.2 shows the electropherograms of CdS nanocrystals from
CE-LLS2-LIF system. The peaks in the electropherograms clearly indicate a polydispersity in the
size of the particles. A closer look of the signal intensities indicates most of the higher intensity
signals are 2, 3, or 4× the intensity of smaller signals. This could be due to the multiple particles
passing the laser spot together. Although we attempted to prepare two samples of CdS
nanocrystals with the Cd to S ratios, 2:1 and 2.3:1, expecting a difference in the sizes of the
nanocrystals produced in two batches, both CE analysis and TEM images did not indicate
significant differences in the size of the nanocrystals. The TEM image of the QD nanocrystals
prepared by using Cd to S ratio 2:1 is shown in Figure 4.3A. The image clearly indicates a
polydispersity in the size of the spherical nanocrystals, but majority of the particles seem to have

80
an approximately 60 nm diameter. This result of TEM images is consistent with the intensities of
the QD signals in CE electropherogram. The absorbance and excitation spectra of QD samples
(data not shown) show a weak absorbance at 404 nm (excitation laser wavelength); hence, the
intensities of LIF signals in Figure 4.2 are significantly smaller than the intensities of LLS
signals.
Figure 4.2. Separation and detection of individual CdS nanocrystals using CE-LLS-LIF system.
A stock solution prepared by dissolving 3.07 mg of QD sample in 1.60 mL double filtered TBE
buffer at pH 8.40 was diluted 100× before injection and analysis by CE-LLS2-LIF system. The
sample solution was vortexed immediately before the injection. All other injection, separation,
and detection conditions are same as in Figure 4.1 except individual ND filters were used in 20°
LLS and 90° LLS channels to bring the peaks on scale and later the y axis values were multiplied
by the corresponding attenuation factors. The peak at 120 s in the electropherogram from LIF
channel is due to the neutral marker (NM, coumarin 500) and other peaks are from the QD
sample.

81
Micro and nanometer size particles of organic materials have gained increasing attention
because of the tunability and versatility of these particles and their application in optoelectronics
and sensors [140, 141]. Among the organic aggregates, the cyanine dye based aggregates have
been extensively studied due to their application in photography for the preparation of silver
halide emulsions, biosensors, semiconductor materials, and possibly in silver and gold
nanoparticles coatings [140]. Both template, as well as non-template, approaches to control the
morphology of such particles are commonly used. In this study, we analyzed two types of
cyanine based particles using CE-LLS2-LIF system. Similarly prepared cyanine based particles
were characterized previously in two different published reports [134, 135]. The aim of using
these previously characterized particles was to demonstrate the capability of CE to analyze
organic and non-organic materials in a mixture and show the efficiency of newly developed CE-
LLS2-LIF system to characterize different types of particle.
Figure 4.3. TEM images of CdS quantum dots (A), [TC][BETI] rods (B), and [PIC][BETI] rods
(C).
The [TC][BETI] rod shaped particles were prepared by adding 100 µL of an 0.1 mm
ethanolic solution of the [TC][BETI] salt to 5 mL ultrapure water or TBE buffer at pH 8.40
under sonication. The [PIC][BETI] nanorods were prepared similarly by using [PIC][BETI] salt
instead of [TC][BETI]. In the preparation of both types of particles the sample was left for 10
min for equilibration after the addition of the salt and aged for an hour before use. The particle

82
samples prepared in water was buffer exchanged to TBE buffer at pH 8.40 to avoid the mismatch
between the ionic strength and pH between the solution and separation buffer for CE analysis.
The TEM images and CE signals of the particles prepared in water and TBE buffer did not have
significant differences (data not shown), hence the samples prepared in TBE buffer were used for
further analysis. The TEM images of [TC][BETI] and [PIC][BETI] particles are shown in Figure
4.3B and 4.3C respectively. Figure 4.4A and 4.4B show the electropherograms of [TC][BETI]
and [PIC][BETI] particles respectively. Although these are the similarly prepared particles from
similar organic materials, they have different shape and optical properties. The TEM images of
the particles show that the [TC][BETI] particles are rod shaped with dimension ~2.4 × 0.8 µm
(Figure 4.3B) and [PIC][BETI] particles (Figure 4.3C) are belt shaped with dimension ~1.5 ×
0.09 µm and.[134, 135] Similarly, the [TC][BETI] particles have excitation max at 423 nm and
emission max at 480 nm and [PIC][BETI] particles have excitation max at 440 nm and emission
max at 550 nm [134, 135]. Because of the weak absorbance of [PIC][BETI] particles at 404 nm
(excitation wavelength) the intensity of LIF signals are smaller compared to [TC][BETI]
particles. The TEM images (Figures 4.3B and 4.3C) show very small variation in the size and
shape of both type of particles due to which the authors claimed monodispersity of the particles
in previous publications [134, 135]. But the intensity of LLS signals in the electropherograms
shown in Figure 4.4 does not reflect the monodispersity of the particles. Analyses of individual
signal intensities also do not show indication of the multiple particles passing the detection laser
spot together. The size of [TC][BETI] particles are comparatively larger than the [PIC][BETI]
particles (Figures 4.3B and 4.3C), and the LLS signals in Figures 4.4A and 4.4B also show that
the [TC][BETI] particles have higher average intensities than [PIC][BETI] particles indicating a
similarity in refractive index values of the two types of particles. A large number of small peaks

83
Figure 4.4. Separation and detection of individual cyanine based organic particles using CE-
LLS2-LIF system. All injection separation and detection conditions are same as in Figure 4.2. A
coumarin 500 solution (1.00 µM in TBE buffer) was injected before the sample injection as a
neutral marker. (A) [TC][BETI] particles. A stock solution of particles prepared by adding 100
µM [TC][BETI] salt in 5 mL was injected for 3 s before applying separation voltage. (B)
[PIC][BETI] particles. A stock solution of [PIC][BETI] particles prepared by adding 30 µM
[PIC][BETI] salt into 5 mL TBE buffer at pH 8.40 was electrokinetically injected for 3 s before
applying separation voltage. The sample solutions were vortexed immediately before the
injection. A peak near 110 s in both electropherograms are due to neutral marker (NM).
in Figure 4.4B could be from the broken pieces of the [PIC][BETI] particles, due to its thin
structure. The variation in the intensities of LLS signals in Figures 4.4A and 4.4B could be due
to the variation in excitation intensity at different regions of the laser spot through which the
particles pass, due to the orientation of the particles inside the capillary while they cross the laser
spot, or particle due to the polydispersity of the particles.

84
Successful characterization of individual nanoparticles made up of different types of
materials verified the CE-LLS2-LIF system as a valuable tool for particle characterization. It
encouraged us to analyze mixtures of various types of particles: PS beads, QD nanocrystals, and
cyanine based rod shaped particles. In this study, the particles were electrokinetically injected to
the CE system from separate vials sequentially before applying the separation voltage, instead of
mixing different types of particles together and injecting from the same vial. This was done to
avoid interaction between the particles of different materials outside the capillary column which
may have effect on the size and shape of the particles. There could be a short term interaction
between the particles of different materials on column before they are physically separated due to
the difference in their mobility, but it must have negligible effect on their structure in comparison
to the case when they are kept in a same container. Figures 4.5 and 4.6 include the representative
electropherograms of mixtures of different types of nanoparticles analyzed by the CE-LLS2-LIF
system.
Figure 4.5 shows the electropherograms of a mixture of CdS QDs and [TC][BETI]
particles. Comparison of the average electrophoretic mobilities of the QDs and [TC][BETI]
particles from Figure 4.2 and Figure 4.4A shows that they have slightly different average
mobilities and as a result, QDs elute before [TC][BETI] particles which can be seen in Figure
4.5. Observation of the electropherograms from all three channels in Figures 4.2, 4.4A, and 4.5
shows a clear distinction between the signals from QD and [TC][BETI] particles. In Figure 4.5,
the difference in the elution times of these two types of particles makes it easier to identify the
signals from different types of particles, but even without the use of the differences in mobility, it
would be possible to identify the signals from different types of particles. As discussed in
previous section, the major difference between the QD signals and [TC][BETI] particle signals is

85
the intensity of LIF signals. The QDs have less intense LIF signals because of their excitation
maximum is far from the excitation wavelength; but, the [TC][BETI] particles have more intense
LIF signals. Although the particle samples were vortexed just before being injected into the CE
Figure 4.5. Separation and detection of individual CdS quantum dots and [TC][BETI] particles
using CE-LLS2-LIF system. The samples of CdS QDs and [PIC][BETI] particles used in Figure
4.2 and 4.4B were injected one after another from separate vials. A 1.00 µM solution of
coumarin 500 solution in TBE buffer (NM) was injected before the particle samples. The
particles sample solutions were vortexed immediately before the injection. All other injection
separation and detection conditions are same as in Figure 4.2.
system, it was difficult to reproduce the number and size of the particles/signals in each injection
as they had tendency to settle down very quickly due to their hydrophobic nature. Hence, some

86
signals of [TC][BETI] particles are taller in Figure 4.5 than in Figure 4.4A. Similar but less
significant effects can be seen in the signals from QDs also between the Figures 4.2 and 4.5.
Figure 4.6. Separation and detection of individual CdS quantum dots, [PIC][BETI] particles, and
310 nm PS beads using CE-LLS2-LIF system. A stock solution QDs prepared by dissolving 3.07
mg of QD sample in 1.60 mL double filtered TBE buffer and diluted 100×, a solution of
[PIC][BETI] particles prepared by adding 30 µM [PIC][BETI] salt into 5 mL TBE buffer, a
solution of 310 nm blue fluorescent PS beads containing 6103125 beads/mL, and 1 µM coumarin
500 (NM) solutions were injected one after another from separate vials. All the stock solutions
and working solutions were prepared in TBE buffer at pH 8.40. The particle sample solution was
vortexed immediately before the injection. All other injection separation and detection conditions
are same as in Figure 4.1. The peak at 120 s is due to the NM and other peaks are from the
particles.
87
Figure 4.6 shows the representative electropherograms of mixture of three different types
of particles: 310 nm blue fluorescent PS beads, QDs, and [PIC][BETI] particles. Comparison of
the electropherograms in Figures 4.6 with the electropherogram of 310 nm the PS beads (Figure
4.1) shows that the signals at 250 s are from 310 nm PS beads. The peaks from QDs and
[PIC][BETI] particles seem to be mixed, but observation of the electrophoretic mobility of these
particles in Figure 4.2 and 4.4B shows that the QDs have shorter average elution time compared
to the elution time of the [PIC][BETI] particles. Therefore, the peaks close to 150 s are from
QDs and those close to 175 s are from [PIC][BETI] particles. As discussed previously, the peaks
are not exactly same as shown in Figure 4.2 and 4.4B, because of their tendency to settle down
due to their hydrophobic nature.
Figures 4.5 and 4.6 show that the comparison of mobilities and peak intensities of
particles from different detection channels can be useful in identifying peaks from different
particle types in a mixture. This indicates that the CE-LLS2-LIF system is capable of separation
and characterization of the particles in a mixture even in absence of particle standards. Again, the
ratios of peak intensities from different detection channels of CE-LLS2-LIF system can be more
effective on identifying of different particle types.
4.3.2 Comparison of the Ratio of Signal Intensities from Different Detection
Channels
Scattered plots of ratios of peak intensity in Figures 4.5, and 4.6 are presented in Figures
4.7, and 4.8 respectively. All three ratios 20° LLS/90° LLS, 20° LLS/LIF, and 90° LLS/LIF are
shown and at least one of the ratios can successfully distinguish the peaks from different types of
particles (Figures 4.7, and 4.8). The ratio of peak intensities of only one LLS channel and LIF
channel cannot always distinguish peaks from different type of particles; hence, Figures 4.7 and
4.8 also demonstrate the advantages of having both 20° and 90° LLS channels along with LIF

88
detection channel. Figure 4.7 shows the ratios of peak intensities in Figure 4.5 plotted against
their elution time. The CdS QDs and [TC][BETI] particles have differences in their elution time
as well as ratios of peak intensities of both 20° LLS to LIF (61.8±27.6 and 1.11±1.33
respectively) and 90° LLS to LIF (227±140 and 3.82±3.65 respectively). But the 20° LLS/90°
LLS of CdS QDs and [TC][BETI] particles are not different from each other (0.409±0.441 and
0.489±0.479 respectively). It is easy to identify the peaks of CdS QDs and [TC][BETI] particles
in a mixture using three parameters obtained from CE-LLS2-LIF: mobility, 20° LLS/LIF, and
90° LLS/LIF.
Figure 4.7. Ratios of signal intensities of mixture of CdS quantum dots and [TC][BETI] rods
from the electropherograms shown in Figure 4.5, plotted against their elution time. The CdS
quantum dots and [TC][BETI] rods were injected together and analyzed using CE-LLS2-LIF
system.
Three types of particles (310 nm blue fluorescent PS beads, CdS QDs, and [PIC][BETI]
particles) were separated and detected in CE-LLS2-LIF system (Figure 4.6). The elution time of
310 nm blue fluorescent PS beads was longer than the elution times of CdS QDs, and
[PIC][BETI] particles and were well separated, but the latter two types of particles are mixed

89
together as shown in the Figure 4.6. Hence, it is hard to distinguish the signals from CdS QDs
and [PIC][BETI] particles by observing only the signal intensities. However, it is possible to
distinguish between CdS QDs and [PIC][BETI] particles from their peak intensity ratios as
shown in Figure 4.8.
Figure 8A shows scatter plot of all three ratios against the corresponding elution time.
Among the three ratios, 90° LLS/LIF of QDs (181±38.2) is different than [PIC][BETI] particles
(37.2±20.0). Again, as shown in Figure 8B the 20° LLS/90° LLS of QD peaks (0.100±0.054) is
different than the 20° LLS/90° LLS of [PIC][BETI] particles (0.459±0.275). This shows that the
combination of CE separation, individual peak intensities, and the ratios of peak intensities from
all three detection channels of CE-LLS2-LIF system has been used to characterize individual
particles and distinguish peaks from different type of particles.
Figure 4.8. Ratios of signal intensities in Figure 4.6 were plotted against their elution time.
Figure 4.6 was the separation and detection of individual CdS quantum dots, [PIC][BETI]
particles, and 310 nm PS beads using CE-LLS-LIF system. (A) All three ratios shown together.
(B) Ratios of 20˚ LLS and 90˚ LLS.

90
4.4 Conclusions
Successful characterization of different types of particles, synthetic polymer particles (PS
beads), protein particles (Aβ fibrils), inorganic particles (CdS QDs), and organic functional
particles (cyanine based particles), with newly developed CE-LLS2-LIF system was
demonstrated. Additionally, the separation and identification of different particle types from
mixtures of two or three types of particles was also demonstrated. The analysis of mixtures of
different types of particles showed the importance of having electrophoretic separation and both
the 20° and 90° LLS detection channels along with LIF detection channel. The authors believe
that the use of multichannel detectors in a simple and low cost homebuilt CE system has opened
doors for precise characterization of particles with a large size ranges in routinely basis.
91
CHAPTER 5. CONCLUSIONS AND FUTURE DIRECTIONS
5.1 Conclusions
The main aim of the studies presented in this dissertation was to develop CE based
analytical techniques for the characterization of individual particles including Aβ aggregates in
different stages of aggregation. The studies in Chapter 2 led to increased insight regarding false
positive fluorescence signals observed in Aβ studies using ThT fluorescence. Enhancement of
ThT fluorescence was observed in the presence of polystyrene beads, and this fluorescence
enhancement increased as the diameter and concentration of the PS beads increased. Studies
based on spectrofluorometry (EEMs) showed small spectral differences between ThT
fluorescence enhancement due to PS beads and amyloid fibrils, which will not be apparent at the
fixed excitation and emission wavelengths typically used with ThT for studying amyloid
aggregation. This demonstrates the potential for interference by non-amyloid particles in Aβ
aggregation studies using ThT fluorescence. Thioflavin T adsorption on PS beads was found to
be consistent with the Langmuir adsorption isotherm model. The number of molecules of ThT
adsorbed per unit surface area of PS beads was calculated from the adsorption experiments and
was consistent with the number of molecules of insulin adsorbed on polystyrene beads reported
in literature. Despite literature reports of ThT micelle formation, there was no indication of ThT
micelles at micromolar concentrations using four different methods: spectrophotometry,
spectrofluorometry, dynamic light scattering, and tensiometry.
Chapter 3 focused on the development of three channel LLS and LIF detection (CE-
LLS2-LIF) for the characterization of protein aggregates detected individually after CE
separation. The newly developed CE-LLS2-LIF system can simultaneously collect scattered light
at 20° and 90° and fluorescence at 90° with respect to the incident radiation. A size detection

92
limit of 80 nm diameter for individual PS beads was obtained with the 90° LLS channel.
Similarly, detection efficiencies of 53%, 66%, and 66% were established for 700 nm blue
fluorescent beads in the 20° LLS, 90° LLS, and LIF channels, respectively. After optimization
and characterization of the CE-LLS2-LIF system, three types of Aβ samples were analyzed.
Analysis of a monomeric and fully formed fibrils samples of a mixture of FAM-Aβ (1-
40) and Aβ (1-40) peptides (1:4) demonstrated the ability of the CE-LLS2-LIF system to detect
individual sharp peaks consistent with individual Aβ aggregates. From the nature of
electropherograms of the fibrils it was assumed that the fluorescent fibrils had shorter elution
time (higher net electrophoretic mobility) compared to major nonfluorescent fibrils. This could
be because the labeling of the peptides may have altered their aggregation mechanism. Finally,
analysis of aliquots from different days of an aggregating mixture of FAM-Aβ (1-40) and Arctic
Aβ (1-40) peptides (1:1) using the CE-LLS2-LIF system showed a progression of aggregation
over time. The result was also consistent with reports that Arctic Aβ peptide stabilizes smaller
aggregates.
The newly developed CE-LLS2-LIF system was used to analyze different types of
particles ranging from 60 nm to 2000 nm in size: PS beads, Aβ aggregates, CdS quantum dots,
and cyanine based organic functional particles (Chapter 4). Characterization of individual
particles of different sample types was demonstrated with detection in all three channels.
Successful separation and identification of different particle types was possible using both
electrophoretic migration times and ratios of signal intensities from the different detection
channels. These studies demonstrated that the development of CE-LLS2-LIF system is useful for
differentiating different particle types detected individually in complex mixtures, including Aβ
aggregates.

93
5.2 Future Directions
The development of the CE-LLS2-LIF system is an important step for the characterization
Aβ aggregates and other particles of similar size; however, the detection limits and detection
efficiency of the system can both be improved in future studies. One important step towards
improving the detection limit of the fluorescence channel could be to use a laser with a more
suitable wavelength for excitation of the fluorescent labels used. For example, the excitation
maximum of fluorescein is 494 nm, and the use of a laser with a wavelength closer to 494 nm
(instead of the 405 nm laser used in this study) would lead to reduced detection limits for
aggregates containing FAM labeled Aβ peptide.
The excitation beam for the LIF and LLS detector presented in this dissertation is focused
to an approximately circular spot at the center of the capillary to reduce light scattering by the
capillary walls. Normally, a plano-convex lens is used to focus the laser light in the capillary
window, which produces a circular laser spot at the center of the capillary. The calculated size of
the laser spot for the detector presented in this study was 6.5 µm, and the capillary inner diameter
was 52 µm. This means that particles can pass through the capillary while missing the focused
excitation spot, resulting in a blind spot. Such a blind spot reduces the detection efficiency for
individual particles. An elliptical laser spot can be produced using a cylindrical lens instead of a
plano-convex lens, which could cover more space inside the capillary without increasing
background scatter by the capillary wall. The increased length of the spot in the capillary (long
axis of the elliptical spot) would increase the transit time of the particles through the detection
beam. This could increase the detection efficiency because particles would have more time for
random motion to move them out of the detector blind spots. The limitation of this approach is
that it will be more difficult to resolve the resulting broader peaks due to individual particles.

94
An interesting observation in Chapter 3 of this dissertation was the elution of the
fluorescent fibrils prepared from the mixture of FAM-Aβ (1-40) and Aβ (1-40) at shorter elution
times compared to nonfluorescent fibrils. It is hard to make any conclusion about the effect of
peptide labeling based on this simple observation. Hence, the newly developed CE-LLS2-LIF
system could be used to study the effects of online as well as offline labeling of Aβ aggregates
with additional experiments. To study the effects of covalent labeling of Aβ peptides on
aggregation mechanism, aggregation of more than one type of labeled peptide coluld be
monitored along with the aggregation of unlabeled peptides, using the CE-LLS2-LIF system.
Comparison of both LLS and LIF signals of aggregating mixtures of such samples could
elucidate any effects of labeling on aggregation. These simple experiments using the CE-LLS2-
LIF system could help to clarify long standing questions about the effects of labeling agents on
the aggregation mechanism of Aβ peptides.
Another approach to broaden the applicability of the newly developed CE-LLS2-LIF
system is to add an additional LIF detection channel at 90° with respect to the excitation source.
This addition would enable the system to detect particles with two emission wavelengths. The
added detection channel would be parallel to the existing 90° LLS channel. This can be
accomplished by inserting an additional dichroic mirror with a suitable cutoff wavelength (based
on the sample to be analyzed) in between the existing dichroic mirror and the PMT of the 90°
LIF channel. After the addition of the new LIF channel, the total number of detection channels
will be 4 - 2 LIF channels and 2 LLS channels. The additional channel will enable the system to
be applied to analyze Aβ aggregates with two LIF emission wavelengths. Aggregates with two
emission wavelength could be prepared from a mixture of Aβ peptides labeled with different
dyes, or noncovalent ThT labeling could be used for aggregates prepared with FAM labeled Aβ
95
peptides. In each case both labeling agents must have overlapping excitation wavelengths, and
two different emission wavelengths that can be separated with a dichroic mirror. Otherwise, two
excitation sources would be required. This is not impossible, but the system would be more
complicated. Analysis of protein aggregates with two emission wavelengths would be helpful in
order to develop a better understanding of the effect of labeling agents on the structure of
aggregates and aggregation mechanisms.
The study of the inhibition of Aβ aggregation using small molecules as inhibitors is a
long-term objective of this research. The newly developed CE-LLS2-LIF system can be an
effective tool for such studies. The presence of 20° and 90° LLS detection channels, as well as a
LIF detection channel can give more information about the effects of aggregation inhibitors
compared to the techniques currently used for such studies. Comparison of the signals of
aggregating mixtures of Aβ peptides in the presence and absence of the inhibitor molecules can
provide useful information about the alteration of the aggregation mechanism and the population
of structures formed in the presence of the inhibitors.

96
REFERENCES
1. Pastore, A. and P. Temussi, Protein aggregation and misfolding: good or evil? J. Phys.-
Condens. Mat., 2012. 24(24).
2. Morris, A.M., M.A. Watzky, and R.G. Finke, Protein aggregation kinetics, mechanism,
and curve-fitting: A review of the literature. BBA-Proteins Proteom., 2009. 1794(3): p.
375-397.
3. Mahler, H.-C., et al., Protein Aggregation: Pathways, Induction Factors and Analysis. J.
Pharma. Sci., 2009. 98(9): p. 2909-2934.
4. Oosawa, F., et al., G-F transformation of actin as a fibrous condensation. J. Polym. Sci.,
1959. 37: p. 323-36.
5. Hofrichter, J., P.D. Ross, and W.A. Eaton, Kinetics and mechanism of deoxyhemoglobin-
S gelation - new approach to understanding sickel-cell disease. . Proc. Natl. Acad. Sci.
U.S.A., 1974. 71(12): p. 4864-4868.
6. Singh, S.K., et al., An Industry Perspective on the Monitoring of Subvisible Particles as a
Quality Attribute for Protein Therapeutics. J. Pharm. Sci., 2010. 99(8): p. 3302-3321.
7. Carpenter, J.F., et al., Overlooking Subvisible Particles in Therapeutic Protein Products:
Gaps That May Compromise Product Quality. J. Pharm. Sci., 2009. 98(4): p. 1201-1205.
8. Cromwell, M.E.M., E. Hilario, and F. Jacobson, Protein aggregation and bioprocessing.
Aaps J., 2006. 8(3): p. E572-E579.
9. Moore, J.M.R., T.W. Patapoff, and M.E.M. Cromwell, Kinetics and thermodynamics of
dimer formation and dissociation for a recombinant humanized monoclonal antibody to
vascular endothelial growth factor. Biochem., 1999. 38(42): p. 13960-13967.
10. Sgarbossa, A., Natural Biomolecules and Protein Aggregation: Emerging Strategies
against Amyloidogenesis. Int. J. Mol. Sci., 2012. 13(12): p. 17121-17137.
11. Rambaran, R.N. and L.C. Serpell, Amyloid fibrils Abnormal protein assembly. Prion,
2008. 2(3): p. 112-117.

97
12. Di Carlo, M., D. Giacomazza, and P.L. San Biagio, Alzheimer's disease: biological
aspects, therapeutic perspectives and diagnostic tools. J. Phys-Condens. Matt., 2012.
24(24).
13. Bellotti, V. and F. Chiti, Amyloidogenesis in its biological environment: challenging a
fundamental issue in protein misfolding diseases. Curr. Opin. Struc. Biol., 2008. 18(6): p.
771-779.
14. Buxbaum, J.N. and R.P. Linke, A Molecular History of the Amyloidoses. J. Mol. Biol.,
2012. 421(2-3): p. 142-159.
15. Jonsson, T., et al., A mutation in APP protects against Alzheimer's disease and age-
related cognitive decline. Nature, 2012. 488(7409): p. 96-99.
16. Kaden, D., et al., The amyloid precursor protein and its homologues: Structural and
functional aspects of native and pathogenic oligomerization. Eur. J. Cell Biol., 2012.
91(4): p. 234-239.
17. Coulson, E.J., et al., What the evolution of the amyloid protein precursor supergene
family tells us about its function. Neurochem. Int., 2000. 36(3): p. 175-184.
18. Berchtold, N.C. and C.W. Cotman, Evolution in the conceptualization of dementia and
Alzheimer's disease: Greco-Roman period to the 1960s. Neurobiol. Aging, 1998. 19(3):
p. 173-189.
19. Pryor, N.E., M.A. Moss, and C.N. Hestekin, Unraveling the Early Events of Amyloid-
beta Protein (A beta) Aggregation: Techniques for the Determination of A beta
Aggregate Size. Int. J. Mol. Sci., 2012. 13(3): p. 3038-3072.
20. Lansbury, P.T., Inhibition of amyloid formation: a strategy to delay the onset of
Alzheimer's disease. Curr. Opin. Chem. Biol., 1997. 1(2): p. 260-267.
21. Walsh, D.M., et al., Certain inhibitors of synthetic amyloid beta-peptide (A beta)
fibrillogenesis block oligomerization of natural A beta and thereby rescue long-term
potentiation. J. Neurosci., 2005. 25(10): p. 2455-2462.
22. Walsh, D.M. and D.J. Selkoe, Oligomers in the brain: The emerging role of soluble
protein aggregates in neurodegeneration. Protein Peptide Lett., 2004. 11(3): p. 213-228.
23. Selkoe, D.J., Alzheimer's disease is a synaptic failure. Science, 2002. 298(5594): p. 789-
791.

98
24. Hartley, D.M., et al., Protofibrillar intermediates of amyloid beta-protein induce acute
electrophysiological changes and progressive neurotoxicity in cortical neurons. J.
Neurosci., 1999. 19(20): p. 8876-8884.
25. Haugabook, S.J., et al., High throughput screens for the identification of compounds that
alter the accumulation of the Alzheimer's amyloid beta peptide (A beta). J. Neurosci.
Meth., 2001. 108(2): p. 171-179.
26. Harper, J.D. and P.T. Lansbury, Models of amyloid seeding in Alzheimier's disease and
scrapie: Mechanistic truths and physiological consequences of the time-dependent
solubility of amyloid proteins. Ann. Rev. Biochem., 1997. 66: p. 385-407.
27. Soreghan, B., J. Kosmoski, and C. Glabe, Surfactant properties of Alzheimers A-beta
peptides and the mechanism of amyloid aggregation J. Biol. Chem., 1994. 269(46): p.
28551-28554.
28. Sengupta, P., et al., The amyloid beta peptide (A beta(1-40)) is thermodynamically
soluble at physiological concentrations. Biochem., 2003. 42(35): p. 10506-10513.
29. Bartolini, M. and V. Andrisano, Strategies for the Inhibition of Protein Aggregation in
Human Diseases. Chembiochem., 2010. 11(8): p. 1018-1035.
30. Necula, M., et al., Small molecule inhibitors of aggregation indicate that amyloid beta
oligomerization and fibrillization pathways are independent and distinct. J. Biol. Chem.,
2007. 282(14): p. 10311-10324.
31. Masuda, M., et al., Small molecule inhibitors of alpha-synuclein filament assembly.
Biochem., 2006. 45(19): p. 6085-6094.
32. Zhang, X.-Q., et al., Interactions of nanomaterials and biological systems: Implications
to personalized nanomedicine. Adv. Drug Deliver. Rev., 2012. 64(13): p. 1363-1384.
33. Haskell, R.J., Characterization of submicron systems via optical methods. J. Pharma.
Sci., 1998. 87(2): p. 125-129.
34. Lespes, G. and J. Gigault, Hyphenated analytical techniques for multidimensional
characterisation of submicron particles: A review. Anal. Chim. Acta, 2011. 692(1-2): p.
26-41.

99
35. Kostal, V. and E.A. Arriaga, Recent advances in the analysis of biological particles by
capillary electrophoresis. Electrophoresis, 2008. 29(12): p. 2578-2586.
36. Fukumoto, H., et al., High-molecular-weight beta-amyloid oligomers are elevated in
cerebrospinal fluid of Alzheimer patients. Faseb Journal, 2010. 24(8): p. 2716-2726.
37. Walsh, D.M., et al., Amyloid beta-protein fibrillogenesis - Detection of a protofibrillar
intermediate. J. Biol. Chem., 1997. 272(35): p. 22364-22372.
38. Striegel, A.M., Hydrodynamic chromatography: packed columns, multiple detectors, and
microcapillaries. Anal. Bioanal. Chem., 2012. 402(1): p. 77-81.
39. Qureshi, R.N. and W.T. Kok, Application of flow field-flow fractionation for the
characterization of macromolecules of biological interest: a review. Anal. Bioanal.
Chem., 2011. 399(4): p. 1401-1411.
40. Rambaldi, D.C., et al., In vitro amyloid A beta(1-42) peptide aggregation monitoring by
asymmetrical flow field-flow fractionation with multi-angle light scattering detection.
Anal. Bioanal. Chem., 2009. 394(8): p. 2145-2149.
41. Giddings, J.C., F.J.F. Yang, and M.N. Myers, Flow field-flow fractionation - versatile
new separation method. . Science, 1976. 193(4259): p. 1244-1245.
42. Staton, S.J.R., et al., Manipulation and capture of A beta amyloid fibrils and monomers
by DC insulator gradient dielectrophoresis (DC-iGDEP). Analyst, 2012. 137(14): p.
3227-3229.
43. Martinez-Duarte, R., Microfabrication technologies in dielectrophoresis applications-A
review. Electrophoresis, 2012. 33(21): p. 3110-3132.
44. Matsumura, S., et al., Two Distinct Amyloid beta-Protein (A beta) Assembly Pathways
Leading to Oligomers and Fibrils Identified by Combined Fluorescence Correlation
Spectroscopy, Morphology, and Toxicity Analyses. J. Biol. Chem., 2011. 286(13): p.
11555-11562.
45. Picou, R.A., et al., Separation and detection of individual A beta aggregates by capillary
electrophoresis with laser-induced fluorescence detection. Anal. Biochem., 2012. 425(2):
p. 104-112.

100
46. Kato, M., et al., Analytical method for beta-amyloid fibrils using CE-laser induced
fluorescence and its application to screening for inhibitors of beta-amyloid protein
aggregation. Anal. Chem., 2007. 79(13): p. 4887-4891.
47. Lomakin, A., et al., Kinetic theory of fibrillogenesis of amyloid beta-protein. Proc. Natl.
Acad. Sci. U.S.A., 1997. 94(15): p. 7942-7947.
48. Stefani, M., Structural features and cytotoxicity of amyloid oligomers: Implications in
Alzheimer's disease and other diseases with amyloid deposits. Prog. Neurobiol., 2012.
99(3): p. 226-245.
49. Landers, J.P., Capillary and microchip electrophoresis and associated microtechniques.
Third ed. 2008, New York: CRC Press. 3-74.
50. Rodriguez, M.A. and D.W. Armstrong, Separation and analysis of colloidal/nano-
particles including microorganisms by capillary electrophoresis: a fundamental review.
J. Chromatogr. B, 2004. 800(1-2): p. 7-25.
51. Clodfelter, D.K., M.A. Nussbaum, and J. Reilly, Comparison of free solution capillary
electrophoresis and size exclusion chromatography for quantitating non-covalent
aggregation of an acylated peptide. J. Pharmaceut. Biomed., 1999. 19(5): p. 763-775.
52. Righetti, P.G., et al., Surfing silica surfaces superciliously. J. Chromatogr. A, 2004.
1053(1-2): p. 15-26.
53. Watzig, H., S. Kaupp, and M. Graf, Inner surface properties of capillaries for
electrophoresis. Trac-Trend Anal. Chem., 2003. 22(9): p. 588-604.
54. Felhofer, J.L., L. Blanes, and C.D. Garcia, Recent developments in instrumentation for
capillary electrophoresis and microchip-capillary electrophoresis. Electrophoresis, 2010.
31(15): p. 2469-2486.
55. Surugau, N. and P.L. Urban, Electrophoretic methods for separation of nanoparticles.
Journal of Separation Science, 2009. 32(11): p. 1889-1906.
56. Frost, N.W., M. Jing, and M.T. Bowser, Capillary Electrophoresis. Anal. Chem., 2010.
82(12): p. 4682-4698.
57. Kremser, L., et al., Capillary electrophoresis of viruses, subviral particles and virus
complexes. J. Sep. Sci., 2007. 30(11): p. 1704-1713.

101
58. Pamme, N., R. Koyama, and A. Manz, Counting and sizing of particles and particle
agglomerates in a microfluidic device using laser light scattering: application to a
particle-enhanced immunoassay. Lab Chip, 2003. 3(3): p. 187-192.
59. Schrum, D.P., et al., Microchip flow cytometry using electrokinetic focusing. Anal.
Chem., 1999. 71(19): p. 4173-4177.
60. Zarrin, F., D.J. Bornhop, and N.J. Dovichi, Laser doppler velocimetry for particle-size
determination by light scatter within the sheath flow cuvette Anal. Chem., 1987. 59(6): p.
854-860.
61. Zarrin, F., J.A. Risfelt, and N.J. Dovichi, Light scattering detection within the sheath flow
cuvette for size determination of multicomponent submicrometer particle suspensions
Anal. Chem., 1987. 59(6): p. 850-854.
62. Zarrin, F. and N.J. Dovichi, Particle counting by laser-light scatter for capillary
hydrodynamic chromatography Anal. Chem., 1985. 57(9): p. 1826-1829.
63. Mishchenko, M.I.T., Larry D.; Lacis, Andrew A., Scattering, Absorption, and Emission
of Light by Small Particles. 2002, New York: Cambridge.
64. Borghese, F., P. Denti, and R. Saija, Scattering from Model Nonspherical Particles.
2003, New York: Springer.
65. Zhao, X. and Z. Gao, Surface roughness measurement using spatial-average analysis of
objective speckle pattern in specular direction. Opt. Laser Eng., 2009. 47(11): p. 1307-
1316.
66. Watson, J.V., Introduction to flow cytometry. 1 ed. 1991, New York: Cambridge.
67. Andreyev, D. and E.A. Arriaga, Simultaneous laser-induced fluorescence and scattering
detection of individual particles separated by capillary electrophoresis. Anal. Chem.,
2007. 79(14): p. 5474-5478.
68. Biancalana, M. and S. Koide, Molecular mechanism of Thioflavin-T binding to amyloid
fibrils. BBA-Proteins Proteom., 2010. 1804(7): p. 1405-1412.
69. O'Nuallain, B., et al., Kinetics and thermodynamics of amyloid assembly using a high-
performance liquid chromatography-based sedimentation assay, in Amyloid, Prions, and
Other Protein Aggregates, Pt C, I. Kheterpal and R. Wetzel, Editors. 2006. p. 34-74.
102
70. Hawe, A., M. Sutter, and W. Jiskoot, Extrinsic Fluorescent Dyes as Tools for Protein
Characterization. Pharm. Res., 2008. 25(7): p. 1487-1499.
71. Levine, H., Thioflavine-T interaction with synthetic alzheimers-disease beta-amyloid
peptides - detection of amyloid aggregation in solution. Protein Sci., 1993. 2(3): p. 404-
410.
72. Naiki, H., et al., Fluorometric-determination of amyloid fibrils invitro using the
fluorescent dye, thioflavine-t. Anal. Biochem., 1989. 177(2): p. 244-249.
73. Singh, P.K., et al., Confined ultrafast torsional dynamics of Thioflavin-T in a nanocavity.
Phys. Chem. Chem. Phys., 2011. 13(17): p. 8008-8014.
74. Sabate, R., I. Lascu, and S.J. Saupe, On the binding of Thioflavin-T to HET-s amyloid
fibrils assembled at pH 2. J. Struct. Biol., 2008. 162(3): p. 387-396.
75. Khurana, R., et al., Mechanism of thioflavin T binding to amyloid fibrils. J. Struct. Biol.,
2005. 151(3): p. 229-238.
76. Groenning, M., Binding mode of Thioflavin T and other molecular probes in the context
of amyloid fibrils-current status. J. Chem. Biol., 2010. 3(1): p. 1-18.
77. Stsiapura, V.I., et al., Thioflavin T as a Molecular Rotor: Fluorescent Properties of
Thioflavin T in Solvents with Different Viscosity. J. Phys. Chem. B, 2008. 112(49): p.
15893-15902.
78. Stsiapura, V.I., et al., Computational study of thioflavin T torsional relaxation in the
excited state. J. Phys. Chem. A, 2007. 111(22): p. 4829-4835.
79. Picou, R.A., I. Kheterpal, and S.D. Gilman, A data treatment method for detecting
fluorescence anisotropy peaks in capillary electropherograms. Anal. Chim. Acta, 2012.
739: p. 99-103.
80. Choudhury, S.D., et al., Photophysical Studies on the Noncovalent Interaction of
Thioflavin T with Cucurbit n uril Macrocycles. J. Phys. Chem. B, 2009. 113(7): p. 1891-
1898.
81. Groenning, M., et al., Study on the binding of Thioflavin T to beta-sheet-rich and non-
beta-sheet cavities. J. Struct. Biol., 2007. 158(3): p. 358-369.

103
82. Nilsson, M.R., Techniques to study amyloid fibril formation in vitro. Methods, 2004.
34(1): p. 151-160.
83. Margulies, L., H. Rozen, and S. Nir, Model for competitive adsorption of organic cations
on clays. Clay Clay Miner., 1988. 36(3): p. 270-276.
84. Radko, S.P. and A. Chrambach, Separation and characterization of sub-mu m- and mu
m-sized particles by capillary zone electrophoresis. Electrophoresis, 2002. 23(13): p.
1957-1972.
85. Rezenom, Y.H., et al., Separation and detection of individual submicron particles by
capillary electrophoresis with laser-light-scattering detection. Analyst, 2007. 132(12): p.
1215-1222.
86. Lakowicz, J.R., Principles of Fluorescence Spectroscopy. Third ed. 2006, New York:
Springer.
87. Picou, R.A., et al., Analysis of A beta (1-40) and A beta (1-42) monomer and fibrils by
capillary electrophoresis. J. Chromatogr. B, 2011. 879(9-10): p. 627-632.
88. Levine, H., Multiple ligand binding sites on A beta(1-40) fibrils. Amyloid, 2005. 12(1): p.
5-14.
89. Wolfe, L.S., et al., Protein-induced photophysical changes to the amyloid indicator dye
thioflavin T. Proc. Natl. Acad. Sci. U.S.A., 2010. 107(39): p. 16863-16868.
90. Pinholt, C., et al., Influence of Acylation on the Adsorption of Insulin to Hydrophobic
Surfaces. Pharm. Res., 2011. 28(5): p. 1031-1040.
91. Rosen, M.J. and J.T. Kunjappu, Surfactants and Interfacial Phenomena. Fourth ed. 2012,
New Jersey: John Wiley & Sons.
92. Levine, H., III, Small molecule inhibitors of A beta assembly. Amyloid, 2007. 14(3): p.
185-197.
93. Walsh, D.M. and D.J. Selkoe, A beta Oligomers - a decade of discovery. J. Neurochem.,
2007. 101(5): p. 1172-1184.
94. Benilova, I., E. Karran, and B. De Strooper, The toxic A beta oligomer and Alzheimer's
disease: an emperor in need of clothes. Nat. Neurosci., 2012. 15(3): p. 349-357.

104
95. Lee, S., E.J. Fernandez, and T.A. Good, Role of aggregation conditions in structure,
stability, and toxicity of intermediates in the A beta fibril formation pathway. Protein Sci.,
2007. 16(4): p. 723-732.
96. DaSilva, K.A., J.E. Shaw, and J. McLaurin, Amyloid-beta fibrillogenesis: Structural
insight and therapeutic intervention. Exp. Neurol., 2010. 223(2): p. 311-321.
97. Galante, D., et al., Differential toxicity, conformation and morphology of typical initial
aggregation states of A beta 1-42 and A beta py3-42 beta-amyloids. Int. J. Biochem. Cell
Biol., 2012. 44(11): p. 2085-2093.
98. Picou, R., et al., Analysis of monomeric A beta (1-40) peptide by capillary
electrophoresis. Analyst, 2010. 135(7): p. 1631-1635.
99. Verpillot, R., et al., Simultaneous analysis by capillary electrophoresis of five amyloid
peptides as potential biomarkers of Alzheimer's disease. J. Chromatogr. A, 2008. 1214(1-
2): p. 157-164.
100. Frackowiak, T., et al., Binding of an oxindole alkaloid from Uncaria tomentosa to
amyloid protein (A beta 1-40). Z. Naturforsch. C, 2006. 61(11-12): p. 821-826.
101. Kishita, A., et al., Formation of methionine sulfoxide of amyloid beta-peptide (1-40) by
Cu(bdpe)/H2O2 system. Synth. Reac. Inorg. Met., 2005. 35(9): p. 677-681.
102. Sabella, S., et al., Capillary electrophoresis studies on the aggregation process of beta-
amyloid 1-42 and 1-40 peptides. Electrophoresis, 2004. 25(18-19): p. 3186-3194.
103. Varesio, E., et al., Nanoscale liquid chromatography and capillary electrophoresis
coupled to electrospray mass spectrometry for the detection of amyloid-beta peptide
related to Alzheimer's disease. J. Chromatogr. A, 2002. 974(1-2): p. 135-142.
104. Thorsen, G., et al., Stereoselective determination of amino acids in beta-amyloid peptides
and senile plaques. Anal. Chem., 2001. 73(11): p. 2625-2631.
105. Sweeney, P.J., et al., Electrophoretic techniques for the analysis of synthetic amyloid
beta-A4-related peptides. Anal. Biochem., 1993. 212(1): p. 179-184.
106. Gilman, S.D., et al., Analysis of Aβ peptide aggregation by capillary electrophoresis
withlLaser-Induced fluorescence anisotropy detection. Anal. Chem., 2013. XX(XX): p.
XX-XX.

105
107. Picot, J., et al., Flow cytometry: retrospective, fundamentals and recent instrumentation.
Cytotechnology, 2012. 64(2): p. 109-130.
108. Cho, S.H., et al., Review Article: Recent advancements in optofluidic flow cytometer.
Biomicrofluidics, 2010. 4(4).
109. Whisnant, A.R. and S.D. Gilman, Studies of reversible inhibition, irreversible inhibition,
and activation of alkaline phosphatase by capillary electrophoresis. Anal. Biochem.,
2002. 307(2): p. 226-234.
110. Kheterpal, I. and R.A. Mathies, Capillary array electrophoresis DNA sequencing. Anal.
Chem., 1999. 71(1): p. 31A-37A.
111. Verbeck, G.F. and S.C. Beale, Isoelectric point analysis of proteins and peptides by
capillary isoelectric focusing with two-wavelength laser-induced fluorescence detection.
J. Microcolumn Sep., 1999. 11(10): p. 708-715.
112. Steen, H.B., Flow cytometer for measurement of the light scattering of viral and other
submicroscopic particles. Cytom. Part A, 2004. 57A(2): p. 94-99.
113. Hercher, M., W. Mueller, and H.M. Shapiro, Detection and discrimination of individual
viruses by flow cytometry. J. Histochem. Cytochem., 1979. 27(1): p. 350-352.
114. Duffy, C.F., A.A. McEathron, and E.A. Arriaga, Determination of individual
microsphere properties by capillary electrophoresis with laser-induced fluorescence
detection. Electrophoresis, 2002. 23(13): p. 2040-2047.
115. Zarrin, F. and N.J. Dovichi, Effect of sample stream radius upon light scatter
distributions generated with a gaussian-beam light-source in the sheath flow cuvette.
Anal. Chem., 1987. 59(6): p. 846-850.
116. Salzman, G.C., M.E. Wilder, and J.H. Jett, Light-scattering with stream-in-air flow
systems. J. Histochem. Cytochem., 1979. 27(1): p. 264-267.
117. Kheterpal, I., et al., A beta protofibrils possess a stable core structure resistant to
hydrogen exchange. Biochem., 2003. 42(48): p. 14092-14098.
118. Lashuel, H.A., et al., Mixtures of wild-type and a pathogenic (E22G) form of A beta 40 in
vitro accumulate protofibrils, including amyloid pores. J. Mol. Biol., 2003. 332(4): p.
795-808.

106
119. Sailor, M.J. and J.-H. Park, Hybrid Nanoparticles for Detection and Treatment of
Cancer. Adv. Mater., 2012. 24(28): p. 3779-3802.
120. Veiseh, O., J.W. Gunn, and M. Zhang, Design and fabrication of magnetic nanoparticles
for targeted drug delivery and imaging. Adv. Drug Deliver Rev., 2010. 62(3): p. 284-
304.
121. Cuenya, B.R., Synthesis and catalytic properties of metal nanoparticles: Size, shape,
support, composition, and oxidation state effects. Thin Solid Films, 2010. 518(12): p.
3127-3150.
122. Krieger, U.K., C. Marcolli, and J.P. Reid, Exploring the complexity of aerosol particle
properties and processes using single particle techniques. Chem. Soc. Rev., 2012.
41(19): p. 6631-6662.
123. Zaenker, H. and A. Schierz, Engineered nanoparticles and their identification among
natural nanoparticles. Annu. Rev. Anal. Chem., 2012. 5: p. 107-132.
124. Handy, R.D., R. Owen, and E. Valsami-Jones, The ecotoxicology of nanoparticles and
nanomaterials: current status, knowledge gaps, challenges, and future needs.
Ecotoxicology, 2008. 17(5): p. 315-325.
125. Bzdek, B.R., M.R. Pennington, and M.V. Johnston, Single particle chemical analysis of
ambient ultrafine aerosol: A review. J. Aerosol Sci., 2012. 52: p. 109-120.
126. Celiz, M.D., et al., Study on the Effects of Humic and Fulvic Acids on Quantum Dot
Nanoparticles Using Capillary Electrophoresis with Laser-Induced Fluorescence
Detection. Environ. Sci. Technol., 2011. 45(7): p. 2917-2924.
127. Surugau, N. and P.L. Urban, Electrophoretic methods for separation of nanoparticles. J.
Sep. Sci., 2009. 32(11): p. 1889-1906.
128. Radko, S.P. and A. Chrambach, Capillary electrophoresis of subcellular-sized particles.
J. Chromatogr. B, 1999. 722(1-2): p. 1-10.
129. Barth, H.G. and R.B. Flippen, Particle-size analysis. Anal. Chem., 1995. 67(12): p.
R257-R272.

107
130. Radko, S.P., M. Stastna, and A. Chrambach, Size-dependent electrophoretic migration
and separation of liposomes by capillary zone electrophoresis in electrolyte solutions of
various ionic strengths. Anal. Chem., 2000. 72(24): p. 5955-5960.
131. Ahmadzadeh, H., et al., Automated analysis of individual particles using a commercial
capillary relectrophoresis system. J. Chromatogr. A, 2005. 1064(1): p. 107-114.
132. Regmi, S.C., Rezenom Yohannes H., Kheterpal Indu, and Gilman, S. Douglass,
Development of capillary electrophoresis system with three channel laser induced
fluorescence and laser light scattering detection and analysis of individual Aβ
aggregates. Anal. Chem., 2013. XX(XX): p. XX.
133. Kho, R., C.L. Torres-Martinez, and R.K. Mehra, A simple colloidal synthesis for gram-
quantity production of water-soluble ZnS nanocrystal powders. J. Colloid Interf. Sci.,
2000. 227(2): p. 561-566.
134. de Rooy, S.L., et al., Ionically Self-Assembled, Multi-Luminophore One-Dimensional
Micro- and Nanoscale Aggregates of Thiacarbocyanine GUMBOS. J. Phys. Chem. C,
2012. 116(14): p. 8251-8260.
135. Jordan, A.N., et al., Anion-controlled morphologies and spectral features of cyanine-
based nanoGUMBOS - an improved photosensitizer. Nanoscale, 2012. 4(16): p. 5031-
5038.
136. Yu, W.W., et al., Water-soluble quantum dots for biomedical applications. Biochem.
Bioph. Res. Co., 2006. 348(3): p. 781-786.
137. Chen, Y.F. and Z. Rosenzweig, Luminescent CdS quantum dots as selective ion probes.
Anal. Chem., 2002. 74(19): p. 5132-5138.
138. Bruchez, M., et al., Semiconductor nanocrystals as fluorescent biological labels. Science,
1998. 281(5385): p. 2013-2016.
139. Chan, W.C.W. and S.M. Nie, Quantum dot bioconjugates for ultrasensitive nonisotopic
detection. Science, 1998. 281(5385): p. 2016-2018.
140. Kim, F.S., G. Ren, and S.A. Jenekhe, One-Dimensional Nanostructures of pi-Conjugated
Molecular Systems: Assembly, Properties, and Applications from Photovoltaics, Sensors,
and Nanophotonics to Nanoelectronics. Chem. Mater., 2011. 23(3): p. 682-732.

108
141. Zang, L., Y. Che, and J.S. Moore, One-Dimensional Self-Assembly of Planar pi-
Conjugated Molecules: Adaptable Building Blocks for Organic Nanodevices. Accounts
Chem. Res., 2008. 41(12): p. 1596-1608.
109
APPENDIX A. FOLIC ACID ANALYSIS USING CAPILLARY
ELECTROPHORESIS WITH UV ABSORBANCE AND LASER-INDUCED
FLUORESCENCE DETECTION
Suresh C. Regmi, Ashley L. Phipps, and S. Douglass Gilman*
Department of Chemistry, Louisiana State University, Baton Rouge, LA 70803, USA
S. Douglass Gilman (Corresponding Author) – [email protected]; Phone: +1 (225) 578-3010;
Fax: +1 (225) 578-3458
Abbreviations: FA, folic acid; NDA, naphthalene-2,3-dicarboxaldehyde; NBD-F, 4-Fluoro-7-
nitro-2,1,3-benzoxadiazole; MO, mesityl oxide; NM, neutral marker
Kewords: Capillary electrophoresis, folic acid, fluorescence, derivatization

110
Abstract
Folic acid (FA) samples were analyzed using capillary electrophoresis (CE) with UV absorbance
and laser-induced fluorescence (LIF) detection. Published studies indicated that FA exhibits
native fluorescence with UV excitation and that FA can be derivatized with amine-reactive
fluorogenic reagents. Despite some literature reports that FA exhibits significant native
fluorescence with UV excitation, our studies with CE-LIF indicated that FA exhibits very weak
fluorescence, if any. Commercial FA samples did produce fluorescence peaks, but these were
due to impurities based on the electrophoretic mobilities of the major peaks in the
electropherograms. Derivatization with several fluorogenic reagents that react with primary or
secondary amines was attempted. Methods for detecting FA after fluorescamine derivatization
have been reported in the literature, but attempts to derivatize FA with NBD-F, NDA/NaCN,
NDA/mercaptoethanol and fluorescamine were unsuccessful, demonstrating that FA is, in fact,
unreactive with these common reagents. Absorbance detection was the most effective CE
detection method studied for FA. Effective pre-column derivatization of FA for CE-LIF analysis
will require either the identification of more reactive derivatization reagents for amine groups or
the use of derivatization strategies targeting different FA functional groups.

111
1 Introduction
Folic acid (FA) was first extracted from yeast and used for the treatment of “pernicious anaemia
of pregnancy” by L. Wills in 1931 [1], and it was originally called vitamin M or vitamin Bc. Its
structure was elucidated 15 years later by Angier et al. [2]. Folic acid is also known as pteroyl-L-
glutamic acid, vitamin B9 and 2-(4-(((2-amino-4-oxo-3,4-dihydropteridin-6-
yl)methyl)amino)benzamido)pentanedioic acid. The term folate is most commonly used to refer
to all the derivatives of FA, including the naturally occurring polyglutamates [3]. Folic acid
typically refers to the most oxidized, stable and easily absorbable synthetic form of folate (Figure
1) [3]. Folic acid consists of the base pteridine and p-aminobenzoyl-L-glutamic acid. Folic acid
has higher stability and bioavailibility than other folates, and, therefore, FA is used for
fortification [4-6]. Folic acid is reduced by the enzyme dihydrofolate reductase into other folate
forms, mainly tetrahydrofolate (THF) in the liver, before entering into various biological
processes [7]. Folate plays an important role in human nutrition. Deficiency of folate is related to
a number of diseases including megaloblastic anemia, neural tube defects, and coronary heart
disease [3, 7]. Various studies over the last three decades have shown that adequate intake of
folate is very important during pregnancy to reduce the risk of malformations during embryonic
development [3, 7]. Folate is an essential dietary component for the formation of red and white
blood cells and epithelial cells in the digestive tract. Biologically, folate is used as a source of
carbon atoms for phospholipid, DNA, protein, and neurotransmitter syntheses [3, 7].
Quantification of FA is an important analytical challenge, and methods based on a variety of
approaches have been developed, including HPLC, capillary electrophoresis (CE), immunoassay,
mass spectrometry, and optical and electrochemical sensors [3, 8-11]. Methods based on HPLC
and immunoassays are among the most prominent for FA quantification over the past decade [3,

112
11]. High performance liquid chromatography based methods are used for the separation,
identification, and quantification of FA and its various derivatives present in foods,
pharmaceutical formulations, and other biological samples [3-6, 8, 10, 11]. A variety of detection
methods have been used for FA analysis with HPLC, including absorbance, fluorescence,
voltammetry, and mass spectrometry [3, 8, 10, 11].
Figure 1. Folic acid.
Capillary electrophoresis is a widely applied separation technique because of its versatility,
high separation efficiency, high resolving power, short analysis times, low sample consumption
and simplicity [12, 13]. Capillary electrophoresis has proven useful for the analysis of many food
components, including FA [9, 14]. For the analysis of FA by CE, the most common detection
method has been UV absorbance [9, 15-21]. While UV absorbance is the most common
detection method for CE, it suffers from relatively poor detection limits, resulting from the short
optical pathlength defined by the capillary internal diameter [13]. Capillary electrophoresis with
UV absorbance detection has been shown to be capable of detecting FA in fortified foods, juices
and pharmaceuticals [9, 15-17, 21]. Fluorescence detection typically provides lower detection
limits and superior selectivity compared to UV absorbance detection for CE, but it requires a
fluorescent analyte [13]. Lower detection limits and improved selectivity for FA analysis will
improve quantification for FA analysis by CE and reduce sample preparation requirements.
Several publications state that FA is weakly fluorescent with UV excitation [22-25], and there
are reports in the literature that FA can be derivatized with amine-reactive reagents to produce

113
fluorescent products that should be suitable for analysis by CE with laser-induced fluorescence
(CE-LIF) [25, 26].
In this paper FA was studied by CE with the aim of developing a CE-LIF method for
quantifying FA. Commercial FA samples were analyzed by CE using both UV absorbance and
laser-induced fluorescence (LIF) detection. Derivatization with several fluorogenic reagents that
react with primary or secondary amines was attempted for CE-LIF analysis. Oxidation of FA to
form a fluorescent product also was explored for CE-LIF analysis of FA.
2 Materials and methods
2.1 Chemicals
Folic acid, fluorescein, naphthalene-2,3-dicarboxaldehyde (NDA), 2-mercaptoethanol,
sodium cyanide, sodium acetate, sodium glutamate, phenylalanine, mesityl oxide, hydrogen
peroxide, acetonitrile, and copper (II) chloride were obtained from Sigma Aldrich (St. Louis,
MO). Fluorescamine, acetone, sodium phosphate, sodium hydroxide, methanol, and boric acid
were obtained from Fisher Scientific (Pittsburgh, PA). 4-Fluoro-7-nitro-2,1,3-benzoxadiazole
(NBD-F) was obtained from TCI America (Portland, OR). Coumarin 460 was obtained from
Exciton (Dayton, OH). Bleach (5% solution of sodium hypochlorite) was obtained from a local
store. All buffers were prepared in ultrapure water (>18 MΩ/cm) from a Modulab water
purification system (United States Filter; Palm Desert, CA). Stock solutions of FA at 2.50 mM
and 5.00 mM were prepared by dissolving FA in 10.0 mM or 25.0 mM borate buffer (pH 9.50).
The fluorescamine stock solutions (3.60 mM and 18.2 mM) were prepared in HPLC-grade
acetone. Coumarin 460 (2.60 mM) was prepared by dissolving the compound in anhydrous
MeOH. Stock solutions of NaCN (10.0 mM), bleach (0.670 M), and hydrogen peroxide (8.80 M)

114
were prepared in 25.0 mM borate buffer at pH 9.50. Stock solutions of NDA (10.0 mM) and
NBD-F (20.0 mM) were prepared in acetonitrile.
2.2 Derivatization of folic acid
Derivatization of folic acid (FA) with fluorescamine was carried out based on the methods
described by Blanco, et al. and De Bernardo et al. at pH 4.20 [25] and 9.50 [27]. At both pH’s,
the fluorescamine dissolved in acetone was added last to initiate the reaction and avoid
hydrolysis of fluorescamine prior to starting the reaction. For derivatization at pH 4.20, the
reaction mixture was prepared in 25.0 mM acetate buffer at pH 4.20 to make the final
concentration 300 µM FA and 6.00 mM fluorescamine. The final concentration of acetone (from
the fluorescamine stock solution) was 33.1%, which is close to the percentage used by Blanco et
al. [25]. Aliquots of the reaction mixture (500 µL) were diluted 3× in 50.0 mM borate buffer at
pH 9.50 at <1, 20, 45, and 200 min and analyzed by CE using a separation buffer of 50.0 mM
borate at pH 9.50. For derivatization at pH 9.50, a mixture of 100 µM FA and 0.500 mM
fluorescamine was prepared in 25.0 mM borate buffer at pH 9.50. The final concentration of
acetone from the fluorescamine stock solution was 14.8%. The reaction was monitored by CE for
4 hr after addition of fluorescamine by injecting from the reaction mixture every 20 min using a
separation buffer of 25.0 mM borate at pH 9.50. Control samples (no FA, with glutamic acid, or
with phenylalanine) were also derivatized with fluorescamine and analyzed by CE at the same
time points and using the same reaction conditions. All samples were injected for 5.0 s at 0.5 psi,
and electrophoretic separations were carried out with a field strength of 417 V/cm.
Fluorescamine derivatization was monitored using two P/ACE MDQ CE instruments, one with
LIF detection using UV excitation and another with UV absorbance detection.

115
Derivatization of FA with 4-fluoro-7-nitro-2,1,3-benzoxadiazole (NBD-F) was carried out
according to the method described by Aoyama et al. [28]. A mixture of 100 µM FA and 0.500
mM NBD-F was prepared in 25.0 mM borate buffer at pH 9.50. The final acetonitrile
concentration (from the NBD-F stock solution) was 2.5%. After being allowed to react for 20
min, the mixture was electrokinetically injected for 5.0 s at 385 V/cm and analyzed by CE using
a separation buffer of 25.0 mM borate at pH 9.50 with a field strength of 385 V/cm. Control
experiments (no FA or with glutamic acid) were also performed using the same conditions. The
experiments were performed using laboratory-constructed CE instruments with LIF detection
(excitation at 457.9 nm and 488 nm, emission with a 500 nm long pass filter) and UV absorbance
detection (210 nm).
Derivatization of FA with NDA and either NaCN or mercaptoethanol was carried based on
the methods as described by Gilman, et al. [29, 30]. For the derivatization of FA with NDA and
NaCN, 100 µM FA was mixed with 0.500 mM NDA and 0.500 mM NaCN. The final
acetonitrile concentration from the NDA stock solution was 5.00%. For the derivatization of FA
with NDA and mercaptoethanol, 1.00 mM FA was allowed to react with 1.00 mM NDA and 7.50
mM mercaptoethanol. The final acetonitrile concentration (from the NDA stock solution) was
10%. The reaction mixtures were prepared in 25.0 mM borate buffer at pH 9.50, but did not
include 30% methanol as was used by Gilman and Ewing [29]. After being allowed to react for
15 min, the mixtures were electrokinetically injected for 5.0 s at 385 V/cm, and separation was
performed in 25.0 mM borate buffer at pH 9.50 with a field strength 385 V/cm. The control
experiments (no FA or with glutamic acid) were performed using identical conditions. These
experiments were carried out using laboratory-constructed CE instruments with LIF detection

116
(excitation at 457.9 nm and 488 nm, emission with a 500 nm long pass filter) and UV absorbance
detection (210 nm).
Oxidation of FA with sodium hypochlorite (bleach) was carried out based on the method
described by Holt et al. [31] with some modifications. The electrolyte concentration was reduced
to make the method compatible with CE. Again, a pH of 9.50 was used instead of the pH used by
Holt et al. because preliminary observations showed no fluorescent product produced under
acidic conditions but multiple fluorescent products produced at pH 9.5. Hahn et al. [32] also
reported no reaction for the conditions proposed by Holt et al. Different concentrations of
sodium hypochlorite (100 µM, 10.0 mM) were mixed with 100 µM FA in 25.0 mM borate buffer
at pH 9.50, and the aliquots of reaction mixtures were injected for 5.0 s at 0.5 psi. Separation was
performed in 25.0 mM borate buffer at pH 9.50 at a field strength of 417 V/cm. The reactions
with bleach as well as hydrogen peroxide (below) were monitored for 200 min using the P/ACE
MDQ instrument with LIF detection.
Oxidation of FA with hydrogen peroxide in presence of copper(II) chloride was conducted
according to the method described by Hirakawa et al. [33], except that the reaction was carried
out at room temperature instead of 37 ˚C because no significant difference in reactivity at those
two temperatures was observed in preliminary experiments. Folic acid solutions (90.0 µM and
300 µM) were allowed to react with hydrogen peroxide (300 µM, 18.0 mM) in the presence of
180 µM copper (II) chloride. The reaction mixtures were prepared in 10.0 mM phosphate buffer
at pH 7.60. Aliquots of reaction mixtures were diluted 3× in 50.0 mM borate buffer at pH 9.50
and injected for 5.0 s at 0.5 psi. The reactions were monitored for 200 min. The separation was
performed with 50.0 mM borate buffer at pH 9.50 at a field strength of 417 V/cm. All control
experiments were performed using the same conditions.

117
2.3 Capillary electrophoresis with UV absorbance detection
Fused-silica capillaries with a 52 µm i.d. and 362 µm o.d. (Polymicro Technologies; Phoenix,
AZ) were used for all CE experiments. For all CE experiments, the detection window was made
by removing the polyimide coating using a window maker (MicroSolv Technology; Eatontown,
NJ). Two instruments were used for CE experiments with UV absorbance detection. A
commercial CE system (P/ACE MDQ CE System; Beckman Coulter; Fullerton, CA) was
equipped with a deuterium lamp and PDA detector. A capillary with a 60.0 cm total length and
50.0-cm length to the detector was used in this instrument. Each new capillary was rinsed before
use with 1.0 M NaOH, ultrapure water, and then with the separation buffer using 20.0 psi applied
by the P/ACE MDQ (10.0 min each) or with a manual syringe pump with the laboratory-
constructed instrument described below. For all CE experiments, the separation buffer was either
25.0 mM or 50.0 mM borate buffer at pH 9.50. All buffer solutions used for CE were filtered
through a 0.2 µm membrane filter (Whatman; Hillsboro, OR). Sample solutions were injected for
5.0 s at 0.5 psi, and separation was performed at a field strength of 417 V/cm. The data
acquisition rate was 32 Hz. A laboratory-constructed instrument also was used and was similar to
that described previously [34]. The capillary was 65.0 cm in total length and 50.0 cm to the
detector. A high voltage power supply (CZE1000R: Spellman; Happauge, NY) was used for
electrophoresis. All electrokinetic injections and separations were made at 25.0 kV (385 V/cm).
An Acutect 500 UV/Vis detector (Scientific Systems; State College, PA) with an on-column
capillary cell was used for absorbance detection. A computer program was written in LabView
(Version 7.1, National Instruments) and used for data acquisition at 100 Hz by the data
acquisition board (Lab-PC-1200/AI; National Instruments; Austin, TX). The data were analyzed
using OriginLab 7.5 (Northampton, MA).
118
2.4 Capillary electrophoresis with LIF detection
A commercial Beckman Coulter P/ACE MDQ with 32 Karat software (version 5.0) equipped
with an LIF detector was used for experiments with UV excitation. The UV lines of a Coherent
Innova 622 Ar+ laser were isolated spatially with a prism and spectrally with a 355±20 nm
Semrock bandpass filter (Rochester, NY). A UV-grade plano convex lens (f = 25.0 mm) from
Newport (Sanford, CT) focused the laser light onto an Ocean Optics high-OH (ZFQ 4229)
optical fiber (Dunedin, FL), which guided the light to the laser input module of the instrument.
The laser power at the detection point was 0.6 mW. The detection block contained a 450±40 nm
emission filter and a neutral density filter (Andover, Salem, NH). The capillary was 60.0 cm total
length and 50.0-cm length to the detector. Each new capillary was rinsed before use with 1.0 M
NaOH, ultrapure water, and then with the separation buffer. For the CE-LIF experiments the
separation buffer was either 25.0 mM or 50.0 mM borate buffer at pH 9.50. Sample solutions
were injected for 5.0 s at 0.5 psi, and separation was performed at a field strength of 417 V/cm.
For experiments with LIF detection and visible excitation, a CE instrument constructed in
house was used. A Spellman CZE1000R high-voltage power supply was used to apply the
electrophoretic potential. The capillaries were 60.0 cm total length and 45.0 cm to the detection
window. The samples were injected electrokinetically for 5.0 s, and all electrokinetic injections
and separations were made at 25.0 kV (385 V/cm). An air-cooled Ar+ laser (43 Series Ion Laser;
Melles Griot; Carlsbad, CA) was used for excitation at 457.9 nm or 488 nm. The laser beam was
focused onto the fused-silica capillary by a CaF2 plano convex lens (f = 20.0 mm) (Thorlabs;
Newton, NJ). The laser power at the capillary was adjusted to 4 mW. The emitted fluorescence
was collected at 90˚ relative to the excitation beam by a microscope objective (0.5 NA; Melles
Griot, Irvine, CA) and was filtered by a 500 nm long-pass filter (Melles Griot). The light was

119
then spatially filtered using an 800 µm diameter aperture (Oriel; Stratford, CT) and detected by a
photomultiplier tube (PMT) (HC120-01, Hamamatsu; Bridgewater, NJ) at a potential of 1000 V.
The PMT output was filtered by a low-pass RC filter at 50 Hz, and the data were collected at 20
Hz by the data acquisition board (PCI-6229, National Instruments; Austin, TX). A LabVIEW
(Version 7.1, National Instruments) program written in house was used for data acquisition. The
data were analyzed using OriginLab 7.5.
2.5 Spectrophotometry
Absorbance spectra (200-600 nm) of 10.0 µM solutions of FA in 25.0 mM borate buffer at pH
9.50 were obtained with a Cary 50 UV-Vis spectrophotometer (Varian; Palo Alto, CA) using a 1-
cm quartz cuvette. Absorbance spectra were collected at room temperature with slit widths of 2
nm at the interval of 0.5 nm, and the blank was subtracted from each spectrum.
3 Results and discussion
3.1 Capillary electrophoresis with UV absorbance detection
The goal for this work was to develop a simple method for quantitative analysis of FA using CE
with laser-induced fluorescence detection. Capillary electrophoresis with UV absorbance
detection was studied first. Experiments with CE-UV serve as a benchmark to compare CE-LIF
methods to, and CE-UV was used to study the reaction of FA with fluorogenic derivatization
reagents. Absorbance detection for CE analysis of FA has been reported in the literature, but
reported detection limits are surprisingly inconsistent, ranging from 0.03 µM to 7 µM [15-21].
First, the S/N for injections of 18.0 µM FA was compared at several wavelengths (190, 210, 255,
275, 280, and 285 nm) to determine the optimum detection wavelength. The absorbance
spectrum of FA is presented in the Supporting information (Figure S1). Absorbance detection at
280 nm gave the best S/N and was used for determination of a detection limit and linear dynamic

120
range. This wavelength will also be more selective for FA compared to detection at 190 or 210
nm, which provided S/N values similar to that obtained at 280 nm. The linear dynamic range for
FA detection was 17.0 µM to 2.30 mM, and the detection limit was 6 µM (S/N=3, RMS noise).
Figure 2 shows an electropherogram for 100 µM FA detected by absorbance at 190 nm using a
commercial CE instrument with a diode array detector. The peak at 6.8 min is FA, and the peak
at 3.3 min is the neutral marker (mesityl oxide, NM), which was injected with FA. Absorbance
detection at 190 nm was used for experiments presented in the Sections 3.2 and 3.3 because more
compounds will absorb at this wavelength and part of the objective of these studies was to detect
impurities, reagents, and nonfluorescent reaction products during studies of derivatization of FA.
Figure 2. Electropherogram of 100 µM FA
with UV absorbance detection at 190 nm. Folic
acid was injected for 5.0 s at 0.5 psi, and the
separation was performed in 25.0 mM borate
buffer at pH 9.50 at 417 V/cm. The current
was 11.5 µA. The first peak at 3.3 min is the
neutral marker (mesityl oxide, NM), and the
peak at 6.8 min is FA.
The 6 µM detection limit reported here is similar to the values reported in the literature for
CE with UV absorbance detection at 214 nm (5 µM [16] and 7 µM [17]) using slightly larger
capillaries (75 µm inner diameter) and no sample preconcentration. There are several reports of
significantly lower detection limits for FA with CE-UV (0.03 µM at 210 nm [18], 0.2 µM at 265
nm [21], 0.5 µM at 210 nm [19], 0.6 µM at 200 nm [15], and 0.8 µM at 305 nm [20]). The 0.03
µM LOD reported by Du et al. [18] was achieved with deliberate sample stacking, and the value

121
of 0.5 µM reported by Huang and Sheu may have resulted from sample stacking [19]. The
sample buffer used by Huang and Sheu contained ≥70% methanol, and the pH of the aqueous
portion was not stated. The running buffer was 30% acetonitrile and 70% aqueous (pH 9.56).
Their manuscript compares the LOD to other reports in the literature but does not indicate a
reason for the low LOD obtained [19]. It is not obvious how such a low LOD was obtained by
Gomis et al. [21] or by Uysal et al. [15]. Visual inspection of an electropherogram in the
manuscript by Uysal et al. (Figure 2) [15] suggests a S/N for an injection of 48 µM FA that is
inconsistent with the reported LOD. The method reported by Flores et al. includes a solid-phase
extraction step prior to CE-UV analysis, and presumably preconcentration of FA by solid-phase
extraction prior to CE-UV resulted in the significantly lower LOD (0.8 µM) [20].
3.2 Capillary electrophoresis with native fluorescence detection
There are conflicting reports in the literature about the fluorescence of FA with UV excitation.
Some publications state that FA is nonfluorescent [35], while other reports indicate that FA
exhibits weak fluorescence [22-25]. Even if weak native fluorescence of FA only provided
detection limits and a linear range similar to that provided by CE-UV, CE-LIF would produce
superior selectivity for FA analysis in food and beverage samples. Based on the reports that FA
does exhibit significant native fluorescence, we attempted to analyze FA with a commercial CE
instrument using LIF detection. The UV lines (351-364 nm) of an argon ion laser were used for
excitation, and emission was isolated with a 450±40 nm bandpass filter. Figure 3 shows a CE-
LIF electropherogram for an injection of 100 µM FA. The peak at 3.1 min corresponds to the
neutral marker (coumarin 460, NM), and the other peaks at longer migration times are from the
FA sample. The presence of multiple fluorescence peaks in the electropherogram of the FA
sample raises questions about the purity of the sample and the identity of these peaks. The

122
electropherogram with UV absorbance detection at 190 nm (Figure 2) has only one major peak
and only very small minor peaks. This is consistent with the label from the supplier, which
indicates that it is 98% FA. The electrophoretic separations shown in Figures 2 and 3 were
carried out in the same buffers with the same FA sample although different CE instruments and
detectors were used. The electrophoretic mobility of the peak at 6.8 min in Figure 2 (-3.54 × 10-
4cm
2V
-1s
-1) does not match the electrophoretic mobility of any of the major fluorescence peaks in
the electropherogram shown in Figure 3. This indicates that the fluorescence in the sample is not
due to FA and that FA is nonfluorescent or perhaps very weakly fluorescent. The result reported
here is in agreement with the publications stating that FA is nonfluorescent [35], and FA cannot
be analyzed by CE-LIF using native FA fluorescence. Without separating the commercial FA
sample components with CE-LIF and without analysis of the same sample with CE-UV, it would
not be possible to determine if the observed fluorescence were due to FA or highly fluorescent
impurities present at low concentrations.
Figure 3. Electropherogram of 100 µM FA
with LIF detection and excitation using UV
lines (351-364 nm lines) from an Ar+ laser
filtered by a 355±20 nm bandpass filter and
emission with a 450±40 nm bandpass filter.
The separation and detection conditions were
identical to those in Figure 2. The peak at 3.2
min is the neutral marker (coumarin 460, NM),
and the other peaks at longer migration times
(labeled with *) are due to compounds in the
FA sample.
3.3 Derivatization of FA for CE with LIF detection: amine reactive reagents
Laser-induced fluorescence provides low detection limits for CE because the short optical
pathlength can be overcome by using an intense laser source and efficient rejection of light from

123
the source. In addition, LIF detection is more selective compared to UV absorbance, since few
molecules are natively fluorescent; however, analytes must be fluorescent in order to take
advantage of this detection technique. The experiments presented in the previous section
demonstrate that FA is nonfluorescent, so derivatization of FA to produce a fluorescent product
was investigated. Folic acid has both primary and secondary amine groups (Figure 1), and there
are literature reports that FA can be derivatized with the amine-reactive fluorogenic reagent,
fluorescamine as well as with fluorescein isothiocyanate (FITC) [24-26]. At least one literature
report, however, indicates that FA will not react with o-phthaldialdehyde [36].
Fluorescamine reacts rapidly with molecules containing primary and secondary amines to
produce highly fluorescent products, and Blanco et al. reported that fluorescamine reacted best
with FA at pH’s between 3.50 and 5.00 to produce fluorescent products that were used to
quantify FA [24, 25]. We attempted derivatization of FA with fluorescamine using both acidic
(pH 4.20) [25] and basic (pH 9.50) [27] conditions. For derivatization under acidic conditions,
the method was designed to minimize the effects of a mismatch (ionic strength, pH) between the
reaction buffer and separation buffer in order to obtain good CE separations. Folic acid is more
soluble and stable in basic solution [11]; hence, a stock solution (2.50 mM) of FA was prepared
in 10.0 mM borate buffer (pH 9.50). This FA solution was diluted in 25.0 mM acetate buffer at
pH 4.20, and fluorescamine in acetone (18.2 mM) was added last to the reaction mixture. The
final concentrations of FA and fluroescamine were 300 µM and 6.00 mM, respectively. A 500
µL aliquot of the reaction mixture was diluted 3× with 50.0 mM borate buffer at pH 9.50.
Aliquots were taken at <1, 20, 45, and 200 min, and were injected into the CE system
immediately after dilution. The separation buffer was 50.0 mM borate at pH 9.50. The
experiments along with controls (no FA, no fluorescamine, no FA with glutamic acid, or no FA

124
with phenylalanine) were performed with both LIF using UV excitation (351-364 nm lines) and
UV absorbance detection.
Electropherograms for CE-LIF and CE-UV absorbance experiments at 200 min are shown in
the Supporting information (Figure S2). The CE-LIF experiments showed one major product
peak, and its peak height did not change over time (~1-200 min); however, UV absorbance
detection showed no product peak and no change in the peak for FA. For both CE-LIF and CE-
UV experiments, formation of reaction product or products of decomposition/hydrolysis of
fluorescamine was confirmed by qualitative and quantitative (peak area) comparisons of the
electropherograms of the reaction mixture to those of control experiments (no FA or no
fluorescamine). Both CE-LIF and CE-UV electropherograms using glutamic acid or
phenylalanine (positive controls) instead of FA showed a large product peak. Control
experiments with CE-UV using phenylalanine instead of FA showed a substantial decrease in the
phenylalanine peak, indicating that the reagent reacted with other amine-containing compounds
for these conditions.
The reaction with fluorescamine was also studied at basic pH (9.50) [27] where FA is more
stable. A reaction mixture of 100 µM FA and 0.500 mM fluorescamine was prepared in 25.0 mM
borate buffer at pH 9.50. Fluorescamine (3.60 mM) in acetone was added last to avoid hydrolysis
or decomposition before the reaction. The reaction was monitored for 4 hr by injecting directly
from the reaction mixture every 20 min. The separation buffer was 25.0 mM borate buffer at pH
9.50. Two product peaks (P) were observed for CE-LIF (4.0 min and 5.5 min in Figure S3,
Supporting information), and height of one of the product peaks (4.0 min in Figure S3,
Supporting information) increased continuously from 20-60 min. One of the fluorescent peaks
from underivatized FA (4.4 min in Figure S3, Supporting information; 4.7 min in Figure 3)

125
decreased slowly over time and completely disappeared by 4 hr. Analysis of the same samples by
CE-UV did not indicate formation of any product peaks or decrease in the FA peak. Control
experiments with FA only or fluorescamine only using both CE-LIF and CE-UV confirmed that
the changes in the CE-LIF electropherogram were not due to decomposition or hydrolysis of the
reactants. Positive control experiments using glutamic acid or phenylalanine instead of FA
produced large product peaks for both CE-LIF and CE-UV as expected, and analysis by CE-UV
showed a substantial decrease in the phenylalanine peak. The results for these experiments at pH
4.2 and 9.5 indicate that impurities in the FA sample are derivatized by fluorescamine to produce
fluorescent products, but FA does not react. Although this resulted in some increase in the total
fluorescence measured due to the derivatization of sample contaminants, this does not support
the conclusions of Blanco et al. [24, 25].
We also attempted to derivatize FA with 4-fluoro-7-nitro-2,1,3-benzoxadiazole (NBD-F).
This fluorogenic reagent reacts with primary and secondary amines [28]. The reaction mixture
contained 100 µM FA and 0.500 mM NBD-F in 25.0 mM borate buffer at pH 9.50. The reaction
mixture was allowed to react for 20 min and was then injected for CE analysis (data not shown).
The separation was performed in 25.0 mM borate buffer at pH 9.50 at a field strength of 385
V/cm. No product peak or decrease in FA peak was observed using CE-LIF (excitation at 457
nm or 488 nm) and CE-UV (210 nm). A positive control experiment using glutamic acid instead
of FA showed a large product peak for CE with both LIF and UV absorbance detection,
indicating that the reagent was reactive with other amine containing compounds. In summary,
there was no indication of a reaction between FA and NBD-F.
Naphthalene-2,3-dicarboxaldehyde (NDA) reacts with primary amines in presence of cyanide
to yield highly fluorescent 1-cyano-2-substituted-benz[f]isoindole (CBI) derivatives [37].

126
Derivatization of FA with NDA was attempted using standard reaction conditions (100 µM FA,
0.500 mM NDA and 0.500 mM NaCN in 25.0 mM borate buffer at pH 9.50). After being
allowed to react for 15 min, the mixtures were analyzed directly by CE performed in 25.0 mM
borate buffer (pH 9.50) at a field strength of 385 V/cm. For CE-LIF, excitation was carried out at
both 457 nm and 488 nm. Analysis by CE-LIF (Figure S4, Supporting information) and CE-UV
gave no indication that NDA reacted with FA to produce a fluorescent product, but positive
control experiments with glutamic acid instead of FA produced large product peaks as expected.
The reaction of FA with NDA and mercaptoethanol was also studied since the
NDA/mercaptoethanol reaction with amine-containing compounds is known to be faster than the
reaction with NDA/NaCN [37]. The reaction was carried out in 25.0 mM borate buffer (pH 9.50)
with 1.00 mM FA, 7.50 mM mercaptoethanol and 1.00 mM NDA. Separation and detection were
carried out using the same conditions employed for NDA/NaCN derivatization. Analysis by CE-
LIF and CE-UV gave no indication of derivatization of FA, but a positive control experiment
using glutamic acid resulted in a product peak for both CE-LIF and CE-UV.
Folic acid did not react with any of the derivatization reagents tested here despite literature
reports of successful derivatization of FA with FITC and fluorescamine [24-26] and positive
control reactions with glutamic acid and phenylalanine, which demonstrated that the reagents
reacted with other amine-containing molecules. In the FA molecule (Figure 1) the primary amine
group is directly connected to a highly conjugated ring system. One explanation for the
apparently low reactivity of this amine group is that the lone pair on the nitrogen atom is highly
delocalized and not readily available for reaction. The secondary amine group in FA is directly
connected to an aromatic ring and is sterically shielded by bulky groups from both sides. Hence,
it is expected to be less reactive than a typical secondary amine group. The amide groups are

127
expected to be less reactive than amine groups. Overall, the experimental results showing no
reactivity with several common and highly reactive fluorogenic amine-reactive reagents are
consistent with the structure of FA.
A CE method for FA analysis with chemiluminescence (CL) detection (enhancement of
luminol chemiluminescence) was reported to produce a detection limit of 20 nM [38].
Chemiluminescence detection can provide low detection limits and excellent detection selectivity
for CE, but its application is often limited to specialists due to the need for construction of a CL
reaction chamber after the CE separation capillary [38-40]. Recently Zhao et al. reported a CE-
LIF method for derivatization of FA with a detection limit of 1.5 nM after derivatization with
FITC [26]. Fluorescein isothiocyanate is a fluorescent (as opposed to fluorogenic) reagent that
has been widely used with CE although the reaction is relatively slow (2 hr at elevated
temperature in Zhao et al.). It is not obvious why FA would react with FITC, but did not react
with the fluorogenic reagents tested here, which typically react much more rapidly with amine-
containing analytes compared to FITC. It also is not clear if the 1.5 nM detection limit was
obtained for derivatization of FA at this concentration or for dilution of an FA sample
derivatized at a higher concentration.
3.4 Oxidation of FA for CE-LIF analysis
There are a number of reports that FA can undergo oxidative cleavage to produce highly
fluorescent products [33, 41, 42]. Some of these reports suggest that the main fluorescent product
is 6-carboxypterin [33, 42]. A number of oxidants have been used, including calcium
hypochlorite [35], sodium hypochlorite [31], hydrogen peroxide/copper(II) chloride [33],
potassium peroxodisulphate [32], and peroxynitrite [41]. While these oxidation methods have
mainly been used for postcolumn derivatization with HPLC [31, 32, 35, 36], 6-carboxypterin is a

128
reasonably stable molecule. These oxidative derivatization methods may be suitable for
development of precolumn derivatization before CE-LIF if FA reacts quantitatively to form one
highly fluorescent and stable species. Figure 4 shows electropherograms for CE-LIF analysis of
the oxidation product of FA by two common oxidants, sodium hypochlorite and hydrogen
peroxide/copper(II) chloride. The detection conditions were the same as those used for studies of
FA derivatization by fluorescamine. Figure 4A presents an electropherogram for the oxidation of
100 µM FA with 100 µM sodium hypochlorite (bleach) after a 60 min reaction time. The peak at
3.0 min in the electropherogram is due to the neutral marker, coumarin 460 (NM). The peaks at
4.5 min, 6.1 min, and 7.2 min (labeled *,I) also appear in electropherogram for CE-LIF of FA
samples without derivatization (Figure 3), but they increased after oxidation. The small peak at
7.2 min co-migrates with 6-carboxypterin. The electropherogram in Figure 4B is for the reaction
of 90.0 µM FA with 18.0 mM hydrogen peroxide in the presence of 180 µM copper(II) chloride.
The reaction mixture was prepared in 10.0 mM phosphate buffer at pH 7.60, and diluted 3× with
50.0 mM borate buffer at pH 9.50 after 90 min for CE analysis. The separation was performed in
50.0 mM borate buffer at pH 9.50. The large peak at 10.0 min co-migrates with 6-carboxypterin.
These experiments show that the oxidation of FA by hydrogen peroxide in the presence of
copper(II) chloride produces 6-carboxypterin as a major product, but oxidation with bleach
produces 6-carboxypterin as minor product. Although, large fluorescent product peaks were
observed in CE-LIF experiments, no more than 50% reduction in the FA peak was observed by
CE-UV experiments. Complete reaction of FA to form one highly fluorescent product is
desirable for developing a quantitative method for FA acid using pre-column oxidation and CE-
LIF. More work is needed to determine if an effective CE-LIF method for FA can be developed
using this approach.
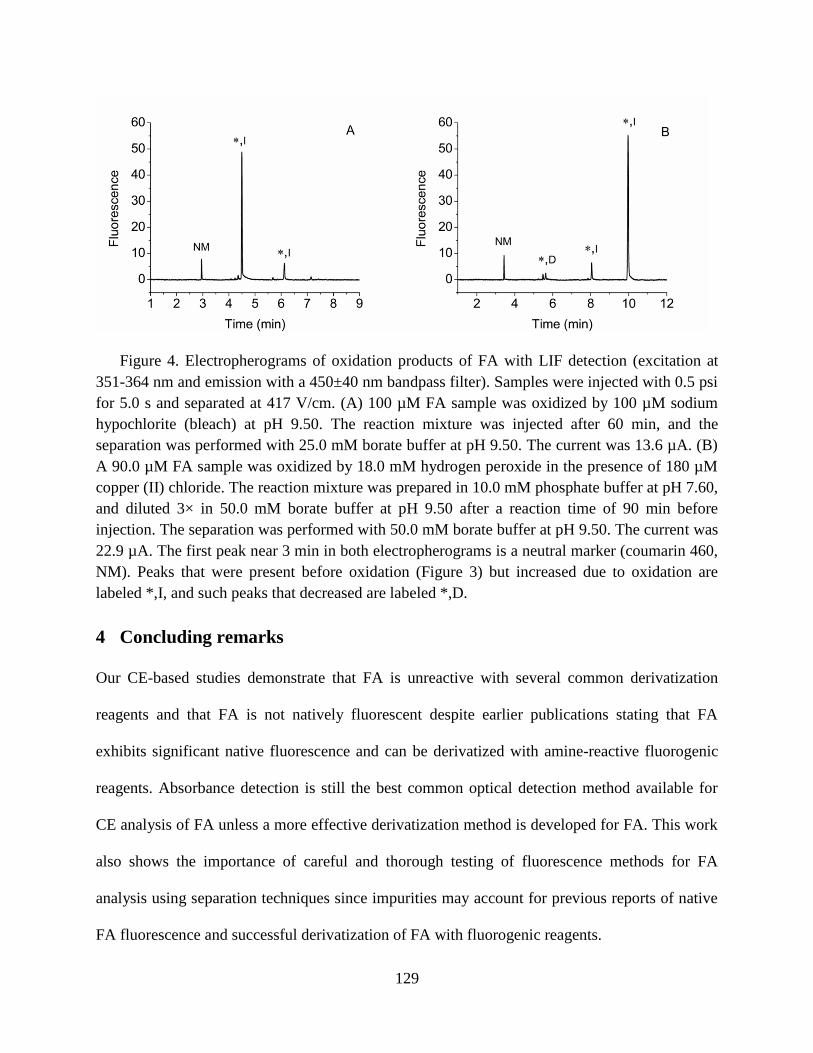
129
Figure 4. Electropherograms of oxidation products of FA with LIF detection (excitation at
351-364 nm and emission with a 450±40 nm bandpass filter). Samples were injected with 0.5 psi
for 5.0 s and separated at 417 V/cm. (A) 100 µM FA sample was oxidized by 100 µM sodium
hypochlorite (bleach) at pH 9.50. The reaction mixture was injected after 60 min, and the
separation was performed with 25.0 mM borate buffer at pH 9.50. The current was 13.6 µA. (B)
A 90.0 µM FA sample was oxidized by 18.0 mM hydrogen peroxide in the presence of 180 µM
copper (II) chloride. The reaction mixture was prepared in 10.0 mM phosphate buffer at pH 7.60,
and diluted 3× in 50.0 mM borate buffer at pH 9.50 after a reaction time of 90 min before
injection. The separation was performed with 50.0 mM borate buffer at pH 9.50. The current was
22.9 µA. The first peak near 3 min in both electropherograms is a neutral marker (coumarin 460,
NM). Peaks that were present before oxidation (Figure 3) but increased due to oxidation are
labeled *,I, and such peaks that decreased are labeled *,D.
4 Concluding remarks
Our CE-based studies demonstrate that FA is unreactive with several common derivatization
reagents and that FA is not natively fluorescent despite earlier publications stating that FA
exhibits significant native fluorescence and can be derivatized with amine-reactive fluorogenic
reagents. Absorbance detection is still the best common optical detection method available for
CE analysis of FA unless a more effective derivatization method is developed for FA. This work
also shows the importance of careful and thorough testing of fluorescence methods for FA
analysis using separation techniques since impurities may account for previous reports of native
FA fluorescence and successful derivatization of FA with fluorogenic reagents.

130
The authors would like to acknowledge Funda Kizilkaya, Sherrisse Bryant, Ryan Picou, and
Rachel Henken for their contributions to this work. The authors would like to acknowledge Dr.
Evgueni Nesterov for helpful discussions regarding this work. Ashley Phipps was supported by a
grant to the LSU College of Basic Sciences from the HHMI Biomedical Education Program.
The authors have declared no conflict of interest

131
Supporting information
Figure S1. Absorbance spectrum of FA. The spectrum of a 10.0 µM solution of FA in 25.0 mM
borate buffer at pH 9.50 was obtained using a 1-cm quartz cuvette. A slow scan speed and 2.0
nm slit width were used for data collection.

132
Figure S2. Electropherograms of the folic acid-fluorescamine reaction mixture (acidic reaction,
pH 4.20) at 200 min after the start of the reaction. The concentrations of FA and fluorescamine
in the reaction mixture were 300 µM and 6.00 mM, respectively. A 500 µL aliquot of the
reaction mixture was diluted 3× with 50.0 mM borate buffer at pH 9.50 just prior to CE analysis.
Separation was performed in 50.0 mM borate buffer (pH 9.50) at 417 V/cm. The current was
22.9 µA. (A) Electropherogram with UV absorbance detection (190 nm). (B) Electropherogram
with LIF detection (excitation at 351-364 nm and emission collected with a 450±40 nm bandpass
filter). Peaks from the neutral marker, FA, fluorescamine, and hydrolysis products of
fluorescamine are labeled as NM, FA, FL, and FL-H, respectively. Major peaks in Figure S2B
also present in CE-LIF electropherograms with underivatized FA samples (as in Figure 3) are
labeled with *, and the peak from the reaction product is labeled P.

133
Figure S3. Electropherograms of the folic acid-fluorescamine reaction mixture (basic reaction,
pH 9.50) at 90 min after the start of the reaction. The reaction mixture contained 100 µM FA and
0.500 mM fluorescamine in 25.0 mM borate buffer at pH 9.50 and was injected for 5.0 s at 0.5
psi. Separation was performed using 25.0 mM borate buffer (pH 9.50) at 417 V/cm. The current
was 11.9 µA. (A) Electropherogram with UV absorbance detection (190 nm). (B)
Electropherogram with LIF detection (excitation at 351-364 nm and emission with a 450±40 nm
bandpass filter). Peaks from the neutral marker, FA, fluorescamine, and the reaction product, are
labeled as NM, FA, FL, and P respectively. Major peaks in Figure S3B also present in CE-LIF
electropherograms with underivatized FA samples are labeled with * (as in Figure 3 and Figure
S2). Such peaks that increased in intensity after derivatization are labeled *,I and one that
decreased in intensity is labeled *,D.

134
Figure S4. (A) Electropherogram of a negative control sample for the derivatization of FA with
NDA/NaCN. A mixture of 0.500 mM NDA and 0.500 mM NaCN in 25.0 mM borate buffer (pH
9.50) was injected after a 15 min reaction time. (B) Electropherogram of a reaction mixture of
100 µM FA, 0.500 mM NDA, and 0.500 mM NaCN in 25.0 mM borate buffer (pH 9.50). The
sample was injected after a 15 min reaction time. In both experiments electrokinetic injection
was used (5.0 s at 25.0 kV, 385 V/cm), and the separation was performed in 25.0 mM borate
buffer at pH 9.50 at 385 V/cm. The current was 13.5 µA. For these electropherograms, LIF
detection was performed with excitation at 457 nm and emission collected after filtering through
500 nm long pass filter.

135
5 References
1. Wills, L., Treatment of "pernicious anaemia of pregnancy" and "tropical anaemia" -
With special reference to yeast extract as a curative agent. Brit. Med. J., 1931. 1: p.
1059-1064.
2. Angier, R.B., et al., The structure and synthesis of the liver L-casei factor. Science, 1946.
103(2683): p. 667-669.
3. Iyer, R. and S.K. Tomar, Folate: A Functional Food Constituent. J. Food Sci., 2009.
74(9): p. R114-R122.
4. Stengl, S., Vitamin analysis of beverages - how many vitamins does fruit juice really
contain? Fruit Process., 2009. 19(4): p. 178-180, 182.
5. Otles, S. Vitamin analysis in fortified foods and supplements. 2008. Woodhead
Publishing Ltd.
6. Chowdhury, S.A., P.J. Marriott, and D.M. Small, Food folates: analysis, stability and
fortification issues. Chem. Aust., 2003. 70(10): p. 13-15.
7. Smith, A.D., Y.I. Kim, and H. Refsum, Is folic acid good for everyone? Am. J. Clin.
Nutr., 2008. 87(3): p. 517-533.
8. Nelson, B.C., The expanding role of mass spectrometry in folate research. Curr. Anal.
Chem., 2007. 3(3): p. 219-231.
9. Cheung, R.H.F., P.J. Marriott, and D.M. Small, CE methods applied to the analysis of
micronutrients in foods. Electrophoresis, 2007. 28(19): p. 3390-3413.
10. Quinlivan, E.P., A.D. Hanson, and J.F. Gregory, The analysis of folate and its metabolic
precursors in biological samples. Anal. Biochem., 2006. 348(2): p. 163-184.
11. Arcot, J. and A. Shrestha, Folate: methods of analysis. Trends Food Sci. Technol., 2005.
16: p. 253-266.
12. Landers, J.P., Capillary and microchip electrophoresis and associated microtechniques.
Third ed. 2008, New York: CRC Press. 3-74.
13. Gilman, S.D. and M.J. Sepaniak, Capillary electrophoresis techniques in biomedical
analysis. Biomed. Photonics Handb., 2003: p. 24/1-24/27.
14. Frazier, R.A., J.M. Ames, and H.E. Nursten, The development and application of
capillary electrophoresis methods for food analysis. Electrophoresis, 1999. 20(15-16): p.
3156-3180.

136
15. Uysal, U.D., E.M. Oncu-Kaya, and M. Tuncel, Determination of Folic Acid by CE in
Various Cultivated Variety of Lentils. Chromatographia, 2010. 71(7-8): p. 653-658.
16. Cheung, R.H.F., et al., Investigation of folic acid stability in fortified instant noodles by
use of capillary electrophoresis and reversed-phase high performance liquid
chromatography. J. Chromatogr. A, 2008. 1213(1): p. 93-99.
17. Aurora-Prado, M.S., et al., Determination of folic acid in tablets by microemulsion
electrokinetic chromatography. J. Chromatogr. A, 2004. 1051: p. 291-296.
18. Du, Y.Y., et al., Comparison of on-line concentration methods in capillary zone
electrophoresis for analysis of water-soluble vitamins. Anal. Lett., 2007. 40(10): p. 2005-
2015.
19. Huang, W.Y. and S.J. Sheu, Separation and identification of the organic acids in
Angelicae Radix and Ligustici Rhizoma by HPLC and CE. J. Sep. Sci., 2006. 29(17): p.
2616-2624.
20. Flores, J.R., et al., Capillary electrophoretic determination of methotrexate, leucovorin
and folic acid in human urine. J. Chromatogr. B, 2005. 819(1): p. 141-147.
21. Gomis, D.B., L.L. Gonzalez, and D.G. Alvarez, Micellar electrokinetic capillary
chromatography analysis of water-soluble vitamins. Anal. Chim. Acta, 1999. 396(1): p.
55-60.
22. Tyagi, A. and A. Penzkofer, Fluorescence spectroscopic behaviour of folic acid. Chemi.
Phys., 2010. 367(2-3): p. 83-92.
23. Thomas, A.H., et al., Fluorescence of pterin, 6-formylpterin, 6-carboxypterin and folic
acid in aqueous solution: pH effects. Photochem. Photobiol. Sci., 2002. 1(6): p. 421-426.
24. Blanco, C.C., et al., Micellar-ehnanced synchronous-derivative fluorescence
determination of derivatization of derivatized folic-acid in pharmaceutical preparations.
J. Pharm. Biomed. Anal., 1995. 13(8): p. 1019-1025.
25. Blanco, C.C., et al., Fluorometric-determination of folic-acid based on its reaction with
the fluorogenic reagent fluorescamine. Anal. Lett., 1994. 27(7): p. 1339-1353.
26. Zhao, D., M. Lu, and Z. Cai, Separation and determination of B vitamins and essential
amino acids in health drinks by CE-LIF with simultaneous derivatization.
Electrophoresis, 2012. 33(15): p. 2424-2432.
27. De Bernardo, S., et al., Studies on reaction of fluorescamine with primary amines. Arch.
Biochem. Biophys., 1974. 163(1): p. 390-399.

137
28. Aoyama, C., et al., A fully automated amino acid analyzer using NBD-F as a fluorescent
derivatization reagent. Biomed. Chromatogr., 2004. 18(9): p. 630-636.
29. Gilman, S.D. and A.G. Ewing, Post column derivatization for capillary electrophoresis
using Naphthalene-2,3-dicarboxaldehyde and 2-mercaptoethanol. Anal. Method.
Instrum., 1995. 2(3): p. 133-141.
30. Gilman, S.D. and A.G. Ewing, Analysis of single cells by capillary electrophoresis with
on column derivatization and laser-induced flurescence detection. Anal. Chem., 1995.
67(1): p. 58-64.
31. Holt, D.L., R.L. Wehling, and M.G. Zeece, Determination of native folates in milk and
other dairy-products by high-performance liquid-chromatography. J. Chromatogr., 1988.
449(1): p. 271-279.
32. Hahn, A., et al., Optimized high-performance liquid-chromatographic procedure for the
separation and quantification of the main folacins and some derivatives. J. Chromatogr.,
1991. 540(1-2): p. 207-215.
33. Hirakawa, K., Fluorometry of hydrogen peroxide using oxidative decomposition of folic
acid. Anal. Bioanal. Chem., 2006. 386(2): p. 244-248.
34. Whisnant, A.R. and S.D. Gilman, Studies of reversible inhibition, irreversible inhibition,
and activation of alkaline phosphatase by capillary electrophoresis. Anal. Biochem.,
2002. 307(2): p. 226-234.
35. Gregory, J.F., D.B. Sartain, and B.P.F. Day, Fluorometric-determination of folacin in
biological-materials using high-performance liquid-chromatography. J. Nutr., 1984.
114(2): p. 341-353.
36. Day, B.P. and J.F. Gregory, Determination of folacin derivatives in selected foods by
high-performance liquid-chromatography. J. Agr. Food. Chem., 1981. 29(2): p. 374-377.
37. Rammouz, G., et al., The use of naphthalene-2,3-dicarboxaldehyde for the analysis of
primary amines using high-performance liquid chromatography and capillary
electrophoresis. Biomed. Chromatogr., 2007. 21(12): p. 1223-1239.
38. Zhao, S.L., et al., Determination of folic acid by capillary electrophoresis with
chemiluminescence detection. J. Chromatogr. A, 2006. 1107(1-2): p. 290-293.
39. Lara, F.J., A.M. Garcia-Campana, and A.I. Velasco, Advances and analytical
applications in chemiluminescence coupled to capillary electrophoresis. Electrophoresis,
2010. 31(12): p. 1998-2027.
40. Gilman, S.D., C.E. Silverman, and A.G. Ewing, Electrogenerated chemiluminescence
detection for capillary electrophoresis. J. Microcolumn Sep., 1994. 6(2): p. 97-106.

138
41. Huang, J.C., et al., A novel fluorescent method for determination of peroxynitrite using
folic acid as a probe. Talanta, 2007. 72(4): p. 1283-1287.
42. Hirakawa, K., et al., Sequence-specific DNA damage induced by ultraviolet A-irradiated
folic acid via its photolysis product. Arch. Biochem. Biophys., 2003. 410(2): p. 261-268.

139
APPENDIX B. FLUORESCENCE OF FOLIC ACID SAMPLES STUDIED
BY CAPILLARY ELECTROPHORESIS
Suresh C. Regmi, Santhosh Challa, Isiah M. Warner, and S. Douglass Gilman*
Department of Chemistry, Louisiana State University, Baton Rouge, LA 70803, USA
Short Title: Fluorescence of Folic Acid Samples by CE
Address of corresponding author: S. Douglass Gilman, 232 Choppin Hall , Chemistry
Department, Louisiana State University, Baton Rouge, LA 70803; Phone: +1 (225) 578-3010;
Fax: +1 (225) 578-3458; [email protected];

140
ABSTRACT
Native fluorescence of folic acid (FA) was studied using capillary electrophoresis (CE)
and fluorescence spectroscopy. Three different samples of FA from commercial sources were
analyzed using CE with both laser-induced fluorescence (LIF) detection and UV absorbance
detection, and the electrophoretic mobilities of the major peaks observed with each detection
method were compared. The study showed that the fluorescence of commercial FA samples is
mainly due to the presence of small amounts of highly fluorescent impurities rather than FA
itself. Excitation-emission matrices and UV absorbance spectra were obtained for all three
commercial samples and compared. These spectra show subtle differences for the different
sample types. These differences are consistent with the fluorescence being mainly due to highly
fluorescent, structurally similar impurities in the FA samples; however, without direct
comparison of the different samples using the same fluorometer, these spectra also could be
interpreted as being identical and due to FA itself. Capillary electrophoresis with LIF detection
effectively separated these impurities from FA, and enabled us to determine that FA is
nonfluorescent. Studies of FA fluorescence using commercial samples without purification may
be based on observation of fluorescent impurities.

141
INTRODUCTION
Folic acid (FA) was discovered in 1931 by Lucy Wills [1] as a component of yeast
capable of curing “pernicious anemia of pregnancy”; hence, it is also called “Wills factor”. Its
structure (Figure 1) was elucidated 15 years later [2]. Folic acid is also known as pteroylglutamic
acid, but the trivial names “folic acid” and “folate” are more commonly used. The generic term
“folate” represents all the derivatives of FA including naturally occurring polyglutamates and
”folic acid” represents the most oxidized and easily absorbable synthetic member of the folate
family which is commonly used for the food fortification and nutritional supplements [3]. Folic
acid has higher stability and bioavailibility than other folates but it has to be reduced into other
folate forms, mainly tetrahydrofolate (THF) to enter into human metabolic process [3, 4]. Folates
and FA are involved in two important cycles in mammalian and plant cells namely the “DNA
biosynthesis cycle” and the “methylation cycle” in “carbon one” transfer reaction [5]. Research
over the past decade has shown that a low or inadequate FA concentration may contribute to
congenital malformations and development of chronic disorders such as neural tube defects,
megaloblatic anemia, and elevated levels of homocysteine in human [3, 6, 7].
Figure 1. Folic acid.
Because of the increasing significance of FA in health and diseases a concern about its
accurate analysis is raising [3, 6]. Folic acid is present only in trace amounts in many fortified
foods and biological samples embedded in complex matrices [4]. Hence, highly selective
142
techniques with low limits of detection are required for its detection and quantification.
Optimization of existing techniques and development of new analytical tools are being a major
focus of recent research on FA and the modern spectroscopic techniques are major targets [4, 8,
9]. Among the spectroscopic techniques spectrophotometry is a well-established technique for
FA detection but the trace amount of FA present in the real samples is not always detectable
because of its poor detection limit. Spectrofluorometry is an alternative detection technique
which offers improved selectivity and detection limits for fluorescent analytes [10, 11]. High
selectivity, lower detection limit, and compatibility of fluorometric techniques to almost all
analytical tools have encouraged their widespread use in the analysis of varieties of compounds.
Concentration detection limits of the order of 10-12
M can be obtained with LIF detection of
fluorescently labeled analytes [10, 11]. Among all analytical tools and techniques CE has
become one of the most powerful separation and analytical technique because of its high
separation efficiency, high resolving power, short analysis time, low sample consumption, and
simplicity [11]. Again, CE has proven useful in the analysis of many food components including
FA [12, 13]. The UV absorbance as well as LIF detection is well suited with CE analysis [10,
11].
Capillary electrophoresis is considered as a good analytical technique for the
determination of impurities in synthetic drugs [14-16], it has been used for the analysis and
detection of impurities in different type of pharmaceuticals such as cardiovascular drugs and
anticancer drugs [15]. Capillary electrophoresis has been proved superior over HPLC and TLC
for determining impurities in synthetic drugs because of its higher separation efficiency [17].
Considering these facts CE could be a good analytical tool for the analysis of FA and determine
if any impurities are present in the commercial samples [12].

143
In the literature there are conflicting reports about the fluorescence of FA with UV
excitation. Some publications state that FA is nonfluorescent [12, 18, 19], while other reports
indicate that FA exhibits weak or scarce fluorescence [20-32], The publications claiming FA as a
weakly fluorescent compound used FA samples from different sources, some of them mentioned
that the samples were used without further purification [23, 25, 31] but others did not specify
anything about purification of the sample. The FA solutions were prepared in different solvents
at different pHs. Some of the publications had their own data to show FA as a fluorescent
compound, signals from bulk fluorescence measurement [21, 23, 24, 27-31] but others did not
include any visible native fluorescence signals of FA [20, 22, 25, 26, 32]. According to Thomas
et al. [31] FA has very low fluorescence quantum yield (< 0.005) which could be due to the
radiationless deactivation of the singlet excited state enhanced by the long chain substituent at
position 6 on the pterin moiety of FA molecule. Recently, Tyagi et al. studied the flurescence
spectroscopic behavior of FA [23]. According to the authors, the deactivation of excited-state of
FA molecules in different ionic forms takes place mainly via photo-induced intramolecular
electron transfer or conical intersection. In all ionic forms FA can show a weak fluorescence due
to the radiative emission of a small percentage of locally excited molecules [23].
In this paper the fluorescence of FA was studied by CE-LIF and CE-UV. Samples from
two different commercial sources were compared and two batches from the same commercial
source were compared. The samples were also characterized by UV spectrophotometry and
fluorescence spectroscopy.
EXPERIMENTAL
Chemicals. Two samples of FA and mesityl oxide were purchased from Sigma Aldrich
(St. Louis, MO). One sample of FA was purchased from Schircks Laboratories (Jona,

144
Switzerland). Boric Acid and sodium hydroxide were purchased from Fisher Scientific
(Pittsburgh, PA). Coumarin 460 was from Exciton (Dayton, OH). A 25.0 mM borate buffer at pH
9.50 was prepared by dissolving boric acid in ultrapure water (>18 MΩ cm) from a Modulab
water purification system (United States Filter; Palm Desert, CA) and adjusting the pH with
NaOH. Stock solutions of FA (5.00 mM) were prepared by dissolving FA in this borate buffer. A
saturated solution of FA was prepared by adding 88.3 mg of FA sample in 10.0 mL of 25.0 mM
borate buffer at pH 9.50, the FA concentration would be 20.0 mM if dissolved completely but
some solid remained. The mixture was left standing for 24 hr to allow all the compounds present
in the sample to reach saturation and filtered through 0.2 µm syringe filter (Fisher Scientific;
Pittsburgh, PA) before use. A stock solution of coumarin 460 (2.60 mM) was prepared by
dissolving the compound in anhydrous methyl alcohol (Mallinckrodt Chemicals; Phillipsburg,
NJ).
Capillary Electrophoresis. Two commercial CE instruments (P/ACE MDQ: Beckman
Coulter; Fullerton, CA) were used. A P/ACE MDQ with 32 Karat software (version 5.0)
equipped with an LIF detector was used for experiments with UV excitation. The UV lines of a
Coherent Innova 622 Ar+ laser were isolated spatially with a prism and spectrally with a 355±20
nm bandpass filter (Semrock, Rochester, NY). A UV-grade plano convex lens (f = 25.0 mm)
from Newport (Sanford, CT) focused the laser light onto an Ocean Optics high-OH (ZFQ 4229)
fiber optic (Dunedin, FL), which guided the light to the laser input module of the instrument. The
laser power at the detection point was 0.6 mW. The detection block contained a 450±40 nm
emission filter and a neutral density filter (Andover; Salem, NH). For UV absorbance detection,
a P/ACE MDQ equipped with a deuterium lamp and a PDA detector was used. All the sample
solutions were injected for 5.0 s at 0.5 psi, and separations were performed at a field strength of

145
417 V/cm. Data were acquired at 16 Hz for LIF detection and 32 Hz for UV absorbance
detection. Fused silica capillaries with 60.0 cm total lengths and 50.0-cm to the detector with 52
µm i.d. and 362 µm o.d. (Polymicro technologies; Phoenix, AZ) were used in both CE
instruments. Detection windows were made by removing the polyimide coating using a window
maker (MicroSolve Technology; Eatontown, NJ). Each new capillary was rinsed before use with
0.1 M NaOH, water, and then the separation buffer using 20.0 psi for 10.0 min each. For all CE
experiments separation buffer was 25.0 mM borate buffer at pH 9.50. The buffer solutions were
filtered through a 0.2 µm membrane filter (Whatman; Hillsboro, OR). Data obtained from LIF
and UV absorbance detection systems were analyzed and plotted using OriginPro 7.5 (Origin
Lab; Northapton, MA) and Microsoft Excel (Microsoft Corp; Remond, WA).
Spectrofluorometry and Spectrophotometry. Absorbance spectra (200-600 nm) of
10.0 µM solutions of all three samples of FA in 25.0 mM borate buffer at pH 9.50 were obtained
with a Cary 50 UV-Vis spectrophotometer (Varian; Palo Alto, CA) using a 1-cm quartz cuvette.
Absorbance spectra were collected at room temperature with slit widths of 2 nm and the blank
was subtracted from each spectrum.
Excitation-emission matrices (EEM) of 2.00 µM solutions of all three samples of FA
were acquired using a SPEX Fluorolog-3 spectrofluorometer (model FL3-22TAU3; HORIBA
Jobin Yvon; Edison, NJ) equipped with a 405 W Xenon lamp and a R928P photomultiplier tube.
Excitation-emission matrices were collected at room temperature using a 1-cm quartz cuvette.
Both excitation and emission slit widths were adjusted to 5 nm. The excitation wavelength was
varied from 250 nm to 400 nm in 5 nm intervals, while the emission spectra were collected from
250 nm to 550 nm in 2.5 nm intervals. Contour plots of EEM data were produced using
OriginPro 7.5 (Origin Lab; Northapton, MA).

146
Excitation and emission spectra also were obtained using a PTI Quanta Master 4/2006SE
spectrofluorometer (Photon Technology International; Birmingham, NJ) equipped with 75 W
Xenon lamp and K170B photomultiplier tube (PMT) detector. Spectra were obtained at room
temperature using a 1-cm quartz cuvette. For the excitation spectra, the emission wavelength was
fixed at 450 nm and scanned from 200 nm to 440 nm with an excitation slit width of 7 nm and an
emission slit width of 8 nm. Similarly, for the emission spectra, the excitation wavelength was
fixed at 350 nm and scanned from 370 nm to 700 nm with an excitation slit width of 6 nm and an
emission slit width of 7 nm. The scanning interval was 1 nm for both excitation and emission
spectra. The same same solutions were used for the absorbance spectra and these excitation and
emission spectra.
RESULTS AND DISCUSSION
Capillary Electrophoresis. Our recent work aimed at developing CE-LIF methods for
FA analysis [12], included data suggest that FA does not exhibit significant native fluorescence
despite reports in the literature that FA is at least weakly fluorescent [20-32]. Furthermore our
work with CE-LIF and CE-UV suggested that fluorescent impurities in the commercial FA might
be responsible for fluorescent peaks observed in the CE-LIF electropherograms. Figure 2A
shows a CE-LIF electropherogram for a 100 µM sample of FA obtained from Sigma Aldrich.
The UV lines from an Ar+
ion laser were used for excitation (351-364 nm lines), and emission
was isolated with a 450±40 nm bandpass filter. Several peaks are apparent in this
electropherogram. All electropherograms in this study included a neutral marker compound
(NM) injected along with the sample in order to calculate electrophoretic mobilities.
Electrophoretic mobilities for the major peaks observed in this work are presented in Table 1.
Figure 3 shows an electropherogram for CE with UV absorbance detection at 190 nm with the

147
same sample in the same vial. This approach was used for all comparisons of CE-LIF and CE-
UV data for the same samples. Only 1 major peak is evident in this electropherogram, which is
consistent with stated purity of the FA sample on the label, 98%. The electrophoretic mobility of
the large peak in Figure 3 did not match the electrophoretic mobilities of any of the peaks in
Figure 2A although identical separation conditions and CE instruments were used.
Table 1. Electrophoretic mobility of major CE peaks.
Concentration Detection Sample Electrophoretic mobility (cm2V-1s-1)
Peak 1 Peak 2 Peak 3 Peak 4 Peak 5 Peak 6
100 µM
LIF
SIG1 -2.17×10⁻⁴ -2.33×10⁻⁴ -3.48×10⁻⁴ -3.97×10⁻⁴
SIG2 -2.18×10⁻⁴ -2.32×10⁻⁴ -3.48×10⁻⁴ -3.97×10⁻⁴
SCH -1.87×10⁻⁴ -2.33×10⁻⁴ -3.48×10⁻⁴ -3.96×10⁻⁴
UV
absorbance
SIG1 -3.54×10⁻⁴
SIG2 -3.54×10⁻⁴
SCH -3.54×10⁻⁴
20 mM
LIF
SIG1 -2.17×10⁻⁴ -2.33×10⁻⁴ -3.30×10⁻⁴ to
-3.71×10⁻⁴
-3.97×10⁻⁴
SIG2 -2.18×10⁻⁴ -2.32×10⁻⁴ -3.30×10⁻⁴ to
-3.71×10⁻⁴
-3.97×10⁻⁴
SCH -1.87×10⁻⁴ -2.33×10⁻⁴ -3.28×10⁻⁴ to
-3.72×10⁻⁴
-3.96×10⁻⁴
UV
absorbance
SIG2 -2.22×10⁻⁴ -2.38×10⁻⁴ -3.33×10⁻⁴ to
-3.71×10⁻⁴
A second FA sample was obtained from Sigma Aldrich in hopes that this sample would
not be contaminated with fluorescent impurities. According to the label on the sample the purity
of this batch of FA sample was ≥97%. A CE-LIF electropherogram for this sample (100 µM) is
shown in Figure 2B. Clearly, this sample also contains several fluorescent compounds, and none
of them have the same electrophoretic mobility as FA measured by CE-UV. The same major
peaks are present in the two electropherograms, but at different relative intensities. The same
peak numbers corresponding to the same electrophoretic mobilities were used throughout this
paper. The two samples from Sigma Aldrich were from two different batches (batch no.
077K0701: SIG1 and batch no. 118K0864: SIG2). It does not seem surprising that two batches

148
of FA from the same source have the same fluorescent impurities, but at slightly different
concentrations.
Figure 2. Electropherograms of 100 µM FA
samples with LIF detection with excitation by
UV lines (351-364 nm lines) from an Ar+ laser
filtered by 355±20 nm bandpass filter and
emission with a 450±40 nm bandpass filter.
Folic acid samples were injected for 5.0 s at
0.5 psi, and separation was performed in 25.0
mM borate buffer at pH 9.50 at 417 V/cm. The
current was 14.0 µA. The peaks at 3.0 min are
due to the neutral marker (coumarin 460), and
the other peaks at longer migration times are
due to the compounds in the FA samples which
are numbered according to the decreasing effective mobility. Two FA samples are different
batches from one commercial source: (A) SIG1 (batch no. 077K0701), (B) SIG2 (batch no.
118K0864). The third sample is from a different commercial source (C) SCH (batch no. 119).
Several publications on the fluorescence spectroscopy of FA, state that FA samples
obtained from Schircks Laboratories was used without additional purification [23, 31]. We
purchased a sample of FA from this source with a certificate of analysis indicating the purity of
sample 99.0%, and a CE-

149
This sample also contained several fluorescent impurities with electrophoretic mobilities that did
not match FA by CE-UV. Interestingly the pattern of major CE-LIF peaks was quite different
compared to the two samples from Sigma Aldrich. This result is consistent with what one might
expect for FA from a different commercial source if the impurities were created during the
synthesis of this compound. If the fluorescent impurities were due to storage of very pure FA in
the solid form or in solution for CE analysis, very similar peak patterns would be expected. The
manufacturer state a purity of 99.0% for this sample, and CE-UV analysis of a 100 µM sample
was consistent with this purity level (Figure 2C). The peak at ~7.2 min (6, electrophoretic
mobility = -3.96×10⁻⁴
cm2V
-1s
-1) in all three CE-LIF electropherograms comigrates with 6-
carboxypterine, a highly fluorescent known oxidation product of FA [12], but the other
fluorescence peaks have not been identified.
Figure 3. Electropherogram of 100 µM FA (SIG1) with UV absorbance detection at 190 nm.
Folic acid was injected for 5.0 s with 0.5 psi. The separation conditions are identical to those in
Figure 2. The first peak at 3.0 min is the neutral marker (mesityl oxide, NM) and the peak at 6.2
min is FA which is numbered based on the effective mobility of peaks including Figure 2.
Although the electropherogram corresponds to FA sample from one of the commercial sources
(SIG1), other two samples of FA also produce identical electropherograms.

150
Concentrated solutions of FA were studied by CE-LIF and CE-UV in an effort to observe
a fluorescent peak with the same electrophoretic mobility as FA. As described in the
Experimental Section, saturated FA solutions were prepared at a nominal concentration of 20
mM with a small amount of solid FA present after solution preparation. Table 1 presents the
electrophoretic mobilities for the 5 major peaks observed by CE-LIF for 100 µM samples of FA
and the electrophoretic mobility of FA, which was only observed at 100 µM by CE-UV. The
table also lists peaks with the same electrophoretic mobilities (within experimental error)
observed by CE-LIF and CE-UV for saturated FA samples.
Figure 4. Electropherograms of saturated solution of FA (SIG1). To prepare the solution 88.3 mg
of FA was added to 10.0 mL of 25.0 mM borate buffer at pH 9.50, the concentration would be
20.0 mM if dissolved completely but some solid left undissolved. The mixture was left standing
for 24 hr and filtered through 0.2 µm syringe filter. All the injection and separation conditions
are same as in Figure 1 and 2. The peaks at 2.9 min are the neutral markers (NM), and the other
peaks at longer migration times are due to compounds in the FA sample. The electropherograms
of saturated solutions of all three samples of FA are similar. (A) Electropherogram with UV
absorbance detection (190 nm). Neutral marker used was mesityl oxide and the current was 13.2
µA. (B) Electropherogram with LIF detection, the detection conditions are same as in Figure 2.
The neutral marker used was coumarin 460 and the current was 13.7 µA.

151
Electropherograms of a saturated FA sample (SIG1) by CE-UV and CE-LIF are
presented in Figure 4. The CE-UV electropherogram for this saturated FA sample (near 20 mM,
contaminant peaks are more visible, and the FA peak is broader and less symmetrical (tailed) at
this high concentration. Many additional peaks are apparent in the CE-LIF electropherogram
(Figure 4B). Even for this saturated sample that is approximately 200 times more concentrated
than the 100 µM FA samples, only a small, very broad peak is observed at the electrophoretic
mobility for FA (5.5-6 min in Figure 4B). This very weak fluorescence could be due to FA, but it
could also be a minor fluorescent contaminant that is broadened in the presence of the high ionic
strength zone of FA at approximately the same migration time. These data suggest that FA is
only very weakly fluorescent, if at all. Even a quantum yields for FA reported as < 0.005 is likely
due to fluorescent contaminants in the commercial FA used in that study [31].
Absorbance and Fluorescence Spectroscopy. The absorbance spectra of the 10.0 µM
FA samples in 25.0 mM borate buffer at pH 9.50 are shown is Figure 5A. All three samples of
FA had almost identical absorbance spectra. Hence, only the spectra of samples with largest
differences (SIG2 and SCH) are included. The identical absorbance spectra of three samples of
FA indicate the presence of the same major component in all three samples. The shape of the
absorbance spectra of FA samples obtained in this study agrees with the absorbance spectra of
FA sample at basic pH in the literature [23, 31].
The excitation-emission spectra of 10.0 µM solutions of all three samples of FA in 25.0
mM borate buffer at pH 9.50 were obtained under the same setting of the instrument which are
shown in Figure 5B. These signals agree with the reason why some literature reported FA as a
fluorescent compound while detecting without separation [21, 23, 27-31]. The excitation-

152
emission spectra of three samples of FA have some differences. Spectra of two samples with
largest difference are shown in Figure 5B which includes SIG2 and SCH. The major difference
between these two samples is an extra shoulder in both excitation and emission spectra of SCH
which is not present in SIG2. This shoulder could be due to the presence of an additional
fluorophore as an impurity in SCH. An important method to determine the presence of impurities
in a given sample is to compare its absorbance and excitation spectra. Principally, the absorption
of a photon causes an electron of the molecule to move from the ground state to excited state
which is the sources of absorbance and excitation spectrum. Hence, absorbance spectrum of a
dilute solution of a single fluorophore is usually identical to its excitation spectrum. The
difference in these two spectra represents the presence of fluorescent impurities [33]. The
absorbance spectra of two samples, shown in Figure 5A are significantly different from the
excitation spectra of same samples shown in Figure 5B. The absorbance and excitation spectra of
all three samples of FA have some significant differences representing presence of different
impurities in the samples. This is also consistent with the result shown by CE electropherograms.
Excitation emission matrix (EEM) fluorescence spectroscopy is one of the best methods
for the analysis of mixture of fluorophores. It can provide detailed information about the number
of different fluorophores present in the sample [34]. The use of a single excitation and emission
wavelength to scan emission and excitation spectra respectively highly restricts the information
included in the excitation-emission spectra but the scan of both excitation and emission
simultaneously in EEM fluorescence spectroscopy overcomes the limitation of excitation-
emission spectra. Hence, the EEM fluorescence spectroscopy is usually used to analyze samples
containing multiple fluorophores or fluorescent impurities which cannot be resolved by simple
excitation-emission spectra [34].

153
Figure 5. Spectra of FA samples from 2 commercial sources. The two spectra showing the
largest differences among the three samples studied (SIG1, SIG2, and SCH) were plotted. The
spectra of 10.0 µM solutions of FA in 25.0 mM borate buffer at pH 9.50 were obtained using 1-
cm quartz cuvette. The solid line represents SIG2 (batch no. 118K0864) and dotted line
represents SCH (batch no. 119). (A) Absorbance spectra. (B) Excitation-emission spectra. For
the excitation spectrum the emission was fixed at 450 nm and for the emission spectrum the
excitation was fixed at 350 nm (emission spectra are normalized).
Although, the excitation-emission spectra are just slices of EEM data; we performed these
experiments separately under two different settings of the instrument. The necessity of the EEM
data was realized after the study of excitation-emission spectra. Much dilute solution of FA
samples (2.00 µM) were used to measure the EEM spectra to reduce the possibility of peaks
0.00
0.05
0.10
0.15
0.20
0.25
0.30
200 300 400 500 600
Ab
sorb
ance
(A
U)
Wavelength (nm)
SIG2
SCH
A
0
5
10
15
20
200 400 600
Inte
nsi
ty
Wavelength (nm)
Ex: SIG2
Em: SIG2
Ex: SCH
Em: SCH
B

154
from minor fluororphores be covered by the peaks of major fluororphores. Excitation emission
matrices of 2.00 µM solutions of all three samples were obtained using a SPEX Fluorolog-3
spectrofluorometer. Contour plots of EEM data of FA samples in Figure 6 show the presence of
a single major peak in all three samples of FA indicating the presence of a single major
fluorescent impurity in all the FA samples. But the possibility of other fluorophores if present
with lower intensities may have covered under the signal of major fluorophore cannot be
completely ignored. Two samples of FA from one commercial source (SIG1 and SIG2) have
similar excitation and emission maxima (excitation: 360 nm, emission: 450 nm) but the sample
from the different commercial source (SCH) has different excitation and emission maxima
(excitation: 380 nm and emission: 500 nm).
Figure 6. Contour plots of EEM data of FA
samples. The EEMs of 2.00 µM solutions of
FA in 25.0 mM borate buffer at pH 9.50 were
obtained using a 1-cm quartz cuvette. Two FA
samples are different batches from one
commercial source: (A) SIG1 (batch no.
077K0701), (B) SIG2 (batch no. 118K0864).
The third sample is from a different
commercial source (C) SCH (batch no. 119).

155
Identification of differences in the peak maxima is clearly an advantage of collecting EEM data
over excitation-emission spectra which helped to identify that that the samples from two
different sources contain different fluorophores as major component. Hence, the EEM data also
suggested the same conclusion made during the CE based analysis that the samples from two
different commercial sources may have carried different impurities from the
synthesis/purification process.
CONCLUSIONS
Analysis of 100 µM and saturated (20.0 mM) solutions of FA using CE with UV
absorbance and LIF detection systems and comparison of mobilities of peaks showed that FA has
very weak fluorescence, not detectable at 100 µM concentration. Fluorescence signals can be
detected from commercial FA samples without separation (excitation-emission spectra) even
below 100 µM. This shows the commercial FA samples contain fluorescent impurities; hence,
they should be further purified or separated before studying their native fluorescence.
Comparison of CE-LIF and CE-UV electropherograms shows the presence of small
amount of more than one fluorescent impurities in all three samples of FA which could be from
the source, simultaneously crystallized during the purification process or formed by the
decomposition of the sample during storage. One of the impurities in the samples from different
commercial sources is different suggesting the impurities created during synthesis process. One
common fluorescent compound detected in all the samples was 6-carboxypterin which is one of
the oxidation products of FA.
Excitation emission matrices of of FA samples show the two samples of FA from one
commercial source have similar fluorescent compound as an impurity because both of them have
same excitation-emission maxima. But, the FA sample from different commercial source has

156
compound with different excitation-emission maxima indicating presence of different
fluorophore as an impurity. This indicates the presence of fluorescent impurities in the FA
samples created during the synthesis process.
ACKNOWLEDGEMENTS
Jiba Raj Acharya, Deepa Pageni, Jinwoo Choi, and Evgueni Nesterov are acknowledged
for their help with absorbance and fluorescence spectroscopy. The authors also would like to
acknowledge Funda Kizilkaya, Sherrisse Bryant, Ryan Picou, and Rachel Henken for their
contributions to this work. Santhos Challa was supported by the grant from National Science
Foundation (Grant No CHE-0911118).

157
References
1. Wills, L., Treatment of "pernicious anaemia of pregnancy" and "tropical anaemia" -
With special reference to yeast extract as a curative agent. Brit. Med. J., 1931. 1: p.
1059-1064.
2. Angier, R.B., et al., The structure and synthesis of the liver L-casei factor. Science, 1946.
103(2683): p. 667-669.
3. Iyer, R. and S.K. Tomar, Folate: A Functional Food Constituent. J. Food Sci., 2009.
74(9): p. R114-R122.
4. Quinlivan, E.P., A.D. Hanson, and J.F. Gregory, The analysis of folate and its metabolic
precursors in biological samples. Anal. Biochem., 2006. 348(2): p. 163-184.
5. Scott, J., F. Rebeille, and J. Fletcher, Folic acid and folates: the feasibility for nutritional
enhancement in plant foods. J. Sci. Food Agric., 2000. 80(7): p. 795-824.
6. Smith, A.D., Y.I. Kim, and H. Refsum, Is folic acid good for everyone? Am. J. Clin.
Nutr., 2008. 87(3): p. 517-533.
7. Eichholzer, M., T. Tonz, and R. Zimmermann, Folic acid: a public-health challenge.
Lancet, 2006. 367(9519): p. 1352-1361.
8. Nelson, B.C., The expanding role of mass spectrometry in folate research. Curr. Anal.
Chem., 2007. 3(3): p. 219-231.
9. Arcot, J. and A. Shrestha, Folate: methods of analysis. Trends Food Sci. Technol., 2005.
16: p. 253-266.
10. Landers, J.P., Capillary and microchip electrophoresis and associated microtechniques.
Third ed. 2008, New York: CRC Press. 3-74.
11. Gilman, S.D. and M.J. Sepaniak, Capillary electrophoresis techniques in biomedical
analysis. Biomed. Photonics Handb., 2003: p. 24/1-24/27.
12. Regmi, S.C., A.L. Phipps, and S.D. Gilman, Analysis of folic acid using capillary
electrophoresis with UV absorbance and laser-induced fluorescence detection. Analyst,
2012. X(X): p. X.
13. Cheung, R.H.F., P.J. Marriott, and D.M. Small, CE methods applied to the analysis of
micronutrients in foods. Electrophoresis, 2007. 28(19): p. 3390-3413.
14. Suntornsuk, L., Recent advances of capillary electrophoresis in pharmaceutical analysis.
Anal. Bioanal. Chem., 2010. 398(1): p. 29-52.

158
15. Jouyban, A. and E. Kenndler, Impurity analysis of pharmaceuticals using capillary
electromigration methods. Electrophoresis, 2008. 29(17): p. 3531-3551.
16. Ng, C.L., et al., Determination of pharmaceuticals and related impurities by capillary
electrophoresis. J. Chromatogr. A, 1994. 680(2): p. 579-586.
17. Altria, K.D., M.A. Kelly, and B.J. Clark, Current applications in the analysis of
pharmaceuticals by capillary electrophoresis. II. Trac-Trend Anal. Chem., 1998. 17(4):
p. 214-226.
18. Vahteristo, L.T., et al., Improvements in the analysis of reduced folate monoglutamates
and folic acid in food by high-performance liquid chromatography. J. Agric. Food
Chem., 1996. 44(2): p. 477-482.
19. Gregory, J.F., D.B. Sartain, and B.P.F. Day, Fluorometric-determination of folacin in
biological-materials using high-performance liquid-chromatography. J. Nutr., 1984.
114(2): p. 341-353.
20. Wu, S., et al., Fabrication of electrolytic cell for online post-column electrochemical
derivatization in ion chromatography. Anal. Chim. Acta, 2012. 735: p. 62-68.
21. Luo, D. and J. Wang, A Sono-oxidation fluorescence mithod and determination of folic
acid in pharmaceutical formulation. Oxid. Commun., 2011. 34(3): p. 675-683.
22. Wang, Y., et al., Synchronous Fluorescence as a Rapid Method for the Simultaneous
Determination of Folic Acid and Riboflavin in Nutritional Beverages. J. Agr. Food
Chem., 2011. 59(23): p. 12629-12634.
23. Tyagi, A. and A. Penzkofer, Fluorescence spectroscopic behaviour of folic acid. Chemi.
Phys., 2010. 367(2-3): p. 83-92.
24. Hirakawa, K., Fluorometry of singlet oxygen generated via a photosensitized reaction
using folic acid and methotrexate. Anal. Bioanal. Chem., 2009. 393(3): p. 999-1005.
25. Huang, J.C., et al., A novel fluorescent method for determination of peroxynitrite using
folic acid as a probe. Talanta, 2007. 72(4): p. 1283-1287.
26. Hirakawa, K., Fluorometry of hydrogen peroxide using oxidative decomposition of folic
acid. Anal. Bioanal. Chem., 2006. 386(2): p. 244-248.
27. Off, M.K., et al., Ultraviolet photodegradation of folic acid. J. Photochem. Photobiol., B,
2005. 80(1): p. 47-55.
28. Zhang, Z.Q. and Y. Tang, Solid-phase reactor flow-injection on-line oxidizing
spectrofluorimetry for determination and dissolution studies of folic acid. Anal. Bioanal.
Chem., 2005. 381(4): p. 932-936.

159
29. Hirakawa, K., et al., Sequence-specific DNA damage induced by ultraviolet A-irradiated
folic acid via its photolysis product. Arch. Biochem. Biophys., 2003. 410(2): p. 261-268.
30. Blanco, C.C., et al., Fluorometric-determination of folic-acid based on its reaction with
the fluorogenic reagent fluorescamine. Anal. Lett., 1994. 27(7): p. 1339-1353.
31. Thomas, A.H., et al., Fluorescence of pterin, 6-formylpterin, 6-carboxypterin and folic
acid in aqueous solution: pH effects. Photochem. Photobiol. Sci., 2002. 1(6): p. 421-426.
32. Blanco, C.C., et al., Micellar-ehnanced synchronous-derivative fluorescence
determination of derivatization of derivatized folic-acid in pharmaceutical preparations.
J. Pharm. Biomed. Anal., 1995. 13(8): p. 1019-1025.
33. Lakowicz, J.R., Principles of Fluorescence Spectroscopy. Third ed. 2006, New York:
Springer.
34. Das, S., et al., Molecular Fluorescence, Phosphorescence, and Chemiluminescence
Spectrometry. Anal. Chem., 2012. 84(2): p. 597-625.

160
APPENDIX C. OXIDATIVE DERIVATIZATION OF FOLIC ACID
MONITORED BY CAPILLARY ELECTROPHORESIS WITH UV
ABSORBANCE AND FLUORESCENCE DETECTION
Suresh C. Regmi, Jeffrey P. Cunniff, and S. Douglass Gilman*
Department of Chemistry, Louisiana State University, Baton Rouge, LA 70803, USA
S. Douglass Gilman (Corresponding Author) – [email protected]; Phone: +1 (225) 578-3010;
Fax: +1 (225) 578-3458

161
Abstract
Folic acid (FA) is an important biological compound required for numerous bodily functions
involving cell growth and division. A lack of FA can give rise to folate deficiency, which can
have severe effects on human health and fetuses. Folic acid is commonly detected by UV
absorbance because it is nonfluorescent. Several literature reports have concluded the oxidation
of FA produces highly fluorescent products providing possibility of laser induced fluorescence
(LIF) detection, which would provide lower detection limits relative to absorbance techniques.
This work investigated five oxidants (sodium hypochlorite, hydrogen peroxide, potassium
peroxodisulfate, potassium ferricyanide, and sodium nitrite). The reactions were conducted off-
line.and their effectiveness to oxide FA was studied using both CE-LIF and CE-UV absorbance.
The FA concentration used was 100 μM and the samples were reacted with both low oxidant
concentrations of 100 μM (FA-oxidant molar ratio1:1) as well as high concentrations of 10.0
mM (FA-oxidant molar ratio1:100). Sodium hypochlorite and hydrogen peroxide in presence of
copper (II) chloride were found to be effective oxidants. But, hydrogen peroxide in presence of
copper (II) chloride was considered best oxidant. A 27.4× total fluorescence increase and 2.23×
decomposition of FA was observed with the 5.00 mM hydrogen peroxide in presence of 60.0 µM
copper (II) chloride (equivalent to 10.0 mM oxidant). Other three oxidants studied were
considered ineffective oxidants because they did not produce any significant change in the total
fluorescence as well as the CE-UV signal of FA. Analysis of fluorescence and UV absorbance
peaks of FA as well as 6-carboxypterene indicated incomplete conversion of the decomposed FA
into fluorescent products; hence, further study deemed necessary for the optimization of reaction
conditions before concluding hydrogen peroxide as a successful oxidant for FA. This study is an
important step towards the development of methods for routine analysis of FA.

162
1. Introduction
Folic acid (FA) was discovered in 1931 by Lucy Wills as a component of yeast capable of curing
“pernicious anemia of pregnancy” [1]. The true structure of FA (Figure 1A) was not determined
for another 15 years [2] due to the enormous diversity of folate structures with the variations in
substituted groups, oxidation state of the molecule, and differences in the length of the glutamyl
side chain. All the pteroylglutamates including naturally occurring polyglutamates are called
folates. The form shown in Figure 1A typically is referred to as FA which is the most oxidized
form of folate [3, 4]. Reduced folates are synthesized by plants naturally, but FA does not occur
in nature to any notable extent [5]. Instead it is synthesized with chemically similar properties to
the many folates and can be found in trace amounts in many vitamin supplements and in fortified
foods such as cereals and flours [5].
A B
Figure 1. Structures of folic acid (A) and 6-carboxypterine (B)
Biologically, folates are cofactors and substrates for numerous bodily functions centered on cell
growth and division processes as well as metabolic regulation. Upon entering the body, FA is
reduced in to dihydrofolate (DHF) and again into tetrahydrofolate (THF) by the enzyme
dihydrofolate reductase in the liver [6, 7]. This process is surprisingly slow and sets a limit for
how much FA the body receives and can utilize at any time. Once FA is converted into DHF or
THF it participates in various biological pathways, most notably in DNA biosynthesis and the
methylation cycle [5, 7]. In DNA synthesis THF is one compound involved in the synthesis of

163
purines and pyrimidines and acts as a substrate in single-carbon transfer reactions, such as
methylation, to produce complete viable DNA strands [7]. In the methylation cycle THF helps to
supply numerous methyltransferase enzymes with S-adenosylmethionine (SAM) which is an
important methyl donor involved in the production of homocysteine [7].
Folic acid is vital to the proper functioning of the body. A shortage of FA in the body is
clinically referred to as folate deficiency which can lead to a number of health problems such as
anemia due to a shortage of viable red blood cells being produced in the bone marrow. Low
amounts of folates result in dwindling amounts of THF throughout the body, which disrupts
biosynthesis cycles such as the methylation cycle and lead to an accumulation of homocysteine
[5, 6]. The build-up of homocysteine and onset of anemia are thought to be linked to various
forms of vascular diseases such as coronary heart disease [5, 6]. Pregnant women are most
susceptible to folate deficiency since they require enough folates to adequately sustain biological
functions in themselves and in their developing fetus as it severely hinders the rate of cell
division and growth. This can result in neural tube defects, which involve malformations of the
spine, skull and brain [5, 6].
Many techniques have been developed with the goal of successful separation and detection of FA
such as thin-layer and column chromatography, immunoassays, high-performance liquid
chromatography (HPLC), capillary electrophoresis (CE), and mass spectrometry [3, 5, 8-10].
Many of them have limitations such as long analysis time, limited reproducibility, complicated
and costly instrumentation and maintenance, high volume of sample consumption and waste
production, and expensive supplies [3, 5, 8-10]. In contrast, CE features separations with high
resolution, rapid separation, and high efficiency while at the same time consuming minimal
amounts of sample [11, 12]. There are different detection techniques used with CE separation,

164
among them UV absorbance and laser induced fluorescence (LIF) detection are most common
[11, 12]. For CE, UV absorbance detection has poor detection limit because of the short path
length resulting from the capillary inner diameter. Laser induced fluorescence detection has
lower detection limit and it is a selective detection technique as well [11, 12]. In order for LIF to
be an effective method of detection, the target analytes must be fluorescent. Unfortunately, the
fluorescence properties of FA are highly debated in the literature with various reports suggesting
that it is nonfluorescent [13-16] and others claiming it is weakly fluorescent [17-20]. Thomas et
al. studied the fluorescence properties of selected folates including FA and determined that FA
had fluorescence quantum yields of less than 0.005 [18]. The reports claiming FA as a florescent
compound have performed bulk measurements of fluorescence with no prior separation of the
samples. This meant that FA along with any contaminants in solution may have detected and was
misinterpreted as due to FA alone [13, 14]. This assumption was made by Regmi et al. after
examining the differing fluorescent traits in three distinct samples of FA from two manufacturers
with and without CE separation [14]. Regmi et al. concluded that the fluorescence thought to
originate from the FA could actually be attributed to multiple trace contaminants in solution
including 6-carboxypterin that were highly fluorescent [14]. These findings were determined by
analyzing and comparing the mobility of FA peak from UV absobance data against the
fluorescence peaks. These conclusions provided further evidence that FA is not natively
fluorescent [14]. Regmi et al. also attempted to convert FA into fluorescent compound by
derivatizing with different amine reactive reagents but none of the attempts were successful [13].
Recently, Tyagi et al. performed a detailed study of fluorescence property of FA at different pH
[17]. According to the authors, the non-radiative deactivation of FA is either by photophysical
relaxation or by intramolecular electron transfer. In both deactivation processes the substituent,

165
p-aminobenzoyl glutamic acid of FA seemed to have major roles, acting as an “internal
quencher”, suppressing the fluorescence given off from the adjacent pterin substituent. A C9–
N10 bond of FA connects the p-aminobenzoyl glutamic acid and pterin substituents of the
molecule (Figure 1). Cleaving this bond allows the fluorescence given off by the pterin group to
be detectable instead of being quenched by the p-aminobenzoyl glutamic acid group [17, 21].
One of the common fluorescent products formed from the oxidative cleavage of C9–N10 bond is
6-carboxypterin, a highly fluorescent compound [21-23]. Hence, an oxidative cleavage of FA
with a suitable oxidizing agent could be a good option to convert FA into fluorescent compound
and use LIF detection for quantification with higher selectivity and better detection limit.
The goal of the work presented in this paper was to study the oxidation of FA with five different
oxidizing agents, sodium hypochlorite, hydrogen peroxide in presence of copper (II) chloride,
sodium peroxodisulphate, potassium ferricyanide, and sodium nitrite. The reagents which best
oxidized FA to produce a highly fluorescent derivatives were determined. Two basic criterions
were established to meet the goal. First, the oxidant must produce a fluorescent product as
evidenced by a new fluorescence peak or a significant increase in a previously detected peaks in
underivatized FA during CE-LIF detection. Second, the reaction must show decomposition of the
FA in the sample, which is monitored by comparing the area of the FA peak in CE-UV
absorbance signals of FA controls and the oxidation reaction mixtures.
2. Experimental
2.1. Chemicals
Folic acid, potassium ferricyanide, potassium peroxodisulfate, hydrogen peroxide, sodium nitrite,
and copper (II) chloride were obtained from Sigma Aldrich (St. Louis, MO). Boric acid, mesityl
oxide, and sodium hydroxide were obtained from Fisher Scientific (Pittsburgh, PA). Coumarin
166
460 was from Exciton (Dayton, OH), and methanol was purchased from Mallinckrodt Chemicals
(Phillipsburg, NJ). Bleach (5% solution of sodium hypochlorite) was purchased from a local
store.
Borate buffers were prepared at concentrations 25.0 mM and 50.0 mM at pH 9.50 in ultrapure
water (>18 MΩ cm) from a Modulab water purification system (United States Filter; Palm
Desert, CA). Stock solutions of FA (2.50 mM) were prepared in 25.0 or 50.0 mM borate buffer
at pH 9.50. Stock solution of coumarin 460 (7.50 mM) was prepared by dissolving the compound
in a 1:1 (v/v) mixture of methanol and ultrapure water. Stock solutions of the oxidants were
prepared by dissolving the appropriate amounts of oxidants in ultrapure water, the concentrations
were: 0.670 M bleach, 8.80 M hydrogen peroxide, 50.0 mM potassium peroxodisulfate, 100 mM
potassium ferricyanide, and 50.0 mM sodium nitrite. Appropriate volumes of stock solutions
were diluted in corresponding separation buffers for the CE analysis.
2.2. Oxidative derivatization of FA
A literature review of oxidants of FA and its derivatives resulted in a number of compounds,
among them 5 most commonly used compounds were selected for this study. The selected
oxidants are: sodium hypochlorite [24], hydrogen peroxide/copper (II) chloride [21], potassium
peroxodisulphate [25], potassium ferricyanide [26], and sodium nitrite [27]. The reaction
conditions for some of oxidants were slightly modified which will be discussed individually. In
general, the oxidation reactions are fast reactions; hence, a reaction time of 15.0 min was chosen
for all the oxidative derivatization reactions. The oxidants were added last and the reaction time
counted immediately after the addition of the oxidants. The amount of oxidant utilized in the
reactions can significantly impact the amount and type of products produced. Hence, in this
study, two different concentrations of oxidants were reacted with 100 µM FA, 100 µm

167
([FA]:[oxidant] = 1:1) and 10.0 mM ([FA]:[oxidant] = 1:100). Again, the number of electrons
involved in the oxidation reaction was also considered to decide the concentration of oxidants, to
apply approximately same oxidative strength of all the oxidants. Above mentioned FA-oxidant
ratio was used if the oxidant produced one electron in the reaction, and half of the oxidant
concentration was used if the oxidant produced two electrons in the reaction. For convenience
the reaction mixtures will be represented as low oxidant reaction mixtures ([FA]:[oxidant] = 1:1
or 1:0.5) and high oxidant reaction mixtures ([FA]:[oxidant] = 1:10 or 1:5) here after. To monitor
the mobility of the reactant and product peaks a neutral marker (NM) solution, coumarin 460 in
LIF detection and mesityl oxide in UV absorbance detection were also injected from a separate
vial along with the reaction mixtures. In all the oxidative derivatization experiments, control
experiments (FA only or oxidant only) were also conducted under the same conditions as the
reaction mixtures to confirm any changes taking place in the reaction mixture was due to the
oxidation of FA but not due to the hydrolysis or decomposition of any of the reactants.
Oxidation of FA with sodium hypochlorite (bleach) was carried out based on the method
described by Holt et al. [24] with some modifications. The electrolyte concentration was reduced
to make the method compatible with CE. Again, a pH 9.50 was used instead of the pH used by
Holt et al. because the preliminary observation showed no fluorescent product under the acidic
conditions but multiple fluorescent products at pH 9.50. Hahn et al. [25] also reported no
reaction under the condition proposed by Holt et al. Low and high oxidant reaction mixtures
were prepared by mixing appropriate volume of stock solutions of FA (2.50 mM) and sodium
hypochlorite (0.670 M) in 25.0 mM borate buffer at pH 9.50 to make the final concentration of
FA 100 µM and sodium hypochlorite 100 µM and 10.0 mM respectively. The reaction mixtures
168
were injected for 5.0 s at 0.5 psi directly from the reaction vial after 15.0 min. Separation was
performed in 25.0 mM borate buffer at pH 9.50 at a field strength of 417 V/cm.
Oxidation of FA with hydrogen peroxide in presence of copper (II) chloride was conducted
according to the method described by Hirakawa et al. [21], except that the reaction was carried
out at room temperature instead of 37 °C, because no significant difference in reactivity at those
two temperatures was observed in preliminary experiments. Folic acid (300 µM) was allowed to
react with hydrogen peroxide (150 µM, 15.0 mM) in presence of 180 µM copper (II) chloride.
The reaction mixtures were prepared in 10.0 mM phosphate buffer at pH 7.60. Aliquots of
reaction mixtures were diluted 3× in 50.0 mM borate buffer at pH 9.50 after 15.0 min and
injected for 5.0 s at 0.5 psi. The separation was performed with 50.0 mM borate buffer at pH
9.50 at a field strength of 417 V/cm.
Oxidation of FA with potassium peroxodisulphate was carried out according to the method
described by Hahn et al. [25] with some modifications. The reaction was conducted at room
temperature instead of 60 °C used by Hahn et al. because the preliminary observation showed no
difference in the reaction at those two temperatures. The authors did not mention the pH of the
oxidation reaction mixture but according to the manuscript [25] they adapted the method
developed by Day and Gregory [28] in which an acidic pH (3-7) was used. But, Hahn et al. also
mentioned that the condition used by Day and Gregory did not work for the original reagent
(calcium hypochlorite); hence, they had to use sodium peroxodisulphate to oxidize FA. It is not
clear whether they used the same pH for the reaction with peroxodisulphate. Hence, we decided
to use pH 9.50 for the oxidation reaction at which FA is more soluble, and is convenient for CE
analysis. Low and high oxidant reaction mixtures of potassium peroxodisulphate (50.0 µM and
5.00 mM respectively) were prepared in 25.0 mM borate buffer at pH 9.50, and allowed to react

169
for 15.0 min before injecting for 5.0 s at 0.5 psi. Separation was performed in 25.0 mM borate
buffer at pH 9.50 at a field strength 417 V/cm.
Oxidation of FA with potassium ferricyanide was carried out according to the method described
by Chippel et al. [26] with some modification (pH 9.50 used instead of pH 9.00). The authors
indicated the formation of small amount of pterins as a result of oxidation of FA and DHF in a
control experiment, which could be fluorescent products but did not use fluorescence detection.
Low and high oxidant reaction mixtures of potassium ferricyanide (100 µM and 10.0 mM
respectively) were prepared in 25.0 mM borate buffer at pH 9.50, and allowed to react for 15.0
min before injecting for 5.0 s at 0.5 psi in CE system. Separation was performed in 25.0 mM
borate buffer at pH 9.50 at a field strength of 417 V/cm.
Oxidation of FA with sodium nitrite was carried out according to the method described by Reed
et al. [27]. The authors claimed the formation of N10
-nitrosofolic acid while oxidizing FA with
sodium nitrite but never used fluorescence detector to see if there was any fluorescent product
formed. The authors also mentioned nitrous acid, which is present in acidic solution of nitrite, as
a strong oxidizing agent and can oxidize folates in to pterine compounds. Hence we decided to
test the reaction under similar conditions. Low and high oxidant reaction mixtures of sodium
nitrite were prepared in a 25.0 mM acetate buffer at pH 5.00 and allowed to react for 15.0 min.
The reaction mixture was diluted 3× in 50.0 mM borate buffer at pH 9.50 and injected for 5.0 s at
0.5 psi. The separation was performed with 50.0 mM borate buffer at pH 9.50 at a field strength
of 417 V/cm.
2.3. Capillary electrophoresis instrumentation
Two commercial CE instruments (P/ACE MDQ: Beckman coulter; Fullerton, CA) were used. A
P/ACE MDQ with 32 Karat software (version 5.0) equipped with an LIF detector was used for

170
experiments with UV excitation. The UV lines of a Coherent Innova 622 Ar+ laser were isolated
spatially with a prism and spectrally with a 355±20 nm bandpass filter (Semrock; Rochester,
NY). A UV-grade plano convex lens (f = 25.0 mm) from Newport (Sanford, CT) focused the
laser light onto an Ocean Optics high-OH (ZFQ 4229) fiber optic (Dunedin, FL), which guided
the light to the laser input module of the instrument. The laser power at the detection point was
0.6 mW. The detection block contained a 450±40 nm emission filter and a neutral density filter
(Andover, Salem, NH). For the UV absorbance detection, a P/ACE MDQ equipped with a
Deuterium lamp and a PDA detector was used. All the sample solutions were injected for 5.0 s at
0.5 psi and separation was performed at a field strength of 417 V/cm. The LIF data were
acquired at 16 Hz and UV absorbance data were collected at 32 Hz. Fused silica capillaries with
60.0 cm total lengths and 50.0-cm to the detector with 52 µm i.d. and 362 µm o.d. (Polymicro
technologies; Phoenix, AZ) were used in both MDQs. In the capillaries used in both P/ACE
MDQs the detection window was made by removing the polyimide coating using a window
maker (MicroSolve Technology; Eatontown, NJ). Each new capillary was rinsed before use with
1.0 M NaOH, water, and then the separation buffer using 20.0 psi for 10.0 min each. For all CE
experiments separation buffer were 25.0 mM or 50 mM borate at pH 9.50. The buffer solutions
were filtered through a 0.2 µm membrane filter (Whatman; Hillsboro, OR). The LIF and UV
absorbance data were analyzed and plotted using OriginPro 7.5 (Origin Lab; Northapton, MA)
and Microsoft Excel (Microsoft Corp; Remond, WA).
3. Results and discussions
Our recent work focused on developing CE-LIF methods for the analysis of FA. We analyzed
FA samples based on the literature information that FA has weak native fluorescence but the
study showed the fluorescence of FA samples is from the impurities but not FA itself [14]. After

171
confirming FA as nonfluorescent compound we tried to derivatize it with number of amine
reactive reagents but none of them reacted [13]. One of the derivatizing reagents, fluorescamine,
derivatized the compound present as an impurity but not FA itself [13]. Chemical oxidation is
one of the possible method to convert FA into fluorescent compound. Many literature reports
suggest FA and its derivatives can undergo oxidative cleavage to produce different products and
some of them claim that some of the products are highly fluorescent [21, 23, 29]. Many of these
literature reports also suggest 6-carboxypterin (Figure 1B) as a main fluorescent product which is
formed by the cleavage of C9–N10 bond of FA molecule (Figure 1A) [21-23]. A number of
oxidants have been used in the literature, including calcium hypochlorite [16], sodium
hypochlorite [24], hydrogen peroxide/copper(II) chloride [21, 22], potassium peroxodisulphate
[25], peroxynitrite [29], potassium ferricyanide [26], and sodium nitrite [27]. In our previous
study we also attempted to oxidize FA with sodium hypochlorite and hydrogen peroxide in
presence of copper (II) chloride and observe partial positive results [13]. But, none of the
literature reports compared the reactivity of different oxidants under similar conditions. Study of
reactivity of individual oxidants, their effectiveness to produce fluorescent product, and
comparison of their reactivity with FA under similar conditions could be an effective pathway in
the development of better detection techniques of FA. Hence, 5 most common compounds:
sodium hypochlorite (bleach), hydrogen peroxide in presence of copper(II) chloride, potassium
peroxodisulphate, potassium ferricyanide, and sodium nitrite were selected for this study among
the previously used oxidants.
The reactivity of same concentration of different compounds can be different; again, same
oxidant can produce different products at different concentrations and under different conditions.
Hence, it is necessary to develop standard oxidation conditions to obtain a comparable result
172
from the selected oxidants. The amount of oxidant utilized in the reactions can significantly
impact the formation of products. Hence, we used two fixed concentrations of all the oxidants, a
low concentration of 100 µM ([FA]:[oxidant] = 1:1) and a high concentration of 10.0 mM
([FA]:[oxidant] = 1:100) to react with 100 µM FA. A third intermediate concentration of
oxidants (1.00 mM) was also used for some of the oxidants. For the application of same strength
of all the oxidants, the number of electrons involved in the oxidation reaction was also
considered while deciding the oxidation concentrations. Above mentioned FA-oxidant
concentration ratio was used if the oxidant produced one electron in the reaction, and half of the
oxidant concentration was used if the oxidant produced two electrons in the reaction. Hence,
50.0 µM and 5.00 mM hydrogen peroxide and potassium peroxodisulphate, and 100 µM and
10.0 mM sodium hypochlorite, potassium ferricyanide, and sodium nitrite were used to react
with 100 µM FA. The reaction mixtures will be represented as low and high oxidant reaction
mixtures for further discussions. The main goal of the study was to develop a method for routine
analysis of FA for which long reaction time may not be suitable. Hence, a reaction time of 15.0
min was chosen for all the oxidative derivatization reactions of FA.
To confirm an effective oxidation of FA by any oxidant, we fixed two criteria. First, a new
fluorescent product must be observed by CE-LIF detection signifying the production of a
fluorescence derivative of FA such as 6-carboxypterin. Second, using CE-UV absorbance
detection, the peak due to FA should decrease to demonstrate decomposition of FA but not one
of the contaminant compounds in solution as a result of oxidation. If both requirements are met,
the oxidant can be considered as a viable reagent for quantitative derivatization of FA to produce
fluorescent products.
173
3.1. Oxidation of FA by sodium hypochlorite (bleach)
Sodium Hypochlorite (bleach) is a strong oxidizing agent; it is also used for cleaning purposes
because of its bleaching action. Day and Gregory [28] proposed a method for post column
oxidative derivatization of FA and its derivatives by calcium hypochlorite in acidic conditions
for HPLC analysis and claimed a successful oxidization to produce highly fluorescent pterin
compounds. Latter, Holt et al. [24] claimed to reproduce Day and Gregory’s result using sodium
hypochlorite as oxidant with HPLC analysis. But Hahn et al. [25] reported failure of the method
to oxidize FA into fluorescent product under acidic conditions. Our preliminary observation also
showed no fluorescent product under the acidic conditions but multiple fluorescent products at
pH 9.50. Hence, we performed an oxidative derivatization of FA in basic condition (pH 9.50) for
CE analysis. As mentioned in Section 2.2 the low and high oxidant reaction mixture of sodium
hypochlorite were prepared in 25.0 mM borate buffer at pH 9.50. After 15.0 min, the reaction
mixtures were injected in CE system for 5.0 s at 0.5 psi directly from the reaction vial and
separation was performed with 25.0 mM borate buffer at pH 9.50. The reaction mixtures were
analyzed by two different commercial CE systems one with UV absorbance detection and
another with LIF detection.
Figure 2 shows the electropherograms of oxidation reaction mixtures of sodium hypochlorite
with UV absorbance as well as LIF detection. The CE-UV absorbance electropherograms of
reaction mixtures in Figures 3A and 3B indicate a significant reaction of oxidant with FA. The
low oxidant reaction resulted in a 5.33× decrease in the FA peak area (Figure 3A) while the high
oxidant reaction consumed 100% of FA present in the solution (Figure 3B). In both Figures 3A
and 3B the first peak at 3.0 min is due to the neutral marker, mesityl oxide (NM).

174
Figure 2. Electropherograms of 100 µM FA with UV absorbance and LIF detection. Folic acid
was injected for 5.0 s at 0.5 psi, and the separation was performed in 25.0 mM borate buffer at
pH 9.50 at 417 V/cm. (A) FA with UV absorbance detection at 190 nm. The first peak at 3.0 min
is the neutral marker (mesityl oxide, NM), and the peak at 6.1 min is FA. The current was 14.5
µA. (B) FA with LIF detection and excitation using UV lines (351-364 nm lines) from an Ar+
laser filtered by a 355±20 nm bandpass filter and emission with a 450±40 nm bandpass filter.
The peak at 3.0 min is the neutral marker (coumarin 460, NM), and the other peaks at longer
migration times (labeled with *) are due to the compounds in FA sample. The current was 14.2
µA.
In Figure 3A, the peak at 6.0 min was confirmed as FA by the mobility comparison with a
control experiment (Figure 2A). The identity of the other minor peaks at 5.9, 6.1, and 6.2 min is
unknown until further study. Neither FA sample (Figure 2A) nor an injection of sodium
hypochlorite under similar conditions (data not shown) produce similar peaks. Hence, they must
be related to the FA reaction in some way. Figure 3B shows a 100% decomposition of FA, the
minor peaks near 6 min have negligible peak areas and none of them have same mobility as FA
peak in Figure 2A. The identity of a broad peak at 8.2 min is unknown and was not present in the
electropherograms of FA (Figure 2A) and an injection of oxidant only under identical conditions
(data not shown), but it was reproducible in each CE runs of the high oxidant concentration

175
reaction mixtures. Because of the unusual shape of the peak, it was not considered as a product
peak.
Figures 3C and 3D represent the CE-LIF electropherograms of low and high oxidant reaction
mixtures of FA and sodium hypochlorite. Both electropherograms show multiple fluorescent
peaks. In both the electropherograms the peak at 3.0 min are due to the neutral marker (coumarin
460, NM) and other peaks with higher migration times are due to the reaction mixtures. The
peaks that were present in the electropherograms of FA before oxidation (Figure 2B) are labeled
*, the peaks that were present before oxidation but increased due to oxidation are labeled *,I, and
such peaks that decreased are labeled *,D. Figure 3C, an electropherogram of low oxidant
reaction mixture, shows a significant increase in the two peaks (4.6 and 6.2 min) which are also
present in the electropherograms of FA before oxidation (Figure 2B). No new fluorescent peak
was produced but a 2.19× increase in the total fluorescence took place as a result of the oxidation
reaction. Figure 3D shows multiple fluorescence product peaks as a result of the oxidation of FA
by 10.0 mM sodium hypochlorite but there was only 1.14× increase in the total fluorescence.
Comparison of the electrophoretic mobility of the product peaks to the standards of 6-
carboxypterin indicates none of them as 6-carboxypterin, a common fluorescent derivative of
FA. 6-carboxypterin co-migrates with one of the peaks near 7.5 min (labeled *) in the
electropherograms of both oxidation reaction mixtures (Figures 3C and 3D) as well as the
electropherograms of FA sample (Figure 2B). This finding does not agree with the literature,
which states highly fluorescent pterin fragments as a major oxidation product when sodium
hypochlorite oxidizes FA [28].

176
Figure 3. Electropherograms of oxidation product of 100 μM FA by sodium hypochlorite
monitored with UV absorbance and LIF detection. The reaction mixture was injected after 15.0
min and the injection and separation conditions were identical to those in Figure 1. The first peak
at 3.0 min in all the electropherograms are neutral marker (coumarin 460 in LIF detection and
mesityl oxide in UV absorbance detection, NM). Peaks from the product of the reaction are
labeled P, the peaks that were present before oxidation (Figure 2) are labeled *, the peaks that
were present before oxidation but increased due to oxidation are labeled *,I, and such peaks that
decreased are labeled *,D. (A) FA sample was oxidized by 100 µM sodium hypochlorite
(bleach) at pH 9.50 and analyzed by CE-UV absorbance. The current was 14.0 µA. (B) FA
sample was oxidized by 10.0 mM bleach and analyzed by CE-UV absorbance. The current was
14.5 µA. (C) FA sample was oxidized by 100 µM bleach at pH 9.50 and analyzed by CE-LIF.
The current was 14.1 µA. (D) FA sample was oxidized by 10.0 mM sodium hypochlorite
(bleach) at pH 9.50 and analyzed by CE-UV absorbance. The current was 14.2 µA.

177
The substantial decrease in FA peak area in CE-UV absorbance in connection with the presence
of new fluorescence peaks in CE-LIF provides strong evidence that sodium hypochlorite
successfully oxidizes FA to fluorescent derivatives. Both the LIF and UV criteria set forth to
identify a successful oxidant are achieved by sodium hypochlorite, confirming it as an effective
oxidant for FA derivatization. Oxidation of FA by hydrogen peroxide in presence of copper (II)
chloride
Hydrogen peroxide is considered as one of the important and strongest oxidizing agent.
Hydrogen peroxide in presence of copper (II) ion has been reported to oxidize FA into a highly
fluorescent compound 6-carboxypterine [21, 22]. Hirakawa et al. also pointed out that the
oxidant cannot produce effective oxidation reaction in absence of copper (II) ion or in presence
of sodium hypochlorite instead [21]. According to Hirakawa et al. pH 7.60 is the best for the
oxidation reaction of sodium hypochlorite, but CE separation is better at higher pH. Hence, the
method was designed to conduct the oxidation reaction and the separation at pH 7.60 and 9.50
respectively, but minimize the effects of a mismatch (ionic strength, pH) between the reaction
buffer and separation buffer in order to obtain good CE separations. Folic acid is more soluble
and stable in basic solution [10]; hence, a stock solution (2.50 mM) of FA was prepared in 25.0
mM borate buffer (pH 9.50). This FA solution was diluted in 10.0 mM phosphate buffer at pH
7.60 and aqueous solution of hydrogen peroxide (8.80 mM) and copper (II) chloride (10.0 mM)
were added to the solution. The final concentrations of FA and copper (II) chloride were 300 µM
and 180 µM respectively, and hydrogen peroxide was 150 µM (low oxidant) or 15.0 mM (high
oxidant). A 500 µL aliquot of the reaction mixture was diluted 3× with 50.0 mM borate buffer at
pH 9.50 after 15.0 min and injected in CE system immediately. In the reaction mixtures the
concentration ratio of FA and hydrogen peroxide was 2:1 and 1:5 instead of 1:1 and 1:10 as in

178
other oxidants because hydrogen peroxide produces 2 electrons during the oxidation reaction.
This was done to use equal oxidation strength of all the oxidants studied to obtain comparable
results. The reaction mixtures were monitored with both CE-UV absorbance and CE-LIF
detection. No significant change was observed in the FA peak area in CE-UV absorbance
electropherograms of low oxidant reaction mixture, the FA peak area increased by 1.01× instead
of decreasing which could be due to the experimental error. But, there was a minor product peak
at 4.2 min (Figure 4A). It suggests that FA is either not reacting strongly with the low amounts of
oxidant or that the reaction requires more than 15.0 min to initiate. The CE-UV absorbance
electropherograms of high oxidant reaction of hydrogen peroxide shows a decomposition of a
moderate amount of FA with a 2.23× decrease in the FA peak area with production of multiple
minor product peaks (Figure 4B). These products could be a result of oxidation of FA or various
FA contaminants present in the solution.
In contrast to CE-UV absorbance electropherograms, the CE-LIF electropherograms of low
oxidant reaction mixture of hydrogen peroxide showed a significant increase (10.0×) in total
fluorescence intensity but no new peak was produced (Figure 4C). Similarly, high oxidant
reaction mixture displayed a significant increase in the intensity of the fluorescence peaks
present in the electropherograms of FA samples (27.4×) as shown in Figure 4D. In Figures 4C
and 4D also the peaks are labeled as in Figures 3C and 3D as discussed in Section 3.1. The peak
at 8.1 min in Figure 4C and 4D, which is labeled *,I as its intensity has increased as a result of
oxidation, co-migrates with the peak of 6-carboxypterin.

179
Figure 4. Electropherograms of oxidation reaction mixture of 300 μM FA and hydrogen
peroxide/Cu (II) chloride. The reaction mixture was prepared in 10.0 mM phosphate buffer at pH
7.60, and diluted 3× in 50.0 mM borate buffer at pH 9.50 after a reaction time of 15.0 min before
injecting for 5.0 s at 0.5 psi. The separation was performed with 50.0 mM borate buffer at pH
9.50 at 417 V.cm. The peak near 3.0 min in all the electropherograms are neutral marker
(coumarin 460 in LIF detection and mesityl oxide in UV absorbance detection, NM). All the
other peaks are from the compounds in reaction mixtures which are labeled as in Figure 3. (A)
FA sample was oxidized by 150 µM hydrogen peroxide in presence of 180 µM copper (II)
chloride at pH 9.50 and analyzed by CE-UV absorbance. The current was 20.6 µA. (B) FA
sample was oxidized by 15.0 mM hydrogen peroxide in presence of 180 µM copper (II) chloride
at pH 9.50 and analyzed by CE-UV absorbance. The current was 20.7 µA (C) FA sample was
oxidized by 150 µM hydrogen peroxide in presence of 180 µM copper (II) chloride at pH 9.50
and analyzed by CE-LIF. The current was 20.3 µA. (D) FA sample was oxidized by 15.0 mM
hydrogen peroxide in presence of 180 µM copper (II) chloride at pH 9.50 and analyzed by CE-
UV absorbance. The current was 20.4 µA.

180
Again, the electrophoretic mobility of the peaks at 8.1 min in Figure 4C and 4D (-3.97×10⁻⁴
cm2V
-1s
-1) are same as the electrophoretic mobility of a small product peak at 7.9 min in Figure
4B suggesting a small fraction of the FA decomposed during oxidation produced 6-
carboxypterin. It is consistent with the literature reporting 6-carboxypterin as a major product of
oxidation of FA with hydrogen peroxide/Cu (II) chloride [21, 22]. To confirm hydrogen
peroxide’s effective concentration for oxidative derivatization of FA, a third reaction was
performed using 500 μM oxidant (intermediate oxidant). The results from this additional reaction
were aligned closely with the data from the 50.0 μM oxidant (low oxidant) reaction. In
conclusion, hydrogen peroxide/Cu (II) chloride appears to react with FA significantly at high
concentrations with the formation of small amount of fluorescent product. These results suggest
that hydrogen peroxide/Cu (II) chloride could be a successful oxidant for FA at high
concentrations but not at low concentrations. This is an exciting result that FA can be at least
partially converted into a highly fluorescent compound, 6-carboxypterine as a result of oxidation
by hydrogen peroxide. The comparison of the peak areas of the peaks at 8.1 min in Figures 4C
and 4D with the peak areas of different concentrations of 6-carboxypterine suggests that only a
very small fraction of FA decomposed converted into 6-carboxypterine, suggesting it is not the
major oxidation product. This result suggests necessity of further optimization of the reaction
conditions before recommending hydrogen peroxide in presence of copper (II) chloride as a good
oxidant for FA.
3.2. Oxidation of FA by potassium peroxodisulphate
Potassium peroxodisulphate was selected as an oxidant for this study because Hahn et al. [25]
reported a successful oxidation of FA and its derivatives by peroxodisulphate. According to
Hahn et al. potassium peroxodisulphate was the only successful oxidant among many oxidants

181
studied including calcium hypochlorite [25]. In this study, oxidation reactions were performed
using the concentration ratio of FA and potassium peroxodisulphate 2:1 and 1:5 instead of 1:1
and 1:10 due to the similar reason explained in oxidation of FA by hydrogen peroxide in
presence of copper (II) chloride (Section 3.2). Both low and high oxidant reactions of potassium
peroxodisulphate were carried out at pH 9.50 and monitored with CE-UV absorbance as well as
CE-LIF detection under identical conditions. The electropherograms of oxidation reaction
mixtures of FA with both concentrations of potassium peroxodisulphate with UV absorbance
detection showed almost no changes in the amount of FA initially present in solution, and no
product peaks were detected (data not shown). The electropherograms showed an increase in CE-
UV peak areas of FA instead of decreasing by 1.01× in low oxidant reaction and by 1.05× in
high oxidant reaction (data not shown) which could be due to an experimental error or by the
oxidation of any reduced form of folate present in the sample to produce FA. Hence, the CE-UV
absorbance study indicates potassium peroxodisulfate cannot oxidize FA under the conditions
used in this study.
The CE-LIF electropherograms of low oxidant reaction of potassium peroxodisulfate showed no
change in any of the peaks from the FA sample (Figure 2B). The total fluorescence calculated
from the peak areas in the electropherograms decreased by 1.01× instead of increasing, which
could be due to an experimental error or due to the oxidation of fluorescent contaminants into
nonfluorescent FA. No new fluorescent products were detected. The CE-LIF electropherogram
of high oxidant reaction of potassium peroxodisulfate (Figure 5) shows a small change in the
peak area of one of the peaks at 4.6 min, labeled *,D, and formation of a minor product peak at
6.5 min, labeled P in Figure 5. There was a 1.39× increase in the total fluorescence intensity
calculated from the peak areas in the electropherograms (Figure 5) compared with the control

182
runs (Figure 2B). The decrease in one of the fluorescent peak and presence of small fluorescent
product peak in CE-LIF electropherograms of 5.00 mM oxidation reaction mixture indicates the
breakdown of one of the fluorescent impurities in the solution due to such a high oxidant
concentration. But both low and high concentrations of potassium peroxodisulphate could not
meet the criteria of effective oxidants set for this study. Hence, it was categorized as an
ineffective oxidant for FA under the conditions used for this study.
Figure 5. Electropherogram of oxidation of
100 µM FA with 5.00 mM sodium
peroxodisulphate with LIF detection. The
injection, separation, and detection conditions
are same as in Figure 2B and the peaks are also
labeled as in Figure 2B. The current was 14.4
µA. The peak at 3.0 min is due to the neutral
marker (NM, coumarin 460) while the other
peaks are from compounds in the reaction
mixture.
3.3. Oxidation of FA by potassium ferricyanide
Potassium ferricyanide was selected as an oxidant for this study because Chippel et al. [26]
reported formation of a small amount of pterins as a result of oxidation of FA and DHF by
potassium ferricyanide in a HPLC-UV absorbance study. Both low and high oxidant reaction
mixtures of potassium ferricyanide with FA were prepared and allowed to react for 15.0 min
before injecting in CE system for the analysis. The reaction mixtures were monitored with both
CE-UV absorbance and CE-LIF detection. The electropherograms of reaction mixtures of both
concentrations of potassium ferricyanide with CE-UV absorbance and CE-LIF detection showed
no change in any of the peak areas and no new peaks were observed (data not shown). The result

183
suggests inefficiency of potassium ferricyanide to fulfill any of the criterions of effective oxidant
in this study.
3.4. Oxidation of FA by sodium nitrite
Reed et al. [27] reported formation of N10
-nitrosofolic acid by the oxidation of FA with sodium
nitrite based on a HPLC-UV absorbance study. The authors also indicated that nitrous acid,
which is one of the compounds formed in acidic solution of nitrite, is a strong oxidizing agent
capable of oxidizing folates into pterine compounds [27]. The results were solely based on UV
absorbance detection with no clue about any fluorescent product in the oxidation reaction
mixture of FA. Hence, sodium nitrite was selected as an oxidant in this study. Reed et al. carried
out the oxidation reactions at pH 1.5 and 5.0 [27]. Hence, oxidation of FA with sodium nitrite
was carried out at pH 5.0 in this study and monitored with both CE-UV absorbance and CE-LIF
detection. Folic acid is more soluble and stable in basic pH [10] and CE separation is also better
at basic pH; hence, the method was designed to minimize the effects of a mismatch (ionic
strength, pH) between the reaction buffer and separation buffer in order to obtain good CE
separations. The reaction mixtures containing FA (300 µM) and sodium nitrite (300 µM and 30.0
mM) were initially prepared in a 25.0 mM acetate buffer at pH 5.00 and allowed to react for 15.0
min before diluting 3× in 50.0 mM borate buffer at pH 9.50. The diluted reaction mixture was
then injected in CE systems and analyzed with a 50.0 mM borate buffer at pH 9.50 as a
separation buffer. The reaction was monitored with both UV absorbance and LIF detection.
There was no change in the peak areas of FA in CE-UV absorbance electropherograms and no
significant product peaks in the reaction mixtures of both low and high oxidant concentrations.
But one small peak consistently appeared in the CE-UV electropherograms of high oxidant
reaction mixtures (Figure 6, labeled O) as well as control experiment with 10.0 mM sodium

184
nitrite. Hence, it was concluded as the oxidant peak. The CE-LIF electropherograms of both low
as well as high oxidant reaction mixtures produced no significant difference from the
electropherograms of FA in the control experiment under identical conditions. Hence, sodium
nitrite was concluded as inefficient to fulfill any of the effective oxidant criteria.
Figure 6. Electropherogram of oxidation reaction mixture of 300 µM FA with 30.0 mM sodium
nitrite in 25.0 mM acetate buffer at pH 5.00 with UV absorbance detection at 190 nm. The
mixture was allowed to react for 15.0 min before diluting 3× in 50.0 mM borate buffer at pH
9.50. The diluted reaction mixture was then injected for 5.0 s at 0.5 psi and separation was
performed with a 50.0 mM borate buffer at pH 9.50 at 417 V/cm. The current was 25.9 µA. The
peak at 3.2 min is due to neutral marker (NM, mesityl oxide). The peak at 7.2 and 8.0 min are
from FA and sodium nitrite respectively.
4. Conclusions
Folic acid does not exhibit native fluorescence and cannot be detected with LIF. Many literature
reports suggest that FA can be oxidatively derivatized to a highly fluorescent product to enable
successful LIF detection. Hence, five different oxidants were selected from the literature to test
their comparative effectiveness at converting FA to a LIF detectable product. An oxidant was
deemed successful if it produced a new fluorescent product detected with LIF and indicated an

185
associated decrease in FA with UV absorbance. The oxidants used were sodium hypochlorite,
hydrogen peroxide in presence of copper (II) chloride, potassium peroxodisulfate, potassium
ferricyanide, and sodium nitrite. Low concentration (100 µM) as well as high concentration (10.0
mM) of the oxidants were reacted with 100 µM FA. Of these five oxidants, only sodium
hypochlorite and hydrogen peroxide in presence of copper (II) chloride succeeded in meeting
both standards for effective oxidation of FA. Both concentrations of sodium hypochlorite and
only high concentration of hydrogen peroxide/Cu (II) chloride were successful to oxidize FA.
Other three oxidants were proved to be ineffective oxidants for FA under the conditions used for
this study. The ratio of increase in the total fluorescence and decomposition of FA as a result of
oxidation was much higher for hydrogen peroxide/copper (II) chloride (12.3) for higher oxidant
concentration than sodium hypochlorite (0.411) for lower oxidant concentration. Hence,
hydrogen peroxide/copper (II) chloride can be considered as better oxidizing agent among the
two effective oxidants. But, it is still too early to classify them as a definitive method of FA
detection. The ratio of increase in total fluorescence and FA decomposition observed in this
study does not indicate total conversion of FA into highly fluorescent product, 6-carboxypterine.
Further study needs to optimize the reaction conditions for the complete oxidation/conversion of
FA into desired fluorescent product. This study shows a successful application of CE in the
analysis of FA and in development of more selective detection techniques with lower detection
limit.
Acknowledgements
The authors would like to thank Rachel Henken for her valuable advice and guidance in this
project. The authors also would like to acknowledge Funda Kizilkaya, Sherrisse Bryant, and
Ryan Picou for their contributions to this work.

186
References
1. Wills, L., Treatment of "pernicious anaemia of pregnancy" and "tropical anaemia" -
With special reference to yeast extract as a curative agent. Brit. Med. J., 1931. 1: p.
1059-1064.
2. Angier, R.B., et al., The structure and synthesis of the liver L-casei factor. Science, 1946.
103(2683): p. 667-669.
3. Quinlivan, E.P., A.D. Hanson, and J.F. Gregory, The analysis of folate and its metabolic
precursors in biological samples. Anal. Biochem., 2006. 348(2): p. 163-184.
4. Mitchell, H.K., E.E. Snell, and R.J. Williams, The concentration of "folic acid". J. Am.
Chem. Soc., 1941. 63: p. 2284-2284.
5. Iyer, R. and S.K. Tomar, Folate: A Functional Food Constituent. J. Food Sci., 2009.
74(9): p. R114-R122.
6. Smith, A.D., Y.I. Kim, and H. Refsum, Is folic acid good for everyone? Am. J. Clin.
Nutr., 2008. 87(3): p. 517-533.
7. Scott, J., F. Rebeille, and J. Fletcher, Folic acid and folates: the feasibility for nutritional
enhancement in plant foods. J. Sci. Food Agric., 2000. 80(7): p. 795-824.
8. Cheung, R.H.F., P.J. Marriott, and D.M. Small, CE methods applied to the analysis of
micronutrients in foods. Electrophoresis, 2007. 28(19): p. 3390-3413.
9. Nelson, B.C., The expanding role of mass spectrometry in folate research. Curr. Anal.
Chem., 2007. 3(3): p. 219-231.
10. Arcot, J. and A. Shrestha, Folate: methods of analysis. Trends Food Sci. Technol., 2005.
16: p. 253-266.
11. Landers, J.P., Capillary and microchip electrophoresis and associated microtechniques.
Third ed. 2008, New York: CRC Press. 3-74.
12. Gilman, S.D. and M.J. Sepaniak, Capillary electrophoresis techniques in biomedical
analysis. Biomed. Photonics Handb., 2003: p. 24/1-24/27.
13. Regmi, S.C., A.L. Phipps, and S.D. Gilman, Analysis of folic acid using capillary
electrophoresis with UV absorbance and laser-induced fluorescence detection. Analyst,
2012. X(X): p. X.
14. Regmi, S.C., et al., Fluorescence of Folic Acid Samples Studied by Capillary
Electrophoresis. Appl. Spectrosc., 2012. XX(XX): p. XX.
187
15. Vahteristo, L.T., et al., Improvements in the analysis of reduced folate monoglutamates
and folic acid in food by high-performance liquid chromatography. J. Agric. Food
Chem., 1996. 44(2): p. 477-482.
16. Gregory, J.F., D.B. Sartain, and B.P.F. Day, Fluorometric-determination of folacin in
biological-materials using high-performance liquid-chromatography. J. Nutr., 1984.
114(2): p. 341-353.
17. Tyagi, A. and A. Penzkofer, Fluorescence spectroscopic behaviour of folic acid. Chemi.
Phys., 2010. 367(2-3): p. 83-92.
18. Thomas, A.H., et al., Fluorescence of pterin, 6-formylpterin, 6-carboxypterin and folic
acid in aqueous solution: pH effects. Photochem. Photobiol. Sci., 2002. 1(6): p. 421-426.
19. Blanco, C.C., et al., Micellar-ehnanced synchronous-derivative fluorescence
determination of derivatization of derivatized folic-acid in pharmaceutical preparations.
J. Pharm. Biomed. Anal., 1995. 13(8): p. 1019-1025.
20. Blanco, C.C., et al., Fluorometric-determination of folic-acid based on its reaction with
the fluorogenic reagent fluorescamine. Anal. Lett., 1994. 27(7): p. 1339-1353.
21. Hirakawa, K., Fluorometry of hydrogen peroxide using oxidative decomposition of folic
acid. Anal. Bioanal. Chem., 2006. 386(2): p. 244-248.
22. Wang, Y., et al., Synchronous Fluorescence as a Rapid Method for the Simultaneous
Determination of Folic Acid and Riboflavin in Nutritional Beverages. J. Agr. Food
Chem., 2011. 59(23): p. 12629-12634.
23. Hirakawa, K., et al., Sequence-specific DNA damage induced by ultraviolet A-irradiated
folic acid via its photolysis product. Arch. Biochem. Biophys., 2003. 410(2): p. 261-268.
24. Holt, D.L., R.L. Wehling, and M.G. Zeece, Determination of native folates in milk and
other dairy-products by high-performance liquid-chromatography. J. Chromatogr., 1988.
449(1): p. 271-279.
25. Hahn, A., et al., Optimized high-performance liquid-chromatographic procedure for the
separation and quantification of the main folacins and some derivatives. J. Chromatogr.,
1991. 540(1-2): p. 207-215.
26. Chippel, D. and Scrimgeo.Kg, Oxidative degradation of dihydrofolate and
tetrahydrofolate. Can. J. Biochem., 1970. 48(9): p. 999-1009.
27. Reed, L.S. and M.C. Archer, Action of sodium-nitrate on folic-acid and tetrahydrofolic
acid. J. Agric. Food. Chem., 1979. 27(5): p. 995-999.

188
28. Day, B.P. and J.F. Gregory, Determination of folacin derivatives in selected foods by
high-performance liquid-chromatography. J. Agr. Food. Chem., 1981. 29(2): p. 374-377.
29. Huang, J.C., et al., A novel fluorescent method for determination of peroxynitrite using
folic acid as a probe. Talanta, 2007. 72(4): p. 1283-1287.

189
VITA
Suresh Chandra Regmi was born in Parbat, Nepal. He grew up and studied up to high
school in Chitwan, Nepal. He graduated from Tribhuwan University, Nepal with a Master of
Chemistry degree in 1994. After that, he worked as an assistant lecturer in Tribhuwan University
for 12 years. Suresh graduated with Master of Chemistry degree from East Tennessee State
University in 2006. He then attended Louisiana State University, where he is pursuing a
Doctorate degree in Chemistry.


![fulir.irb.hrfulir.irb.hr/4029/1/Binding of p-mercaptobenzoic acid _sa... · Web viewOriginally the effect was studied first in colloidal silver [10] and gold nanoparticles aggregates](https://img.dokumen.tips/doc/110x75/6134fd1bdfd10f4dd73c1541/fulirirb-of-p-mercaptobenzoic-acid-sa-web-view-originally-the-effect-was.jpg)