Embed Size (px)
Citation preview

1
Analysis of pharmaceutical compounds from glass,
fabric, steel and wood surfaces at atmospheric pressure
using non-resonant femtosecond laser vaporization,
electrospray mass spectrometry
Elizabeth J. Judge, John J. Brady, David Dalton, Robert J. Levis*
Temple University Department of Chemistry
1901 N 13th Street, Philadelphia, Pennsylvania 19122
Laser electrospray mass analysis (LEMS) is demonstrated for pharmaceutical samples at atmospheric
pressure. A non-resonant, femtosecond duration laser pulse vaporizes native samples at atmospheric
pressure into an electrospray ionization source for transfer into a time-of-flight mass spectrometer. Mass
spectra were obtained for microgram amounts of the pharmaceutical compounds loratadine, oxycodone
and atenolol deposited on glass, wood, steel and polyester fabric. The active ingredients in intact
pharmaceutical pills were also detected in the presence of binders and fillers in an intact pill formulation
using LEMS. The neutral capture efficiency by the electrospray plume for non-resonant laser
vaporization of oxycodone and atenolol desorbed from steel is 2.3 % ± 1.5 % and 0.25 % ± 0.18 %,
respectively.

2
The forensic detection and analysis of narcotics and pharmaceuticals currently employs methods
that include high performance liquid chromatography (HPLC), gas chromatography (GC), thin layer
chromatography (TLC), UV spectrophotometry, and electrophoresis.1 In the traditional forensics
approach, the substance of interest must be transferred from the native material and or surface via a
swab or elution prior to chemical analysis. Although the current methods for drug analysis work very
well for separating, identifying and quantifying compounds, they remain time consuming, require
substantial sample preparation and are often not suited to trace analysis.
Direct analysis of a contaminated surface would eliminate the use of swabs or solvent elution for
sample collection facilitating higher signal to noise ratio (S/N) and thus decreasing the probability for a
false negative result. Several new techniques permit the direct detection of trace quantities from native
surfaces and complex matrices. One such detection method is desorption electrospray ionization (DESI),
a technique that uses electrospray generated droplets directed at a surface to analyze native sample
under ambient conditions. DESI has been used, for instance, to detect trace amounts of explosives on
paper, cloth, brick, metal and skin. 2,3
The use of resonant laser desorption for ambient mass spectrometry is a rapidly growing field of
research that is amenable to direct analysis of samples under certain circumstances. Laser-assisted
electrospray ionization, LAESI, uses a resonant nanosecond infrared laser to excite the OH vibration in
water causing the water molecules to undergo a phase explosion to eject materials into the gas phase.4
Many experiments have been performed using water-rich samples including the detection of the
antihistamine fexofenadine in urine and blood.5 Plant tissue has also been analyzed using LAESI.6
Matrix-assisted laser desorption electrospray ionization (MALDESI) uses an ultraviolet laser in
resonance with the matrix molecule, co-crystallized with the sample of interest, to transfer the sample
into the gas phase. MALDESI has been used to analyze peptides and proteins ranging in mass from 1 to
8.6 kDa.7, 8 Both of these techniques have sample requirements for successful analysis. LAESI requires
the sample to be water rich, or to be sprayed with water before analysis, while MALDESI requires a

3
matrix to first be mixed with the sample and deposited onto a surface before analysis can be initiated.
LAESI and MALDESI also require solubility in polar matrices. Finally, in both methods, a laser of a
specific frequency is required to induce the necessary resonant transition to couple the laser light into
the analyte system.
Electrospray laser desorption ionization (ELDI) is another ambient mass spectrometry technique
that is amenable to direct sample analysis in some cases. ELDI employs a nanosecond UV laser to
desorb sample prior to electrospray ionization and at least one component of the sample must resonantly
absorb the UV radiation to induce desorption. Dried biological fluids such as tears, saliva, blood and
serum9 have been analyzed using this technique. Nanosecond ELDI has also been applied to drug
tablets, porcine brain tissue, and milk, as well as the surface of a compact disc.10 Separations of dyes,
amines, and drug tablet extracts (using thin layer chromatography) have also been subjected to ELDI
analysis.11,12
We report here the application of a new, non-resonant laser desorption mass spectrometry
method to analyze pharmaceutical samples. This method combines femtosecond laser vaporization with
electrospray ionization to perform mass spectral analysis of samples at atmospheric pressure with the
potential for short analysis time and detection of trace quantities from native samples.13 Since the laser
non-resonantly couples into all molecules, sample preparation (elution, mixing with matrix, and
choosing samples with a particular absorption spectrum) are essentially eliminated in all systems
investigated so far. Two implementations of this method have been demonstrated previously,
femtosecond electrospray laser desorption ionization (fs-ELDI) and femtosecond matrix-assisted laser
desorption electrospray ionization (fs-MALDESI).13 In those investigations, atmospheric pressure
vaporization of a series of both pure and matrix bound polar and nonpolar biomolecules was
demonstrated for molecules up to m/z = 1355 amu (vitamin B12) with post-vaporization ionization
occurring in the electrospray plume. The general class of methods combining femtosecond non-resonant

4
laser vaporization with electrospray ionization mass spectrometry may be called laser electrospray mass
spectrometry (LEMS).
Femtosecond laser sources have been receiving increasing attention as a source for mass
spectrometry.14 The coupling mechanism between an intense femtosecond laser and a molecule is an
active area of investigation15-17 and the ultrafast excitation results in quantitatively different
fragmentation pathways in comparison with nanosecond excitation.17, 18, 19 In gas phase laser ionization
experiments, nanosecond laser pulses cause more fragmentation in comparison with femtosecond laser
pulses at comparable intensities. This is due to the ladder switching mechanism and thermal heating of
the sample in the nanosecond experiment.20 The use of shorter duration laser pulses typically increases
the amount of parent relative to fragment ions,21 which is advantageous in the analysis of complex
samples where peak assignment in congested mass spectra can be arduous. In the LEMS technique an
intense femtosecond laser13 is used to non-resonantly couple into any molecular system resulting in
vaporization without the need for a matrix. The coupling mechanism presumably involves non-resonant
multiphoton excitation to various electronic states followed by a MALDI-like phase explosion. This
eliminates sample preparation and broadens the range of samples that can be analyzed since neither
resonance, matrix, nor water rich samples are required, providing what appears to be a universal
molecular vaporization and analysis method.
We investigate here the direct analysis of pharmaceutical formulations in tablet and pure form to
explore the effects of commercial binders and fillers on the vaporization and mass spectral detection
process. The LEMS analysis of drug molecules on materials including glass, steel, fabric and wood
using LEMS is investigated as a means to interrogate trace samples on real world substrates. Finally, we
determine the neutral capture efficiency of LEMS for the molecules atenolol and oxycodone adsorbed
on a steel surface using calibrated electrospray ionization experiments.
5
EXPERIMENTAL SECTION
Sample Preparation The three pharmaceutical drugs used in this study are loratadine,
oxycodone, and atenolol. Loratadine is the active ingredient in Claritin, an antihistamine formulated as a
solid pill containing 10 mg of Ethyl 4-(8-chloro-5,6-dihydro-11H-benzo [5,6] cyclohepta [1,2-b]
pyridin-11-ylidine)-1-piperidinecarboxylate. Oxycodone (4,5α-epoxy-14-hydroxy-3-methoxy-17-
methylmorphinan-6-one) is the active ingredient in Oxycontin and Percocet and was obtained in the
powdered base form.22 Atenolol is a β-blocker formulated as a solid pill containing 50 mg of
atenolol((RS)-2-{4-[2-hydroxy-3-(propan-2-ylamino)propoxy]phenyl}acetamide). To investigate the
detection of trace amounts of the active drugs on various surfaces, a Claritin pill was dissolved in 50/50
water/acetonitrile to obtain a concentration of 2.6 x 10⁻⁴ M of loratadine. A 1.33 x 10⁻⁴ M solution of
oxycodone was prepared by diluting 4.2 mg of oxycodone in 50/50 water/acetonitrile. A solution of 1.7
mg of pure atenolol (Spectrum Chemical, Gardena, CA, USA) and 50/50 water (Fisher Scientific, Fair
Lawn, NJ, USA)/acetonitrile (Fisher Scientific, Fair Lawn, NJ, USA) was prepared at a concentration of
1.28 x 10⁻⁴ M and a 50 µL aliquot was placed on various surfaces including steel, glass, fabric and
wood. The solutions were deposited using a micro-pipet over an area of 10-160 mm2, depending on the
sample and surface material. The wood substrate dispersed the solution over a larger area than glass and
steel, presumably due to hydrophilic interaction with the solvent. The solution deposited onto the glass
and steel substrates tended to bead and dry in a smaller area. The sample plate holder was translated
using an XY stepper motor-driven stage during the data acquisition to ensure fresh sample was available
for each laser vaporization event.
The samples employed in the neutral capture efficiency experiment were pure atenolol and
oxycodone having concentrations of 1.28 x 10⁻⁴ M and 1.33 x 10⁻⁴ M, respectively. A 50 µL aliquot of
each dilution was placed on steel sample plates (12-60 mm2) for LEMS analysis.

6
Mass Spectrometry The mass spectrometry apparatus combines non-resonant laser vaporization
with an ESI source for ionizing and transferring desorbed sample into a vacuum chamber where pulsed
deflection orthogonal time-of-flight (o-TOF) mass spectrometry was performed. The ESI source
(Analytica of Branford, Inc., Branford, CT, USA) was operated in positive ion mode and consisted of a
needle, dielectric capillary, skimmer, and two hexapole systems. The needle was maintained at ground
while the voltage on the inlet capillary was adjusted until a stable ion current/signal was established,
typically at -5300 V. The acidified electrospray solvent (1% acetic acid, 50/50 acetonitrile/water) was
pumped through the needle at a flow rate of 2 µl/min. The ESI plume was dried by counter current
nitrogen gas at 180o C before entering the dielectric capillary. A more detailed description of the
apparatus has been reported elsewhere.13
Vaporization and Ionization Apparatus A Ti:sapphire laser system operating at 10 Hz, 800
nm central wavelength, 400 µJ per pulse with 70 femtosecond pulse duration, was used to vaporize the
samples. Figure 1 shows a schematic of the vaporization and ionization apparatus. The laser was
focused to a spot size of 295 µm in diameter for steel surfaces and 190 µm in diameter for glass, cloth,
and wood surfaces. The vaporization beam was focused using a 17.5 cm focal length lens, with an
incident angle of 45o with respect to the sample surface to provide an intensity of ~1013 Wcm-2. The
steel sample holder was biased to -2.0 kV to compensate for distortion of the electric field between the
needle and capillary caused by the introduction of the sample stage. The vaporized sample was ejected
perpendicular to the electrospray plume. The electrospray plume serves to capture, ionize and transport
the ions through an inlet capillary followed by three regions of differential pumping leading to the high
vacuum region for mass analysis. An ESI solvent background was measured before each LEMS
measurement to enable subtraction of solvent-related peaks. Mass spectra were averaged for 5 seconds
(50 laser shots).

7
SAFETY CONSIDERATION
Appropriate laser eye protection was worn by all personel and high voltage area was enclosed in
plexiglass to prevent accidental contact with the biased electrodes.
RESULTS AND DISSCUSSION
Femtosecond LEMS of Claritin and Atenolol Pills
To determine the ability of LEMS to directly analyze pharmaceutical samples in pill formulation
containing binders and fillers, we placed a Claritin tablet directly onto the sample plate holder and
subjected the sample to LEMS. The mass spectrum of the intact tablet is shown in Figure 2a. The
protonated parent ion of loratadine, the active ingredient in Claritin, is observed with m/z = 383 and 385
in the mass spectrum of the Claritin pill. While not fully resolved, the 3:1 peak intensity ratio is
consistent with the expected isotope distribution for the chlorine atom in the loratadine structure. Other
peaks observed in the spectrum of Claritin include fragments of loratadine ions and inactive ingredients
(magnesium stearate and lactose monohydrate). The peaks at m/z = 253, 267, and 281 are separated by
14 mass units, and are attributed to the loss of CH2 from the stearate anion. Lactose monohydrate is also
present at m/z 361. In loratadine, three peaks are tentatively assigned to the ethyl-1-
piperidinecarboxylate fragment at m/z 155 and the isotopic peaks of the 8-chloro-6, 11-dihydro-5H-
benzo[5,6]cyclohepta[1,2-b]pyridine fragment at m/z = 227 and 229. Other peaks seen in the spectrum
are consistent with literature reports such as [MH-OCH2CH3]+ at m/z = 337 and 33923 and [MH-Cl]+ at
m/z = 349.24 This experiment establishes the ability of LEMS to laser vaporize and mass
spectrometrically detect the molecular components of pills containing multiple compounds with no
sample preparation or matrix deposition.
As a second example of a direct LEMS analysis of a commercial formulation, an Atenolol tablet
was placed on the sample plate holder and interrogated. The mass spectrum of the Atenolol tablet is
shown in Figure 2b. The protonated molecule of the atenolol molecule is observed with m/z = 267. The
8
sodium adduct of atenolol can also be seen at m/z = 289 in the spectrum. The peak at m/z = 116 is
consistent with fragmentation of atenolol at the ether bond to produce C6H14NO+. The detection of
protonated loratadine and atenolol molecules demonstrates that LEMS can be used for rapid
discrimination of drugs in tablet form without further sample preparation.
LEMS of trace amounts of Claritin on different surfaces
There is an increasing need to rapidly identify trace molecules, including pharmaceuticals, on
various surfaces for forensic analysis. To investigate the use of LEMS as a means to detect trace
amounts of pharmaceuticals on various surfaces, 50 µl of the 2.6 x 10⁻⁴ M solution of Claritin was
deposited on wood, steel, glass, and fabric (sample area 60-160 mm2) for LEMS analysis. As will be
seen, the Claritin sample dries in a larger, more uniform area than the atenolol or oxycodone,
presumably due to the binders and fillers present. This even coverage provides a more stable ion signal
in comparison with pure compounds. The total sample applied to each surface was 1.57 μg.
Approximately 750 pmol of Claritin was vaporized during the 50 laser shot acquisition. Figure 3
displays the mass spectrum measured for protonated loratadine on wood, steel, and glass. Claritin had
the highest signal intensity on wood in comparison with the other pharmaceutical molecules
investigated, Figure 3a. Perhaps the excess of binders and fillers present in Claritin modulates surface
effects and penetration into the wood substrate. The isotopic features of loratadine at m/z = 383 and 385
are not fully resolved in the trace detection experiments, rather the features merge to a peak at m/z =
384. The sodium adduct of loratadine at m/z = 406 can be seen on the steel surface, Figure 3b and the
parent ion can be seen on the glass surface, Figure 3c. Claritin was then deposited on the different
fabrics and subjected to LEMS analysis. Loratadine had a negligible signal on cloth and was not
detected consistently on any of fabrics, although ~10% of the laser shots revealed signal on the white
fabric. Unlike atenolol and oxycodone, loratadine was obtained by dissolving a Claritin tablet into
solution, and was the only pharmaceutical that was not used in its pure form. The lower signal on fabric
9
may also be due to the presence of pores, larger in size than those found in wood, allowing the sample to
permeate into the cloth substrate. The vaporization of loratadine from porous surfaces such as wood,
demonstrates a new release technology for substances adhered to shipping crates. This is significant
since the increase of illegal transport of weapons and drugs on cargo ships requires the development of
systems that are able to detect signature molecules on shipping crates and luggage.25
LEMS of trace amounts of Oxycodone on different surfaces
Laser vaporization of pure pharmaceutical molecules was investigated from surfaces including
wood, steel, glass, and fabric. In these experiments, 4.2 mg of oxycodone was diluted to 1.33 x 10⁻⁴ M in
100 mL of 50/50 water/acetonitrile by volume. A 50 µl aliquot of this solution was deposited on to 10-
120 mm2 on each surface and allowed to dry. This distributed 5 nmol of oxycodone over the area and
approximately 650 pmol were vaporized during the acquisition as estimated from the surface coverage
and the number of laser shots. Figure 4a-c shows the mass spectrum acquired after 50 laser shots on
wood, steel and glass, respectively. Oxycodone (M+H+, m/z = 316) has the highest signal intensity on
the steel surface followed by glass and then wood. The peak at m/z = 298 is consistent with the loss of
water from the protonated parent ion. The sodium adduct of oxycodone at m/z = 338 can be seen when
the molecule is vaporized from the steel and glass surfaces, Figure 4b-c.
The ability of LEMS to detect pure pharmaceuticals from highly porous materials was
investigated using white, red and black polyester fabric. Figure 5a shows representative spectra resulting
from LEMS analysis of oxycodone from each of the fabrics. White fabric has the highest parent ion
signal followed by red, and then black fabric, as illustrated in Figure 5b. The differences in the signal
intensity is likely due to a combination of the porosity, polarizability, and charging of a given surface.
The polarity of the polyester backbone presumably forms a strong interaction with oxycodone that is not
present on the glass or steel surface. The dye used to color the fabric, for example, the carbon black used
in black fabric, will provide additional strong interactions that may serve to further decrease
10
vaporization efficiency. As seen in Figures 4 and 5, the parent molecular ion for oxycodone is detected
for glass, metal, wood and fabric substrates. This suggests that laser vaporization will occur from a
variety of surfaces when non-resonant femtosecond vaporization is employed as the release method and
that LEMS may form the basis of a nearly universal detection method for large organic molecules.
LEMS of trace amounts of atenolol on different surfaces
To investigate the detection of trace amounts of atenolol on various surfaces, 50 µl of the 1.28 x
10-4 M solution was deposited on wood, steel, glass, and fabric with sample coverage area ranging from
12-160 mm2. The total sample applied was 1.33 μg. Approximately 425 pmols of atenolol was
vaporized during the 50 laser shot acquisition to produce the measured mass spectra. Figure 6 shows
representative mass spectra of protonated atenolol on wood, steel, and glass. The parent ion can be seen
at m/z = 267 on all three surfaces. The sodium adduct at m/z = 289 can be seen on the steel surfaces,
Figure 6b. Figure 7a shows the detection of atenolol on white, red, and black polyester fabric. The
signal intensity on both wood and fabric are both lower compared to the signal from oxycodone on these
materials. Atenolol is more polar than oxycodone and an enhanced interaction with the substrate
material may account for the reduced atenolol signal, particularly in the case of the polar cellulose
matrix composing the wood substrate. Oxycodone, which is less polar than atenolol, will have weaker
interactions with the cellulose matrix, presumably facilitating vaporization. The same may be true for
the reduced parent ion signal for atenolol on fabric. Protonated atenolol was not detected on the
different colored fabrics but the sodium adduct of atenolol can be seen on all three fabrics, Figure 7b.
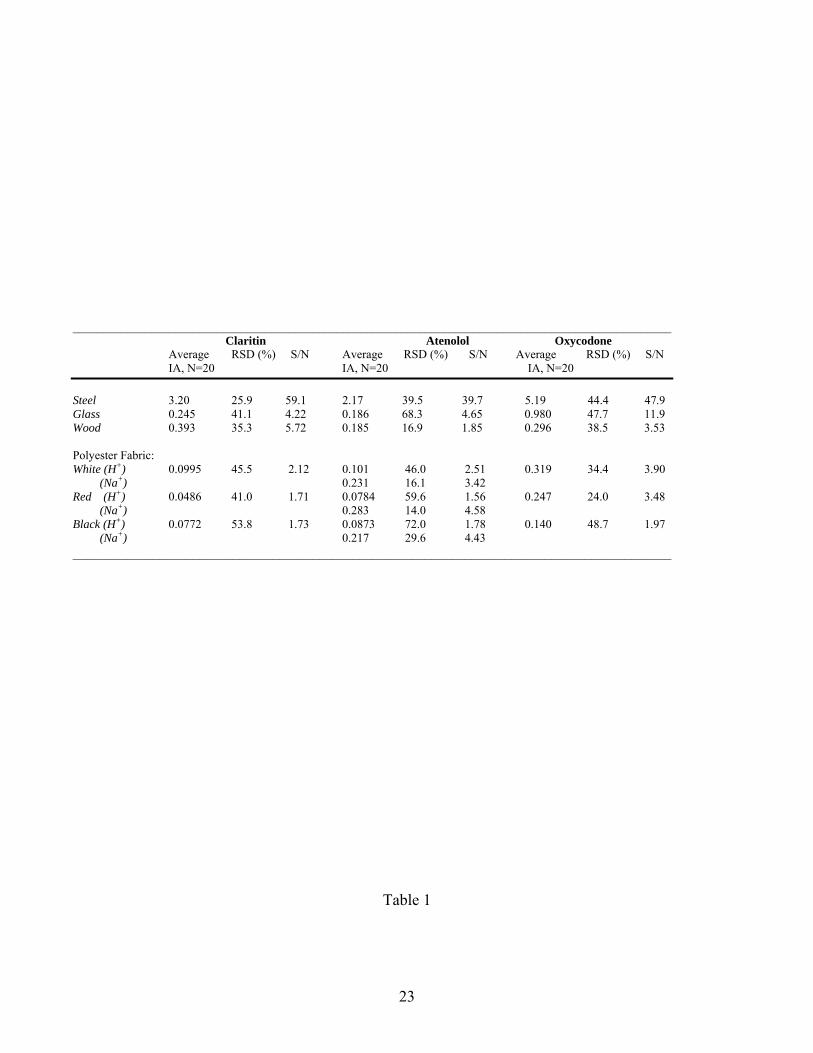
Table 1 shows the statistical analysis of the mass spectra measured for twenty LEMS
experiments on each surface. The average integrated area (IA) is calculated as well as the relative
standard deviation (RSD%). The RSD% was determined by dividing the standard deviation (x100) by
the mean. We define the signal-to-noise (S/N) threshold for signal as being greater than three. Claritin
tends to have lower RSD%, compared to atenolol and oxycodone, and this may be due to the binders
11
and fillers present in the solution producing more uniform samples, as mentioned before. The ability of
LEMS to detect pharmaceuticals on glass and steel is high compared to the detection on wood and cloth.
The sodium adduct of atenolol makes the detection on cloth possible. Claritin was not detected on the
polyester fabric while oxycodone was detected on both the white and red fabric. The relative standard
deviation is high for all the surfaces because of the variability in sample preparation from the spot and
dry method. The deviation occurs from sample preparation rather than fluctuations in laser intensity,
electrospray or mass spectrometry. The sample preparation method results in different amounts of
sample ablated from position to position on a sample. Therefore, the RSD% for LEMS experiments are
not comparable to the RSD% of traditional analysis techniques where a consistent amount of sample is
analyzed for each experiment. However, this reflects samples that are found in real life applications.
The RSD% of our experimental data gives us an indication of the signal intensity expected from
these surfaces. We note that the steel substrate provides the highest signal intensity for all the molecules
investigated. This may result from the steel optimally compensating for the distortion of the electrospray
needle-inlet capillary extraction field. Dielectrics (glass) and polymer-based substrates (fabric and
wood) will develop patch charging and have ill-defined field lines due to their non-conducting nature.
Neutral Capture Efficiency
To determine the neutral capture efficiency (NCE) of vaporized molecules transferred from the
substrate into the electrospray system, the signal arising from LEMS for a known quantity of sample
was compared to the calibrated signal arising from direct electrospray mass spectrometry (ESI-MS)
measurements. A 50 µL aliquot of each 10-4 M sample of either atenolol or oxycodone was deposited on
a steel surface to cover an area ranging from 12-30 mm2 for LEMS analysis. Direct ESI-MS
measurements were recorded to calibrate the electrospray-mass spectrometer instrument response
function to calculate the neutral capture efficiency. The neutral capture efficiency is given by:

12
LEMSESI
ESILEMS
molesImolesI
NCE××
= (1),
where ILEMS is the integrated signal intensity for the LEMS measurement, molesESI is the amout of
sample consumed for the ESI measurement, IESI is the integrated signal intensity for the direct ESI-MS
measurement and molesLEMS is the amount of sample consumed for the LEMS measurement. Two
assumptions were made in determining the neutral capture efficiency. The first assumption is that all of
the captured neutrals have the same probability to be ionized and detected in comparison with sample
that has been dissolved in the electrospray solution. This may not be a valid assumption if clusters are
vaporized and the clusters do not have sufficient time to dissolve into the droplet solution before the
ions enter the vacuum region. The second assumption is that 100% of the adsorbed molecules in the
laser interaction region are vaporized. Both of these assumptions serve to make the NCE determined
here a lower limit.
To calculate neutral capture efficiency we compared the signal intensity of the electrospray
spectrum to the LEMS spectrum for the same initial concentration of sample molecule. In this
concentration range, the area under the peak is considered proportional to the concentration of the
sample. The total moles consumed for the ESI-MS measurement is given by:
fCtmolesESI = (2)
where f is the flow rate (2 µL/min), C is the concentration (10-4 M) and t is the analysis time (5
seconds). In the calibration experiment, 21.3 pmol of atenolol were consumed for the electrospray mass
spectrum. The determination of the sample consumed for LEMS is complicated by the fact that after
deposition on the steel surface, the dried sample is not deposited uniformly in the sample area, but tends
to dry with the majority of molecules contained in a ring. Therefore, the assumption of uniform sample
per unit area is not valid. Rather, we determined the amount of sample dried in, and vaporized from, the
rings. To determine the amount of sample dried in the ring, a magnified picture of the sample slide was
taken using a low power microscope. The picture of the sample was then imported into an image
13
software program (ImageJ) to integrate both the number of black pixels (representing sample) and white
pixels (representing the stainless steel substrate) in the area where sample was deposited. The amount of
sample found only in the ring can then be determined by restricting the integration to the area containing
sample, the black pixels. This provides the area of the sample ring. After the sample was vaporized
using LEMS (after five seconds of raster scanning), a second image of the sample was recorded. The
amount of ablated sample is determined by comparing the amount of sample before and after
vaporization. For the LEMS measurement of atenolol (1.28 x 10⁻⁴M) 0.5-1 nmol was vaporized from the
steel surface. Given the ratio of the signal intensity for ESI-MS and LEMS measurements, we conclude
that not all of the molecules desorbed with femtosecond pulses are captured in the ESI plume. Neutral
capture efficiencies for oxycodone and atenolol on steel are 2.39 ± 1.53% and 0.25 ± 0.18 %,
respectively. The neutral capture efficiency of 0.02% has been reported for nanosecond MALDESI of
10-4M ubiquitin using a matrix on stainless steel substrates.7 This calculation was based on the amount
of material spotted, the size of the spot, the laser spot size, the number of laser shots, and the absolute
abundance of ubiquitin relative to its corresponding nano-ESI spectra. We have demonstrated neutral
capture efficiencies as high as 2.39 % using femtosecond pulses without applying an external matrix.
This suggests that intact, neutral molecules are efficiently vaporized using femtosecond lasers in
comparison with nanosecond lasers since the NCE ranges from twelve to one hundred times higher.
CONCLUSIONS
We have demonstrated that non-resonant, femtosecond laser vaporization is a new release
technology for detecting pharmaceutical molecules that may be found on glass, wood, steel, and fabric
using laser electrospray mass spectrometry (LEMS). We demonstrated that LEMS is capable of
analyzing intact pharmaceutical formulations with no sample preparation, in the presence of binders and
fillers. We have shown that higher capture efficiencies are achieved using LEMS in comparison with

14
nanosecond MALDESI. Detection of pharmaceuticals from a variety of surfaces suggests that the
method can be extended to a wide variety of controlled substances.
ACKNOWLEDGMENT
This work was supported by grants form the National Science Foundation CHE0518497 and the
Army Research Office W911NF0810020.
15
REFERENCES (1) Ho, M. H. Analytical Methods in Forensic Chemistry; Ellis Horwood Limited: Chichester, West
Sussex, England, 1990. (2) Cotte-Rodriguez, I.; Takats, Z.; Talaty, N.; Chen, H. W.; Cooks, R. G. Analytical Chemistry
2005, 77, 6755-6764. (3) Justes, D. R.; Talaty, N.; Cotte-Rodriguez, I.; Cooks, R. G. Chemical Communications 2007,
2142-2144. (4) Vogel, A.; Venugopalan, V., 2003; Vol. 103, pp 577-644. (5) Nemes, P.; Vertes, A. Analytical Chemistry 2007, 79, 8098-8106. (6) Nemes, P.; Barton, A. A.; Li, Y.; Vertes, A. Analytical Chemistry 2008, 80, 4575-4582. (7) Sampson, J. S.; Hawkridge, A. M.; Muddiman, D. C. Journal of the American Society for Mass
Spectrometry 2006, 17, 1712-1716. (8) Sampson, J. S.; Hawkridge, A. M.; Muddiman, D. C. Analytical Chemistry 2008, 80, 6773-6778. (9) Huang, M. Z.; Hsu, H. J.; Lee, L. Y.; Jeng, J. Y.; Shiea, L. T. Journal of Proteome Research
2006, 5, 1107-1116. (10) Huang, M. Z.; Hsu, H. J.; Wu, C. I.; Lin, S. Y.; Ma, Y. L.; Cheng, T. L.; Shiea, J. Rapid
Communications in Mass Spectrometry 2007, 21, 1767-1775. (11) Lin, S. Y.; Huang, M. Z.; Chang, H. C.; Shiea, J. Analytical Chemistry 2007, 79, 8789-8795. (12) Shiea, J.; Huang, M. Z.; Hsu, H. J.; Lee, C. Y.; Yuan, C. H.; Beech, I.; Sunner, J. Rapid
Communications in Mass Spectrometry 2005, 19, 3701-3704. (13) Brady, J. J.; Judge, E. J.; Levis, R. J. Rapid Communications in Mass Spectrometry 2009, 23,
3151-3157. (14) Palliyaguru, L.; Sloss, J.; Rabitz, H.; Levis, R. J. Journal of Modern Optics 2008, 55, 177-185. (15) DeWitt, M. J.; Peters, D. W.; Levis, R. J. Chemical Physics 1997, 218, 211-223. (16) Dewitt, M. J.; Levis, R. J. Journal of Chemical Physics 1995, 102, 8670-8673. (17) Levis, R. J.; DeWitt, M. J. Journal of Physical Chemistry A 1999, 103, 6493-6507. (18) Levis, R. J.; Rabitz, H. A. Journal of Physical Chemistry A 2002, 106, 6427-6444. (19) Levis, R. J.; Menkir, G. M.; Rabitz, H. Science 2001, 292, 709-713. (20) Weinkauf, R.; Aicher, P.; Wesley, G.; Grotemeyer, J.; Schlag, E. W. Journal of Physical
Chemistry 1994, 98, 8381-8391. (21) Wilkerson, C. W.; Colby, S. M.; Reilly, J. P. Analytical Chemistry 1989, 61, 2669-2673. (22) Wilson, M. L.; Carroll, P. J.; Dalton, D. R. Journal of Organic Chemistry 2005, 70, 6492-6495. (23) Salem, II; Idrees, J.; Al Tamimi, J. I. Journal of Pharmaceutical and Biomedical Analysis 2004,
34, 141-151. (24) Martin, A. N.; Farquar, G. R.; Jones, A. D.; Frank, M. Rapid Communications in Mass
Spectrometry 2007, 21, 3561-3568. (25) Bakir, N. O. Managing Critical Infrastructure Risks: Chapter 2. A Brief Analysis of Threats and
Vulnerabilities. In the Maritime Domain; Springer Netherlands, 2007.

16
1

17
2

18
3

19
4

20
5

21
6

22
7
23
____________________________________________________________________________________________________ Claritin Atenolol Oxycodone Average RSD (%) S/N Average RSD (%) S/N Average RSD (%) S/N IA, N=20 IA, N=20 IA, N=20 Steel 3.20 25.9 59.1 2.17 39.5 39.7 5.19 44.4 47.9 Glass 0.245 41.1 4.22 0.186 68.3 4.65 0.980 47.7 11.9 Wood 0.393 35.3 5.72 0.185 16.9 1.85 0.296 38.5 3.53 Polyester Fabric: White (H+) 0.0995 45.5 2.12 0.101 46.0 2.51 0.319 34.4 3.90 (Na+) 0.231 16.1 3.42 Red (H+) 0.0486 41.0 1.71 0.0784 59.6 1.56 0.247 24.0 3.48 (Na+) 0.283 14.0 4.58 Black (H+) 0.0772 53.8 1.73 0.0873 72.0 1.78 0.140 48.7 1.97 (Na+) 0.217 29.6 4.43 __________________________________________________________________________________________
Table 1
24
Figure 1. fs-LEMS schematic. The electrospray needle was held at ground and had a flow rate of 2 µl/min. The
sample plate holder was held at -2 kV. The laser had an incident angle of 45o with a 17.5 cm focusing lens. The
metalized tip of the dielectric capillary was held at -5.3 kV. The resulting ions traveled down the capillary to the
mass spectrometer for pulsed deflection, time-of-flight detection.
Figure 2. a) fs-LEMS of a Claritin tablet placed on the sample plate. Labeled peaks are indicated by shapes: ■
lactose monohydrate m/z = 361, ● magnesium stearate m/z = 253, 267, and 281, and * fragment peaks (m/z =
155, 227, 229, 337, 339 and 349. b) Mass spectrum of Atenolol tablet placed on the sample plate. The marked
peaks correspond to sample and all other unlabeled peaks are solvent related.
Figure 3. LEMS analysis of trace amounts of Claritin on: a, wood; b, steel; and c, glass substrates. The parent ion
peak is at m/z 384. A sodium adduct of loratadine at m/z 406 can be seen in b).
Figure 4. LEMS analysis of trace oxycodone deposited on a, wood; b, steel; and c, glass. The protonated parent
ion for oxycodone is at m/z 316. All unlabeled peaks are solvent related.
Figure 5. The LEMS analysis of trace oxycodone deposited on white, red and black polyester fabrics. The
protonated parent ion for oxycodone is at m/z 316. All unlabeled peaks are solvent related. b) A plot of the
integrated area of oxycodone parent ion peak versus the different colored polyester fabrics.
Figure 6. The LEMS analysis of trace atenolol deposited on a, wood; b, steel; and c, glass. The protonated parent
ion is at m/z 267. All unlabeled peaks in the mass spectra are solvent related.
Figure 7. The LEMS analysis of trace atenolol deposited on white, red and black polyester fabrics. b) A plot of
the integrated area of atenolol parent ion peak (protonated and sodium adduct) versus the different colored
polyester fabric.
Table 1. Statistical analysis of twenty LEMS experiments on steel, glass, wood and fabric surfaces. Average
integrated area (IA) and relative standard deviation (RSD%) are calculated.