Embed Size (px)
Citation preview
ANALYSIS OF NON-YIELDING BASEMENT WALL
ADJACENT TO STRIP FOOTING
by
Majid Omar Touqan
A Thesis Presented to the Faculty of the
American University of Sharjah
College of Engineering
in Partial Fulfillment
of the Requirements
for the Degree of
Master of Science
in Civil Engineering
Sharjah, United Arab Emirates
May 2016

© 2016 Majid Omar Touqan. All rights reserved.
Approval Signatures
We, the undersigned, approve the Master’s Thesis of Majid Omar Touqan.
Thesis Title: Analysis of Non-Yielding Basement Wall Adjacent to Strip Footing
Signature Date of Signature
(dd/mm/yyyy)
______________________________ ___________________
Dr. Magdi El-Emam
Associate Professor, Department of Civil Engineering
Thesis Advisor
_____________________________ ___________________
Dr. Mousa Attom
Professor, Department of Civil Engineering
Thesis Committee Member
______________________________ ___________________
Dr. Maher Omar
Associate Professor, Department of Civil and
Environmental Engineering, University of Sharjah
Thesis Committee Member
______________________________ ___________________
Dr. Osman Akan
Head, Department of Civil Engineering,
______________________________ ___________________
Dr. Mohamed El-Tarhuni
Associate Dean, College of Engineering
______________________________ ___________________
Dr. Leland Thomas Blank
Dean of College of Engineering
______________________________ ___________________
Dr. Khaled Assaleh
Interim Vice Provost for Research and Graduate Studies

Acknowledgements
All praise is for Allah by whose favor good works are accomplished.
I would like to convey my sincere gratitude to my parents, Omar Touqan and
Suhair Bakeer for their endless love, nonstop support, and boundless inspiration. I
will always be in your debt. I am grateful to my brother Karim Touqan, with his
support and company my long journey at AUS felt shorter, and with his motivation I
was able to continue. I am thankful to Allah for their presence in my life.
Special thanks and heartfelt gratitude to my mentor, advisor and supporter Dr.
Magdi El-Emam, who treated me as his friend, without his advice and knowledge I
wouldn’t be able to progress through this research. Thank you for your advice and
patience in steering this research in the correct direction. Because of you I became
more interested in Geotechnical Engineering.
I would like to thank Mr. Aqeel Ahmed and Mr. Riyad Tamam for their kindness
and continuous support throughout my experimental work at AUS Geotechnical Lab.
I am also thankful to my thesis committee members, Dr. Mousa Attom and Dr. Maher
Omar, for their important comments and guidance to improve my research outputs.
Finally, I would like to thank the American University of Sharjah for the research
fund that supported my project.

To my beloved Family
Omar Touqan, Suhair Bakeer & Karim Touqan
6
Abstract
Foundation depth below the ground surface is one of the major factors that contributes
to the bearing capacity and settlement of shallow foundation. Hence, it is common to
find adjacent buildings on shallow foundations that are constructed at different depths.
This situation leads to geotechnical and/or structural problems especially when a
shallow foundation is constructed adjacent to a basement wall. A literature review and
communications with local municipalities indicated that there is no solid code of
practice that can be adopted to solve problems of shallow foundations constructed
adjacent to non-yielding wall. The objective of this research is to study the behavior
of non-yielding walls adjacent to strip footing experimentally and analytically.
Parameters investigated during this study are footing depth below ground surface,
horizontal distance from the basement wall to the footing, footing contact pressure,
and width. To achieve these objectives, 15 reduced-scale wall-footing model tests
with 1.15 m height by 1.4 m width and 2.7 m in length were constructed with well
graded backfill sand. The strip footing was subjected to an incremental vertical stress
until excessive deformation occurred. The wall-footing models were instrumented to
measure lateral wall deflection, footing vertical stresses and settlement, horizontal
forces transferred to the top and bottom boundaries of the wall, and vertical force
transferred to the bottom of the non-yielding wall. Results showed that the non-
yielding wall and the adjacent strip footing are working interactively, and the load
capacity of the strip footing was affected significantly by the behavior of the non-
yielding wall. Location of the footing relative to the wall, the footing width, and the
footing embedment depth were the major parameters that influenced the wall-footing
responses. The existence of the strip footing in the vicinity of the basement wall
imposed significant vertical and horizontal forces at the wall top and bottom
boundaries. A comparison between experimental results and results from the elastic
theory method in combination with Jacky formula for lateral earth pressure at rest
indicated that the analytical method underestimated the lateral earth forces on non-
yielding walls due to strip footing. Therefore, a modification of the current used
analytical methods was suggested to improve its accuracy. Finally, the experimental
and analytical results indicated that the location of lateral forces above the wall
bottom boundary was changed with the footing design parameters.
Search Terms: lateral earth pressure, non-yielding walls, strip footing
7
Table of Contents
Abstract .......................................................................................................................... 6
Table of Contents ........................................................................................................... 7
List of Figures: ............................................................................................................ 10
List of Tables: .............................................................................................................. 15
Chapter 1: Introduction ................................................................................................ 16
1.1 Shallow Foundations .......................................................................................... 16
1.2. Problem Statement ............................................................................................ 17
1.3 Research Objectives ........................................................................................... 19
1.4 Significance of the Research .............................................................................. 20
1.5 Thesis Organization............................................................................................ 20
Chapter 2: Literature Review ....................................................................................... 22
2.1 General ............................................................................................................... 22
2.2 At-Rest Lateral Earth Pressure on Non-Yielding Walls .................................... 22
2.3 Lateral Earth Pressure on Retaining Walls due to Surcharges ........................... 25
2.4 Determining Lateral Earth Pressure due to Strip Footings ................................ 29
2.5 Compaction induced Earth Pressure on Retaining Structures ............................ 34
2.6 Soil Arching and Earth Pressures on Rigid Walls with Confined Backfills ...... 37
2.7 Experimental Studies Investigating Earth Pressure ........................................... 39
2.8 Numerical Studies Investigating Earth Pressure ................................................ 46
2.9 Summary of the Literature Review .................................................................... 50
Chapter 3: Methodology .............................................................................................. 52
3.1 General ............................................................................................................... 52
3.2 Constructing the Test Facility at AUS Geotechnical Lab .................................. 52
3.2.1 Data acquisition and software ...................................................................... 54
3.2.2 Load cells, LVDTs and pressure cells ......................................................... 57
3.3 Construction of Scaled Model Wall-Footing ..................................................... 58
8
3.4 Backfill Soil Properties ...................................................................................... 59
3.5 Similitude Rules ................................................................................................. 62
3.6 Pre-Testing Preparations .................................................................................... 62
3.7 Testing Procedure ............................................................................................... 65
3.8 Tests Configurations .......................................................................................... 66
Chapter 4: Model Wall-Footing Test Results .............................................................. 68
4.1 General ............................................................................................................... 68
4.2 Hydraulic Actuator Vertical Load Reproducibility ............................................ 69
4.3 Selected Test Results .......................................................................................... 69
4.3.1 Footing vertical settlement .......................................................................... 70
4.3.2 Vertical and lateral forces acting on the wall .............................................. 72
4.4 Summary of Typical Experimental Findings ..................................................... 77
Chapter 5: Analysis of Wall-Footing Parametric Responses ....................................... 79
5.1 General ............................................................................................................... 79
5.2 Data Presentation................................................................................................ 80
5.3 Non-Yielding Wall Force Responses ................................................................. 84
5.3.1 Vertical forces at non-yielding wall ............................................................ 84
5.3.1.1 Effect of strip footing width ................................................................. 84
5.3.1.2 Effect of strip footing distance ............................................................. 87
5.3.1.3 Effect of strip footing embedment depth ............................................. 88
5.3.2 Horizontal wall forces ................................................................................. 89
5.3.2.1 Effect of strip footing width ................................................................. 89
5.3.2.2 Effect of strip footing distance ............................................................. 93
5.3.2.3 Effect of strip footing embedment depth ............................................. 95
5.3.3 Location of horizontal wall force resultant .................................................. 97
5.3.3.1 Effect of strip footing width ................................................................. 97
5.3.3.2 Effect of strip footing distance ............................................................. 99
9
5.3.3.3 Effect of strip footing embedment depth ........................................... 100
5.4 Soil Movement ................................................................................................. 101
5.4.1 Strip footing vertical settlement ................................................................ 102
5.4.1.1 Effect of strip footing width ............................................................... 102
5.4.1.2 Effect of strip footing distance and footing embedment depth .......... 104
5.4.2 Wall-facing deflections.............................................................................. 105
5.4.2.1 Effect of strip footing width ............................................................... 105
5.4.2.2 Effect of strip footing distance and embedment depth ...................... 107
5.5 Analytical Comparison and Modification ........................................................ 109
5.5.1 Lateral earth forces .................................................................................... 109
5.5.2 Lateral earth forces location above the wall foundation ............................ 114
5.6 Conclusions ...................................................................................................... 115
Chapter 6: Conclusion and Recommendations .......................................................... 118
6.1 Conclusion ........................................................................................................ 118
6.2 Wall Forces ...................................................................................................... 118
6.3 Soil Movement ................................................................................................. 119
6.4 Analytical Implications .................................................................................... 120
6.5 Recommendations for Future Research ........................................................... 121
References .................................................................................................................. 122
Vita ............................................................................................................................. 127
10
List of Figures
Figure 1: Example of underground basement walls .................................................... 17
Figure 2: Example of basement built closer to a paved road ....................................... 18
Figure 3: Case study of shallow foundation constructed adjacent to basement wall ... 19
Figure 4: Triangular distribution assumed for the at-rest lateral earth pressure ......... 24
Figure 5: Variation of horizontal earth force with the backfill height during
construction stages at different OCR .......................................................................... 24
Figure 6: Lateral earth pressure distribution from strip footing ................................. 27
Figure 7: Values of (heq) for various distances, (s) and (k) ......................................... 28
Figure 8: Elastic solution for strip footing .................................................................. 29
Figure 9: Lateral surcharge pressure of different methods and effects of wall
movements on earth pressure ...................................................................................... 30
Figure 10: The 45° distribution approach ................................................................... 31
Figure 11: Generalized Coulomb method ................................................................... 32
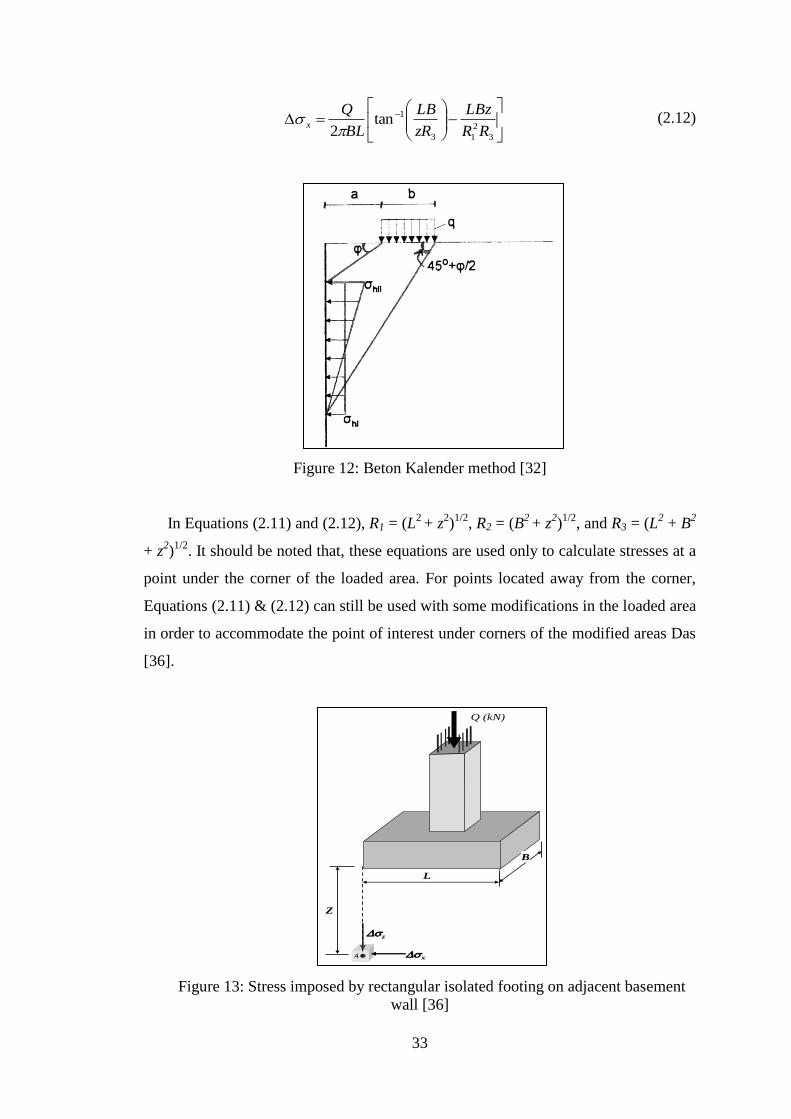
Figure 12: Beton Kalender method ............................................................................. 33
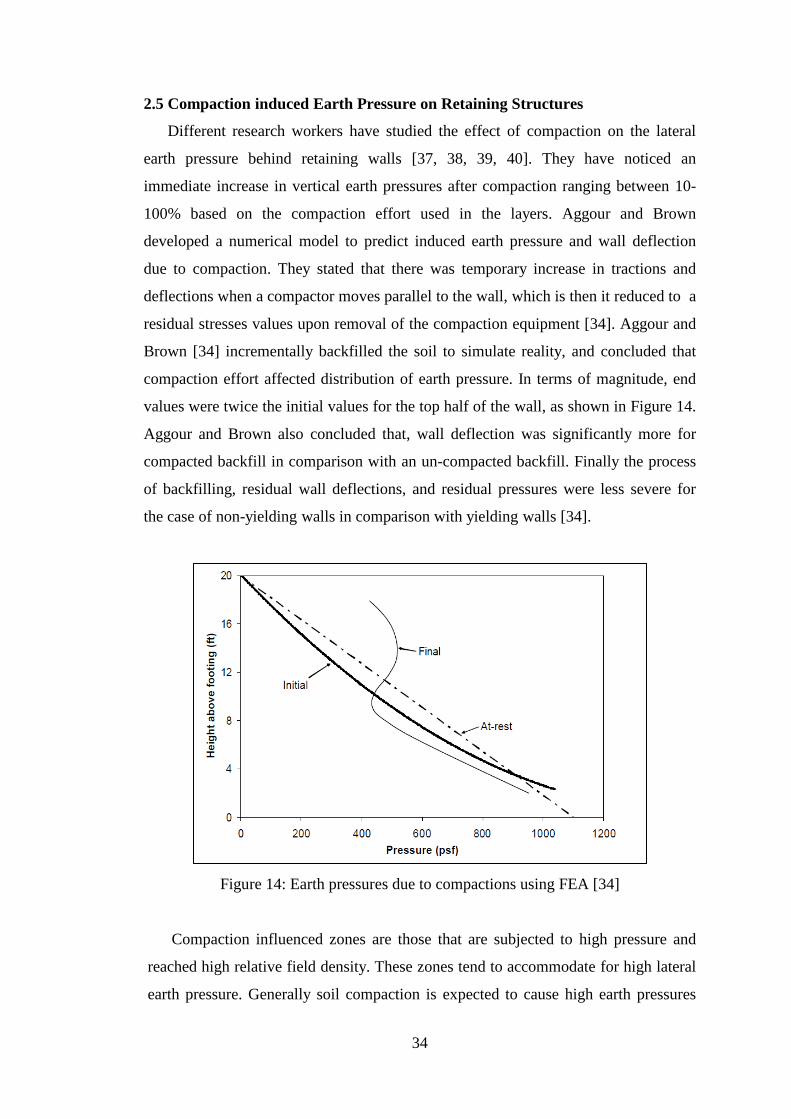
Figure 13: Stress imposed by rectangular isolated footing on adjacent basement wall
...................................................................................................................................... 33
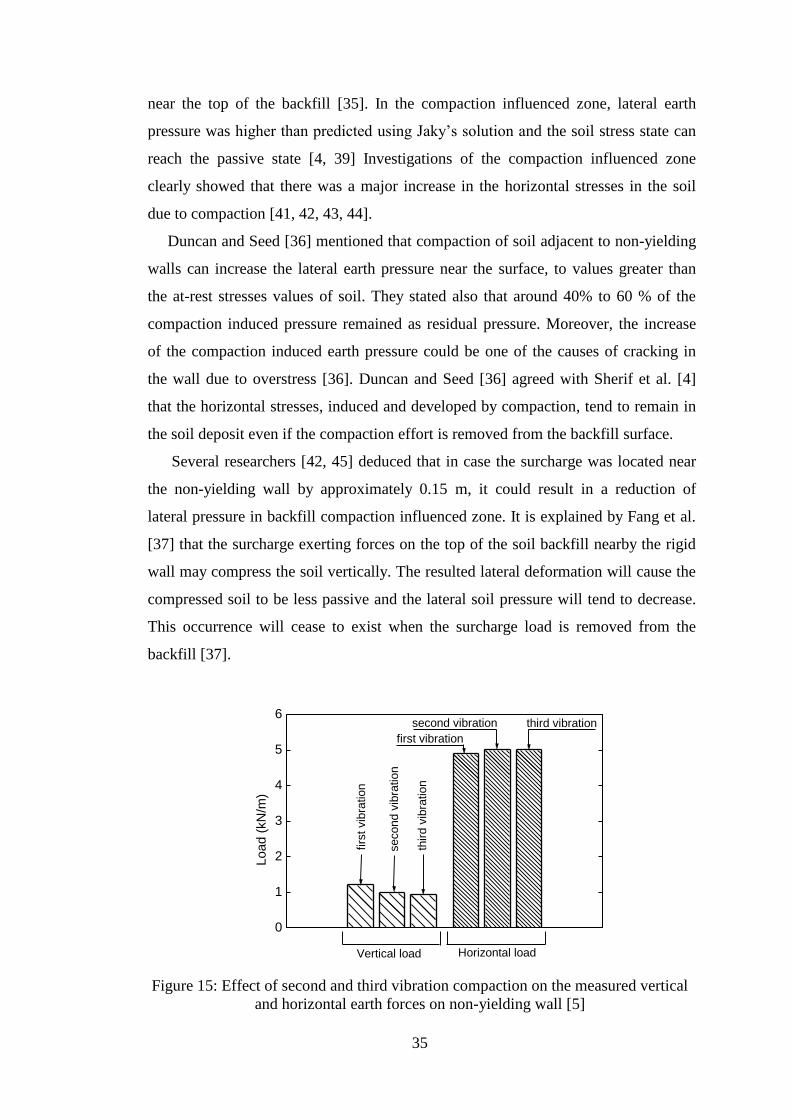
Figure 14: Earth pressures due to compactions using FEA ........................................ 34
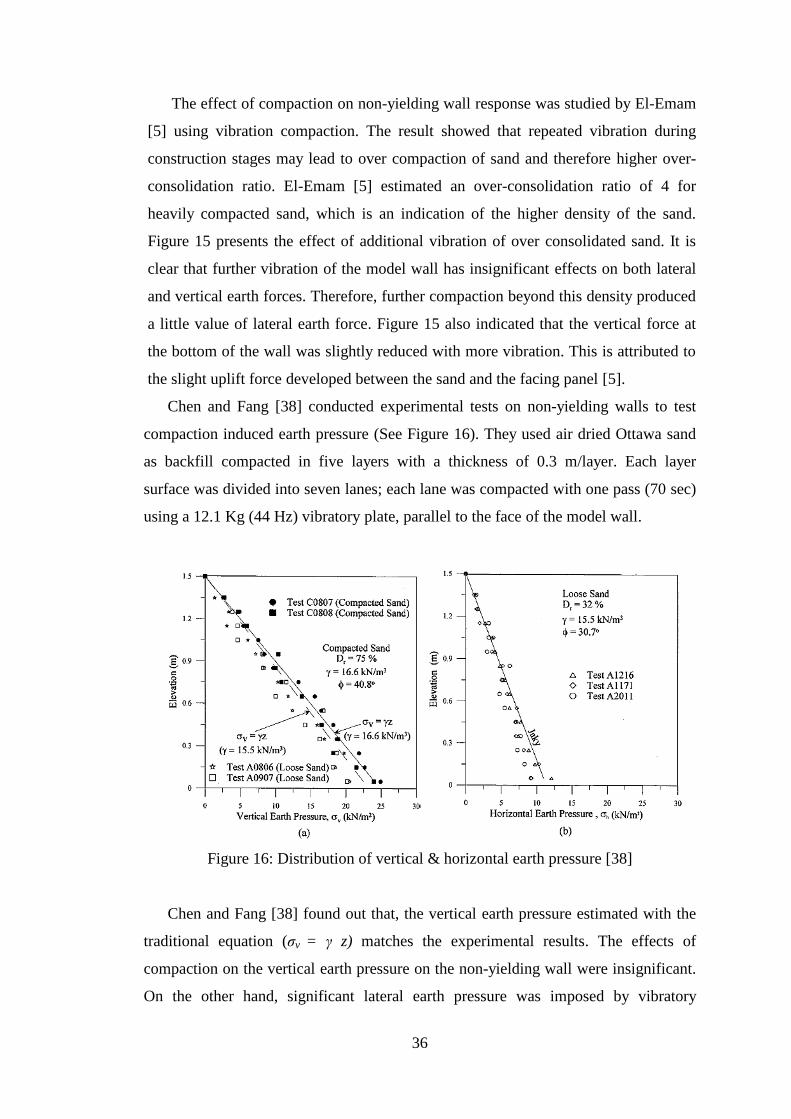
Figure 15: Effect of second and third vibration compaction on the measured vertical
and horizontal earth forces on non-yielding wall ....................................................... 35
Figure 16: Distribution of vertical & horizontal earth pressure .................................. 36
Figure 17: Comparison of FEM earth pressure results with analytic & experimental
results .......................................................................................................................... 38
Figure 18: Model and instrumentations on a non-yielding wall on a shaking table ... 40
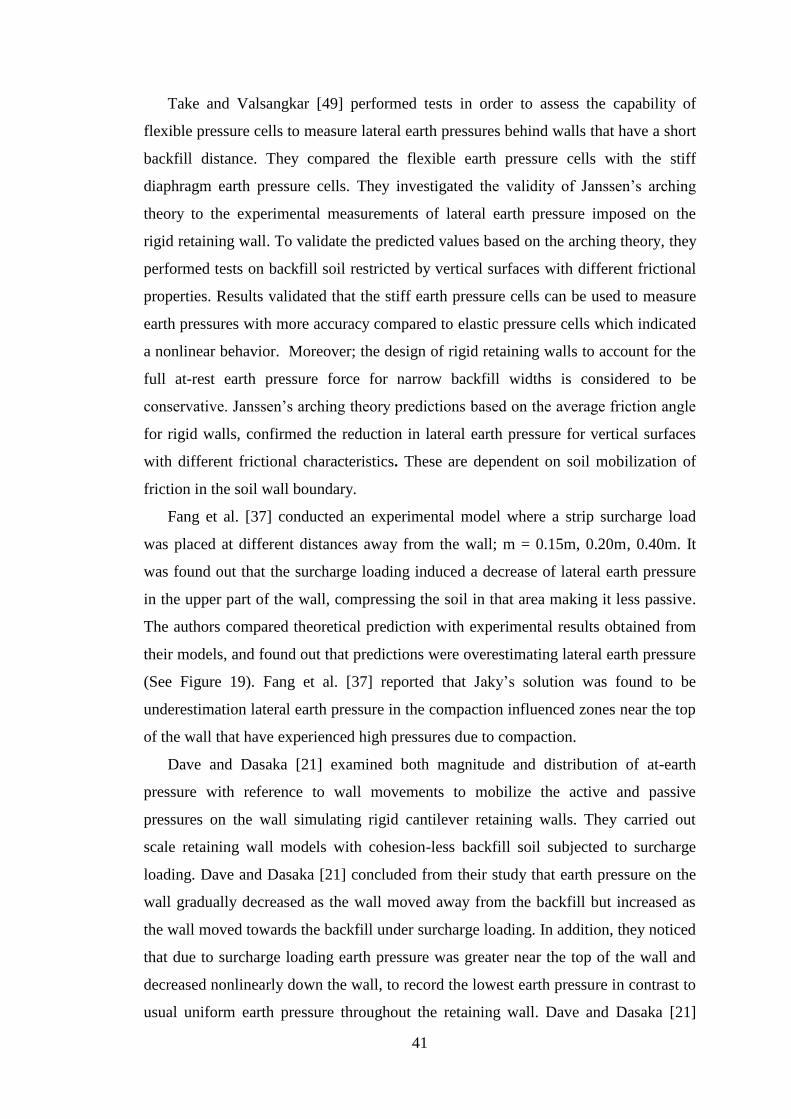
Figure 19: Variation (Δσh / q) with depth & change of resultant force ....................... 42
Figure 20: Earth pressure comparison with Jaky's at-rest pressure ............................ 43
Figure 21: Peak & residual measured lateral earth pressure ....................................... 45
Figure 22: Measured earth pressure on a retaining wall due to line load ................... 47
Figure 23: Calculated earth pressure on a retaining wall due to line load .................. 48
Figure 24: FEA of earth pressure on retaining wall .................................................... 49
Figure 25: Steel sand box constructed at CEN Geotechnical Lab ............................... 53
Figure 26: Schematic view of the test facility at CEN................................................. 53
Figure 27: Instruments used in the experimental tests ................................................. 54
11
Figure 28: InstruNet World data record page .............................................................. 56
Figure 29: A spreadsheet environment showing different channels. ........................... 56
Figure 30: Location of the used 4 LVDTs ................................................................... 57
Figure 31: Pressure cells placed on the wall ................................................................ 58
Figure 32: Footing cushioning ..................................................................................... 59
Figure 33: Backfill soil sample direct shear results graph ........................................... 60
Figure 34: Backfill soil sample sieve analysis results graph ....................................... 61
Figure 35: Proctor curve for the backfill soil ............................................................... 62
Figure 36: Soil surface leveling and compaction stages .............................................. 63
Figure 37: Footing loading setup, and wall LVDT ...................................................... 65
Figure 38: Entire test setup .......................................................................................... 66
Figure 39: Schematic showing different model responses and stress applications ..... 68
Figure 40: Vertical stress-time histories applied at all strip footings in model tests ... 69
Figure 41: Footing vertical stress increment versus time for model tests 11 and 12 ... 70
Figure 42: Footing vertical settlement increment versus time for models 11 and 12 .. 71
Figure 43: Actual footing vertical settlement of typical model test with B = 20 cm ... 71
Figure 44: Footing vertical settlement and soil heave of a typical model test with B =
15 cm ............................................................................................................................ 72
Figure 45: Vertical loads at the wall footing versus time for model tests 11 and 12... 72
Figure 46: Deflections and stress developed at the interface between the soil and the
non-yielding walls for model tests 11 and 12 .............................................................. 73
Figure 47: Horizontal forces developed at the wall top and bottom versus time for
model tests 11 and 12 ................................................................................................... 75
Figure 48: Location of HL force resultant (Z/H) at the back of the wall versus time for
model tests 11 and 12 ................................................................................................... 76
Figure 49: Lateral deflection of the wall (δh) versus time for model tests 11 and 12 .. 76
Figure 50: Lateral deflection of the wall (δh) for typical model wall test .................... 77
Figure 51:Time history for the vertical stresses applied by strip footing at the soil
backfill soil surface ...................................................................................................... 80
Figure 52: Example of the strip footing vertical settlement versus time ..................... 81
Figure 53: Example of the wall foundation vertical forces versus time ...................... 82
Figure 54: Example of the total horizontal forces at the wall back versus time .......... 82
Figure 55: Location of the total horizontal force at the back of the wall versus time . 83
12
Figure 56: Horizontal forces at the wall boundaries and the average values
superimposed on all response points (Model 11) ........................................................ 83
Figure 57: Total vertical force at the wall foundation versus applied vertical stresses
(a = B) .......................................................................................................................... 85
Figure 58: Total vertical force at the wall foundation versus applied vertical stresses at
different footing width (a = 4B) ................................................................................... 86
Figure 59: Development of slip surface and stresses at the back of laterally deflected
wall due to strip footing with different vertical stresses .............................................. 86
Figure 60: Total vertical force at the wall foundation versus applied vertical stresses,
at different footing distance (B = 15 cm) ..................................................................... 87
Figure 61: Total vertical force at the wall foundation versus applied vertical stresses,
at different footing distance (B = 25 cm) ..................................................................... 87
Figure 62: Total vertical force at the wall foundation versus applied vertical stresses,
at different embedment depth (B = 20 cm) .................................................................. 88
Figure 63: Top and bottom horizontal forces at the wall boundaries versus applied
vertical stresses at different footing width (a = B) ....................................................... 89
Figure 64: Total horizontal force at the wall back versus applied vertical stresses, at
different footing width (a = B) ..................................................................................... 90
Figure 65: Top and bottom horizontal forces at the wall boundaries versus applied
vertical stresses at different footing width (a = 4B) ..................................................... 91
Figure 66: Total horizontal force at the wall back versus applied vertical stresses, at
different footing width (a = 4B) ................................................................................... 91
Figure 67: Development of slip surface and stresses at the back of laterally deflected
wall due to strip footing with different width and distance ......................................... 92
Figure 68: Development of slip surface and stresses at the back of laterally deflected
wall due to strip footing with different width and distance ......................................... 92
Figure 69: Top and bottom horizontal forces at the wall boundaries versus applied
vertical stresses at different footing distance (B = 15 cm) ........................................... 93
Figure 70: Total horizontal force at the wall back versus applied vertical stresses, at
different footing distance (B = 15 cm) ......................................................................... 94
Figure 71: Top and bottom horizontal forces at the wall boundaries versus applied
vertical stresses at different footing distance (B = 25 cm) ........................................... 94
Figure 72: Total horizontal force at the wall back versus applied vertical stresses, at
different footing distance (B = 25 cm) ......................................................................... 95
13
Figure 73: Top and bottom horizontal forces at the wall boundaries versus applied
vertical stresses at different footing embedment depth (B = 20 cm, a = 2B) ............... 96
Figure 74: Total horizontal force at the wall back versus applied vertical stresses, at
different footing embedment depth (B = 20 cm, a = 2B) ............................................. 96
Figure 75: Normalized location of the horizontal force at the wall back versus applied
vertical stresses, at different footing width (a = 1B) .................................................... 98
Figure 76: Normalized location of the horizontal force at the wall back versus applied
vertical stresses, at different footing width (a = 4B) .................................................... 98
Figure 77: Normalized location of the horizontal force at the wall back versus applied
vertical stresses, at different footing distance (B = 15 cm) .......................................... 99
Figure 78: Normalized location of the horizontal force at the wall back versus applied
vertical stresses, at different footing distance (B = 25 cm) ........................................ 100
Figure 79: Normalized location of the horizontal force at the wall back versus applied
vertical stresses, at different embedment depth (B = 20 cm, a = 2B) ........................ 101
Figure 80: Strip footing vertical settlement versus applied vertical stresses, at different
footing width (a = B) ................................................................................................. 102
Figure 81: Strip footing vertical settlement versus applied vertical stresses, at different
footing width (a = 4B) ............................................................................................... 103
Figure 82: Strip footing vertical settlement versus applied vertical stresses, at different
footing distance (B = 15 cm) ...................................................................................... 104
Figure 83: Strip footing vertical settlement versus applied vertical stresses, at different
footing distance (B = 25 cm) ...................................................................................... 104
Figure 84: Strip footing vertical settlement versus applied vertical stresses, at different
footing embedment depth (B = 20 cm a = 2B) .......................................................... 105
Figure 85: Lateral wall deflection versus applied vertical stresses, at different footing
width (a = B) .............................................................................................................. 106
Figure 86: Lateral wall deflection versus applied vertical stresses, at different footing
width (a = 4B) ............................................................................................................ 106
Figure 87: Lateral wall deflection versus applied vertical stresses, at different footing
distance (B = 15 cm) .................................................................................................. 107
Figure 88: Lateral wall deflection versus applied vertical stresses, at different footing
distance (B = 25 cm) .................................................................................................. 108
Figure 89: Lateral wall deflection versus applied vertical stresses, at different footing
embedment depth (B = 20 cm, a = 2B) ...................................................................... 108
14
Figure 90: Vertical and horizontal distribution of lateral stress imposed on non-
yielding retaining wall from strip footing ................................................................. 110
Figure 91: Experimental and analytical total horizontal force versus applied vertical
stress, at different footing distance, and different OCR (B = 15 cm) ........................ 111
Figure 92: Experimental and analytical total horizontal force versus applied vertical
stress, at different footing distance, and different OCR (B = 25 cm) ........................ 112
Figure 93: Experimental and analytical total horizontal force versus applied vertical
stress, at different footing embedment depth, and different OCR (B = 20 cm, a = 2B)
.................................................................................................................................... 113
Figure 94: Experimental and analytical location of the total horizontal earth force
versus applied vertical stress, at different footing distance (B = 15 cm, OCR = 1) ... 114

15
List of Tables
Table 1: Typical values of K0 ...................................................................................... 23
Table 2: Solution network for the modified parameters of the cases and results ........ 50
Table 3: Values found in literature for Ko ................................................................... 59
Table 4: Backfill soil samples specific gravity results ................................................. 61
Table 5: Similitude laws for in 1-g gravitational field ................................................ 62
Table 6: Outline of experimental program................................................................... 67
16
Chapter 1: Introduction
1.1 Shallow Foundations
Foundation is the part of the structural system that is responsible for transferring
the load created by the building’s weight and other live loads safely to the soil or rock
below ground surface. It should be designed to prevent soil shear failure and
excessive settlement of the structure. Wherever the soil near the ground surface is
weak, deep foundations are implemented to support the structure. In such situations,
drilled shafts or piles are used to transfer structure load to a much stronger and stable
deeper soil layer(s). However, if the shallow soil layers are strong enough to support
the structure loads shallow foundation is the right solution.
Shallow foundation includes: isolated footing, combined footings, and continuous
or strip footings which are used to support load-bearing walls, or in cases where a row
of columns are very close to each other that their isolated footings overlap. Mat or raft
foundation is another version of shallow foundation that is effective in reducing
differential settlement and increase the soil bearing capacity to satisfy the building
requirement.
The urgent need for parking spaces all over the world, including the UAE, forced
the designers to use multi-levels basement as a viable solution to this problems. With
the extensive use of multi levels basements the possibility of constructing shallow
foundations in the vicinity of an old (existing) foundation or basement walls has
increased. The existence of shallow foundations closer to basement walls is expected
to impose external lateral pressure in addition to other loads considered during the
design of such walls.
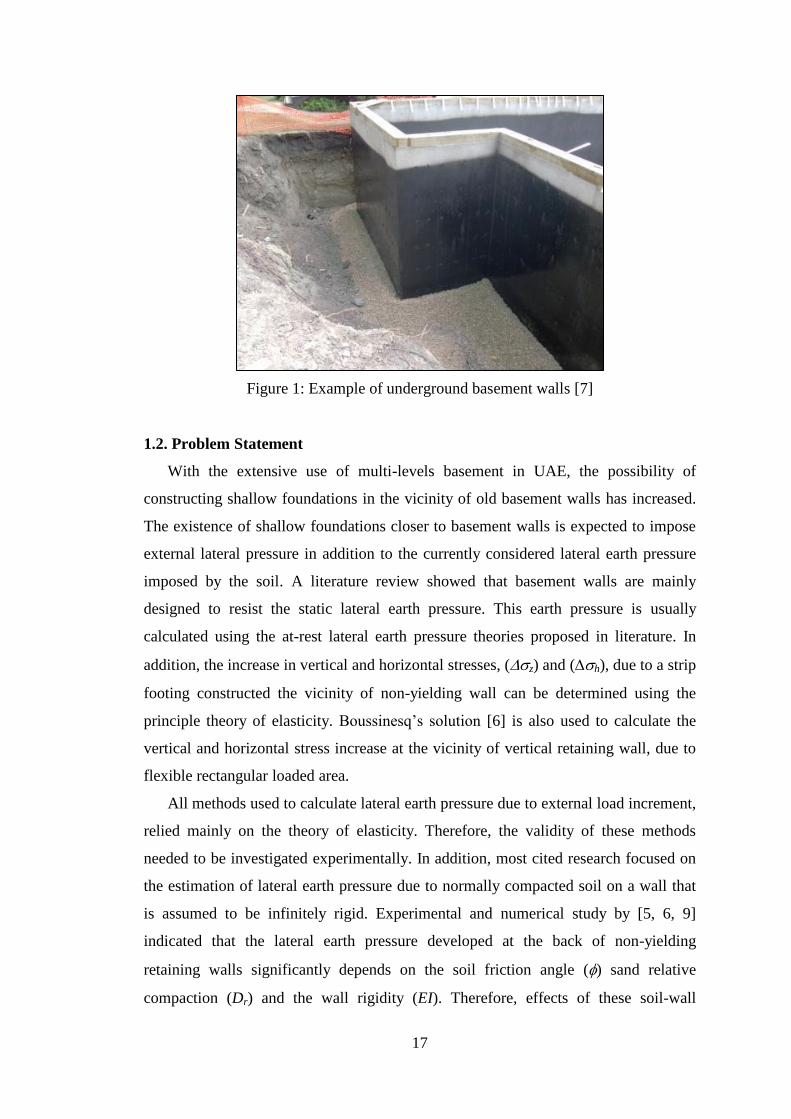
Basement walls are mainly designed to resist the static lateral earth pressure
imposed by the soil. This earth pressure is usually calculated using the at rest earth
pressure theory proposed in literature by Jacky [1], Hanna and Al-Romhein [2],
Mayne and Kulhawy [3], and Sherif et al. [4]. El-Emam [5, 6] has proven that these
methods are unsatisfactory for heavily compacted sand (i.e. sand with higher
consolidation ratio). In addition, these earth pressure theories do not properly consider
effects of shallow foundations constructed adjacent to basement wall. Figure 1 shows
an example of basement wall that is designed to resist only the at-rest lateral earth
pressure imposed by the backfill soil.
17
Figure 1: Example of underground basement walls [7]
1.2. Problem Statement
With the extensive use of multi-levels basement in UAE, the possibility of
constructing shallow foundations in the vicinity of old basement walls has increased.
The existence of shallow foundations closer to basement walls is expected to impose
external lateral pressure in addition to the currently considered lateral earth pressure
imposed by the soil. A literature review showed that basement walls are mainly
designed to resist the static lateral earth pressure. This earth pressure is usually
calculated using the at-rest lateral earth pressure theories proposed in literature. In
addition, the increase in vertical and horizontal stresses, (z) and (h), due to a strip
footing constructed the vicinity of non-yielding wall can be determined using the
principle theory of elasticity. Boussinesq’s solution [6] is also used to calculate the
vertical and horizontal stress increase at the vicinity of vertical retaining wall, due to
flexible rectangular loaded area.
All methods used to calculate lateral earth pressure due to external load increment,
relied mainly on the theory of elasticity. Therefore, the validity of these methods
needed to be investigated experimentally. In addition, most cited research focused on
the estimation of lateral earth pressure due to normally compacted soil on a wall that
is assumed to be infinitely rigid. Experimental and numerical study by [5, 6, 9]
indicated that the lateral earth pressure developed at the back of non-yielding
retaining walls significantly depends on the soil friction angle () sand relative
compaction (Dr) and the wall rigidity (EI). Therefore, effects of these soil-wall
18
properties on the external stress increment (both vertical and horizontal) needed to be
investigated. The uncertainties in the method used to calculate vertical and lateral
stress at the back of non-yielding basement wall are expected to be reflected on the
final design of the wall. To overcome these uncertainties, the engineering designers
might be forced to highly overdesign the wall. The lack of improvement in analysis
and design of non-yielding wall supporting shallow foundation has been hampered by
a lack of physical data to validate and/or guide the development of new methods.
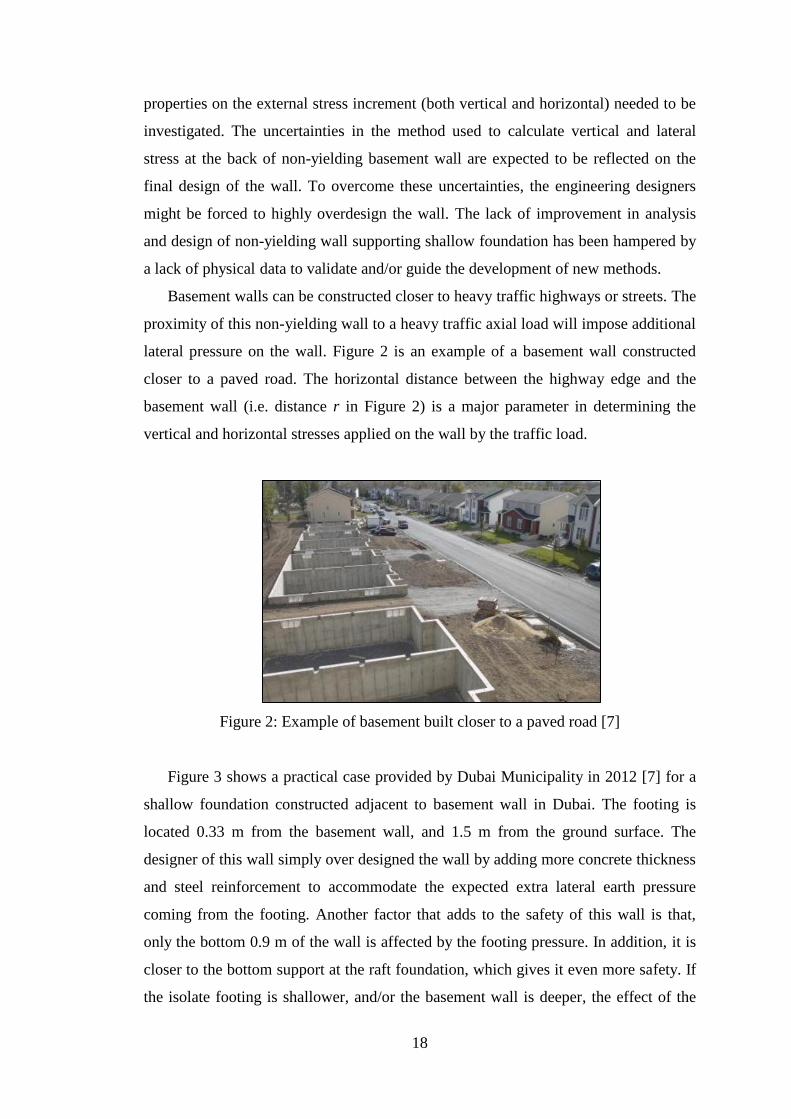
Basement walls can be constructed closer to heavy traffic highways or streets. The
proximity of this non-yielding wall to a heavy traffic axial load will impose additional
lateral pressure on the wall. Figure 2 is an example of a basement wall constructed
closer to a paved road. The horizontal distance between the highway edge and the
basement wall (i.e. distance r in Figure 2) is a major parameter in determining the
vertical and horizontal stresses applied on the wall by the traffic load.
Figure 2: Example of basement built closer to a paved road [7]
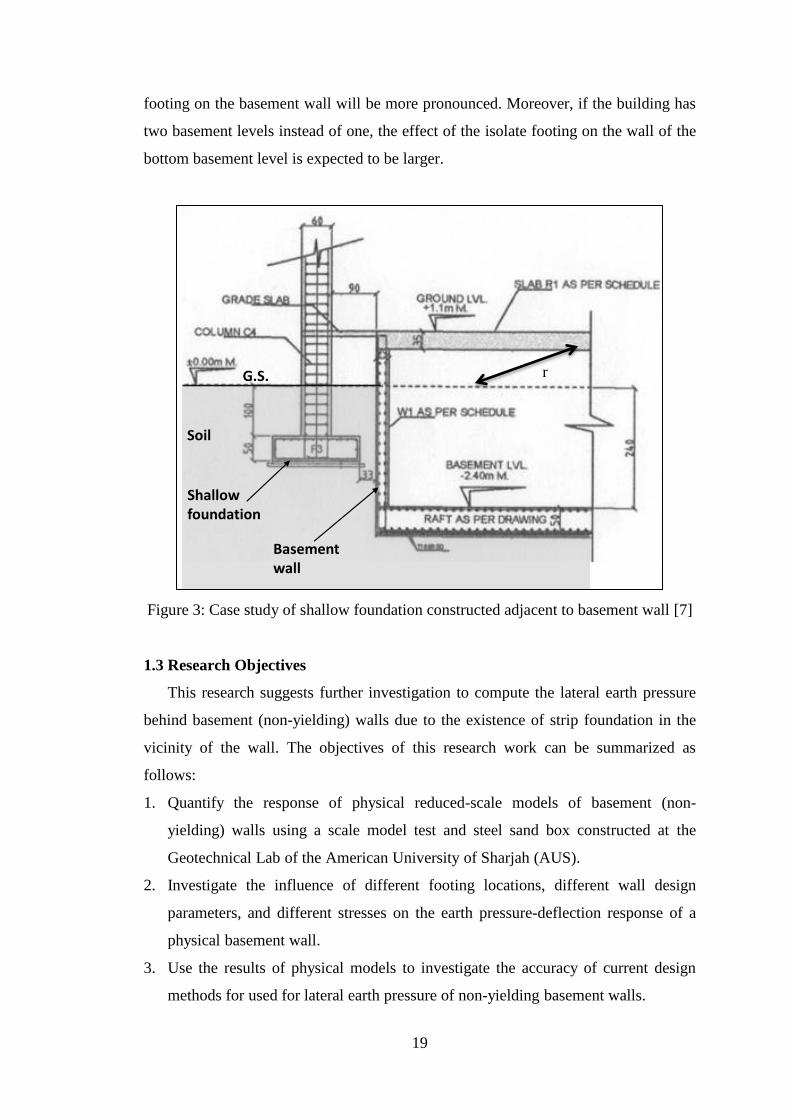
Figure 3 shows a practical case provided by Dubai Municipality in 2012 [7] for a
shallow foundation constructed adjacent to basement wall in Dubai. The footing is
located 0.33 m from the basement wall, and 1.5 m from the ground surface. The
designer of this wall simply over designed the wall by adding more concrete thickness
and steel reinforcement to accommodate the expected extra lateral earth pressure
coming from the footing. Another factor that adds to the safety of this wall is that,
only the bottom 0.9 m of the wall is affected by the footing pressure. In addition, it is
closer to the bottom support at the raft foundation, which gives it even more safety. If
the isolate footing is shallower, and/or the basement wall is deeper, the effect of the
19
footing on the basement wall will be more pronounced. Moreover, if the building has
two basement levels instead of one, the effect of the isolate footing on the wall of the
bottom basement level is expected to be larger.
Figure 3: Case study of shallow foundation constructed adjacent to basement wall [7]
1.3 Research Objectives
This research suggests further investigation to compute the lateral earth pressure
behind basement (non-yielding) walls due to the existence of strip foundation in the
vicinity of the wall. The objectives of this research work can be summarized as
follows:
1. Quantify the response of physical reduced-scale models of basement (non-
yielding) walls using a scale model test and steel sand box constructed at the
Geotechnical Lab of the American University of Sharjah (AUS).
2. Investigate the influence of different footing locations, different wall design
parameters, and different stresses on the earth pressure-deflection response of a
physical basement wall.
3. Use the results of physical models to investigate the accuracy of current design
methods for used for lateral earth pressure of non-yielding basement walls.
Basement wall
Shallow foundation
Soil
G.S. r
20
1.4 Significance of the Research
The ultimate goal of this research is to understand and quantify the behavior of
basement walls due to the construction of shallow foundations (strip footing) adjacent
to the wall. In addition, methods used to calculate vertical and horizontal stresses
applied at the back of basement walls will be checked for accuracy. If necessary, the
above mentioned methods may be modified to incorporate soil properties that might
show significant effects in the stress calculated at the back of the wall. Responses
such as wall lateral deflection, vertical and lateral earth pressure magnitudes and
distributions, and strip footing settlement will be interactively investigated and
emphasized. The results of this research is going to be useful for the municipal
authorities to adjust the current building codes to take into consideration the impact
that is going to be created by the new structure on the existing building. These will
help the designer and practitioners to refine their design of non-yielding walls, and to
avoid the uncertainties that might exist in the current design methods. The proposed
research is part of a long term research project ongoing at AUS to refine the design
methodology of non-yielding basement walls, and to adjust the code of practice that is
dealing with the problems of shallow foundations and their proximity of basement
walls.
1.5 Thesis Organization
Chapter 2 introduces literature survey on predicting at-rest lateral earth pressure,
such as the simplified equation of Jaky’s [1] earth pressure theory and its assumptions
and limitation. Then next section revises literature on lateral earth pressure on
retaining walls due to different surcharges. Methods used in literature to determine
lateral earth pressure due to strip footings and their distribution behind the retaining
walls are introduced next. Effect of compaction on lateral earth pressure developed on
retaining structures is discussed. The last two sections present a review of previous
numerical and experimental studies performed on non-yielding retaining walls.
Chapter 3 provides detailed description of the experimental program developed in
this research. In addition to that it describes the steel box test facility that was
constructed at AUS Geotechnical Lab, followed by the description of the used data
acquisition and software. The instrumentation used to measure the model wall-footing
responses under vertical stresses is described next. Chapter 3 also includes
clarification of the construction of the scaled wall and footing models, and properties
of the used backfill soil. The chapter ends with a description of the experimental test
21
program in this thesis including the investigated model wall-footing configurations
and the main parameters that were varied between models.
Chapter 4 introduces selected test results of two models out of 15 wall-footing
models, which are tested in this study. Results are presented in terms of time
reference, not stress reference. Stresses, settlement, lateral and vertical earth forces,
and lateral deflection-time histories measured in the wall-footing models are
presented and compared between the two different models. The chapter also includes
a discussion of the test performance and the applied vertical stress reproducibility
between wall-footing model tests.
Analysis of the test results is presented in Chapter 5, including a comparison of
the responses of all wall-footing model tests, in order to isolate the effect of different
design parameters on performance. The chapter gives a quantitative comparison of the
measured responses with those predicted using current analysis and design methods.
Lastly, Chapter 6 summarizes the findings, implications for current design
methods for non-yielding retaining walls supporting strip footing, and presents
recommendations for future research.
22
Chapter 2: Literature Review
2.1 General
Predictions of the surcharge induced lateral earth pressure are vital for the
basement wall design. Therefore the earth pressure theories attracted significant
amount of research workers in the field of geotechnical engineering. The investigation
of lateral earth pressure due to soil-self-weight and due to external surcharge is
usually achieved by performing laboratory tests on either full scale or scaled models
under a controlled environment. In addition analytical solutions based on theory of
elasticity were used to predict the lateral earth force on non-yielding walls due to soil
and surcharge loads. Numerical modeling was used to conduct parametric studies
wherever needed for response of non-yielding walls. This chapter presents the up to
date studies that related to the force-displacement behavior of non-yielding basement
walls.
2.2 At-Rest Lateral Earth Pressure on Non-Yielding Walls
The at-rest coefficient of earth pressure (Ko) is the ratio between the effective
horizontal stress (h) and effective vertical stress (v) [7], and calculated as:
v
hoK
(2.1)
Geotechnical designers have traditionally used the at-rest earth pressure coefficient
equation proposed by Jaky [1] to calculate the earth pressure coefficient against non-
yielding walls as flows:
sin1oK (2.2)
where (ϕ) is the effective angle of internal friction of the soil. Although Equation (2.2)
is a 60 years old, it is simplified in a widely accepted form to be still used by
engineering practitioners.
According to Bishop [8], in cases where the soil is consolidated under the
condition of no horizontal deformation, i.e. there were no shear stresses applied to the
planes in which the principal stresses act [8], then Equation (2.2) can be used to
calculate the ration of the horizontal effective stress to the vertical effective stress.
Other scholars have showed that the at-rest coefficient of earth pressure, in the
condition where no occurrence of strain in the direction of the minor principal
effective stress the (Ko) is the ratio of increments of minor principal effective stress to
major effective stress [9]. Table 1 shows typical values of (Ko).
23
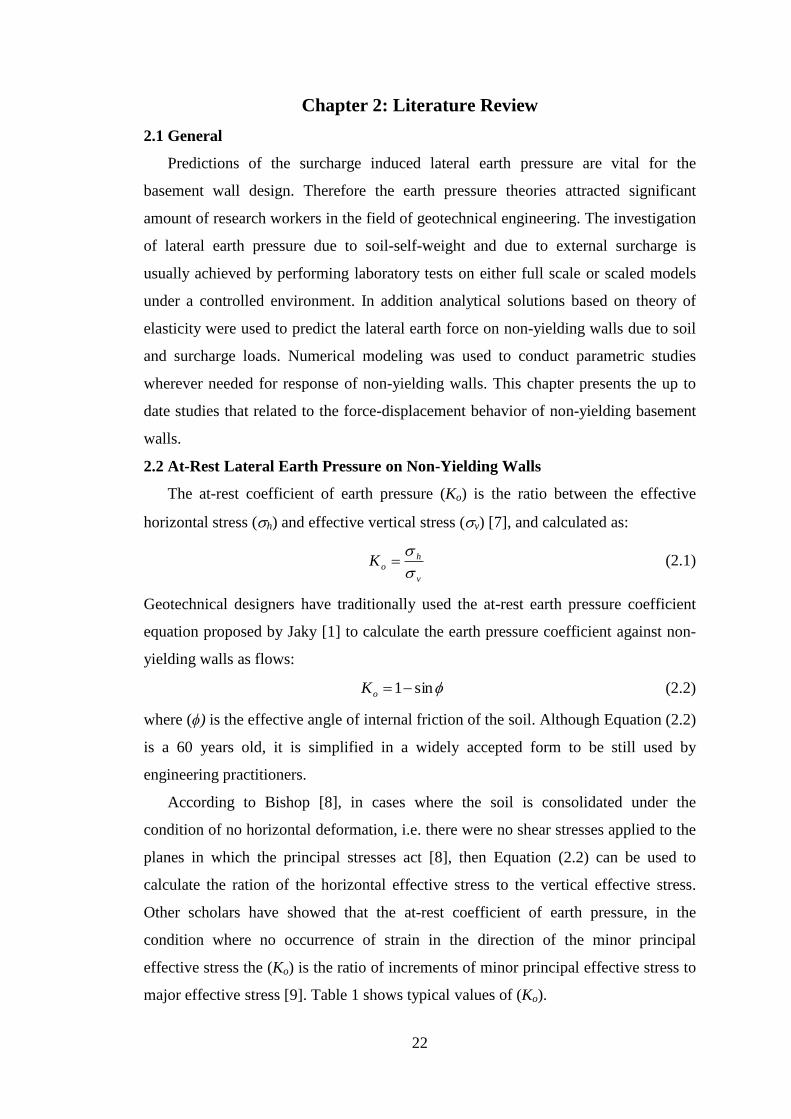
Table 1: Typical values of K0 [13]
Soil At-rest earth pressures coefficient (Ko)
Dense sand 0.40-0.45
Lose sand 0.45-0.50
Mechanically compacted sand 0.8-1.5
Normally consolidated clay 0.5-0.6
Over-consolidated clay 1.0-1.4
Experimental and numerical techniques have been used to investigate at-rest
lateral earth pressure distribution behind non-yielding walls. Sherif et al. [4], Fang et
al. [11], Fang and Ishibashi [12], Mackey and Kirk [13], and El-Emam [5] have
implemented a small scale experimental model walls to investigate the at-rest earth
pressure distribution behind non-yielding walls. Other researchers such as El-Emam
[6], Seed and Duncan [16], Clough and Duncan [16] have used Finite Element
Methods (FEM) to investigate the same phenomena.
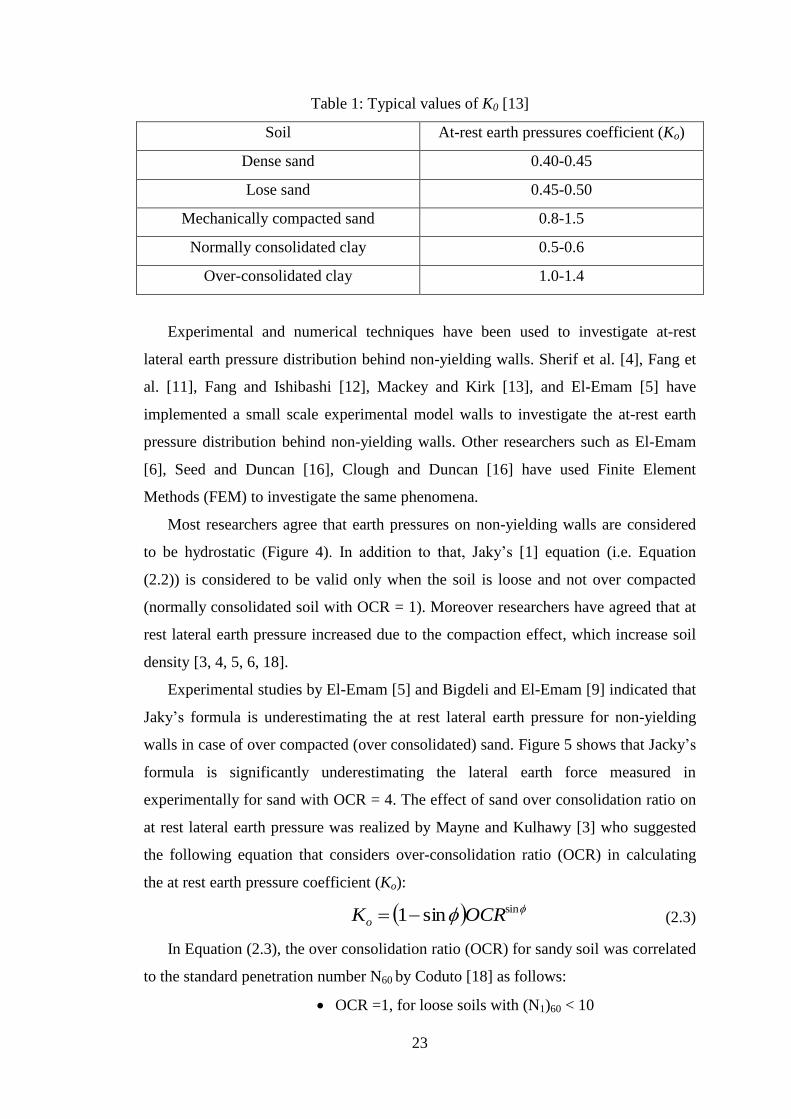
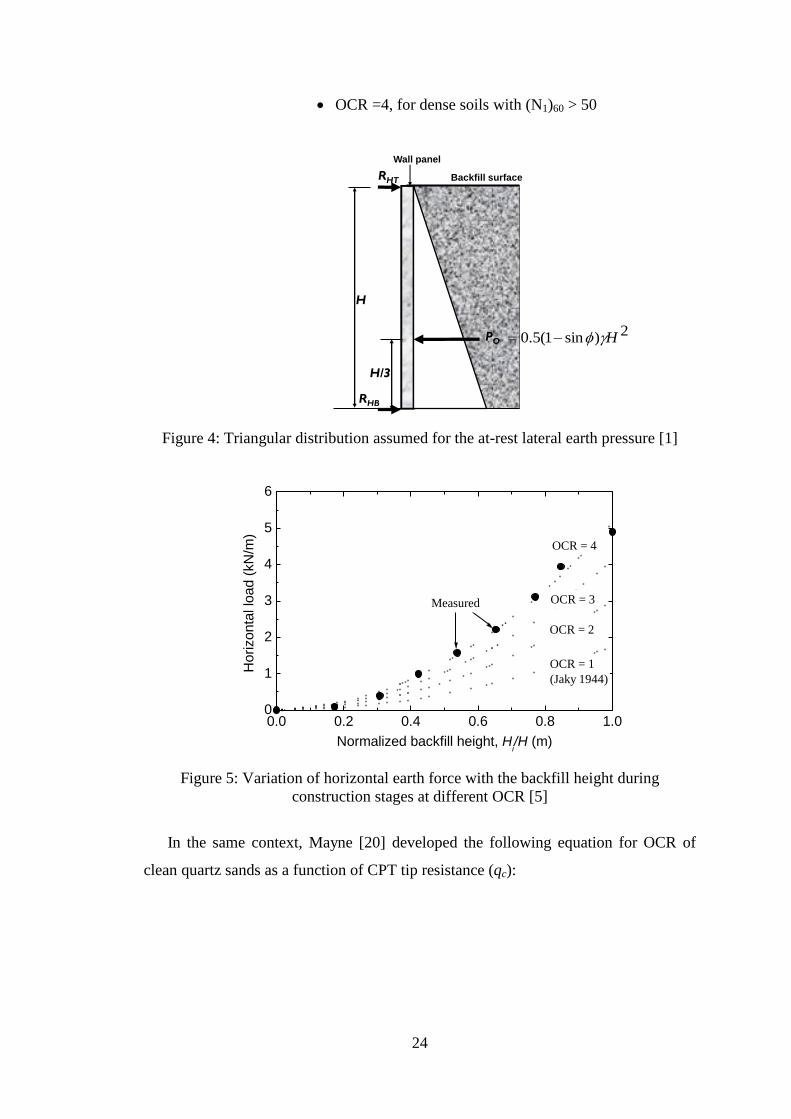
Most researchers agree that earth pressures on non-yielding walls are considered
to be hydrostatic (Figure 4). In addition to that, Jaky’s [1] equation (i.e. Equation
(2.2)) is considered to be valid only when the soil is loose and not over compacted
(normally consolidated soil with OCR = 1). Moreover researchers have agreed that at
rest lateral earth pressure increased due to the compaction effect, which increase soil
density [3, 4, 5, 6, 18].
Experimental studies by El-Emam [5] and Bigdeli and El-Emam [9] indicated that
Jaky’s formula is underestimating the at rest lateral earth pressure for non-yielding
walls in case of over compacted (over consolidated) sand. Figure 5 shows that Jacky’s
formula is significantly underestimating the lateral earth force measured in
experimentally for sand with OCR = 4. The effect of sand over consolidation ratio on
at rest lateral earth pressure was realized by Mayne and Kulhawy [3] who suggested
the following equation that considers over-consolidation ratio (OCR) in calculating
the at rest earth pressure coefficient (Ko):
sinsin1 OCRKo (2.3)
In Equation (2.3), the over consolidation ratio (OCR) for sandy soil was correlated
to the standard penetration number N60 by Coduto [18] as follows:
OCR =1, for loose soils with (N1)60 < 10
24
OCR =4, for dense soils with (N1)60 > 50
Figure 4: Triangular distribution assumed for the at-rest lateral earth pressure [1]
0.0 0.2 0.4 0.6 0.8 1.00
1
2
3
4
5
6
OCR = 4
OCR = 3
OCR = 2
OCR = 1
(Jaky 1944)
Measured
Horizonta
l lo
ad (
kN
/m)
Normalized backfill height, Hi/H (m)
Figure 5: Variation of horizontal earth force with the backfill height during
construction stages at different OCR [5]
In the same context, Mayne [20] developed the following equation for OCR of
clean quartz sands as a function of CPT tip resistance (qc):
PO
Ti
Backfill surface
Wall panel
RHT
RHB
H
H/3
2)sin1(5.0 H
25
27.0'sin
1
31.0'
22.0
.
)'sin1(
192.0
e
P
P
q
OCR
a
vo
a
c
(2.4)
Mayne [20] developed the following equation for OCR of sand as a function of SPT
(N60) as follows:
m
vo
a NP
OCR 60'47.0
(2.5)
In Equations (2.4) and (2.5), (Pa) is the atmospheric pressure (100 KPa) and (’vo)
is the effective vertical overburden pressure at the depth of the measurement of (N60)
or qc. The two equations are based on regression analysis, and experimental
verification for different sandy soil is required.
2.3 Lateral Earth Pressure on Retaining Walls due to Surcharges
According to Dave and Dasaka [21], the magnitude of the maximum predicted
lateral earth pressure induced by surcharge is closer to the predictions by Jaky’s [1]
equation. Moreover they concluded that predictions obtained by Jaky, for the at-rest
pressure, are matching the experimental results when the surcharge was closer to the
wall.
A modified form of Boussinesq’s equation was implemented by Jarquio [22] in
which a mathematical solution was developed for lateral earth pressure imposed on a
vertical basement wall by different types of surcharge loading. In this method, Jarquio
[22] was able to develop expressions to determine the location of the total lateral earth
pressure due surcharge such as point load, line load and strip load, in addition to
locating the position of maximum lateral pressure.
Lateral earth pressure created by surcharge strip loads, placed on the surface of a
backfill behind rigid retaining wall, can be estimated based on the theory of elasticity
(Boussinesq’s equations) [24, 25]. However, experimental results indicated that the
theory of elasticity does not consider the contribution of the soil strength in
calculating lateral earth pressure against retaining wall. Therefore, the elasticity
theory is expected to show inaccurate results when calculating lateral earth pressure
for such wall-footing configuration. Researchers suggested a closed form solution to
investigate the active earth pressure coefficient taking into consideration the influence
26
of the soil self-weight and the distanced of surcharge load from the back of the wall
[23]. The lateral earth pressure created by surcharge strip loads can be found
accurately by the 45° load distribution and the generalized Coulomb equation,
together with arching equation in case of narrow backfill [24].
The linear elastic solution for lateral earth pressure on non-yielding walls is
considered to be the most appropriate amongst all other solutions, as it predicts results
close to experimental tests. In linear elastic solution, researchers only considered two
parameters which are the elastic modulus (E) and Poisson ratio (υ) in order to outline
the stress and strain correlation for soil. The shortcoming of such models is that the
strength of soil does not have any effect on neither the stress distributions nor
displacements. In addition to that, the effect of the soil variation in properties with
depth or different stress states is not taken into consideration in such models [25].
Jarquio [22] and Kalender [26] both discussed different solutions for yielding and
non-yielding structures with surcharge, and suggested implementing the elastic
solution to find the lateral earth pressure for unyielding basement walls. Steenfelt and
Hansen [29, 30] proposed that the lateral earth pressure of non-yielding walls could be
found using the elastic solution; however, this solution could not be applied to
yielding walls. The generalized Coulomb earth pressure theory solves earth pressure
with surcharge problems with several boundary conditions [24, 30]. This method is
based on the limit-equilibrium analysis and known to be highly precise for the case of
the active state (i.e. yielding walls).
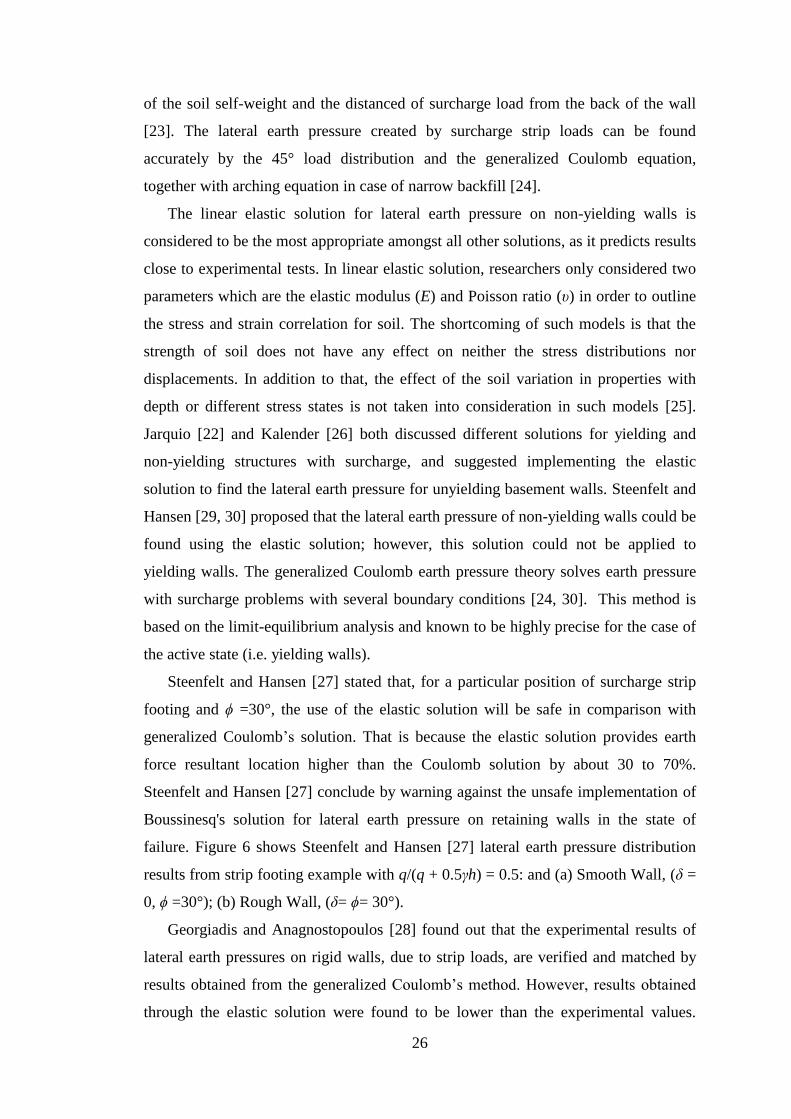
Steenfelt and Hansen [27] stated that, for a particular position of surcharge strip
footing and ϕ =30°, the use of the elastic solution will be safe in comparison with
generalized Coulomb’s solution. That is because the elastic solution provides earth
force resultant location higher than the Coulomb solution by about 30 to 70%.
Steenfelt and Hansen [27] conclude by warning against the unsafe implementation of
Boussinesq's solution for lateral earth pressure on retaining walls in the state of
failure. Figure 6 shows Steenfelt and Hansen [27] lateral earth pressure distribution
results from strip footing example with q/(q + 0.5γh) = 0.5: and (a) Smooth Wall, (δ =
0, ϕ =30°); (b) Rough Wall, (δ= ϕ= 30°).
Georgiadis and Anagnostopoulos [28] found out that the experimental results of
lateral earth pressures on rigid walls, due to strip loads, are verified and matched by
results obtained from the generalized Coulomb’s method. However, results obtained
through the elastic solution were found to be lower than the experimental values.
27
Misra [29] investigated different categories of backfill soil under wheel loadings,
taking into consideration different soil properties, and noted the difference of lateral
pressure distribution caused by each soil type. Moreover, Misra [29] verified results
with theoretical implementation of Boussinesq’s approach explaining the
discrepancies between the results obtained using elastic theories and actual results.
Finally Misra [29] observed that the softer/looser the backfill soil, the poorer is the
lateral stress transmission, resulting in an overall decrease of the lateral pressure on
the retaining structures.
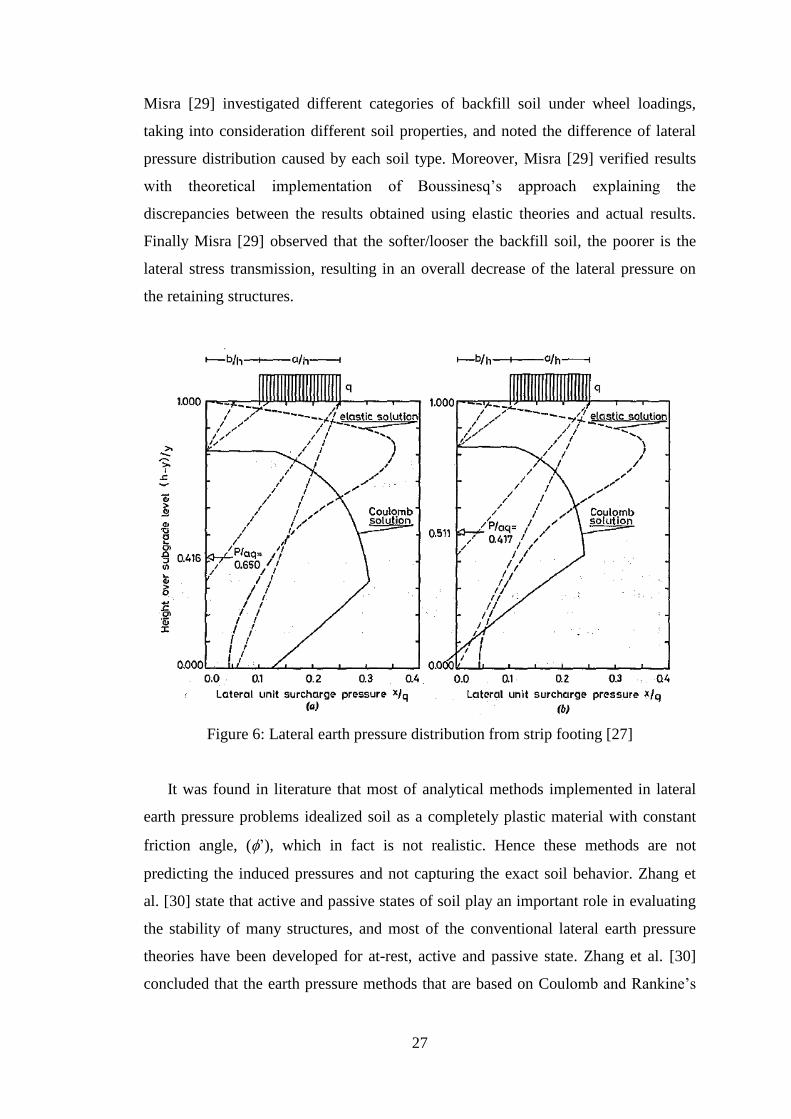
Figure 6: Lateral earth pressure distribution from strip footing [27]
It was found in literature that most of analytical methods implemented in lateral
earth pressure problems idealized soil as a completely plastic material with constant
friction angle, (’), which in fact is not realistic. Hence these methods are not
predicting the induced pressures and not capturing the exact soil behavior. Zhang et
al. [30] state that active and passive states of soil play an important role in evaluating
the stability of many structures, and most of the conventional lateral earth pressure
theories have been developed for at-rest, active and passive state. Zhang et al. [30]
concluded that the earth pressure methods that are based on Coulomb and Rankine’s
28
theories are able to find lateral earth pressure induced by normally consolidated sands,
for at rest, active and passive states of stress in soils with surcharge loads.
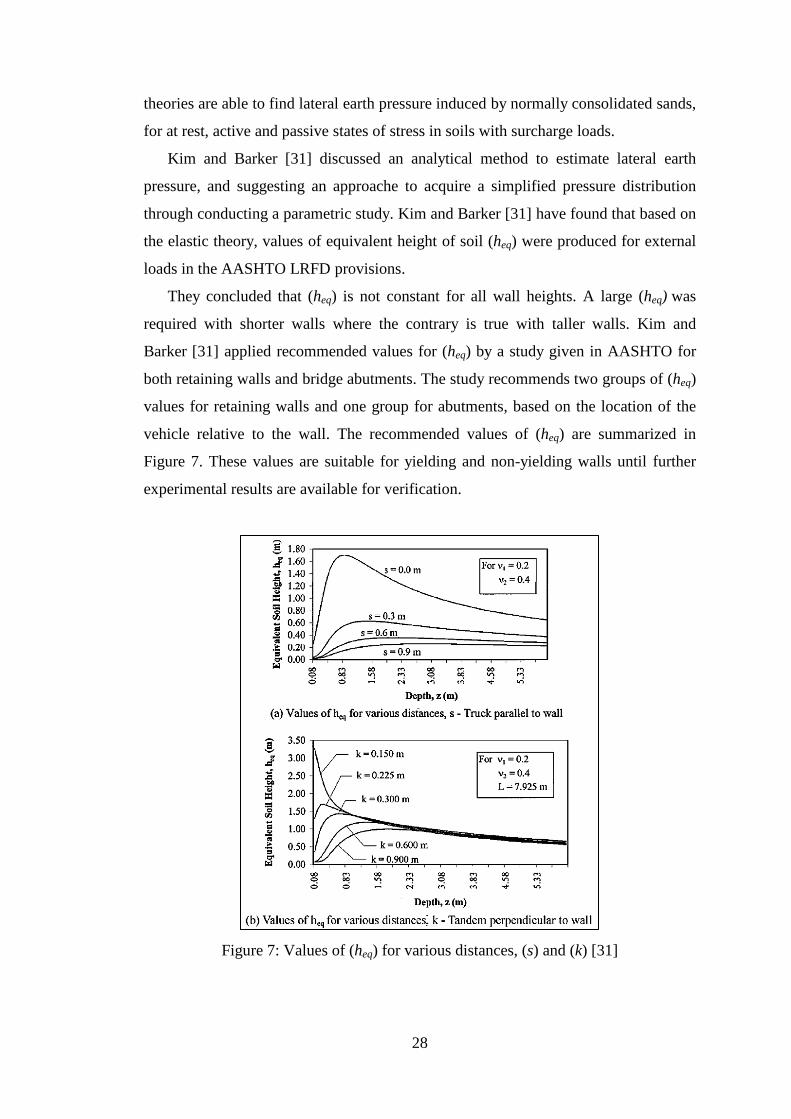
Kim and Barker [31] discussed an analytical method to estimate lateral earth
pressure, and suggesting an approache to acquire a simplified pressure distribution
through conducting a parametric study. Kim and Barker [31] have found that based on
the elastic theory, values of equivalent height of soil (heq) were produced for external
loads in the AASHTO LRFD provisions.
They concluded that (heq) is not constant for all wall heights. A large (heq) was
required with shorter walls where the contrary is true with taller walls. Kim and
Barker [31] applied recommended values for (heq) by a study given in AASHTO for
both retaining walls and bridge abutments. The study recommends two groups of (heq)
values for retaining walls and one group for abutments, based on the location of the
vehicle relative to the wall. The recommended values of (heq) are summarized in
Figure 7. These values are suitable for yielding and non-yielding walls until further
experimental results are available for verification.
Figure 7: Values of (heq) for various distances, (s) and (k) [31]
29
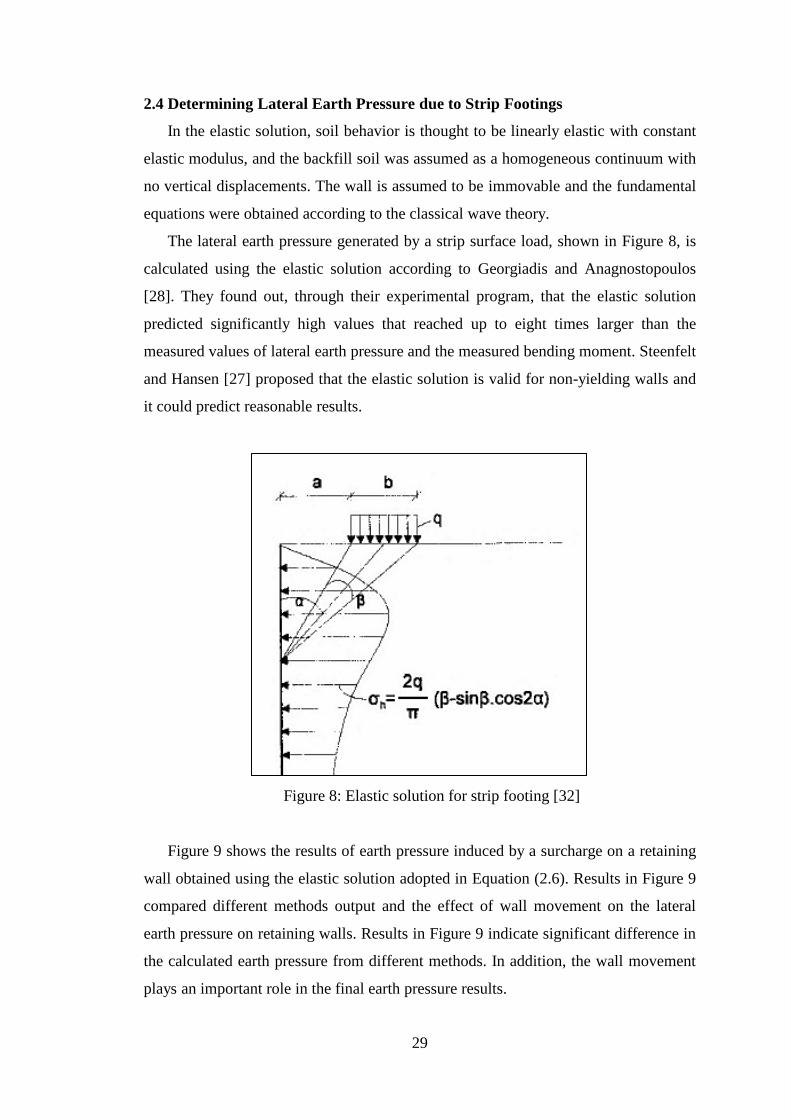
2.4 Determining Lateral Earth Pressure due to Strip Footings
In the elastic solution, soil behavior is thought to be linearly elastic with constant
elastic modulus, and the backfill soil was assumed as a homogeneous continuum with
no vertical displacements. The wall is assumed to be immovable and the fundamental
equations were obtained according to the classical wave theory.
The lateral earth pressure generated by a strip surface load, shown in Figure 8, is
calculated using the elastic solution according to Georgiadis and Anagnostopoulos
[28]. They found out, through their experimental program, that the elastic solution
predicted significantly high values that reached up to eight times larger than the
measured values of lateral earth pressure and the measured bending moment. Steenfelt
and Hansen [27] proposed that the elastic solution is valid for non-yielding walls and
it could predict reasonable results.
Figure 8: Elastic solution for strip footing [32]
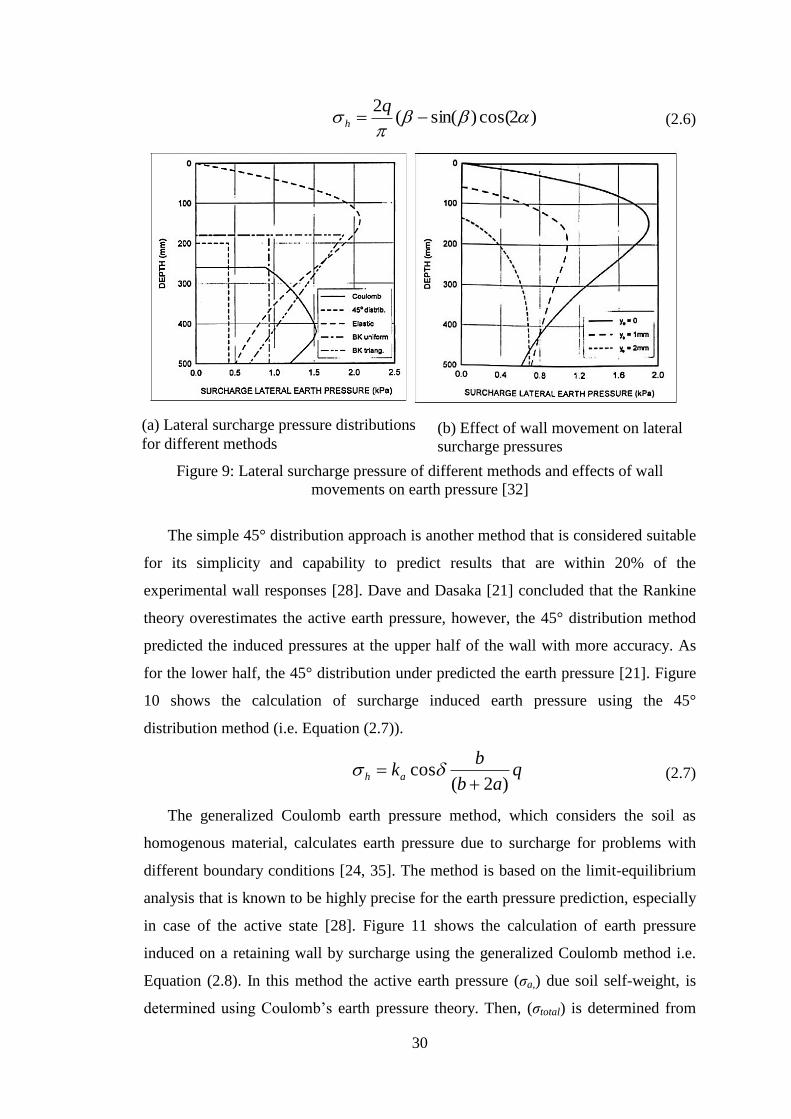
Figure 9 shows the results of earth pressure induced by a surcharge on a retaining
wall obtained using the elastic solution adopted in Equation (2.6). Results in Figure 9
compared different methods output and the effect of wall movement on the lateral
earth pressure on retaining walls. Results in Figure 9 indicate significant difference in
the calculated earth pressure from different methods. In addition, the wall movement
plays an important role in the final earth pressure results.
30
)2cos()sin((
2
qh (2.6)
Figure 9: Lateral surcharge pressure of different methods and effects of wall
movements on earth pressure [32]
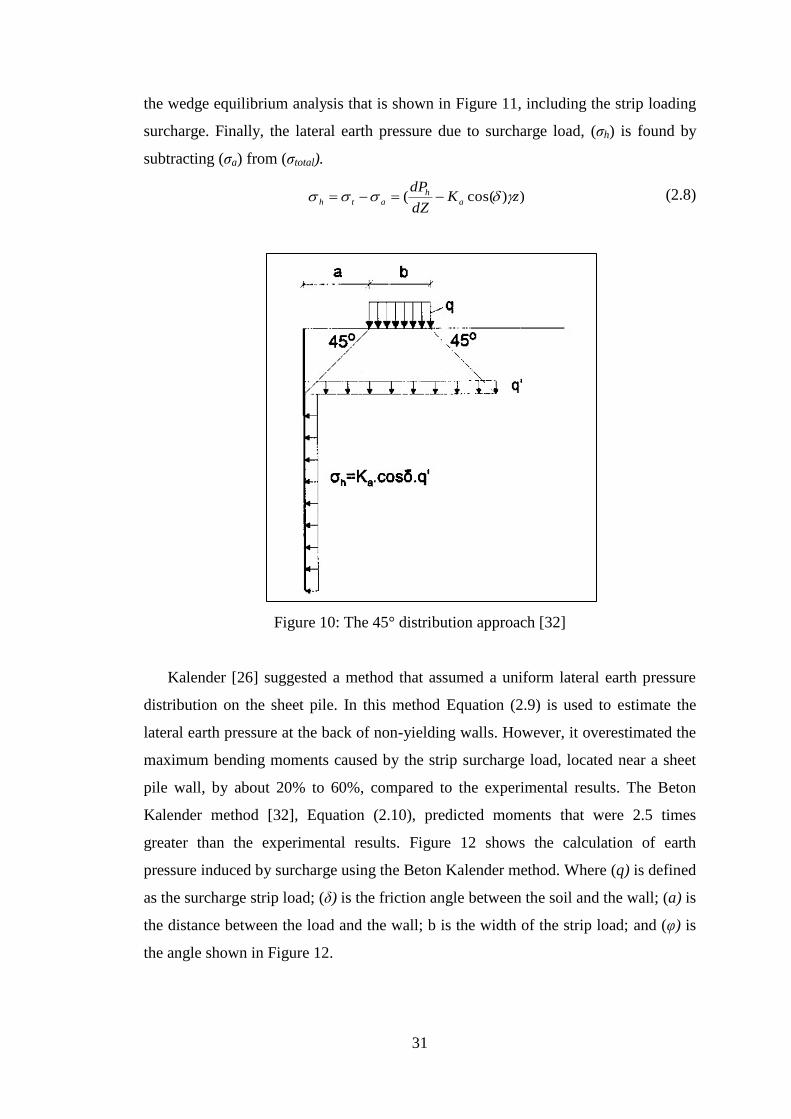
The simple 45° distribution approach is another method that is considered suitable
for its simplicity and capability to predict results that are within 20% of the
experimental wall responses [28]. Dave and Dasaka [21] concluded that the Rankine
theory overestimates the active earth pressure, however, the 45° distribution method
predicted the induced pressures at the upper half of the wall with more accuracy. As
for the lower half, the 45° distribution under predicted the earth pressure [21]. Figure
10 shows the calculation of surcharge induced earth pressure using the 45°
distribution method (i.e. Equation (2.7)).
qab
bkah
)2(cos
(2.7)
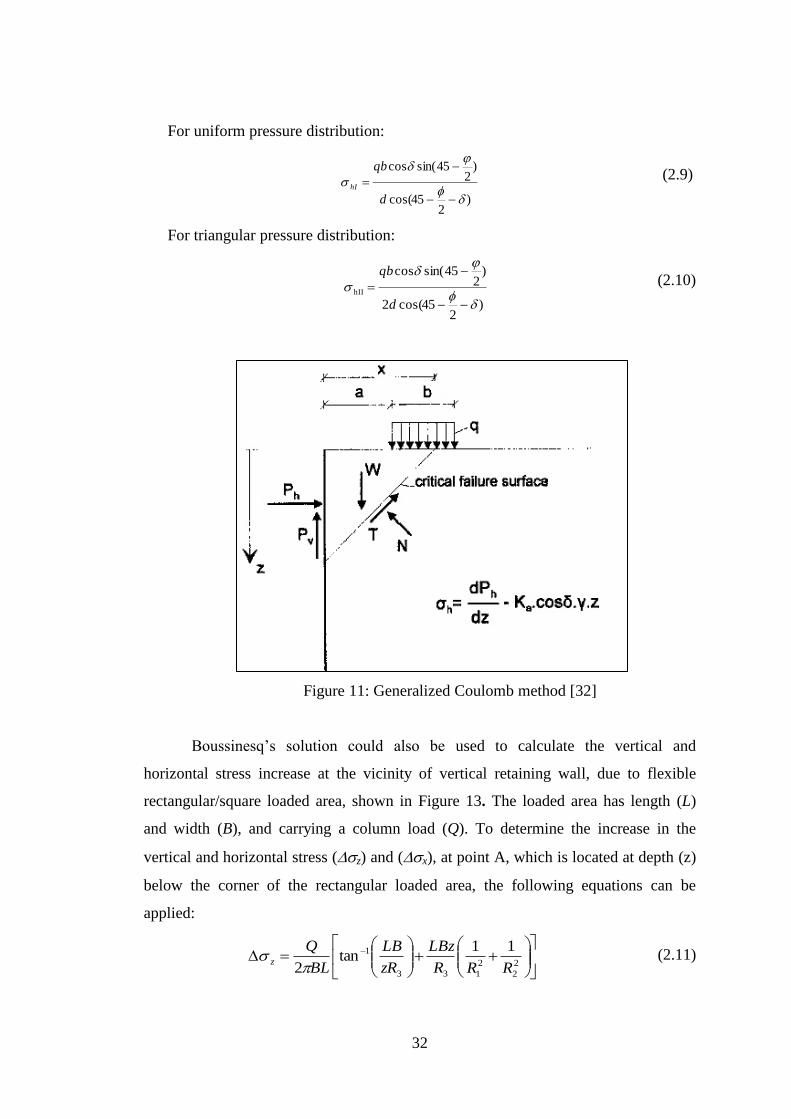
The generalized Coulomb earth pressure method, which considers the soil as
homogenous material, calculates earth pressure due to surcharge for problems with
different boundary conditions [24, 35]. The method is based on the limit-equilibrium
analysis that is known to be highly precise for the earth pressure prediction, especially
in case of the active state [28]. Figure 11 shows the calculation of earth pressure
induced on a retaining wall by surcharge using the generalized Coulomb method i.e.
Equation (2.8). In this method the active earth pressure (σa,) due soil self-weight, is
determined using Coulomb’s earth pressure theory. Then, (σtotal) is determined from
(a) Lateral surcharge pressure distributions
for different methods (b) Effect of wall movement on lateral
surcharge pressures
31
the wedge equilibrium analysis that is shown in Figure 11, including the strip loading
surcharge. Finally, the lateral earth pressure due to surcharge load, (σh) is found by
subtracting (σa) from (σtotal).
))cos(( zK
dZ
dPa
hath (2.8)
Figure 10: The 45° distribution approach [32]
Kalender [26] suggested a method that assumed a uniform lateral earth pressure
distribution on the sheet pile. In this method Equation (2.9) is used to estimate the
lateral earth pressure at the back of non-yielding walls. However, it overestimated the
maximum bending moments caused by the strip surcharge load, located near a sheet
pile wall, by about 20% to 60%, compared to the experimental results. The Beton
Kalender method [32], Equation (2.10), predicted moments that were 2.5 times
greater than the experimental results. Figure 12 shows the calculation of earth
pressure induced by surcharge using the Beton Kalender method. Where (q) is defined
as the surcharge strip load; (δ) is the friction angle between the soil and the wall; (a) is
the distance between the load and the wall; b is the width of the strip load; and (φ) is
the angle shown in Figure 12.
32
For uniform pressure distribution:
)2
45cos(
)2
45sin(cos
d
qb
hI
(2.9)
For triangular pressure distribution:
)2
45cos(2
)2
45sin(cos
hII
d
qb
(2.10)
Figure 11: Generalized Coulomb method [32]
Boussinesq’s solution could also be used to calculate the vertical and
horizontal stress increase at the vicinity of vertical retaining wall, due to flexible
rectangular/square loaded area, shown in Figure 13. The loaded area has length (L)
and width (B), and carrying a column load (Q). To determine the increase in the
vertical and horizontal stress (z) and (x), at point A, which is located at depth (z)
below the corner of the rectangular loaded area, the following equations can be
applied:
2
2
2
133
1 11tan
2 RRR
LBz
zR
LB
BL
Qz
(2.11)
33
3
2
13
1tan2 RR
LBz
zR
LB
BL
Qx
(2.12)
Figure 12: Beton Kalender method [32]
In Equations (2.11) and (2.12), R1 = (L2
+ z2)1/2
, R2 = (B2
+ z2)1/2
, and R3 = (L2 + B
2
+ z2)1/2
. It should be noted that, these equations are used only to calculate stresses at a
point under the corner of the loaded area. For points located away from the corner,
Equations (2.11) & (2.12) can still be used with some modifications in the loaded area
in order to accommodate the point of interest under corners of the modified areas Das
[36].
Figure 13: Stress imposed by rectangular isolated footing on adjacent basement
wall [36]
z
x
Q (kN)
Z
L
B
34
2.5 Compaction induced Earth Pressure on Retaining Structures
Different research workers have studied the effect of compaction on the lateral
earth pressure behind retaining walls [37, 38, 39, 40]. They have noticed an
immediate increase in vertical earth pressures after compaction ranging between 10-
100% based on the compaction effort used in the layers. Aggour and Brown
developed a numerical model to predict induced earth pressure and wall deflection
due to compaction. They stated that there was temporary increase in tractions and
deflections when a compactor moves parallel to the wall, which is then it reduced to a
residual stresses values upon removal of the compaction equipment [34]. Aggour and
Brown [34] incrementally backfilled the soil to simulate reality, and concluded that
compaction effort affected distribution of earth pressure. In terms of magnitude, end
values were twice the initial values for the top half of the wall, as shown in Figure 14.
Aggour and Brown also concluded that, wall deflection was significantly more for
compacted backfill in comparison with an un-compacted backfill. Finally the process
of backfilling, residual wall deflections, and residual pressures were less severe for
the case of non-yielding walls in comparison with yielding walls [34].
Figure 14: Earth pressures due to compactions using FEA [34]
Compaction influenced zones are those that are subjected to high pressure and
reached high relative field density. These zones tend to accommodate for high lateral
earth pressure. Generally soil compaction is expected to cause high earth pressures
35
near the top of the backfill [35]. In the compaction influenced zone, lateral earth
pressure was higher than predicted using Jaky’s solution and the soil stress state can
reach the passive state [4, 39] Investigations of the compaction influenced zone
clearly showed that there was a major increase in the horizontal stresses in the soil
due to compaction [41, 42, 43, 44].
Duncan and Seed [36] mentioned that compaction of soil adjacent to non-yielding
walls can increase the lateral earth pressure near the surface, to values greater than
the at-rest stresses values of soil. They stated also that around 40% to 60 % of the
compaction induced pressure remained as residual pressure. Moreover, the increase
of the compaction induced earth pressure could be one of the causes of cracking in
the wall due to overstress [36]. Duncan and Seed [36] agreed with Sherif et al. [4]
that the horizontal stresses, induced and developed by compaction, tend to remain in
the soil deposit even if the compaction effort is removed from the backfill surface.
Several researchers [42, 45] deduced that in case the surcharge was located near
the non-yielding wall by approximately 0.15 m, it could result in a reduction of
lateral pressure in backfill compaction influenced zone. It is explained by Fang et al.
[37] that the surcharge exerting forces on the top of the soil backfill nearby the rigid
wall may compress the soil vertically. The resulted lateral deformation will cause the
compressed soil to be less passive and the lateral soil pressure will tend to decrease.
This occurrence will cease to exist when the surcharge load is removed from the
backfill [37].
0
1
2
3
4
5
6third vibrationsecond vibration
first vibration
Horizontal loadVertical load
thir
d v
ibra
tion
second v
ibra
tion
firs
t vib
ration
Load (
kN
/m)
Figure 15: Effect of second and third vibration compaction on the measured vertical
and horizontal earth forces on non-yielding wall [5]
36
The effect of compaction on non-yielding wall response was studied by El-Emam
[5] using vibration compaction. The result showed that repeated vibration during
construction stages may lead to over compaction of sand and therefore higher over-
consolidation ratio. El-Emam [5] estimated an over-consolidation ratio of 4 for
heavily compacted sand, which is an indication of the higher density of the sand.
Figure 15 presents the effect of additional vibration of over consolidated sand. It is
clear that further vibration of the model wall has insignificant effects on both lateral
and vertical earth forces. Therefore, further compaction beyond this density produced
a little value of lateral earth force. Figure 15 also indicated that the vertical force at
the bottom of the wall was slightly reduced with more vibration. This is attributed to
the slight uplift force developed between the sand and the facing panel [5].
Chen and Fang [38] conducted experimental tests on non-yielding walls to test
compaction induced earth pressure (See Figure 16). They used air dried Ottawa sand
as backfill compacted in five layers with a thickness of 0.3 m/layer. Each layer
surface was divided into seven lanes; each lane was compacted with one pass (70 sec)
using a 12.1 Kg (44 Hz) vibratory plate, parallel to the face of the model wall.
Figure 16: Distribution of vertical & horizontal earth pressure [38]
Chen and Fang [38] found out that, the vertical earth pressure estimated with the
traditional equation (σv = γ z) matches the experimental results. The effects of
compaction on the vertical earth pressure on the non-yielding wall were insignificant.
On the other hand, significant lateral earth pressure was imposed by vibratory
37
compaction on the wall. It was also noted that, the lateral earth pressure measured was
identical to the passive Rankine pressure only near the top of the wall. Chen and Fang
[38] found that the compaction influenced zone surfaced with the compaction surface
of each layer (See Figure 16). They have also found that Jaky’s stress matched the
measured lateral earth pressure below the compaction-influenced zone.
2.6 Soil Arching and Earth Pressures on Rigid Walls with Confined Backfills
Induced lateral earth pressure on non-yielding walls from a confined backfill is a
complex problem that includes the phenomenon of soil arching in the backfill
continuum, along with complex interaction between the soil-wall systems. In addition
to that, existence of vertical shear forces, cause a reduction in the effective vertical
pressure in the backfill zone in the vicinity of the non-yielding wall [39]. O’Neal and
Hagerty [39] agreed with Terzaghi [48] that soil arching is related to the capability of
soil in transferring shear stresses, and greatly affected by the shear strength of soil.
Moreover, they suggested two additional factors that contribute to the complexity of
the confined backfill-wall system, which are methods of construction and seasonal
temperature changes. Lateral earth pressures changed with changes in soil
temperatures. O’Neal and Hagerty [39] performed a temperature calibration process
that was developed and verified through experimental testing.
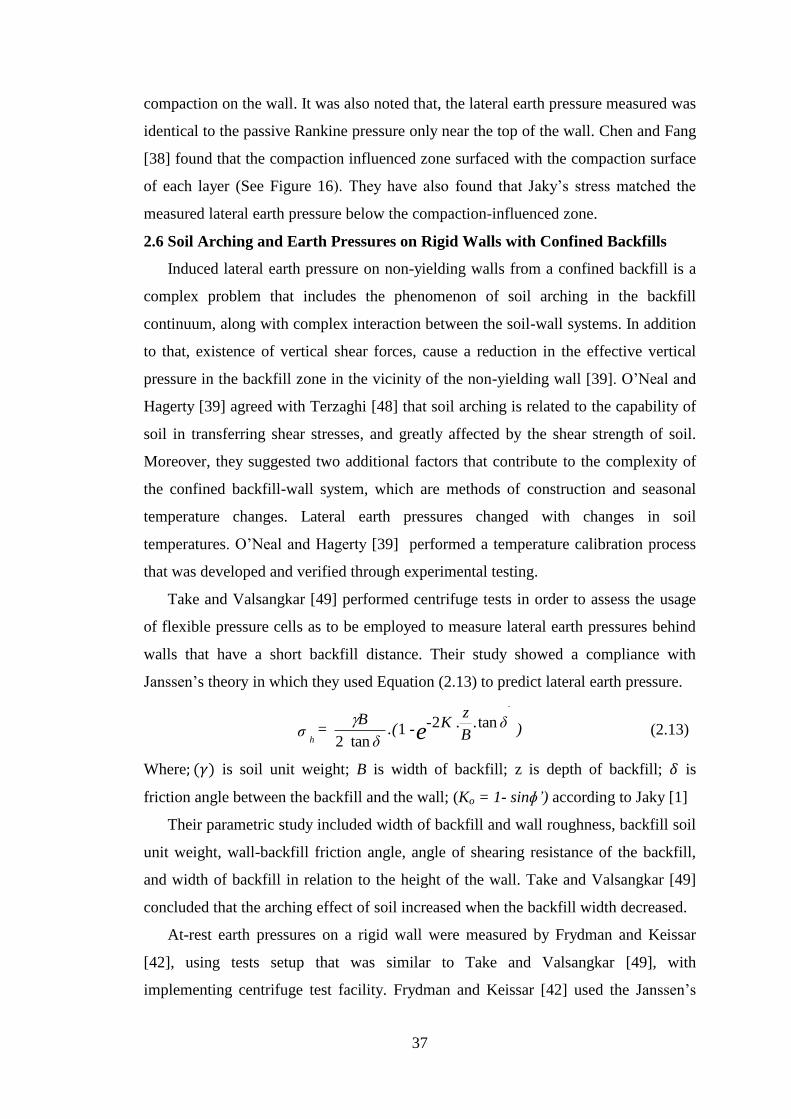
Take and Valsangkar [49] performed centrifuge tests in order to assess the usage
of flexible pressure cells as to be employed to measure lateral earth pressures behind
walls that have a short backfill distance. Their study showed a compliance with
Janssen’s theory in which they used Equation (2.13) to predict lateral earth pressure.
)δ.B
zK .- -.(
δ
B= σ e
-
h
tan21tan2
(2.13)
Where is soil unit weight; B is width of backfill; z is depth of backfill; is
friction angle between the backfill and the wall; (Ko = 1- sinɸ’) according to Jaky [1]
Their parametric study included width of backfill and wall roughness, backfill soil
unit weight, wall-backfill friction angle, angle of shearing resistance of the backfill,
and width of backfill in relation to the height of the wall. Take and Valsangkar [49]
concluded that the arching effect of soil increased when the backfill width decreased.
At-rest earth pressures on a rigid wall were measured by Frydman and Keissar
[42], using tests setup that was similar to Take and Valsangkar [49], with
implementing centrifuge test facility. Frydman and Keissar [42] used the Janssen’s
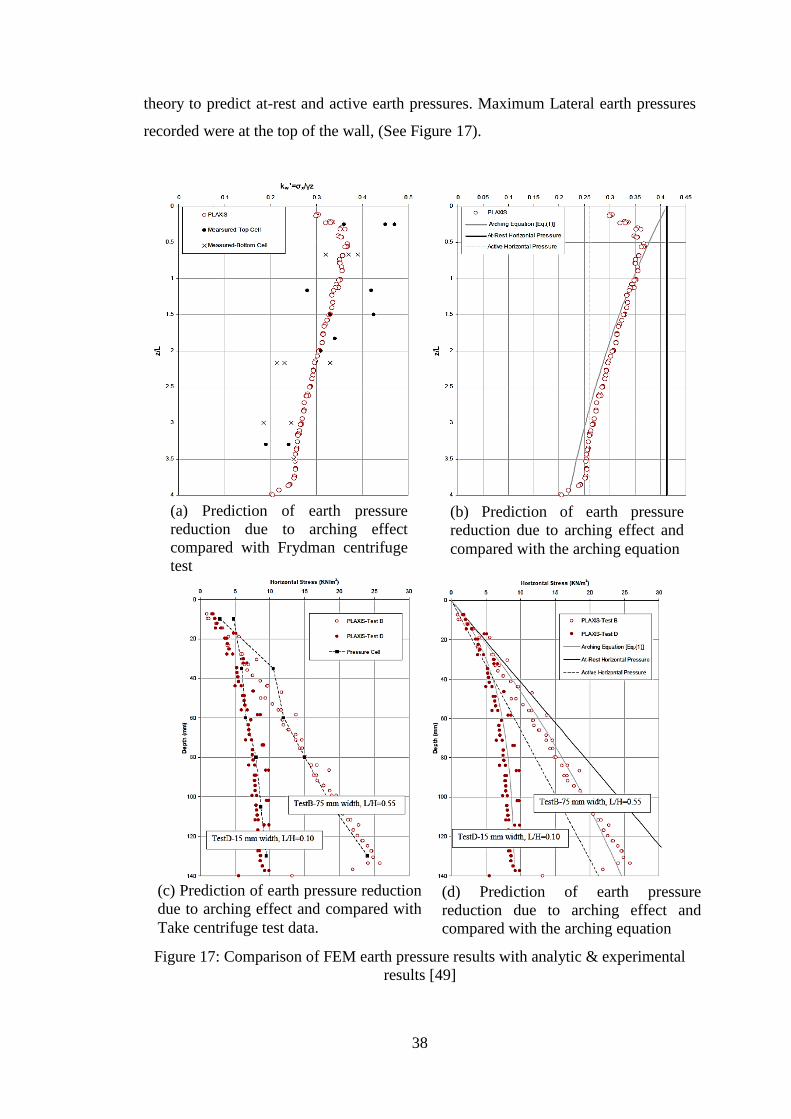
38
theory to predict at-rest and active earth pressures. Maximum Lateral earth pressures
recorded were at the top of the wall, (See Figure 17).
Figure 17: Comparison of FEM earth pressure results with analytic & experimental
results [49]
(b) Prediction of earth pressure
reduction due to arching effect and
compared with the arching equation
(a) Prediction of earth pressure
reduction due to arching effect
compared with Frydman centrifuge
test
(c) Prediction of earth pressure reduction
due to arching effect and compared with
Take centrifuge test data.
(d) Prediction of earth pressure
reduction due to arching effect and
compared with the arching equation
39
In addition, they concluded close agreement between the at-rest lateral earth
pressure predicted by Janssen’s theory and the measured values, while for the active
case pressures predictions were less than measured values [42]. The results of the
lateral earth pressure on the non-yielding wall, from Frydman and Keissar [42] study,
showed that Equation (2.13) was used for predicting lateral pressure on silo walls,
which can be used to predict lateral earth pressure for at-rest Ko conditions.
Compaction effort may cause significant variations from the predicted earth
pressure on the wall, Frydman and Keissar [42] suggested a conservative approach by
using a decreased (ϕ) value in calculating (K), to achieve an upper envelope to the
predicted lateral earth pressure.
Kniss et al. [51] conducted several runs of Finite Element Analysis (FEA) models
to study imposed earth pressures on a very stiff, reinforced non-yielding walls with
less than the normal width [51]. The FEA calculated earth pressures that were
compared to pressures from the arching equation, in addition to measured values from
Take and Valsangkar [49] and Frydman and Keissar [42] centrifuge tests on narrow
walls of low aspect ratios. Kniss et al. found that calculated pressures from FEA
matched results from arching equation and experimental results [49]. Kniss at al.
conclude that earth pressures become smaller as the wall aspect ratio decreases. FEM
earth pressures results were compared with Federal High Way Authority (FHWA)
mechanically stabilized earth walls criteria. Results of normal aspect ratio (L/H) of
0.70 matched recommended values for very stiff, inextensible non-yielding walls,
taking into consideration, that FEM of lower aspect ratios walls resulted with
significantly lower pressures, (See Figure 17)
2.7 Experimental Studies Investigating Earth Pressure
Berg [44] performed small scale model tests to study the effect of surcharge
loading on earth retaining walls. The main objective of measuring the earth pressures
at rest and horizontal displacement of the wall is to calibrate and evaluate the FE
models. Berg’s FEM that used Mohr-Coulomb criteria gave conforming results with
experimental results. It was noticed that in ϕ soils there were problems in converging
in FEM, due to the soil wall system interface at large shearing deformation.
El-Emam [6] modeled a non-yielding retaining wall system with uniformly graded
sand backfill, in order to measure the horizontal force acting on the wall. In addition
he measured the vertical force exerted at the bottom of the wall both at toe and heel. A
numerical model was developed and calibrated using the acquired data from load cells
40
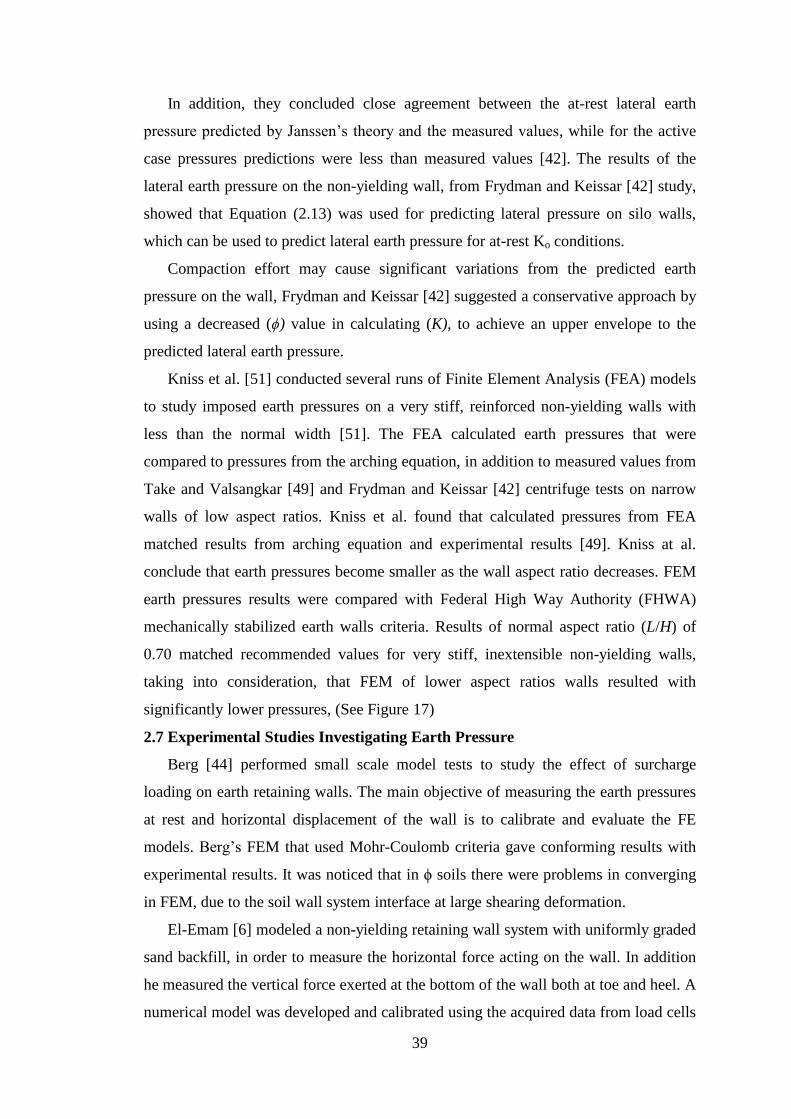
attached to the wall, and was used to predict further wall parameters. El-Emam [6]
prepared 1/3 scale models with dimensions of HxWxD 1m x 1.4m x 2.4m and
compacted it using a shaking table. In this study a wall of a 1 m height assumed to
represent a prototype wall of 3 m height. The experimental models were consisting of
a rigid wall and retained soil, the wall and soil were confined in an inflexible steel
box. Figure 18 shows the prepared non-yielding wall model tested by El-Emam [5].
The wall and the steel box were fixed to a (2.7m x 2.7m) shaking table and the
backfill soil length was 2.4 m from the wall to the box. During the test the horizontal
force experienced by the wall was measured using load cells placed on the horizontal
bracing beam from the box to the wall.
Figure 18: Model and instrumentations on a non-yielding wall on a shaking table [5]
Results reported by El-Emam [6] indicated that vertical load transferred to the
footing of the wall is equal to the wall self-weight in the case of non-yielding wall
with smooth back. In addition, it was concluded that the OCR of sands affected the at-
rest lateral earth force and is directly proportional to compaction. Jaky’s solution was
found to be underestimating the at-rest lateral earth pressure coefficient for over-
consolidated sand. The assumption of the classical theory that the resultant of the
backfill of at rest lateral earth pressure, which is at 0.3H, is not valid and the
measured earth pressure was located closer to 0.4H above the footing [6]. It also
indicated the invalidity of the assumed hydrostatic distribution for at-rest condition by
the classical theory for over-consolidated sand.
41
Take and Valsangkar [49] performed tests in order to assess the capability of
flexible pressure cells to measure lateral earth pressures behind walls that have a short
backfill distance. They compared the flexible earth pressure cells with the stiff
diaphragm earth pressure cells. They investigated the validity of Janssen’s arching
theory to the experimental measurements of lateral earth pressure imposed on the
rigid retaining wall. To validate the predicted values based on the arching theory, they
performed tests on backfill soil restricted by vertical surfaces with different frictional
properties. Results validated that the stiff earth pressure cells can be used to measure
earth pressures with more accuracy compared to elastic pressure cells which indicated
a nonlinear behavior. Moreover; the design of rigid retaining walls to account for the
full at-rest earth pressure force for narrow backfill widths is considered to be
conservative. Janssen’s arching theory predictions based on the average friction angle
for rigid walls, confirmed the reduction in lateral earth pressure for vertical surfaces
with different frictional characteristics. These are dependent on soil mobilization of
friction in the soil wall boundary.
Fang et al. [37] conducted an experimental model where a strip surcharge load
was placed at different distances away from the wall; m = 0.15m, 0.20m, 0.40m. It
was found out that the surcharge loading induced a decrease of lateral earth pressure
in the upper part of the wall, compressing the soil in that area making it less passive.
The authors compared theoretical prediction with experimental results obtained from
their models, and found out that predictions were overestimating lateral earth pressure
(See Figure 19). Fang et al. [37] reported that Jaky’s solution was found to be
underestimation lateral earth pressure in the compaction influenced zones near the top
of the wall that have experienced high pressures due to compaction.
Dave and Dasaka [21] examined both magnitude and distribution of at-earth
pressure with reference to wall movements to mobilize the active and passive
pressures on the wall simulating rigid cantilever retaining walls. They carried out
scale retaining wall models with cohesion-less backfill soil subjected to surcharge
loading. Dave and Dasaka [21] concluded from their study that earth pressure on the
wall gradually decreased as the wall moved away from the backfill but increased as
the wall moved towards the backfill under surcharge loading. In addition, they noticed
that due to surcharge loading earth pressure was greater near the top of the wall and
decreased nonlinearly down the wall, to record the lowest earth pressure in contrast to
usual uniform earth pressure throughout the retaining wall. Dave and Dasaka [21]
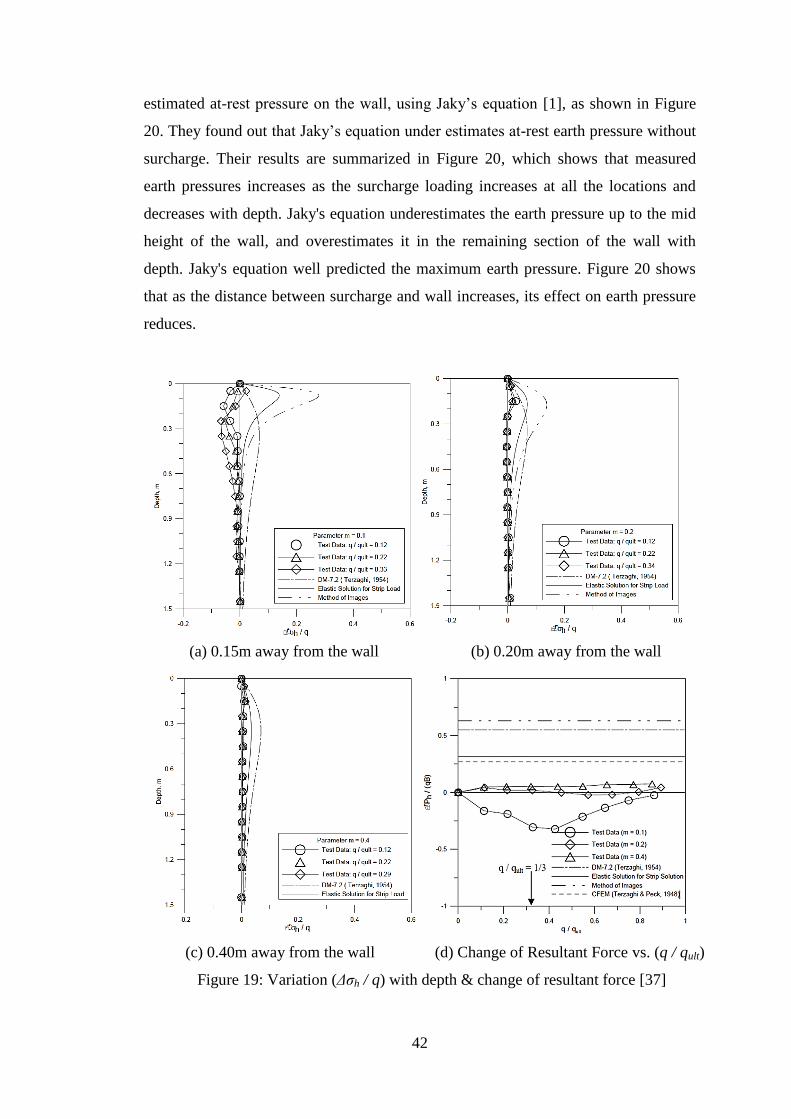
42
estimated at-rest pressure on the wall, using Jaky’s equation [1], as shown in Figure
20. They found out that Jaky’s equation under estimates at-rest earth pressure without
surcharge. Their results are summarized in Figure 20, which shows that measured
earth pressures increases as the surcharge loading increases at all the locations and
decreases with depth. Jaky's equation underestimates the earth pressure up to the mid
height of the wall, and overestimates it in the remaining section of the wall with
depth. Jaky's equation well predicted the maximum earth pressure. Figure 20 shows
that as the distance between surcharge and wall increases, its effect on earth pressure
reduces.
(a) 0.15m away from the wall (b) 0.20m away from the wall
(c) 0.40m away from the wall (d) Change of Resultant Force vs. (q / qult)
Figure 19: Variation (Δσh / q) with depth & change of resultant force [37]
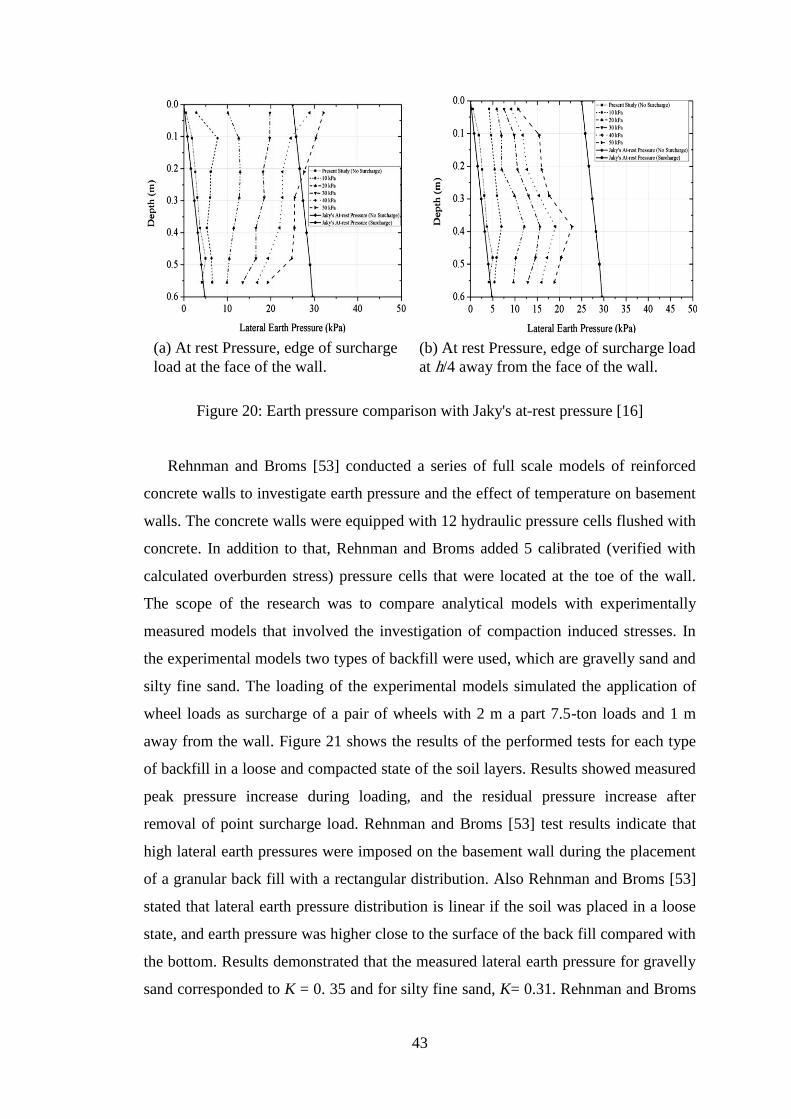
43
Figure 20: Earth pressure comparison with Jaky's at-rest pressure [16]
Rehnman and Broms [53] conducted a series of full scale models of reinforced
concrete walls to investigate earth pressure and the effect of temperature on basement
walls. The concrete walls were equipped with 12 hydraulic pressure cells flushed with
concrete. In addition to that, Rehnman and Broms added 5 calibrated (verified with
calculated overburden stress) pressure cells that were located at the toe of the wall.
The scope of the research was to compare analytical models with experimentally
measured models that involved the investigation of compaction induced stresses. In
the experimental models two types of backfill were used, which are gravelly sand and
silty fine sand. The loading of the experimental models simulated the application of
wheel loads as surcharge of a pair of wheels with 2 m a part 7.5-ton loads and 1 m
away from the wall. Figure 21 shows the results of the performed tests for each type
of backfill in a loose and compacted state of the soil layers. Results showed measured
peak pressure increase during loading, and the residual pressure increase after
removal of point surcharge load. Rehnman and Broms [53] test results indicate that
high lateral earth pressures were imposed on the basement wall during the placement
of a granular back fill with a rectangular distribution. Also Rehnman and Broms [53]
stated that lateral earth pressure distribution is linear if the soil was placed in a loose
state, and earth pressure was higher close to the surface of the back fill compared with
the bottom. Results demonstrated that the measured lateral earth pressure for gravelly
sand corresponded to K = 0. 35 and for silty fine sand, K= 0.31. Rehnman and Broms
(a) At rest Pressure, edge of surcharge
load at the face of the wall.
(b) At rest Pressure, edge of surcharge load
at h/4 away from the face of the wall.
44
[53] revealed that earth pressure redistribution was noticed in silty fine sand, and that
the earth pressures increased significantly when the back fill material reached freezing
point. Rehnman and Broms [53] noted in some cases that the total lateral pressure for
a compacted back fill was less than loose backfill.
i) Earth pressure for gravelly sand backfill:
(a) Loose fill; (b) Compacted into layers fill [53]
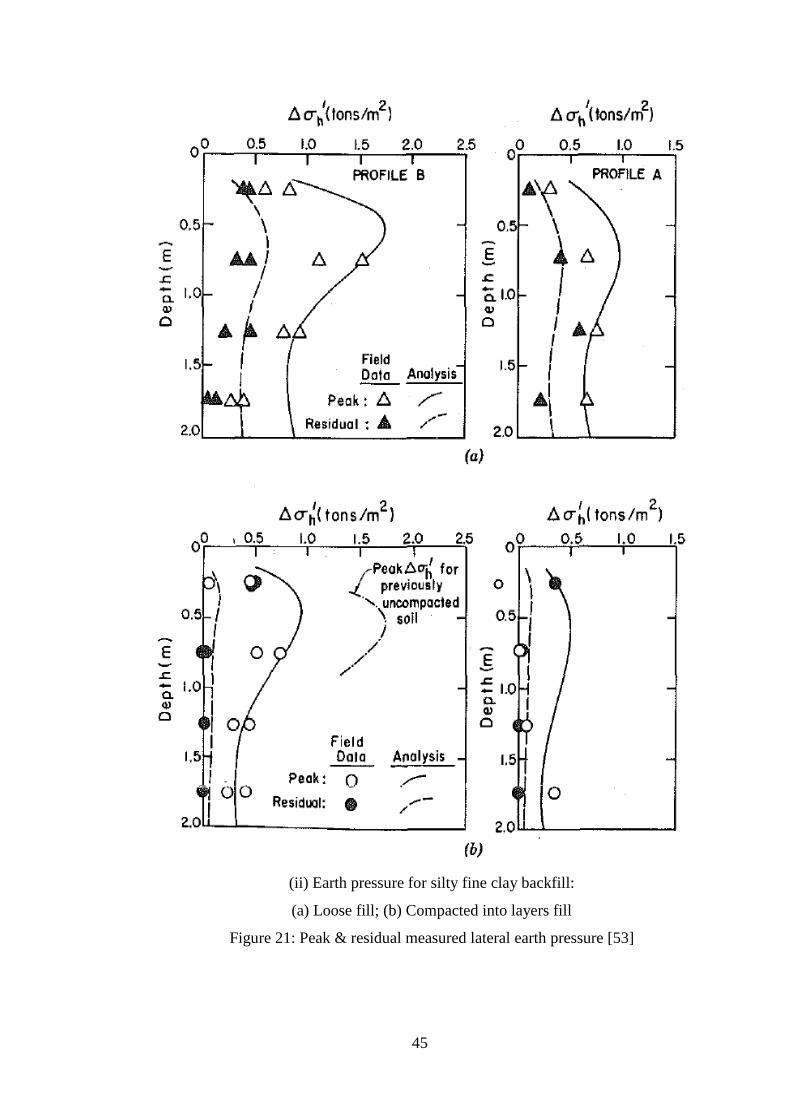
45
(ii) Earth pressure for silty fine clay backfill:
(a) Loose fill; (b) Compacted into layers fill
Figure 21: Peak & residual measured lateral earth pressure [53]
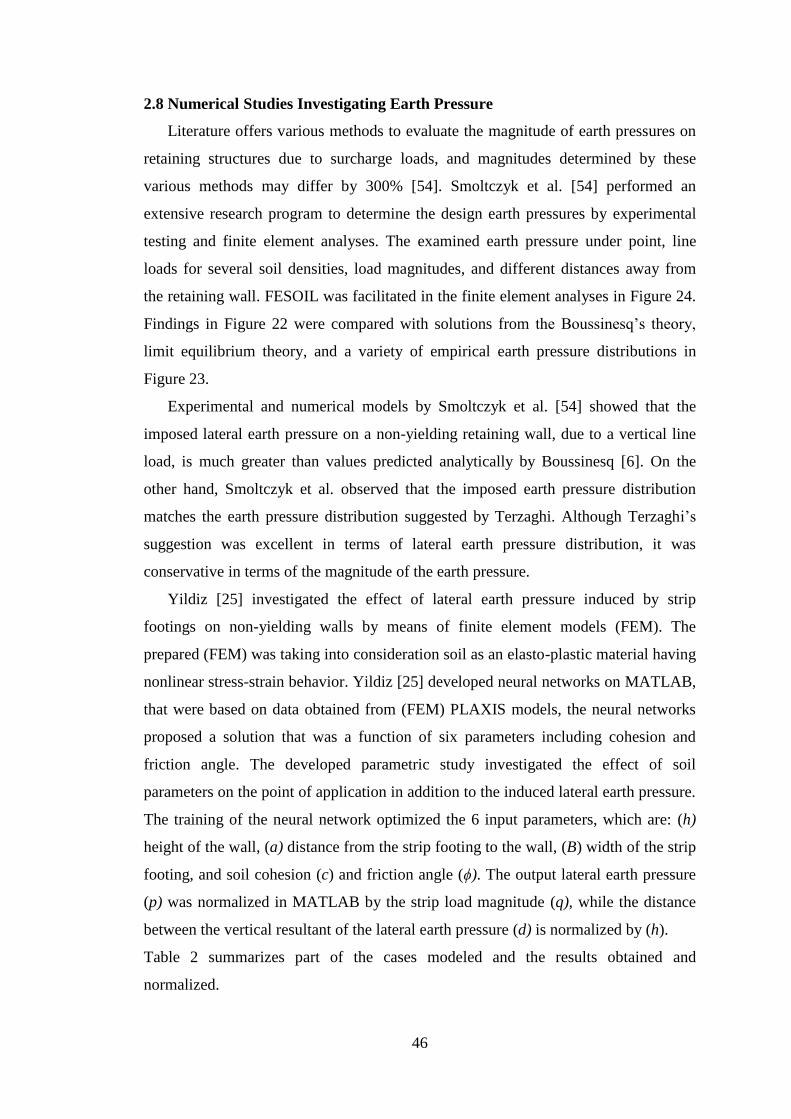
46
2.8 Numerical Studies Investigating Earth Pressure
Literature offers various methods to evaluate the magnitude of earth pressures on
retaining structures due to surcharge loads, and magnitudes determined by these
various methods may differ by 300% [54]. Smoltczyk et al. [54] performed an
extensive research program to determine the design earth pressures by experimental
testing and finite element analyses. The examined earth pressure under point, line
loads for several soil densities, load magnitudes, and different distances away from
the retaining wall. FESOIL was facilitated in the finite element analyses in Figure 24.
Findings in Figure 22 were compared with solutions from the Boussinesq’s theory,
limit equilibrium theory, and a variety of empirical earth pressure distributions in
Figure 23.
Experimental and numerical models by Smoltczyk et al. [54] showed that the
imposed lateral earth pressure on a non-yielding retaining wall, due to a vertical line
load, is much greater than values predicted analytically by Boussinesq [6]. On the
other hand, Smoltczyk et al. observed that the imposed earth pressure distribution
matches the earth pressure distribution suggested by Terzaghi. Although Terzaghi’s
suggestion was excellent in terms of lateral earth pressure distribution, it was
conservative in terms of the magnitude of the earth pressure.
Yildiz [25] investigated the effect of lateral earth pressure induced by strip
footings on non-yielding walls by means of finite element models (FEM). The
prepared (FEM) was taking into consideration soil as an elasto-plastic material having
nonlinear stress-strain behavior. Yildiz [25] developed neural networks on MATLAB,
that were based on data obtained from (FEM) PLAXIS models, the neural networks
proposed a solution that was a function of six parameters including cohesion and
friction angle. The developed parametric study investigated the effect of soil
parameters on the point of application in addition to the induced lateral earth pressure.
The training of the neural network optimized the 6 input parameters, which are: (h)
height of the wall, (a) distance from the strip footing to the wall, (B) width of the strip
footing, and soil cohesion (c) and friction angle (ϕ). The output lateral earth pressure
(p) was normalized in MATLAB by the strip load magnitude (q), while the distance
between the vertical resultant of the lateral earth pressure (d) is normalized by (h).
Table 2 summarizes part of the cases modeled and the results obtained and
normalized.
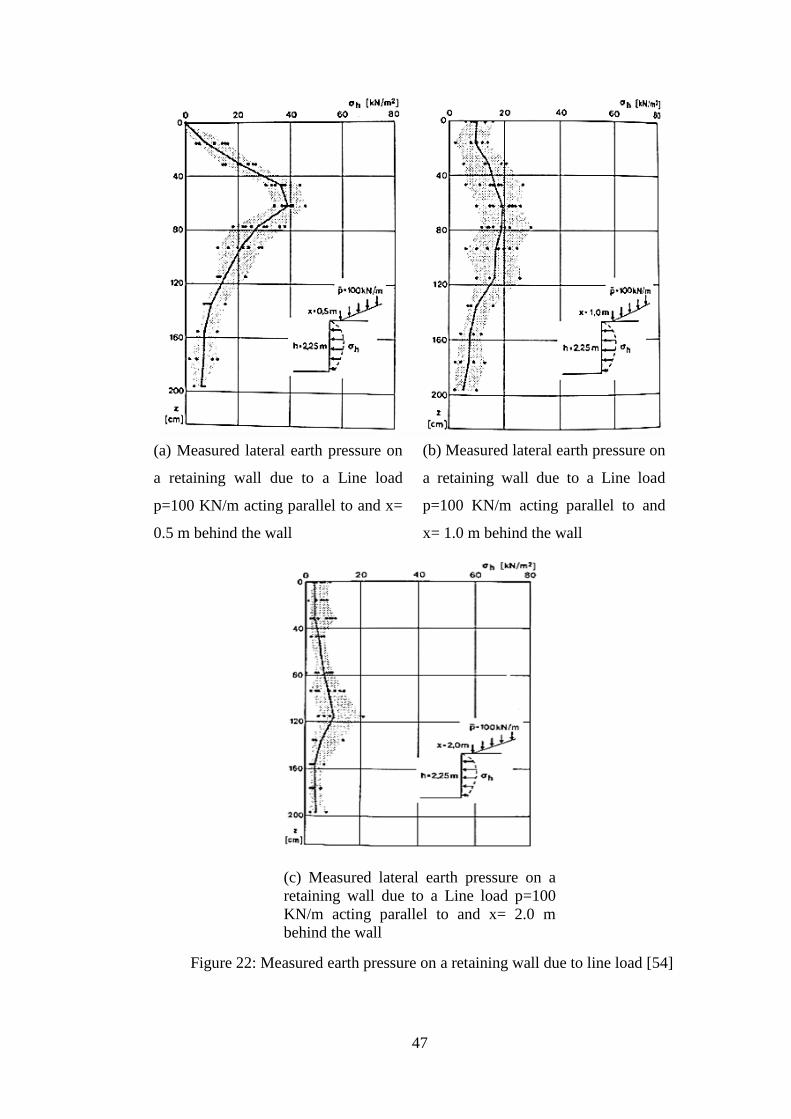
47
Figure 22: Measured earth pressure on a retaining wall due to line load [54]
(a) Measured lateral earth pressure on
a retaining wall due to a Line load
p=100 KN/m acting parallel to and x=
0.5 m behind the wall
(b) Measured lateral earth pressure on
a retaining wall due to a Line load
p=100 KN/m acting parallel to and
x= 1.0 m behind the wall
(c) Measured lateral earth pressure on a
retaining wall due to a Line load p=100
KN/m acting parallel to and x= 2.0 m
behind the wall
48
Figure 23: Calculated earth pressure on a retaining wall due to line load [54]
(a) Calculated lateral earth pressure
on a retaining wall due to a Line load
p=100 KN/m acting parallel to and
x= 0.5 m behind the wall
(b) Calculated lateral earth pressure
on a retaining wall due to a Line
load p=100 KN/m acting parallel to
and x= 1.0 m behind the wall
(c) Calculated lateral earth pressure on a
retaining wall due to a Line load p=100 KN/m
acting parallel at x= 2.0 m behind the wall
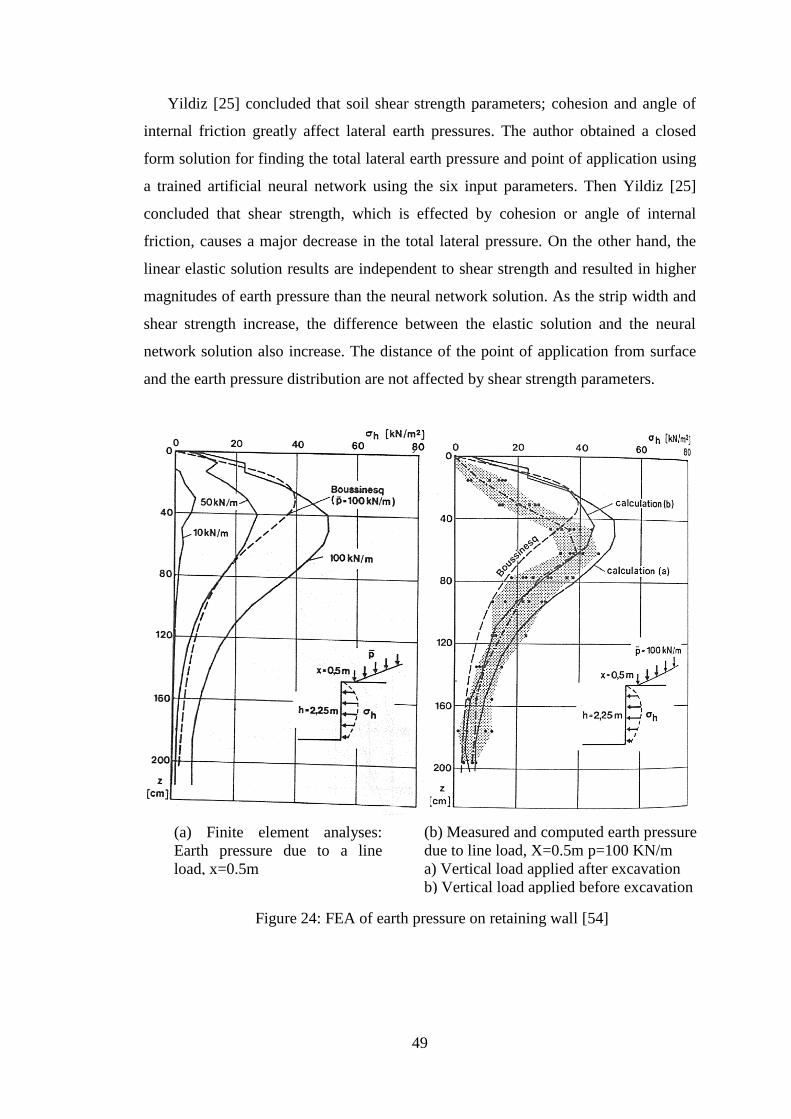
49
Yildiz [25] concluded that soil shear strength parameters; cohesion and angle of
internal friction greatly affect lateral earth pressures. The author obtained a closed
form solution for finding the total lateral earth pressure and point of application using
a trained artificial neural network using the six input parameters. Then Yildiz [25]
concluded that shear strength, which is effected by cohesion or angle of internal
friction, causes a major decrease in the total lateral pressure. On the other hand, the
linear elastic solution results are independent to shear strength and resulted in higher
magnitudes of earth pressure than the neural network solution. As the strip width and
shear strength increase, the difference between the elastic solution and the neural
network solution also increase. The distance of the point of application from surface
and the earth pressure distribution are not affected by shear strength parameters.
Figure 24: FEA of earth pressure on retaining wall [54]
(a) Finite element analyses:
Earth pressure due to a line
load, x=0.5m
(b) Measured and computed earth pressure
due to line load, X=0.5m p=100 KN/m
a) Vertical load applied after excavation
b) Vertical load applied before excavation
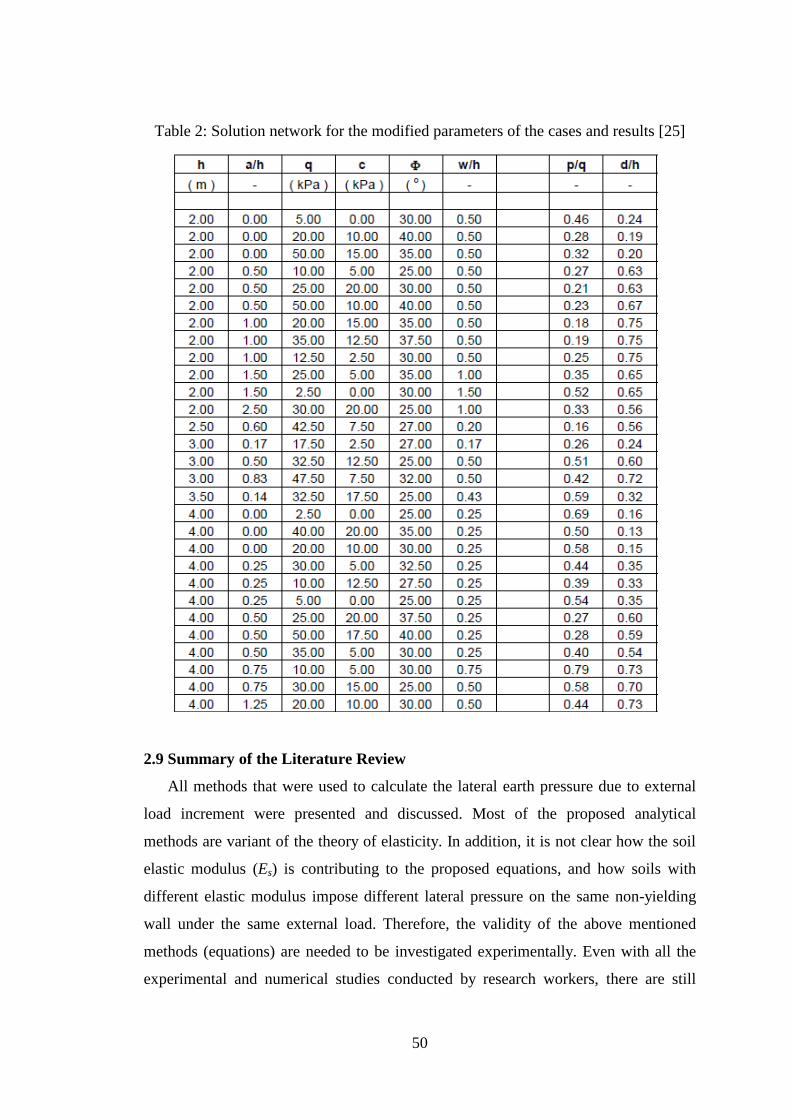
50
Table 2: Solution network for the modified parameters of the cases and results [25]
2.9 Summary of the Literature Review
All methods that were used to calculate the lateral earth pressure due to external
load increment were presented and discussed. Most of the proposed analytical
methods are variant of the theory of elasticity. In addition, it is not clear how the soil
elastic modulus (Es) is contributing to the proposed equations, and how soils with
different elastic modulus impose different lateral pressure on the same non-yielding
wall under the same external load. Therefore, the validity of the above mentioned
methods (equations) are needed to be investigated experimentally. Even with all the
experimental and numerical studies conducted by research workers, there are still
51
conflicting opinions regarding the distribution and magnitude of the stresses applied
on non-yielding walls.
Moreover, most cited research focused on the estimation of lateral earth pressure
due to normally compacted soil on a wall that is assumed to be infinitely rigid.
Experimental and numerical study by El-Emam [5] [6][5, 6] and Bigdeli and El-
Emam [9] indicated that the lateral earth pressure developed at the back of non-
yielding retaining walls significantly depends on the soil friction angle (), relative
compaction (Dr), and the wall rigidity (EI). Therefore, effects of these soil and wall
properties on the external stress increment (both vertical and horizontal), needed to be
investigated. The uncertainties in the methods that were proposed previously to
calculate vertical and lateral stress at the back of a non-yielding basement wall are
expected to be reflected on the final design of the wall. To overcome these
uncertainties, a carefully conducted and detailed experimental program is needed.
52
Chapter 3: Methodology
3.1 General
This research was conducted at the Geotechnical Engineering Lab of the College
of Engineering (CEN) at American University of Sharjah (AUS), using the lab
resources. The lab was very well equipped to accommodate the experimental setup
and instrumentation necessary to perform this study.
The objective of the current wall-footing scale model tests conducted in this study
is to understand and quantify the behavior of basement walls, and strip footing
constructed adjacent to each other. This objective was achieved by the experimental
tests performed on scale model. The experimental tests setup was designed to
accomplish qualitative and quantitative understanding of the soil-wall-footing
interaction with different configurations of footing, and different surcharge load. In
order to achieve the research objectives, a number of 15 soil-footing-non yielding
wall models with a rigid wall was constructed and tested to their loading limits. The
model wall-footing was designed to be a 1/3 scale, which means each model
represents 3.15 m height wall-footing prototype. A 3.15 m height basement height
used everywhere in UAE for residential buildings. The experimental models were
tested to failure which defined differently between models. Some models failed due
to excessive horizontal deflection of the wall. Others have failed due to large
settlement of the strip footing. Some models were reached high strip footing capacity
which reached the limit of the testing frame and load cells, and therefore the test was
stopped at this point.
The parameters that were studied in this investigation include: footing dimension
(i.e. width B), footing distance from the back of the wall (a), footing embedment
depth below the backfill surface (df), and applied vertical stress on strip footing (v).
The test facility specifications and dimensions, soil-wall-footing material properties,
instrumentation details, and test procedures are described in this chapter. Similitude
rules that were used to scale the prototype parameters to the reduced-scale model
parameters are presented.
3.2 Constructing the Test Facility at AUS Geotechnical Lab
A steel box was designed and constructed to contain both the backfill soil, and the
modeled basement wall and the strip footing. Figure 25 shows the steel box attached
to the AUS geotechnical Lab. While Figure 26 shows a schematic drawing with
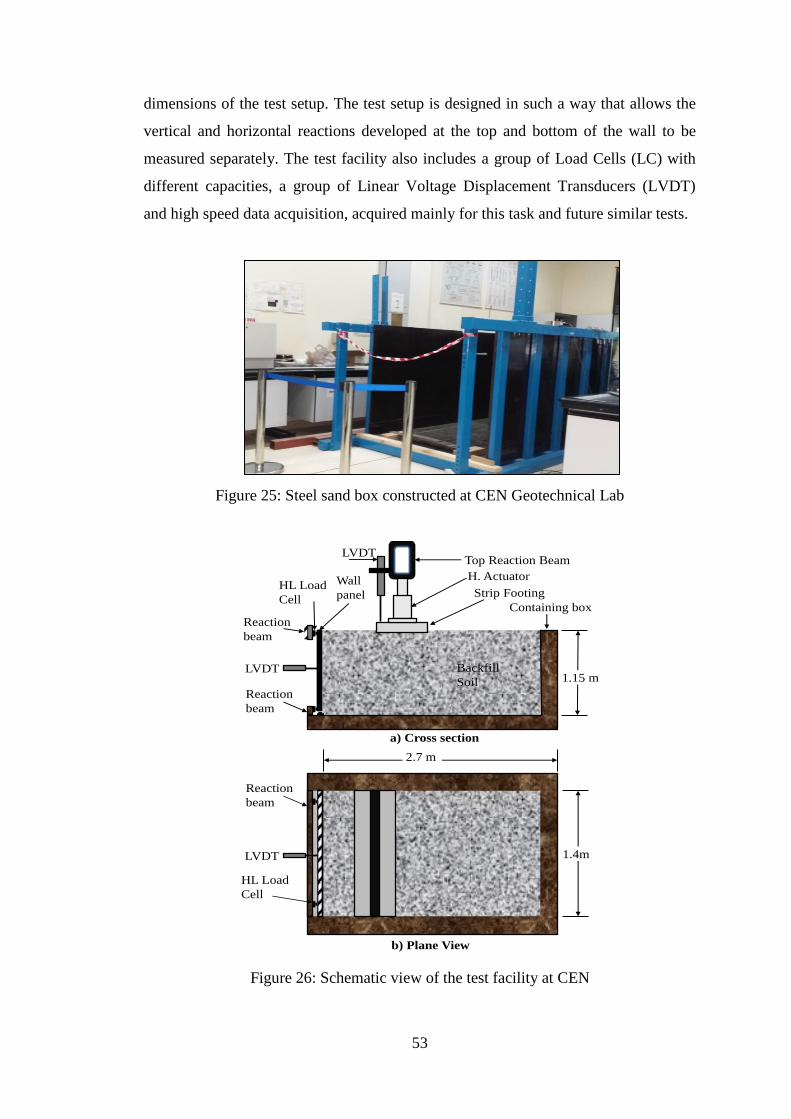
53
dimensions of the test setup. The test setup is designed in such a way that allows the
vertical and horizontal reactions developed at the top and bottom of the wall to be
measured separately. The test facility also includes a group of Load Cells (LC) with
different capacities, a group of Linear Voltage Displacement Transducers (LVDT)
and high speed data acquisition, acquired mainly for this task and future similar tests.
Figure 25: Steel sand box constructed at CEN Geotechnical Lab
Figure 26: Schematic view of the test facility at CEN
LVDT
Reaction
beam
HL Load
Cell
1.4m
2.7 m
Wall
panelHL Load
Cell
Reaction
beam
Strip Footing
Backfill
Soil
Containing box
Reaction
beam
LVDT1.15 m
b) Plane View
a) Cross section
H. Actuator
Top Reaction BeamLVDT
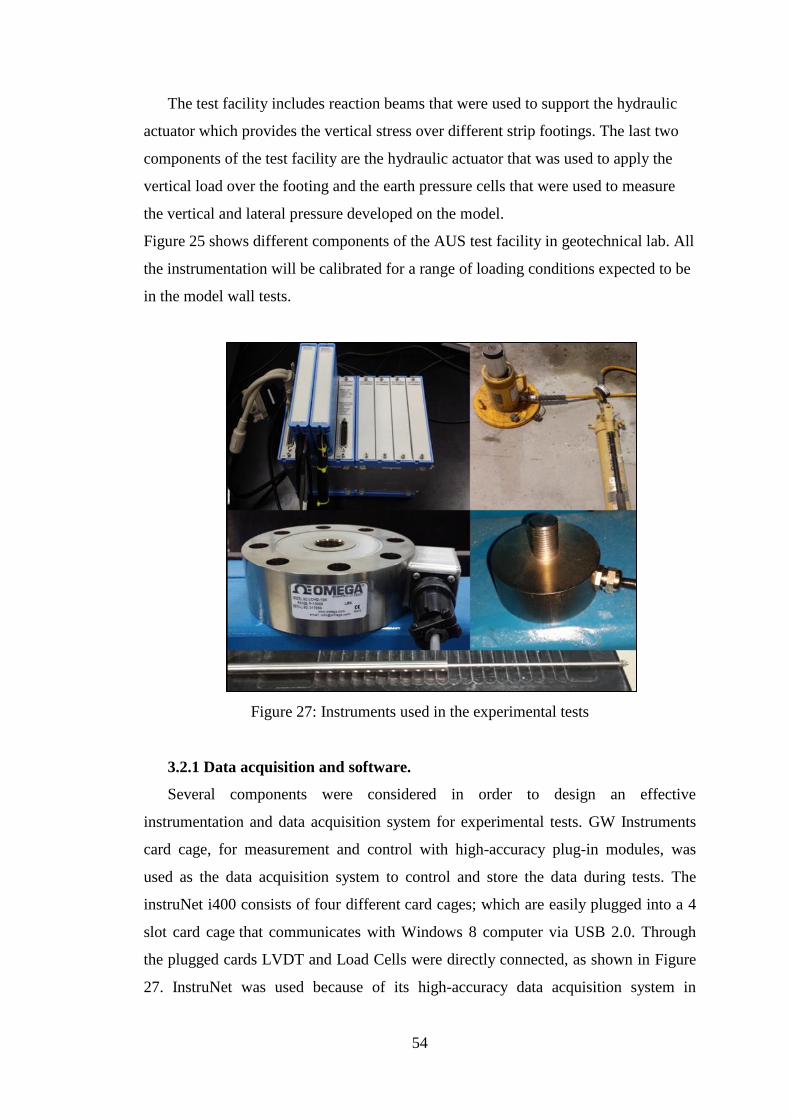
54
The test facility includes reaction beams that were used to support the hydraulic
actuator which provides the vertical stress over different strip footings. The last two
components of the test facility are the hydraulic actuator that was used to apply the
vertical load over the footing and the earth pressure cells that were used to measure
the vertical and lateral pressure developed on the model.
Figure 25 shows different components of the AUS test facility in geotechnical lab. All
the instrumentation will be calibrated for a range of loading conditions expected to be
in the model wall tests.
Figure 27: Instruments used in the experimental tests
3.2.1 Data acquisition and software.
Several components were considered in order to design an effective
instrumentation and data acquisition system for experimental tests. GW Instruments
card cage, for measurement and control with high-accuracy plug-in modules, was
used as the data acquisition system to control and store the data during tests. The
instruNet i400 consists of four different card cages; which are easily plugged into a 4
slot card cage that communicates with Windows 8 computer via USB 2.0. Through
the plugged cards LVDT and Load Cells were directly connected, as shown in Figure
27. InstruNet was used because of its high-accuracy data acquisition system in
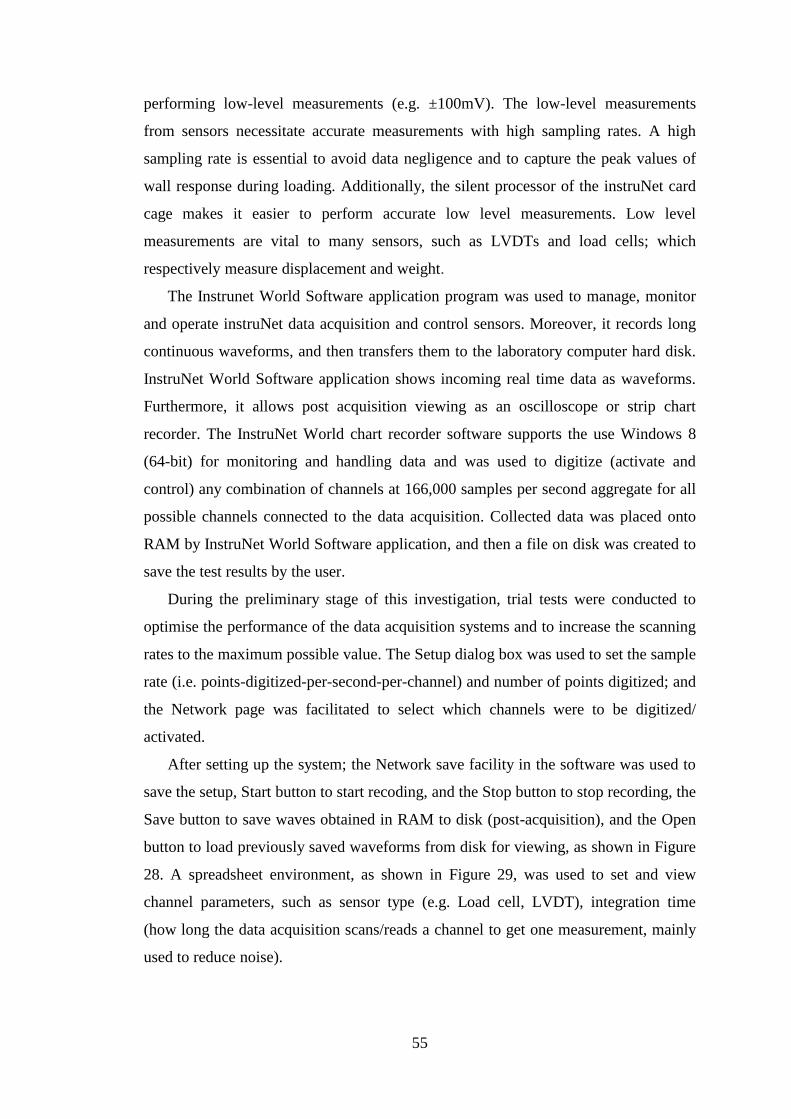
55
performing low-level measurements (e.g. ±100mV). The low-level measurements
from sensors necessitate accurate measurements with high sampling rates. A high
sampling rate is essential to avoid data negligence and to capture the peak values of
wall response during loading. Additionally, the silent processor of the instruNet card
cage makes it easier to perform accurate low level measurements. Low level
measurements are vital to many sensors, such as LVDTs and load cells; which
respectively measure displacement and weight.
The Instrunet World Software application program was used to manage, monitor
and operate instruNet data acquisition and control sensors. Moreover, it records long
continuous waveforms, and then transfers them to the laboratory computer hard disk.
InstruNet World Software application shows incoming real time data as waveforms.
Furthermore, it allows post acquisition viewing as an oscilloscope or strip chart
recorder. The InstruNet World chart recorder software supports the use Windows 8
(64-bit) for monitoring and handling data and was used to digitize (activate and
control) any combination of channels at 166,000 samples per second aggregate for all
possible channels connected to the data acquisition. Collected data was placed onto
RAM by InstruNet World Software application, and then a file on disk was created to
save the test results by the user.
During the preliminary stage of this investigation, trial tests were conducted to
optimise the performance of the data acquisition systems and to increase the scanning
rates to the maximum possible value. The Setup dialog box was used to set the sample
rate (i.e. points-digitized-per-second-per-channel) and number of points digitized; and
the Network page was facilitated to select which channels were to be digitized/
activated.
After setting up the system; the Network save facility in the software was used to
save the setup, Start button to start recoding, and the Stop button to stop recording, the
Save button to save waves obtained in RAM to disk (post-acquisition), and the Open
button to load previously saved waveforms from disk for viewing, as shown in Figure
28. A spreadsheet environment, as shown in Figure 29, was used to set and view
channel parameters, such as sensor type (e.g. Load cell, LVDT), integration time
(how long the data acquisition scans/reads a channel to get one measurement, mainly
used to reduce noise).
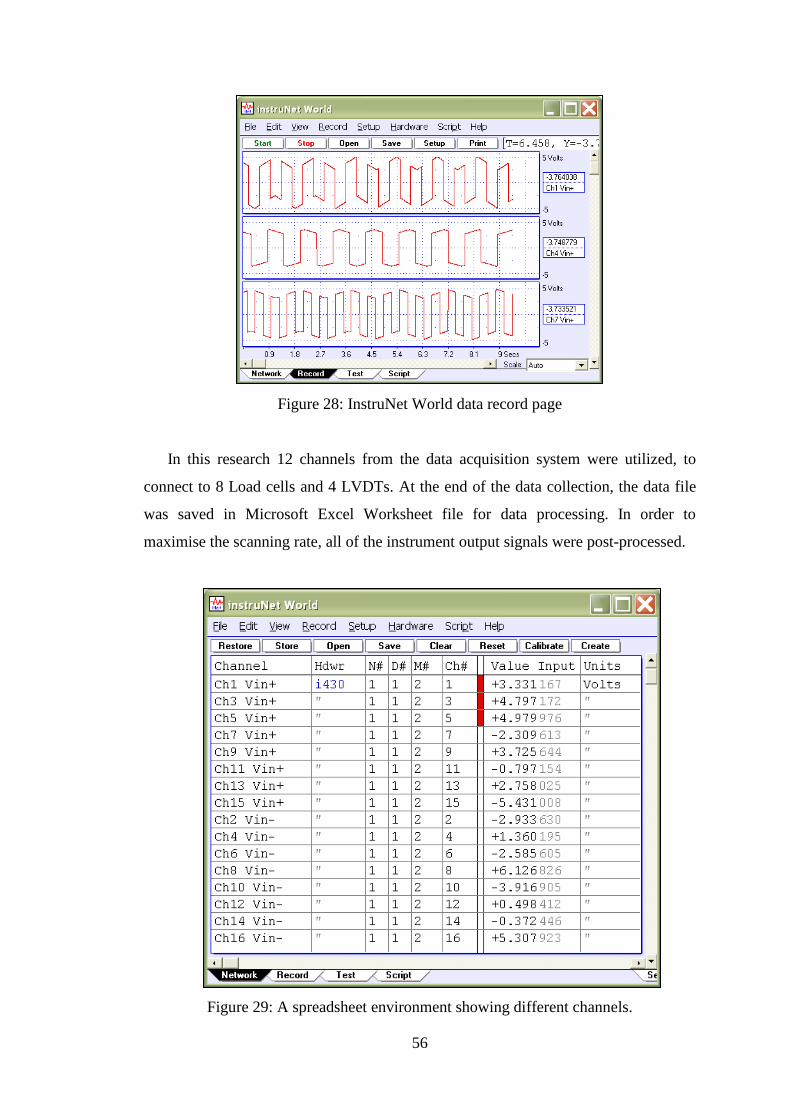
56
Figure 28: InstruNet World data record page
In this research 12 channels from the data acquisition system were utilized, to
connect to 8 Load cells and 4 LVDTs. At the end of the data collection, the data file
was saved in Microsoft Excel Worksheet file for data processing. In order to
maximise the scanning rate, all of the instrument output signals were post-processed.
Figure 29: A spreadsheet environment showing different channels.
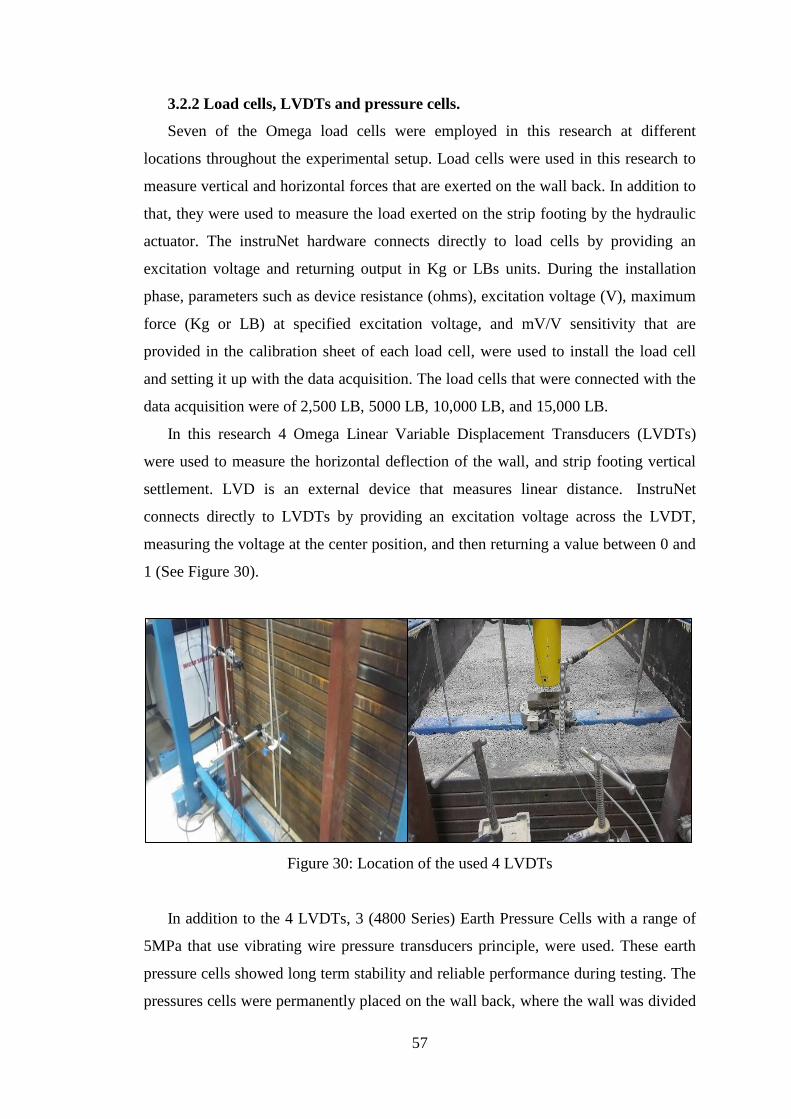
57
3.2.2 Load cells, LVDTs and pressure cells.
Seven of the Omega load cells were employed in this research at different
locations throughout the experimental setup. Load cells were used in this research to
measure vertical and horizontal forces that are exerted on the wall back. In addition to
that, they were used to measure the load exerted on the strip footing by the hydraulic
actuator. The instruNet hardware connects directly to load cells by providing an
excitation voltage and returning output in Kg or LBs units. During the installation
phase, parameters such as device resistance (ohms), excitation voltage (V), maximum
force (Kg or LB) at specified excitation voltage, and mV/V sensitivity that are
provided in the calibration sheet of each load cell, were used to install the load cell
and setting it up with the data acquisition. The load cells that were connected with the
data acquisition were of 2,500 LB, 5000 LB, 10,000 LB, and 15,000 LB.
In this research 4 Omega Linear Variable Displacement Transducers (LVDTs)
were used to measure the horizontal deflection of the wall, and strip footing vertical
settlement. LVD is an external device that measures linear distance. InstruNet
connects directly to LVDTs by providing an excitation voltage across the LVDT,
measuring the voltage at the center position, and then returning a value between 0 and
1 (See Figure 30).
Figure 30: Location of the used 4 LVDTs
In addition to the 4 LVDTs, 3 (4800 Series) Earth Pressure Cells with a range of
5MPa that use vibrating wire pressure transducers principle, were used. These earth
pressure cells showed long term stability and reliable performance during testing. The
pressures cells were permanently placed on the wall back, where the wall was divided
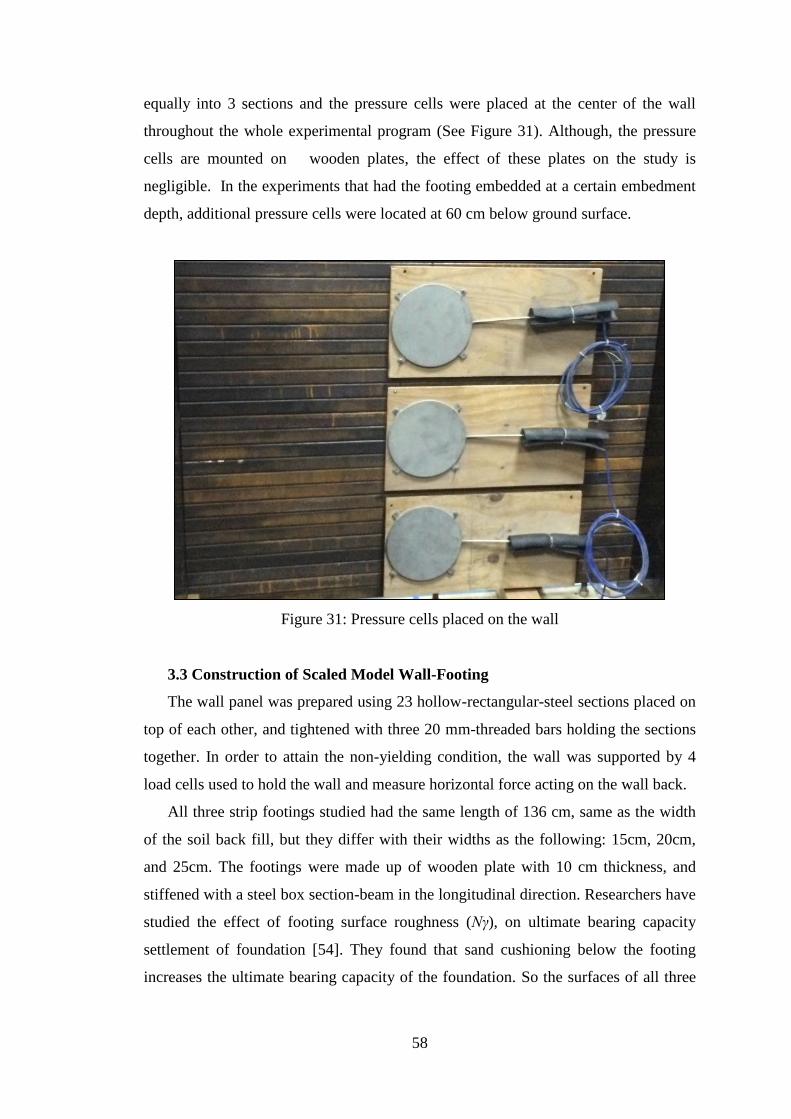
58
equally into 3 sections and the pressure cells were placed at the center of the wall
throughout the whole experimental program (See Figure 31). Although, the pressure
cells are mounted on wooden plates, the effect of these plates on the study is
negligible. In the experiments that had the footing embedded at a certain embedment
depth, additional pressure cells were located at 60 cm below ground surface.
Figure 31: Pressure cells placed on the wall
3.3 Construction of Scaled Model Wall-Footing
The wall panel was prepared using 23 hollow-rectangular-steel sections placed on
top of each other, and tightened with three 20 mm-threaded bars holding the sections
together. In order to attain the non-yielding condition, the wall was supported by 4
load cells used to hold the wall and measure horizontal force acting on the wall back.
All three strip footings studied had the same length of 136 cm, same as the width
of the soil back fill, but they differ with their widths as the following: 15cm, 20cm,
and 25cm. The footings were made up of wooden plate with 10 cm thickness, and
stiffened with a steel box section-beam in the longitudinal direction. Researchers have
studied the effect of footing surface roughness (Nγ), on ultimate bearing capacity
settlement of foundation [54]. They found that sand cushioning below the footing
increases the ultimate bearing capacity of the foundation. So the surfaces of all three
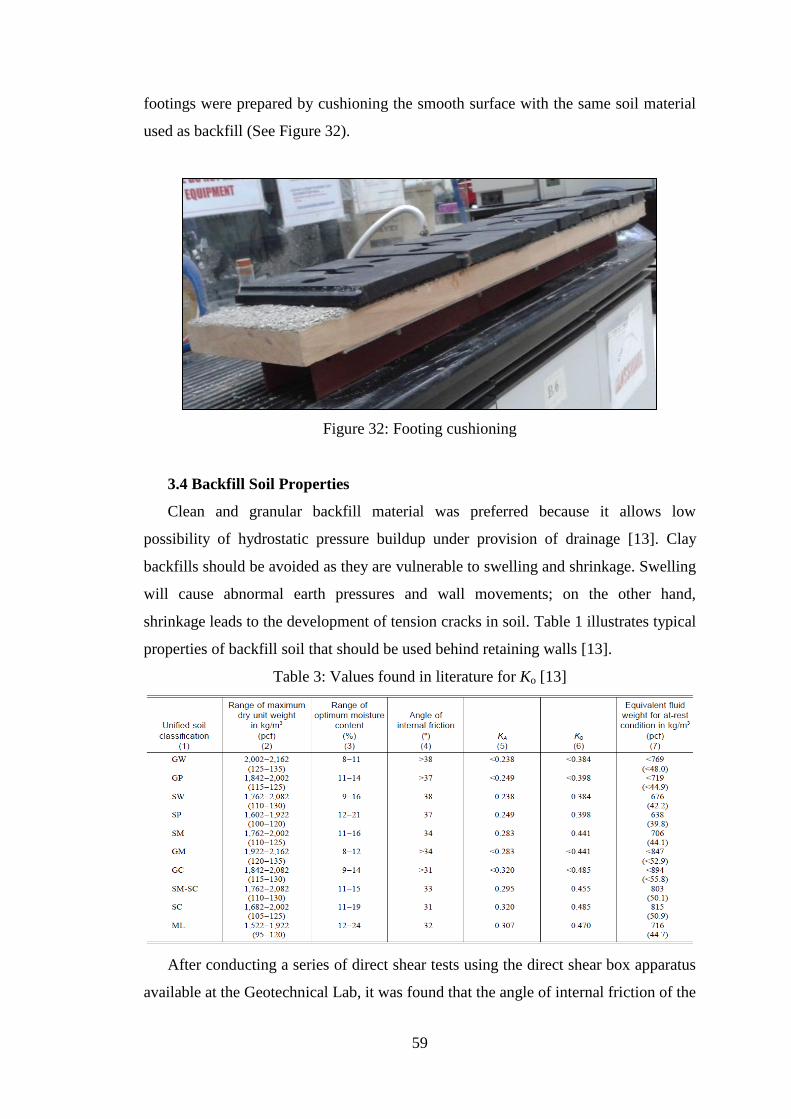
59
footings were prepared by cushioning the smooth surface with the same soil material
used as backfill (See Figure 32).
Figure 32: Footing cushioning
3.4 Backfill Soil Properties
Clean and granular backfill material was preferred because it allows low
possibility of hydrostatic pressure buildup under provision of drainage [13]. Clay
backfills should be avoided as they are vulnerable to swelling and shrinkage. Swelling
will cause abnormal earth pressures and wall movements; on the other hand,
shrinkage leads to the development of tension cracks in soil. Table 1 illustrates typical
properties of backfill soil that should be used behind retaining walls [13].
Table 3: Values found in literature for Ko [13]
After conducting a series of direct shear tests using the direct shear box apparatus
available at the Geotechnical Lab, it was found that the angle of internal friction of the
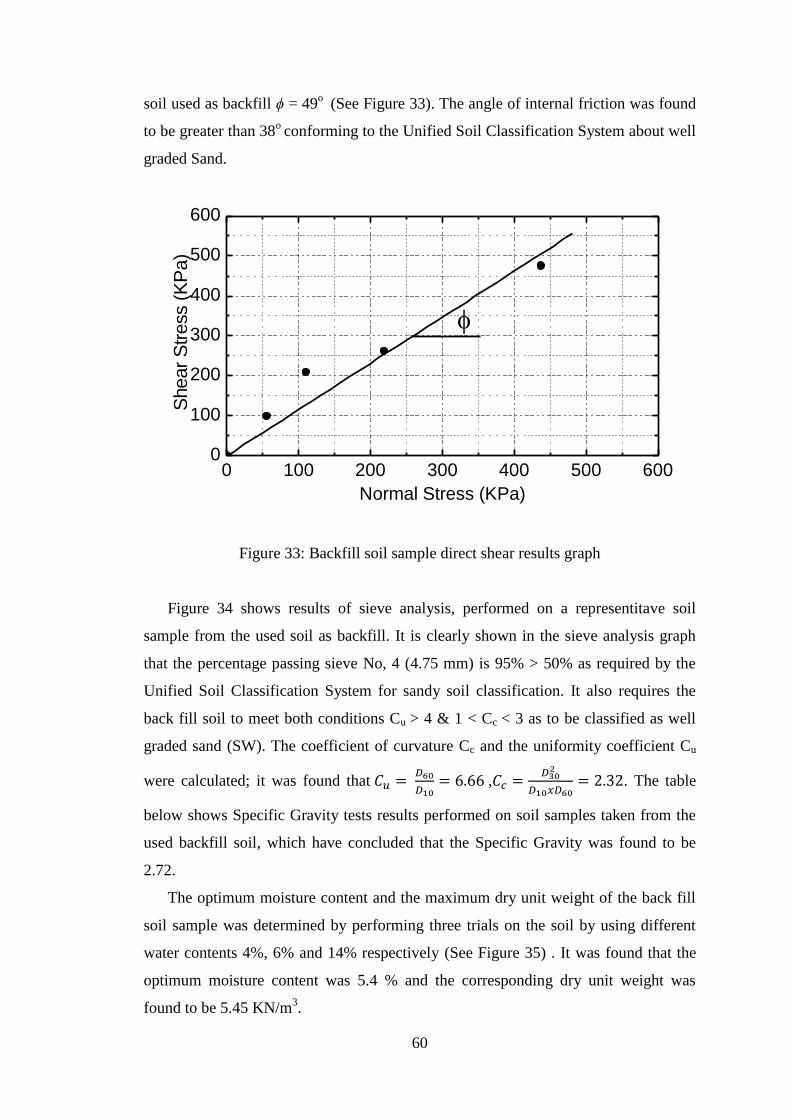
60
soil used as backfill ϕ = 49o
(See Figure 33). The angle of internal friction was found
to be greater than 38o
conforming to the Unified Soil Classification System about well
graded Sand.
Figure 33: Backfill soil sample direct shear results graph
Figure 34 shows results of sieve analysis, performed on a representitave soil
sample from the used soil as backfill. It is clearly shown in the sieve analysis graph
that the percentage passing sieve No, 4 (4.75 mm) is 95% > 50% as required by the
Unified Soil Classification System for sandy soil classification. It also requires the
back fill soil to meet both conditions Cu > 4 & 1 < Cc < 3 as to be classified as well
graded sand (SW). The coefficient of curvature Cc and the uniformity coefficient Cu
were calculated; it was found that
,
. The table
below shows Specific Gravity tests results performed on soil samples taken from the
used backfill soil, which have concluded that the Specific Gravity was found to be
2.72.
The optimum moisture content and the maximum dry unit weight of the back fill
soil sample was determined by performing three trials on the soil by using different
water contents 4%, 6% and 14% respectively (See Figure 35) . It was found that the
optimum moisture content was 5.4 % and the corresponding dry unit weight was
found to be 5.45 KN/m3.
0 100 200 300 400 500 6000
100
200
300
400
500
600
S
hear
Str
ess (
KP
a)
Normal Stress (KPa)
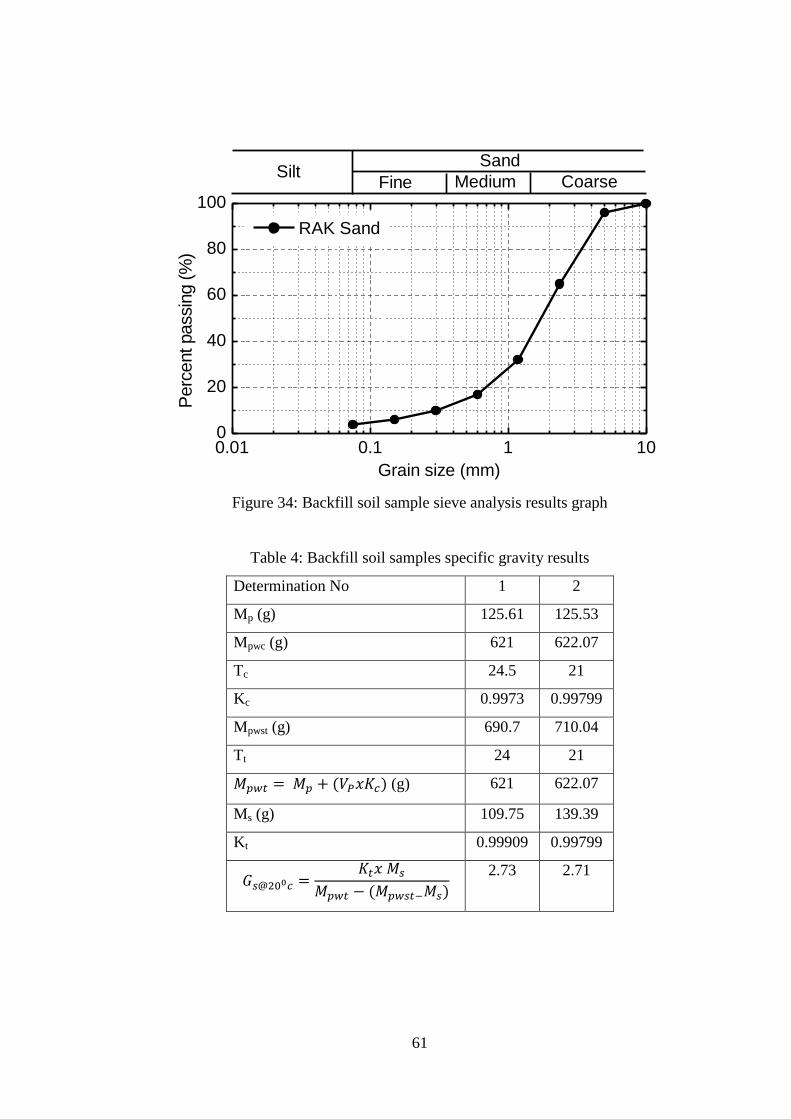
61
0.01 0.1 1 100
20
40
60
80
100
RAK Sand
CoarseMediumFine
SandSilt
Perc
ent passin
g (
%)
Grain size (mm)
Figure 34: Backfill soil sample sieve analysis results graph
Table 4: Backfill soil samples specific gravity results
Determination No 1 2
Mp (g) 125.61 125.53
Mpwc (g) 621 622.07
Tc 24.5 21
Kc 0.9973 0.99799
Mpwst (g) 690.7 710.04
Tt 24 21
(g) 621 622.07
Ms (g) 109.75 139.39
Kt 0.99909 0.99799
2.73 2.71
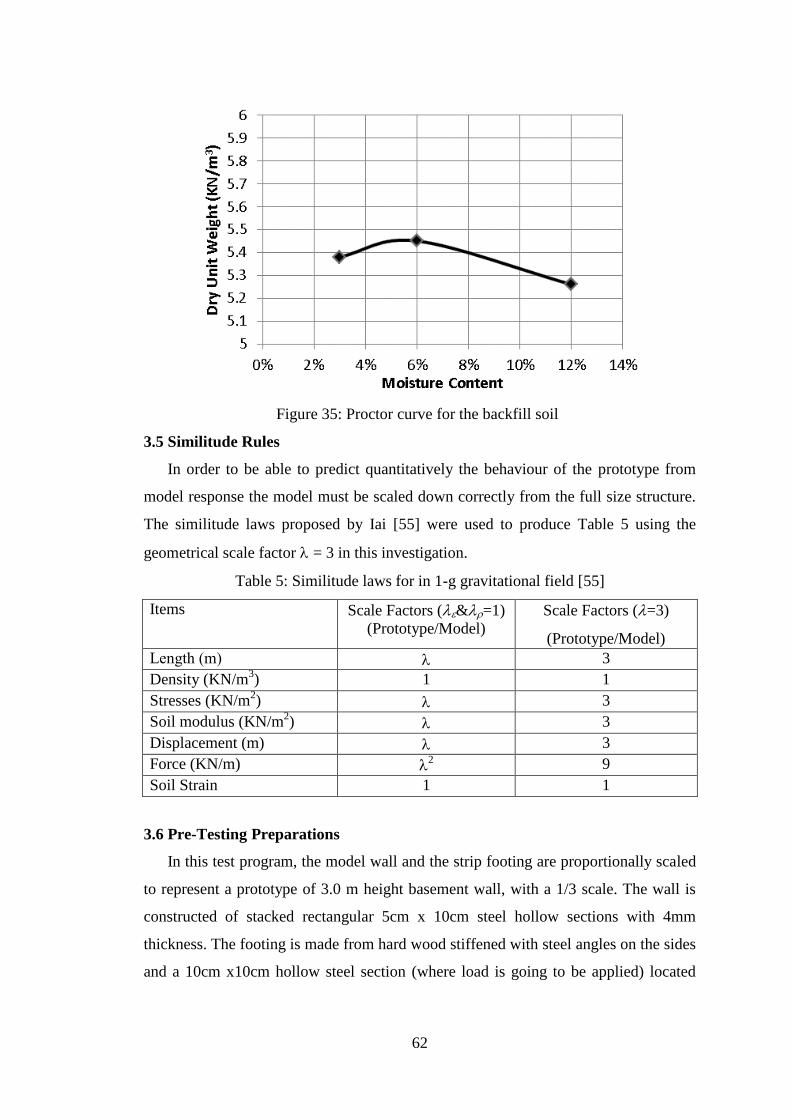
62
Figure 35: Proctor curve for the backfill soil
3.5 Similitude Rules
In order to be able to predict quantitatively the behaviour of the prototype from
model response the model must be scaled down correctly from the full size structure.
The similitude laws proposed by Iai [55] were used to produce Table 5 using the
geometrical scale factor = 3 in this investigation.
Table 5: Similitude laws for in 1-g gravitational field [55]
Items Scale Factors (&=1)
(Prototype/Model)
Scale Factors (=3)
(Prototype/Model)
Length (m) 3
Density (KN/m3) 1 1
Stresses (KN/m2) 3
Soil modulus (KN/m2) 3
Displacement (m) 3
Force (KN/m) 2 9
Soil Strain 1 1
3.6 Pre-Testing Preparations
In this test program, the model wall and the strip footing are proportionally scaled
to represent a prototype of 3.0 m height basement wall, with a 1/3 scale. The wall is
constructed of stacked rectangular 5cm x 10cm steel hollow sections with 4mm
thickness. The footing is made from hard wood stiffened with steel angles on the sides
and a 10cm x10cm hollow steel section (where load is going to be applied) located
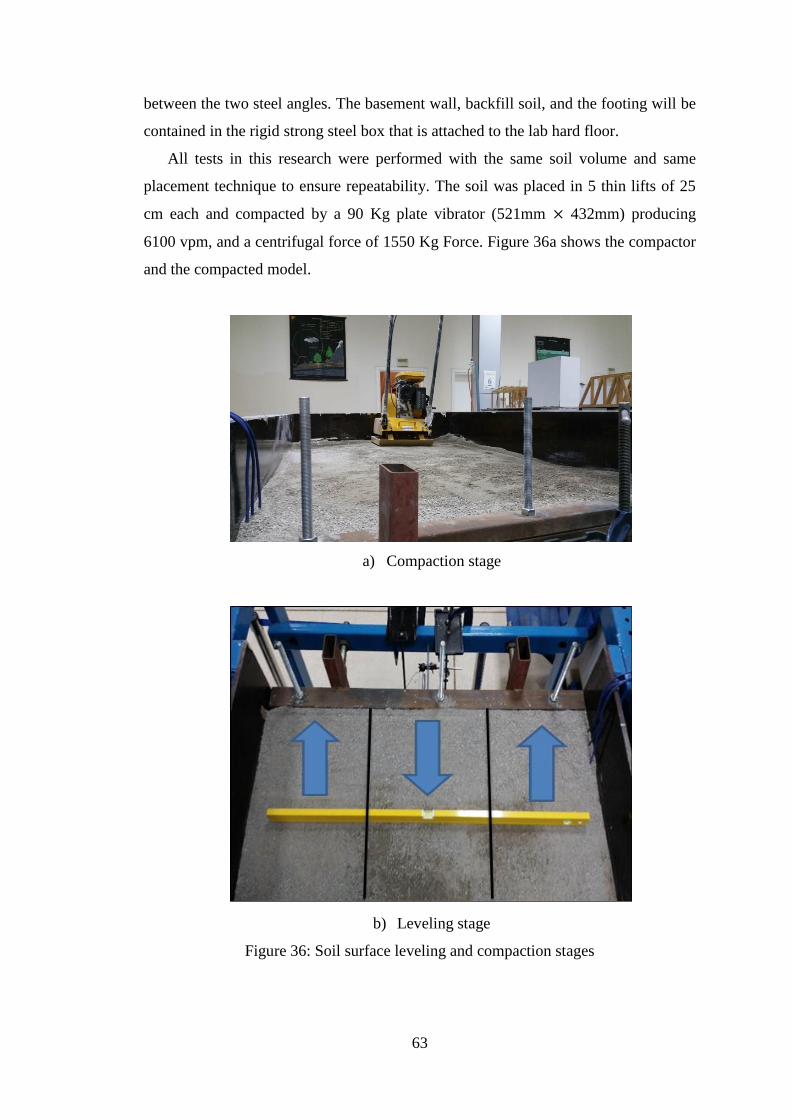
63
between the two steel angles. The basement wall, backfill soil, and the footing will be
contained in the rigid strong steel box that is attached to the lab hard floor.
All tests in this research were performed with the same soil volume and same
placement technique to ensure repeatability. The soil was placed in 5 thin lifts of 25
cm each and compacted by a 90 Kg plate vibrator (521mm 432mm) producing
6100 vpm, and a centrifugal force of 1550 Kg Force. Figure 36a shows the compactor
and the compacted model.
a) Compaction stage
b) Leveling stage
Figure 36: Soil surface leveling and compaction stages
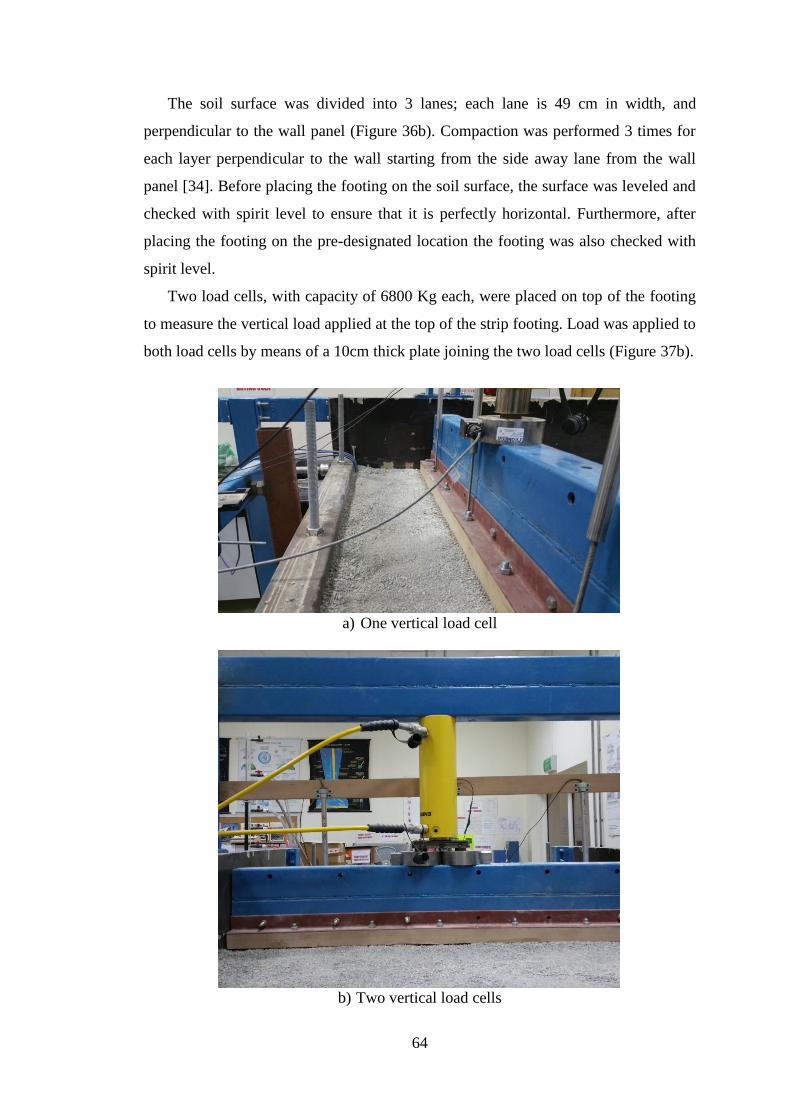
64
The soil surface was divided into 3 lanes; each lane is 49 cm in width, and
perpendicular to the wall panel (Figure 36b). Compaction was performed 3 times for
each layer perpendicular to the wall starting from the side away lane from the wall
panel [34]. Before placing the footing on the soil surface, the surface was leveled and
checked with spirit level to ensure that it is perfectly horizontal. Furthermore, after
placing the footing on the pre-designated location the footing was also checked with
spirit level.
Two load cells, with capacity of 6800 Kg each, were placed on top of the footing
to measure the vertical load applied at the top of the strip footing. Load was applied to
both load cells by means of a 10cm thick plate joining the two load cells (Figure 37b).
a) One vertical load cell
b) Two vertical load cells
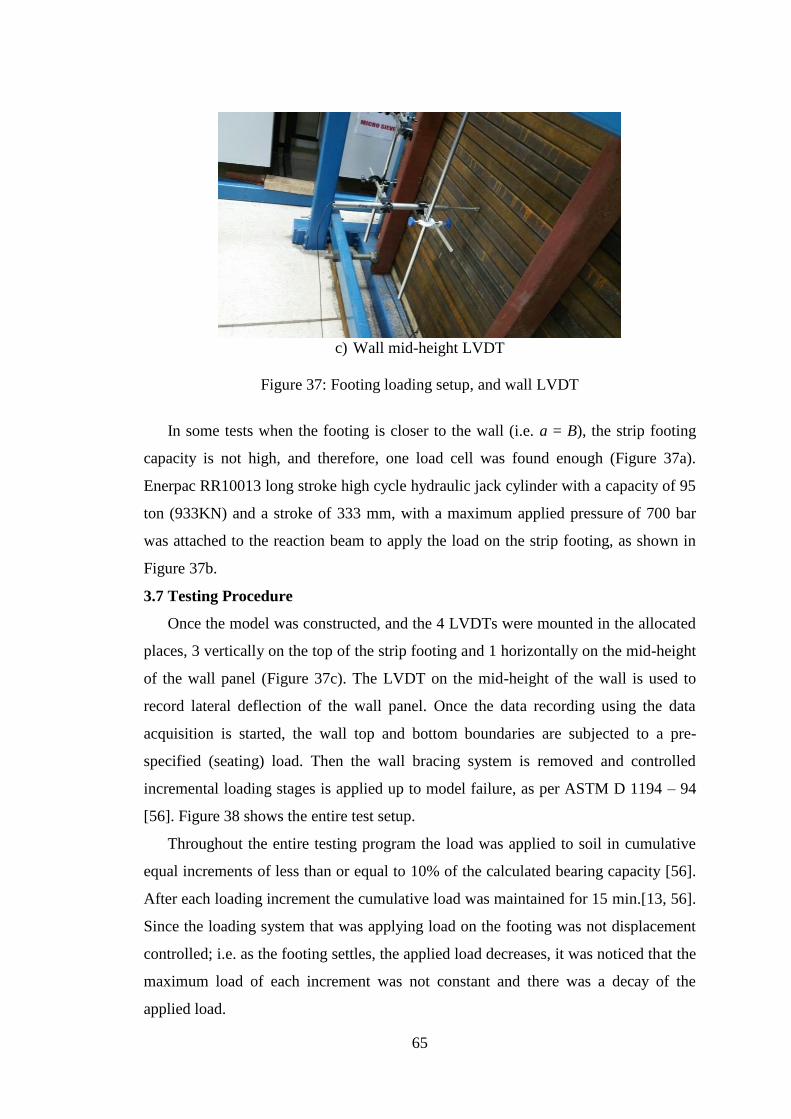
65
c) Wall mid-height LVDT
Figure 37: Footing loading setup, and wall LVDT
In some tests when the footing is closer to the wall (i.e. a = B), the strip footing
capacity is not high, and therefore, one load cell was found enough (Figure 37a).
Enerpac RR10013 long stroke high cycle hydraulic jack cylinder with a capacity of 95
ton (933KN) and a stroke of 333 mm, with a maximum applied pressure of 700 bar
was attached to the reaction beam to apply the load on the strip footing, as shown in
Figure 37b.
3.7 Testing Procedure
Once the model was constructed, and the 4 LVDTs were mounted in the allocated
places, 3 vertically on the top of the strip footing and 1 horizontally on the mid-height
of the wall panel (Figure 37c). The LVDT on the mid-height of the wall is used to
record lateral deflection of the wall panel. Once the data recording using the data
acquisition is started, the wall top and bottom boundaries are subjected to a pre-
specified (seating) load. Then the wall bracing system is removed and controlled
incremental loading stages is applied up to model failure, as per ASTM D 1194 – 94
[56]. Figure 38 shows the entire test setup.
Throughout the entire testing program the load was applied to soil in cumulative
equal increments of less than or equal to 10% of the calculated bearing capacity [56].
After each loading increment the cumulative load was maintained for 15 min.[13, 56].
Since the loading system that was applying load on the footing was not displacement
controlled; i.e. as the footing settles, the applied load decreases, it was noticed that the
maximum load of each increment was not constant and there was a decay of the
applied load.
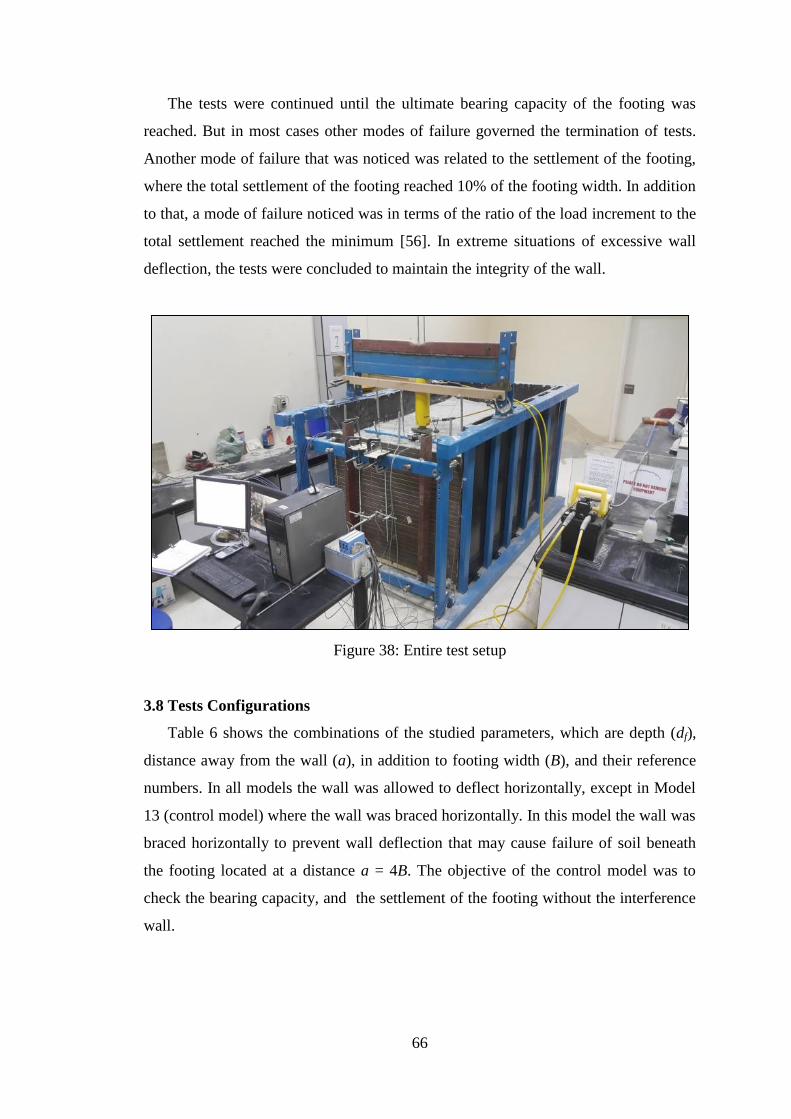
66
The tests were continued until the ultimate bearing capacity of the footing was
reached. But in most cases other modes of failure governed the termination of tests.
Another mode of failure that was noticed was related to the settlement of the footing,
where the total settlement of the footing reached 10% of the footing width. In addition
to that, a mode of failure noticed was in terms of the ratio of the load increment to the
total settlement reached the minimum [56]. In extreme situations of excessive wall
deflection, the tests were concluded to maintain the integrity of the wall.
Figure 38: Entire test setup
3.8 Tests Configurations
Table 6 shows the combinations of the studied parameters, which are depth (df),
distance away from the wall (a), in addition to footing width (B), and their reference
numbers. In all models the wall was allowed to deflect horizontally, except in Model
13 (control model) where the wall was braced horizontally. In this model the wall was
braced horizontally to prevent wall deflection that may cause failure of soil beneath
the footing located at a distance a = 4B. The objective of the control model was to
check the bearing capacity, and the settlement of the footing without the interference
wall.
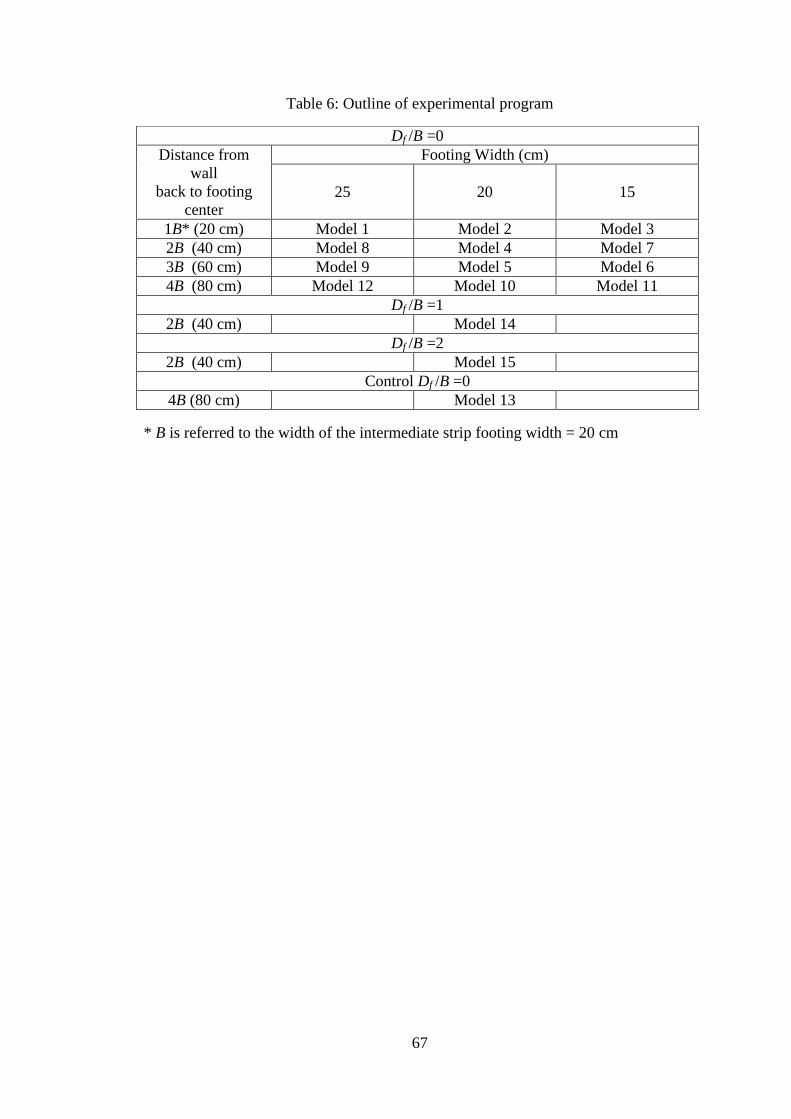
67
Table 6: Outline of experimental program
* B is referred to the width of the intermediate strip footing width = 20 cm
Df /B =0
Distance from
wall
back to footing
center
Footing Width (cm)
25 20 15
1B* (20 cm) Model 1 Model 2 Model 3
2B (40 cm) Model 8 Model 4 Model 7
3B (60 cm) Model 9 Model 5 Model 6
4B (80 cm) Model 12 Model 10 Model 11
Df /B =1
2B (40 cm)
Model 14
Df /B =2
2B (40 cm)
Model 15
Control Df /B =0
4B (80 cm)
Model 13
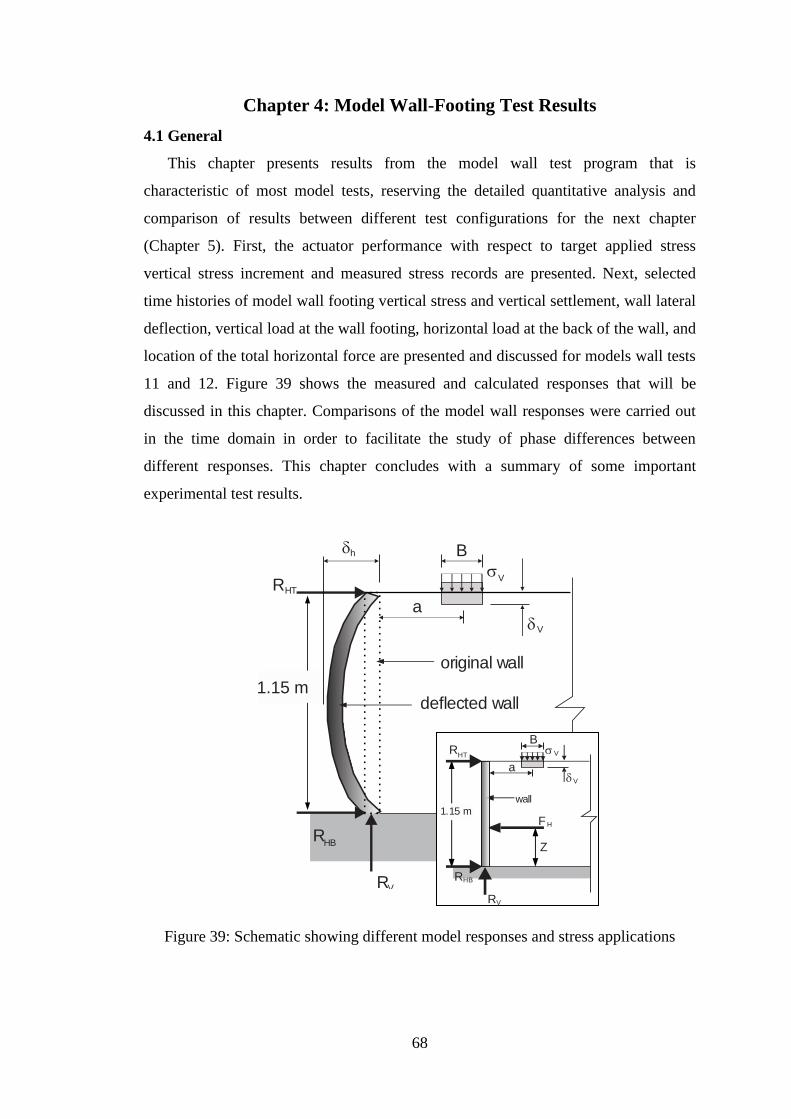
68
Chapter 4: Model Wall-Footing Test Results
4.1 General
This chapter presents results from the model wall test program that is
characteristic of most model tests, reserving the detailed quantitative analysis and
comparison of results between different test configurations for the next chapter
(Chapter 5). First, the actuator performance with respect to target applied stress
vertical stress increment and measured stress records are presented. Next, selected
time histories of model wall footing vertical stress and vertical settlement, wall lateral
deflection, vertical load at the wall footing, horizontal load at the back of the wall, and
location of the total horizontal force are presented and discussed for models wall tests
11 and 12. Figure 39 shows the measured and calculated responses that will be
discussed in this chapter. Comparisons of the model wall responses were carried out
in the time domain in order to facilitate the study of phase differences between
different responses. This chapter concludes with a summary of some important
experimental test results.
Figure 39: Schematic showing different model responses and stress applications
RV
original wall
RHB
1.15 m
RHT
a
B
V
V
deflected wall
h
RV
wall
RHB
FH
Z
1.15 m
RHT
a
BV
V
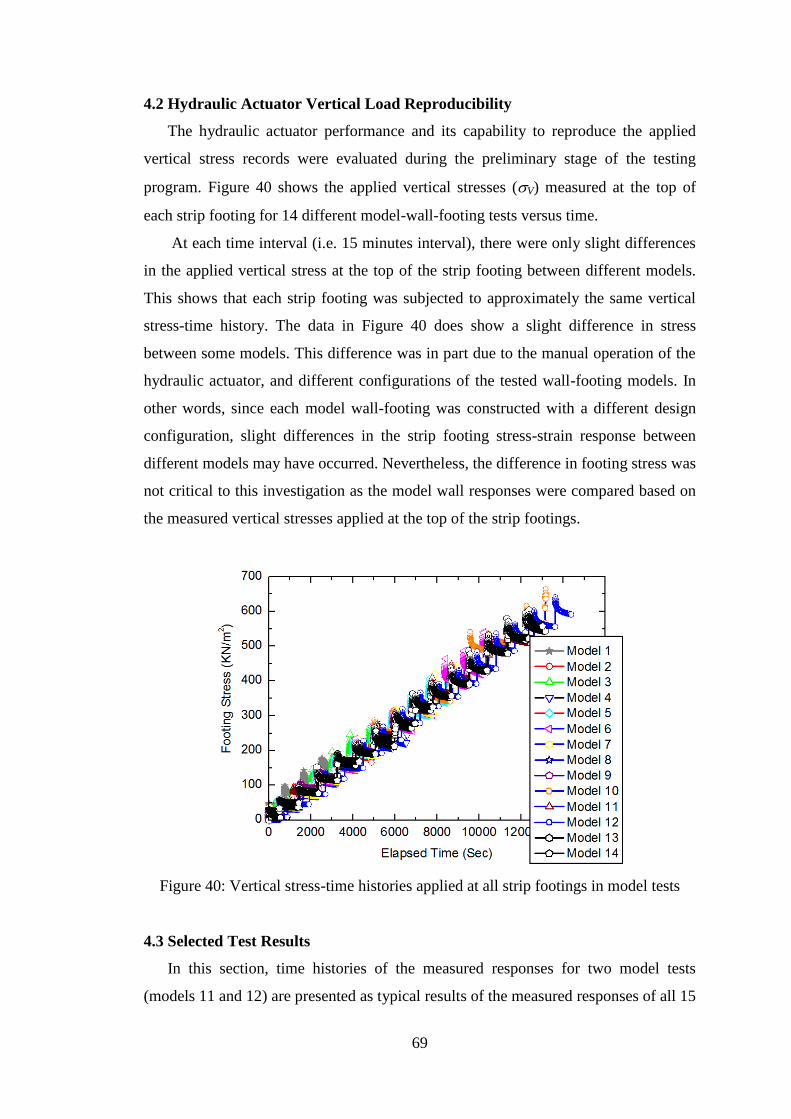
69
4.2 Hydraulic Actuator Vertical Load Reproducibility
The hydraulic actuator performance and its capability to reproduce the applied
vertical stress records were evaluated during the preliminary stage of the testing
program. Figure 40 shows the applied vertical stresses (V) measured at the top of
each strip footing for 14 different model-wall-footing tests versus time.
At each time interval (i.e. 15 minutes interval), there were only slight differences
in the applied vertical stress at the top of the strip footing between different models.
This shows that each strip footing was subjected to approximately the same vertical
stress-time history. The data in Figure 40 does show a slight difference in stress
between some models. This difference was in part due to the manual operation of the
hydraulic actuator, and different configurations of the tested wall-footing models. In
other words, since each model wall-footing was constructed with a different design
configuration, slight differences in the strip footing stress-strain response between
different models may have occurred. Nevertheless, the difference in footing stress was
not critical to this investigation as the model wall responses were compared based on
the measured vertical stresses applied at the top of the strip footings.
Figure 40: Vertical stress-time histories applied at all strip footings in model tests
4.3 Selected Test Results
In this section, time histories of the measured responses for two model tests
(models 11 and 12) are presented as typical results of the measured responses of all 15
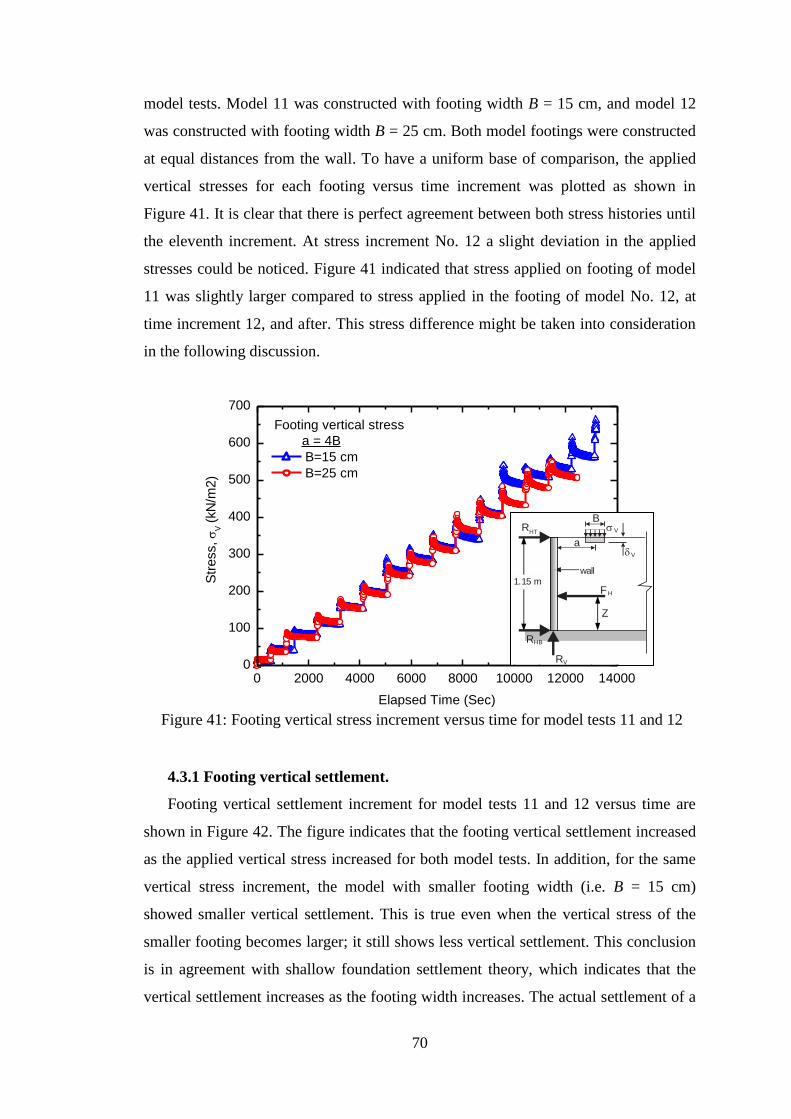
70
model tests. Model 11 was constructed with footing width B = 15 cm, and model 12
was constructed with footing width B = 25 cm. Both model footings were constructed
at equal distances from the wall. To have a uniform base of comparison, the applied
vertical stresses for each footing versus time increment was plotted as shown in
Figure 41. It is clear that there is perfect agreement between both stress histories until
the eleventh increment. At stress increment No. 12 a slight deviation in the applied
stresses could be noticed. Figure 41 indicated that stress applied on footing of model
11 was slightly larger compared to stress applied in the footing of model No. 12, at
time increment 12, and after. This stress difference might be taken into consideration
in the following discussion.
0 2000 4000 6000 8000 10000 12000 140000
100
200
300
400
500
600
700
a = 4B
B=15 cm
B=25 cm
Footing vertical stress
Str
ess,
V (
kN
/m2)
Elapsed Time (Sec) Figure 41: Footing vertical stress increment versus time for model tests 11 and 12
4.3.1 Footing vertical settlement.
Footing vertical settlement increment for model tests 11 and 12 versus time are
shown in Figure 42. The figure indicates that the footing vertical settlement increased
as the applied vertical stress increased for both model tests. In addition, for the same
vertical stress increment, the model with smaller footing width (i.e. B = 15 cm)
showed smaller vertical settlement. This is true even when the vertical stress of the
smaller footing becomes larger; it still shows less vertical settlement. This conclusion
is in agreement with shallow foundation settlement theory, which indicates that the
vertical settlement increases as the footing width increases. The actual settlement of a
RV
wall
RHB
FH
Z
1.15 m
RHT
a
BV
V
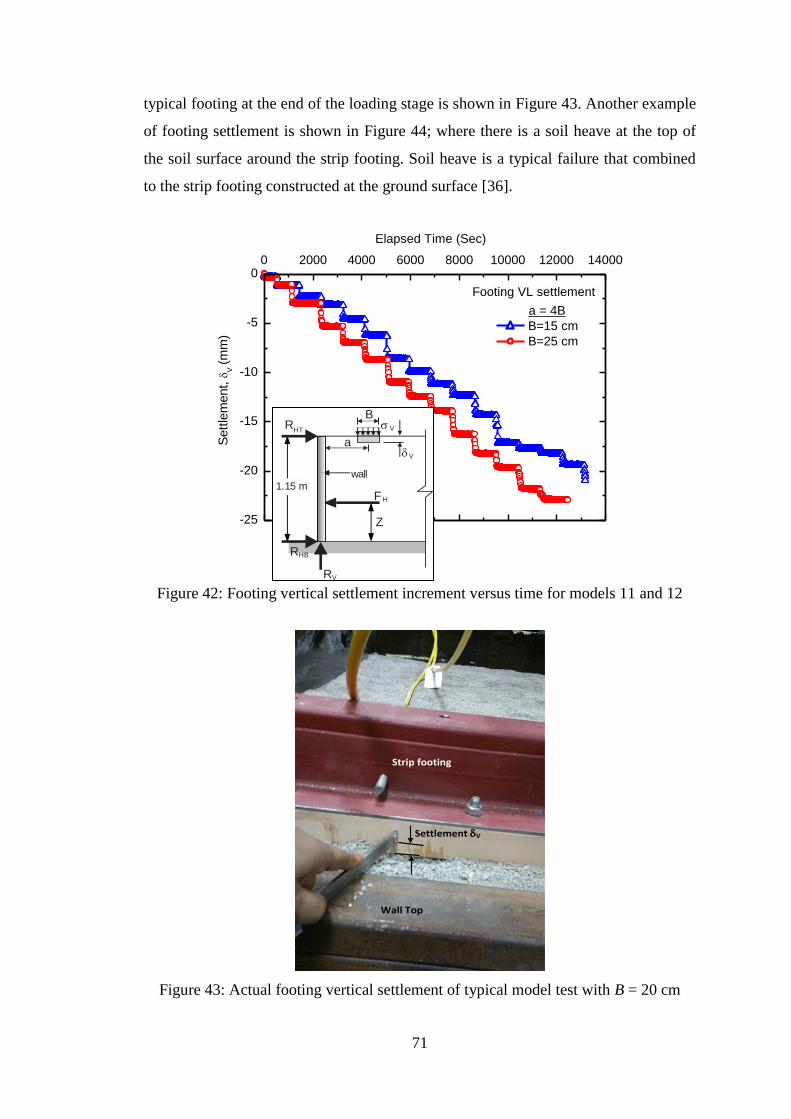
71
typical footing at the end of the loading stage is shown in Figure 43. Another example
of footing settlement is shown in Figure 44; where there is a soil heave at the top of
the soil surface around the strip footing. Soil heave is a typical failure that combined
to the strip footing constructed at the ground surface [36].
-25
-20
-15
-10
-5
00 2000 4000 6000 8000 10000 12000 14000
a = 4B
B=15 cm
B=25 cm
Footing VL settlement
Elapsed Time (Sec)
Sett
lem
ent,
V (
mm
)
Figure 42: Footing vertical settlement increment versus time for models 11 and 12
Figure 43: Actual footing vertical settlement of typical model test with B = 20 cm
a) After loading
Wall Top
Settlement V
Strip footing
RV
wall
RHB
FH
Z
1.15 m
RHT
a
BV
V
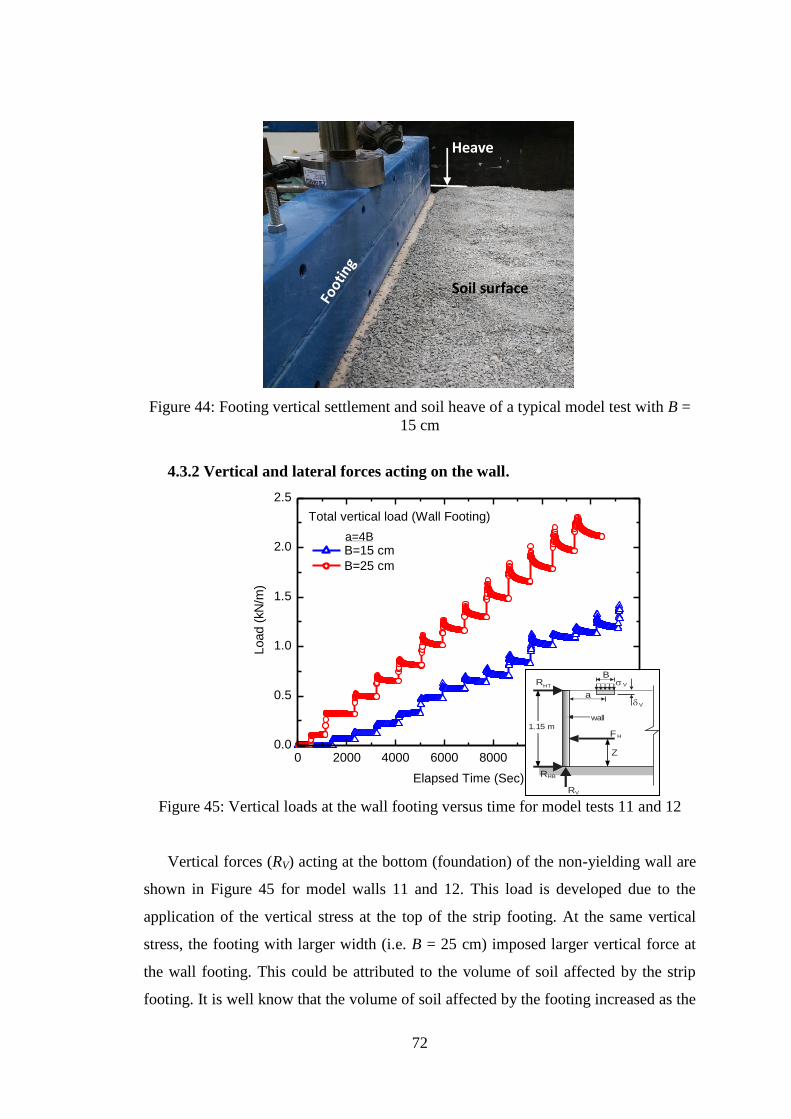
72
Figure 44: Footing vertical settlement and soil heave of a typical model test with B =
15 cm
4.3.2 Vertical and lateral forces acting on the wall.
0 2000 4000 6000 8000 10000 12000 140000.0
0.5
1.0
1.5
2.0
2.5
a = 3B
B=15 cm
B=25 cm
Total vertical load (Wall Footing)
Load (
kN
/m)
Elapsed Time (Sec)
Figure 45: Vertical loads at the wall footing versus time for model tests 11 and 12
Vertical forces (RV) acting at the bottom (foundation) of the non-yielding wall are
shown in Figure 45 for model walls 11 and 12. This load is developed due to the
application of the vertical stress at the top of the strip footing. At the same vertical
stress, the footing with larger width (i.e. B = 25 cm) imposed larger vertical force at
the wall footing. This could be attributed to the volume of soil affected by the strip
footing. It is well know that the volume of soil affected by the footing increased as the
a)
Heave
Soil surface
RV
wall
RHB
FH
Z
1.15 m
RHT
a
BV
V
a=4B
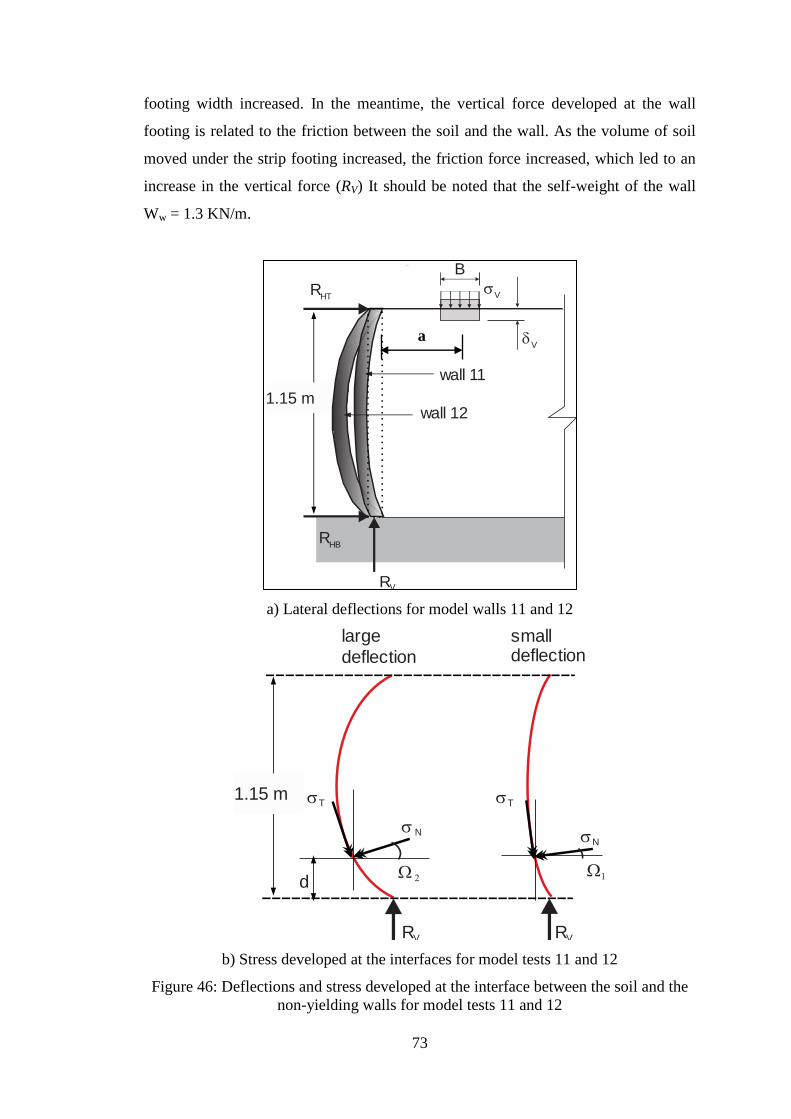
73
footing width increased. In the meantime, the vertical force developed at the wall
footing is related to the friction between the soil and the wall. As the volume of soil
moved under the strip footing increased, the friction force increased, which led to an
increase in the vertical force (RV) It should be noted that the self-weight of the wall
Ww = 1.3 KN/m.
a) Lateral deflections for model walls 11 and 12
b) Stress developed at the interfaces for model tests 11 and 12
Figure 46: Deflections and stress developed at the interface between the soil and the
non-yielding walls for model tests 11 and 12
RV
wall 11
RHB
1.15 m
RHT
a B
V
V
wall 12
N
N
TT1.15 m
d
large
deflection
small deflection
W 2W1
RVRV
a
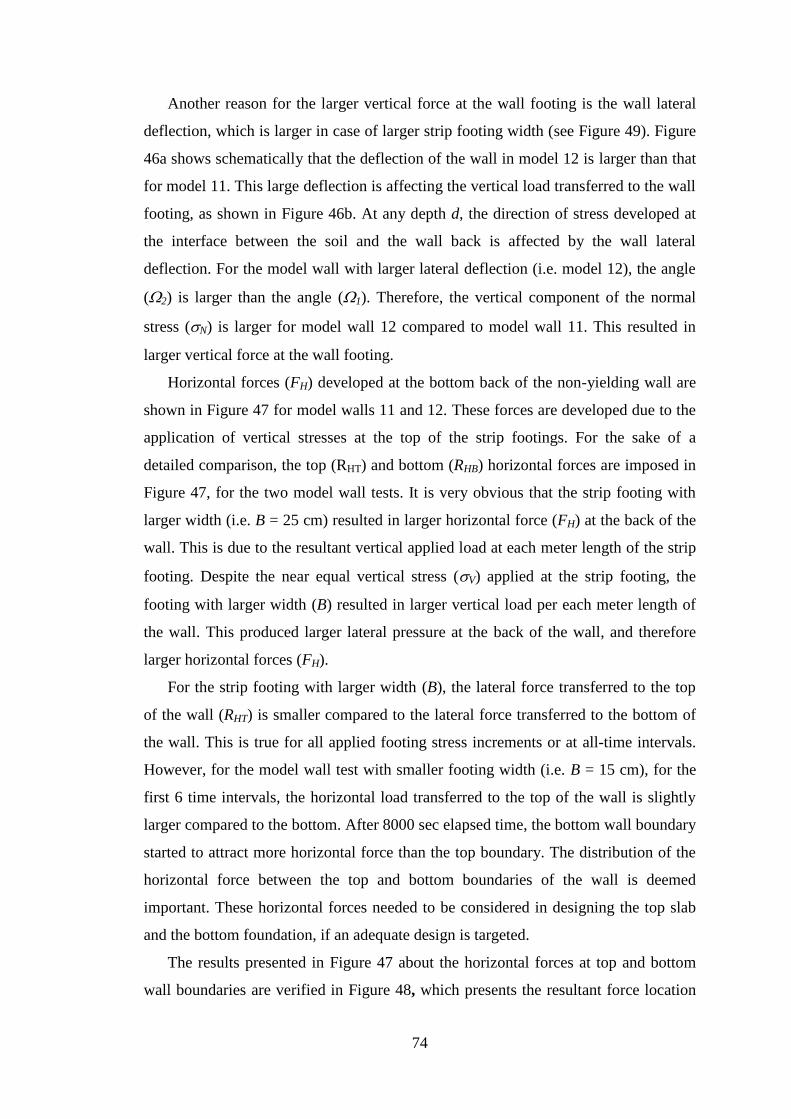
74
Another reason for the larger vertical force at the wall footing is the wall lateral
deflection, which is larger in case of larger strip footing width (see Figure 49). Figure
46a shows schematically that the deflection of the wall in model 12 is larger than that
for model 11. This large deflection is affecting the vertical load transferred to the wall
footing, as shown in Figure 46b. At any depth d, the direction of stress developed at
the interface between the soil and the wall back is affected by the wall lateral
deflection. For the model wall with larger lateral deflection (i.e. model 12), the angle
(W2) is larger than the angle (W1). Therefore, the vertical component of the normal
stress (N) is larger for model wall 12 compared to model wall 11. This resulted in
larger vertical force at the wall footing.
Horizontal forces (FH) developed at the bottom back of the non-yielding wall are
shown in Figure 47 for model walls 11 and 12. These forces are developed due to the
application of vertical stresses at the top of the strip footings. For the sake of a
detailed comparison, the top (RHT) and bottom (RHB) horizontal forces are imposed in
Figure 47, for the two model wall tests. It is very obvious that the strip footing with
larger width (i.e. B = 25 cm) resulted in larger horizontal force (FH) at the back of the
wall. This is due to the resultant vertical applied load at each meter length of the strip
footing. Despite the near equal vertical stress (V) applied at the strip footing, the
footing with larger width (B) resulted in larger vertical load per each meter length of
the wall. This produced larger lateral pressure at the back of the wall, and therefore
larger horizontal forces (FH).
For the strip footing with larger width (B), the lateral force transferred to the top
of the wall (RHT) is smaller compared to the lateral force transferred to the bottom of
the wall. This is true for all applied footing stress increments or at all-time intervals.
However, for the model wall test with smaller footing width (i.e. B = 15 cm), for the
first 6 time intervals, the horizontal load transferred to the top of the wall is slightly
larger compared to the bottom. After 8000 sec elapsed time, the bottom wall boundary
started to attract more horizontal force than the top boundary. The distribution of the
horizontal force between the top and bottom boundaries of the wall is deemed
important. These horizontal forces needed to be considered in designing the top slab
and the bottom foundation, if an adequate design is targeted.
The results presented in Figure 47 about the horizontal forces at top and bottom
wall boundaries are verified in Figure 48, which presents the resultant force location
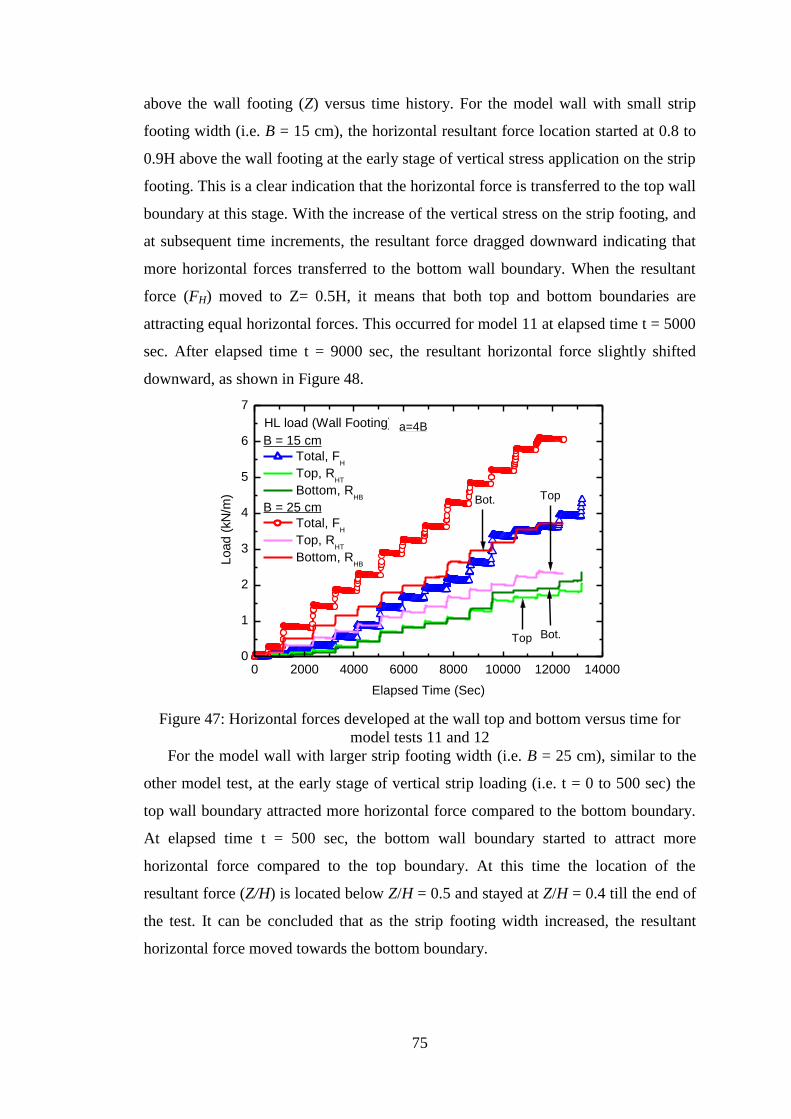
75
above the wall footing (Z) versus time history. For the model wall with small strip
footing width (i.e. B = 15 cm), the horizontal resultant force location started at 0.8 to
0.9H above the wall footing at the early stage of vertical stress application on the strip
footing. This is a clear indication that the horizontal force is transferred to the top wall
boundary at this stage. With the increase of the vertical stress on the strip footing, and
at subsequent time increments, the resultant force dragged downward indicating that
more horizontal forces transferred to the bottom wall boundary. When the resultant
force (FH) moved to Z= 0.5H, it means that both top and bottom boundaries are
attracting equal horizontal forces. This occurred for model 11 at elapsed time t = 5000
sec. After elapsed time t = 9000 sec, the resultant horizontal force slightly shifted
downward, as shown in Figure 48.
0 2000 4000 6000 8000 10000 12000 140000
1
2
3
4
5
6
7
TopBot.
Bot.Top
B = 15 cm
Total, FH
Top, RHT
Bottom, RHB
B = 25 cm
Total, FH
Top, RHT
Bottom, RHB
HL load (Wall Footing) a = 3B
Load (
kN
/m)
Elapsed Time (Sec)
Figure 47: Horizontal forces developed at the wall top and bottom versus time for
model tests 11 and 12
For the model wall with larger strip footing width (i.e. B = 25 cm), similar to the
other model test, at the early stage of vertical strip loading (i.e. t = 0 to 500 sec) the
top wall boundary attracted more horizontal force compared to the bottom boundary.
At elapsed time t = 500 sec, the bottom wall boundary started to attract more
horizontal force compared to the top boundary. At this time the location of the
resultant force (Z/H) is located below Z/H = 0.5 and stayed at Z/H = 0.4 till the end of
the test. It can be concluded that as the strip footing width increased, the resultant
horizontal force moved towards the bottom boundary.
a=4B
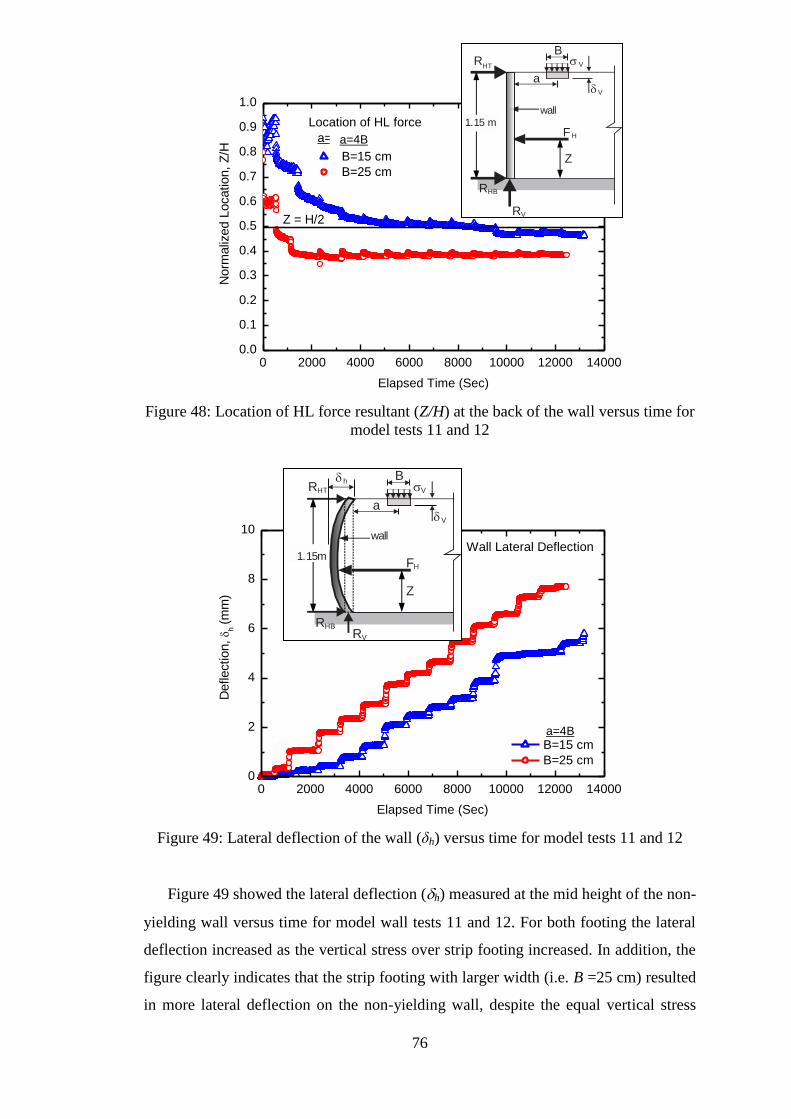
76
0 2000 4000 6000 8000 10000 12000 140000.0
0.1
0.2
0.3
0.4
0.5
0.6
0.7
0.8
0.9
1.0
Z = H/2
a=3B
B=15 cm
B=25 cm
Location of HL force
Norm
aliz
ed L
ocation,
Z/H
Elapsed Time (Sec)
Figure 48: Location of HL force resultant (Z/H) at the back of the wall versus time for
model tests 11 and 12
0 2000 4000 6000 8000 10000 12000 140000
2
4
6
8
10
a = 3B
B=15 cm
B=25 cm
Wall Lateral Deflection
Deflection, h
(mm
)
Elapsed Time (Sec)
Figure 49: Lateral deflection of the wall (δh) versus time for model tests 11 and 12
Figure 49 showed the lateral deflection (h) measured at the mid height of the non-
yielding wall versus time for model wall tests 11 and 12. For both footing the lateral
deflection increased as the vertical stress over strip footing increased. In addition, the
figure clearly indicates that the strip footing with larger width (i.e. B =25 cm) resulted
in more lateral deflection on the non-yielding wall, despite the equal vertical stress
RV
wall
RHB
FH
Z
1.15 m
RHT
a
BV
V
RV
wall
RHB
FH
Z
1.15m
RHT
a
BV
V
h
a=4B
a=4B
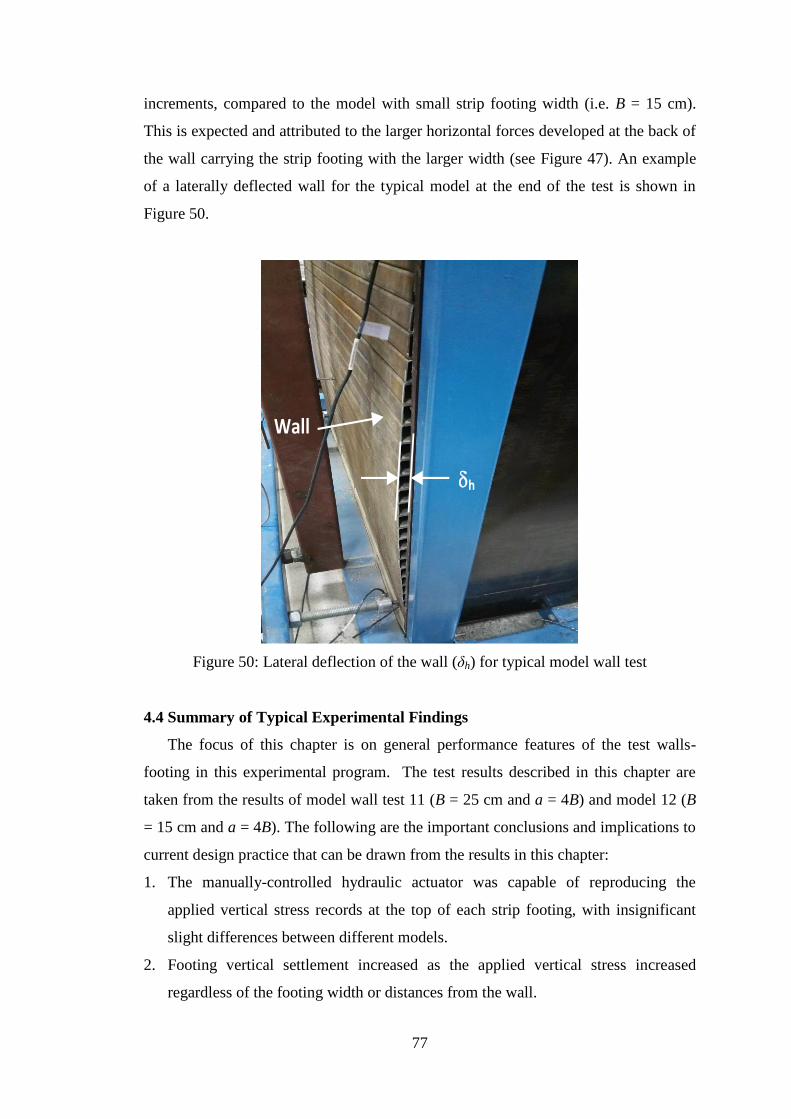
77
increments, compared to the model with small strip footing width (i.e. B = 15 cm).
This is expected and attributed to the larger horizontal forces developed at the back of
the wall carrying the strip footing with the larger width (see Figure 47). An example
of a laterally deflected wall for the typical model at the end of the test is shown in
Figure 50.
Figure 50: Lateral deflection of the wall (δh) for typical model wall test
4.4 Summary of Typical Experimental Findings
The focus of this chapter is on general performance features of the test walls-
footing in this experimental program. The test results described in this chapter are
taken from the results of model wall test 11 (B = 25 cm and a = 4B) and model 12 (B
= 15 cm and a = 4B). The following are the important conclusions and implications to
current design practice that can be drawn from the results in this chapter:
1. The manually-controlled hydraulic actuator was capable of reproducing the
applied vertical stress records at the top of each strip footing, with insignificant
slight differences between different models.
2. Footing vertical settlement increased as the applied vertical stress increased
regardless of the footing width or distances from the wall.
h
Wall
78
3. For the same vertical stress increment, the strip footing with smaller width (B)
showed smaller vertical settlement. This conclusion is in agreement with shallow
foundation settlement theory, which indicates that the vertical settlement increases
as the footing width increases.
4. Application of the vertical stress at the top of the strip footing constructed
adjacent to non-yielding wall imposed vertical forces (RV) at the bottom
(foundation) of the wall. These vertical forces increased as the footing width
increased.
5. Application of vertical stresses at the top of the strip footings adjacent to non-
yielding walls resulted in lateral forces (FH) at the back of the wall. The strip
footing with the larger width (B) resulted in larger horizontal force (FH) at the
back of non-yielding wall.
6. Location of lateral forces above the wall footing (Z) is located between 0.4H to
0.5H depending on the width of the strip footing (B). As the strip footing width
(B) increased, the lateral forces moved downward towards the wall foundation.
7. The lateral deflection of the non-yielding wall increased when the vertical stress
was applied over strip footing. The strep footing with larger width (B) imposed
more lateral deflection on the non-yielding wall, despite the equal vertical stress
increments, compared to the model with the small strip footing width.
79
Chapter 5: Analysis of Wall-Footing Parametric Responses
5.1 General
Chapter 4 presented selected qualitative results of strip footing-wall model tests
and examples of response-time histories of two different wall-footing models. This
chapter presents the analysis and discussion of the data obtained from all fifteen
reduced-scale model tests. In accordance with the scale modeling guidelines
introduced in Chapter 2, all analyses presented in this chapter were performed at the
model scale dimensions. Responses from selected wall-footing models are compared
in order to isolate the effect of different wall-footing components. The parameters
considered in this study are the footing width (B), the footing distance from the back
of the wall (a), and the footing depth under the backfill surface (df). In additions to the
parametric comparisons, the model wall-footing responses are compared with
predicted results using current earth pressure design methods. The earth pressure
design method investigated in section 5.5 Analytical Comparison and Modification, is
the Boussinesq’s earth pressure prediction method that is based on the elastic solution
found in literature
In section 5.2, data treatment and the average concept are introduced and
explained. Averaging the data in the time domain as well as in the stress domain is
shown and discussed. Next, the non-yielding wall force response, including forces at
the wall top and bottom, and forces applied at the strip footing, are compared for
different wall-footing design parameter. Both horizontal and vertical forces acting at
the top and bottom of the wall that are measured from load cells will be compared. In
addition, the location of the horizontal earth force at the back of the wall will be
investigated. Then, soil movement, including strip footing vertical settlement and the
wall lateral deflection that was measured using different LVDTs, will be introduced
and discussed. The effects of the different wall-footing design parameters on the wall-
footing soil movement will be explained. Finally, detailed quantitative analysis and
comparison of results between different test configurations, in addition to a
comparison with Boussinesq’s earth pressure prediction method, which is based on
the elastic solution found in literature, is also going to be presented in this chapter.
Finally, sources of conservatism of current earth prediction methods are discussed and
practical implications are presented.
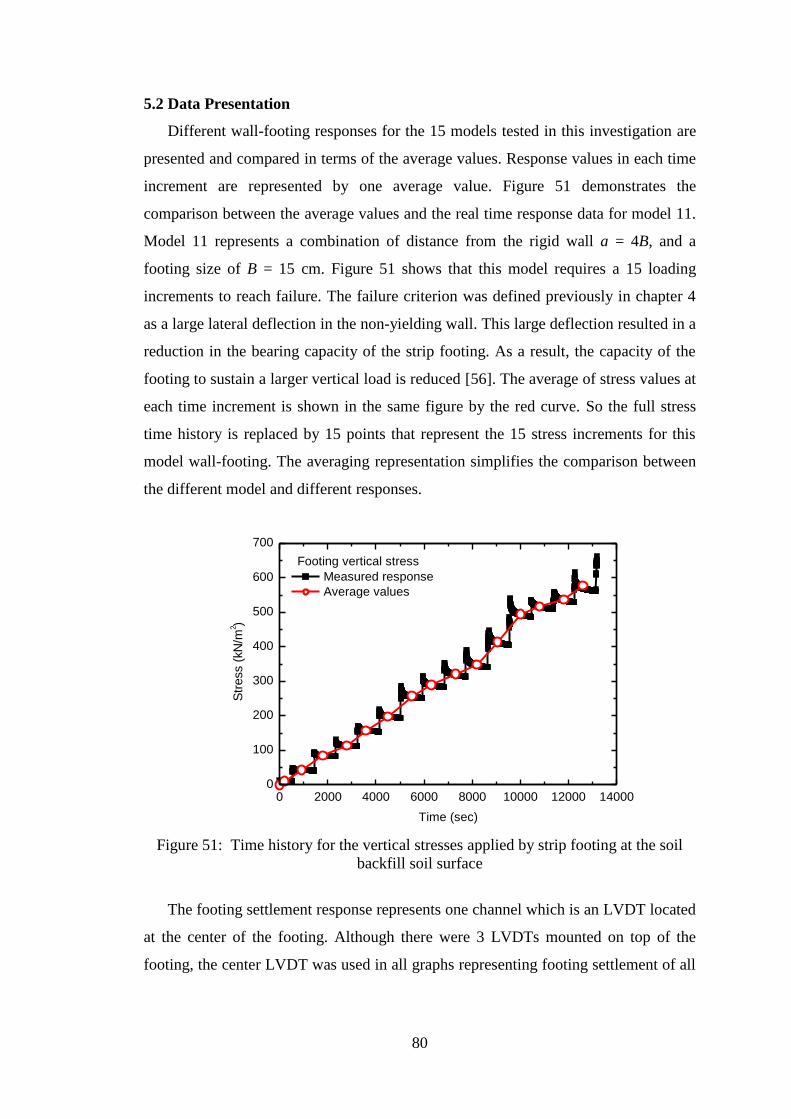
80
5.2 Data Presentation
Different wall-footing responses for the 15 models tested in this investigation are
presented and compared in terms of the average values. Response values in each time
increment are represented by one average value. Figure 51 demonstrates the
comparison between the average values and the real time response data for model 11.
Model 11 represents a combination of distance from the rigid wall a = 4B, and a
footing size of B = 15 cm. Figure 51 shows that this model requires a 15 loading
increments to reach failure. The failure criterion was defined previously in chapter 4
as a large lateral deflection in the non-yielding wall. This large deflection resulted in a
reduction in the bearing capacity of the strip footing. As a result, the capacity of the
footing to sustain a larger vertical load is reduced [56]. The average of stress values at
each time increment is shown in the same figure by the red curve. So the full stress
time history is replaced by 15 points that represent the 15 stress increments for this
model wall-footing. The averaging representation simplifies the comparison between
the different model and different responses.
0 2000 4000 6000 8000 10000 12000 140000
100
200
300
400
500
600
700
Footing vertical stress
Str
ess (
kN
/m2 )
Time (sec)
Measured response
Average values
Figure 51: Time history for the vertical stresses applied by strip footing at the soil
backfill soil surface
The footing settlement response represents one channel which is an LVDT located
at the center of the footing. Although there were 3 LVDTs mounted on top of the
footing, the center LVDT was used in all graphs representing footing settlement of all
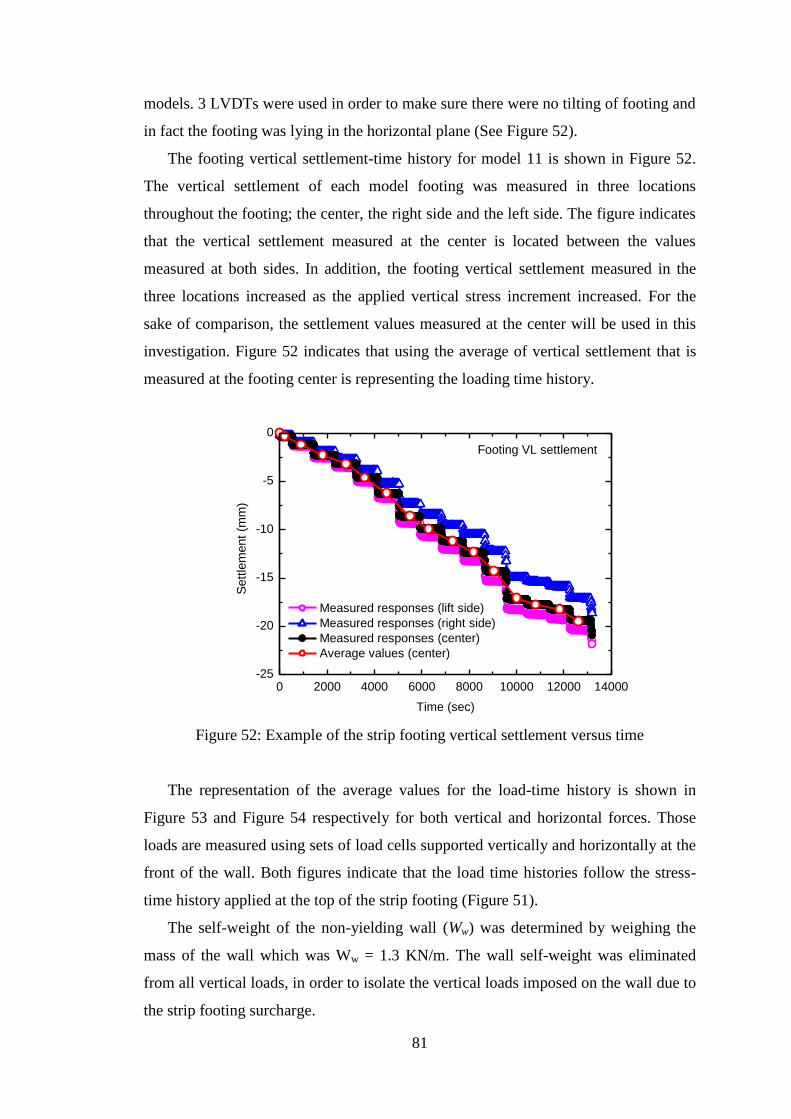
81
models. 3 LVDTs were used in order to make sure there were no tilting of footing and
in fact the footing was lying in the horizontal plane (See Figure 52).
The footing vertical settlement-time history for model 11 is shown in Figure 52.
The vertical settlement of each model footing was measured in three locations
throughout the footing; the center, the right side and the left side. The figure indicates
that the vertical settlement measured at the center is located between the values
measured at both sides. In addition, the footing vertical settlement measured in the
three locations increased as the applied vertical stress increment increased. For the
sake of comparison, the settlement values measured at the center will be used in this
investigation. Figure 52 indicates that using the average of vertical settlement that is
measured at the footing center is representing the loading time history.
0 2000 4000 6000 8000 10000 12000 14000-25
-20
-15
-10
-5
0
Measured responses (lift side)
Measured responses (right side)
Measured responses (center)
Average values (center)
Footing VL settlement
Sett
lem
ent
(mm
)
Time (sec)
Figure 52: Example of the strip footing vertical settlement versus time
The representation of the average values for the load-time history is shown in
Figure 53 and Figure 54 respectively for both vertical and horizontal forces. Those
loads are measured using sets of load cells supported vertically and horizontally at the
front of the wall. Both figures indicate that the load time histories follow the stress-
time history applied at the top of the strip footing (Figure 51).
The self-weight of the non-yielding wall (Ww) was determined by weighing the
mass of the wall which was Ww = 1.3 KN/m. The wall self-weight was eliminated
from all vertical loads, in order to isolate the vertical loads imposed on the wall due to
the strip footing surcharge.
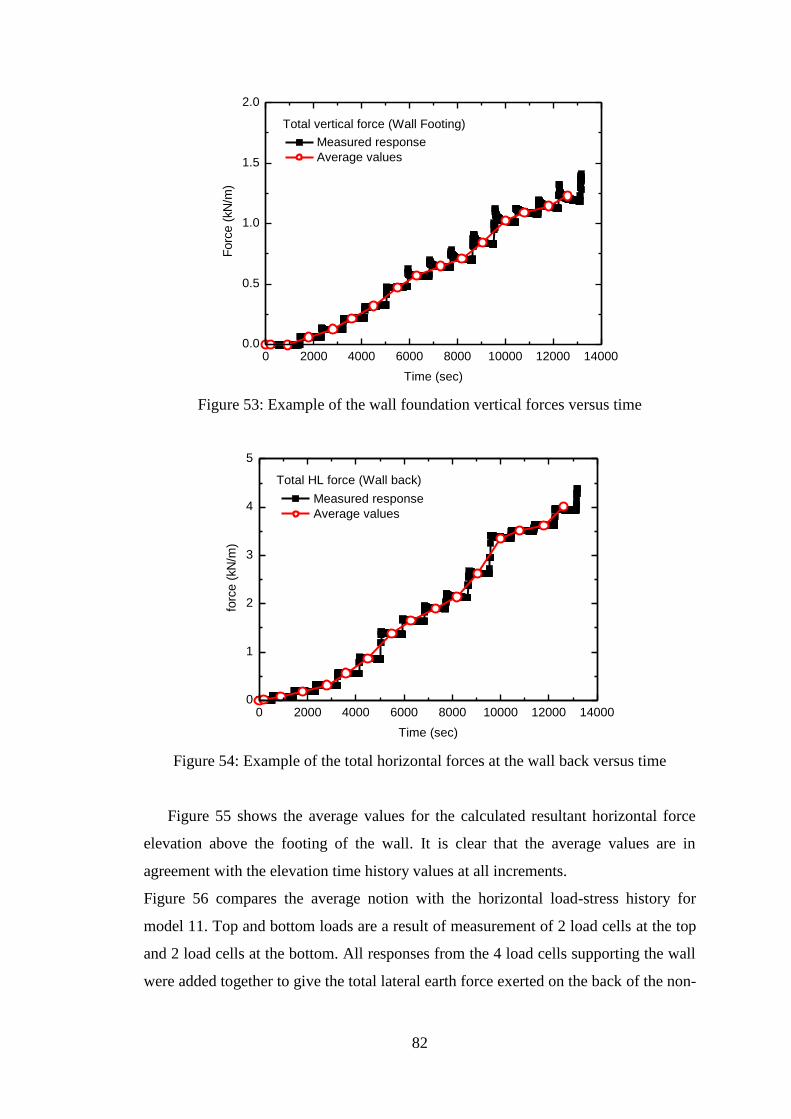
82
0 2000 4000 6000 8000 10000 12000 140000.0
0.5
1.0
1.5
2.0
Measured response
Average values
Total vertical force (Wall Footing)
Forc
e (
kN
/m)
Time (sec)
Figure 53: Example of the wall foundation vertical forces versus time
0 2000 4000 6000 8000 10000 12000 140000
1
2
3
4
5
Measured response
Average values
Total HL force (Wall back)
forc
e (
kN
/m)
Time (sec)
Figure 54: Example of the total horizontal forces at the wall back versus time
Figure 55 shows the average values for the calculated resultant horizontal force
elevation above the footing of the wall. It is clear that the average values are in
agreement with the elevation time history values at all increments.
Figure 56 compares the average notion with the horizontal load-stress history for
model 11. Top and bottom loads are a result of measurement of 2 load cells at the top
and 2 load cells at the bottom. All responses from the 4 load cells supporting the wall
were added together to give the total lateral earth force exerted on the back of the non-
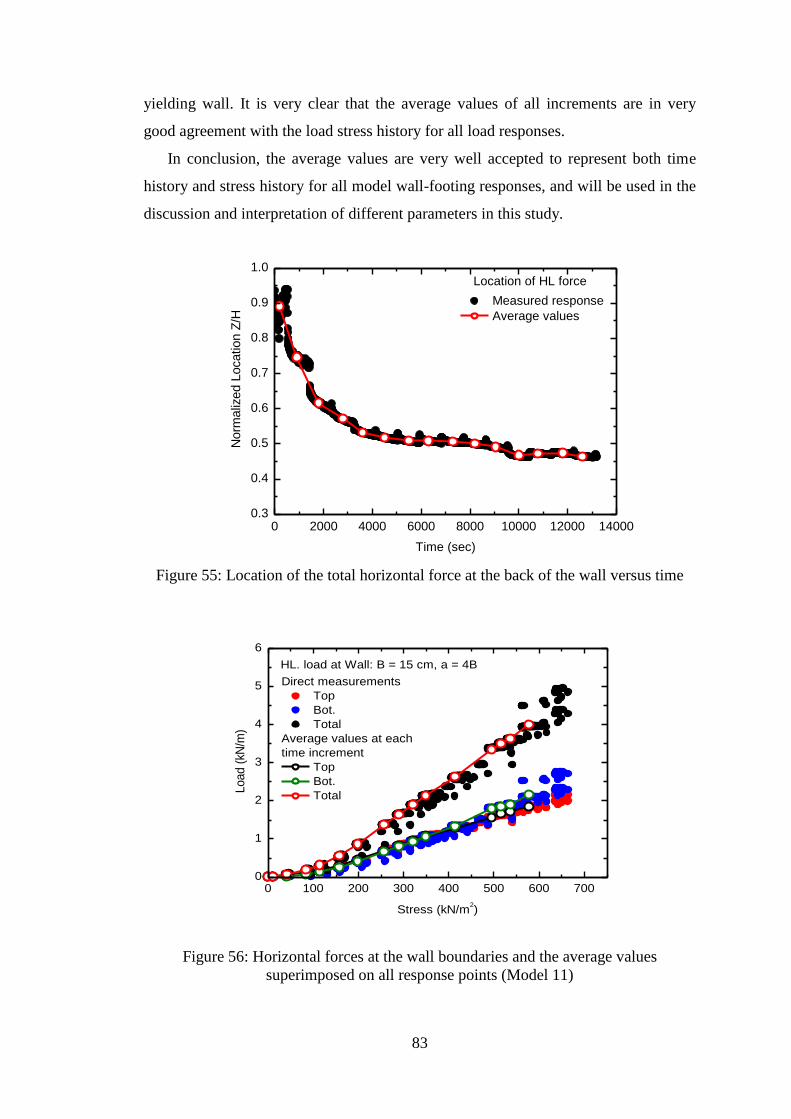
83
yielding wall. It is very clear that the average values of all increments are in very
good agreement with the load stress history for all load responses.
In conclusion, the average values are very well accepted to represent both time
history and stress history for all model wall-footing responses, and will be used in the
discussion and interpretation of different parameters in this study.
0 2000 4000 6000 8000 10000 12000 140000.3
0.4
0.5
0.6
0.7
0.8
0.9
1.0
Measured response
Average values
Location of HL force
N
orm
aliz
ed L
ocation Z
/H
Time (sec)
Figure 55: Location of the total horizontal force at the back of the wall versus time
Figure 56: Horizontal forces at the wall boundaries and the average values
superimposed on all response points (Model 11)
0 100 200 300 400 500 600 7000
1
2
3
4
5
6
Direct measurements
Top
Bot.
Total
Average values at each
time increment
Top
Bot.
Total
HL. load at Wall: B = 15 cm, a = 4B
Load (
kN/m
)
Stress (kN/m2)
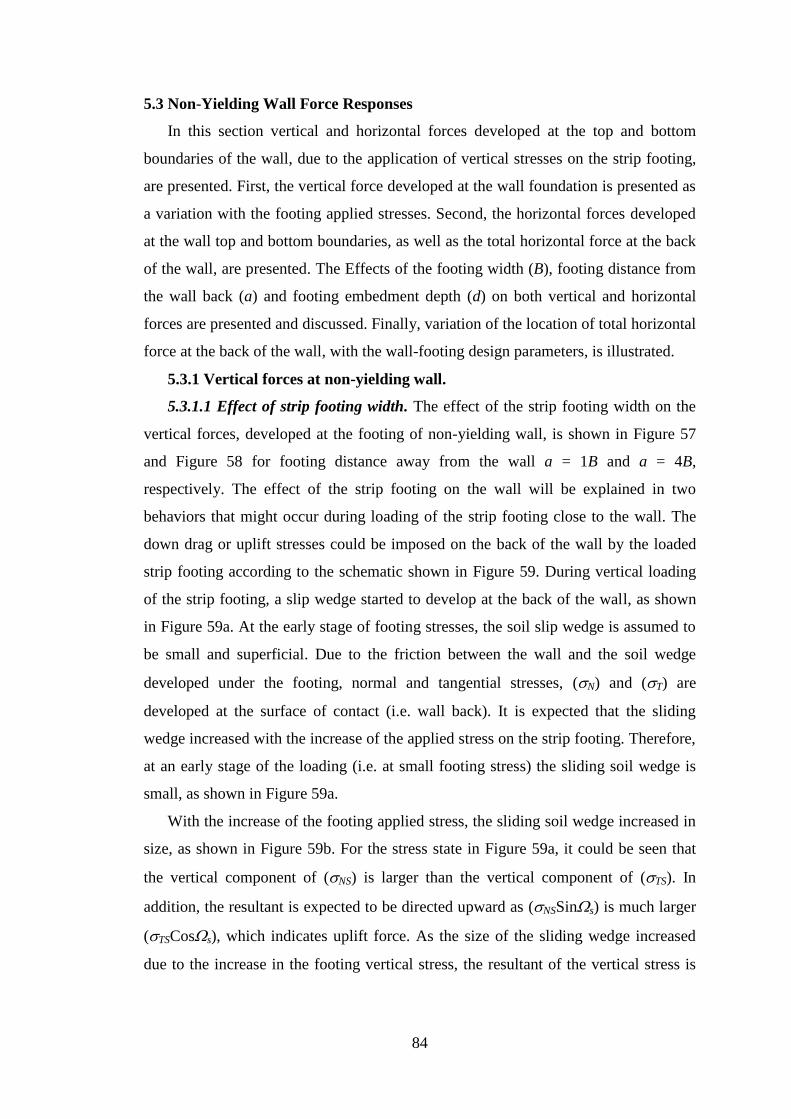
84
5.3 Non-Yielding Wall Force Responses
In this section vertical and horizontal forces developed at the top and bottom
boundaries of the wall, due to the application of vertical stresses on the strip footing,
are presented. First, the vertical force developed at the wall foundation is presented as
a variation with the footing applied stresses. Second, the horizontal forces developed
at the wall top and bottom boundaries, as well as the total horizontal force at the back
of the wall, are presented. The Effects of the footing width (B), footing distance from
the wall back (a) and footing embedment depth (d) on both vertical and horizontal
forces are presented and discussed. Finally, variation of the location of total horizontal
force at the back of the wall, with the wall-footing design parameters, is illustrated.
5.3.1 Vertical forces at non-yielding wall.
5.3.1.1 Effect of strip footing width. The effect of the strip footing width on the
vertical forces, developed at the footing of non-yielding wall, is shown in Figure 57
and Figure 58 for footing distance away from the wall a = 1B and a = 4B,
respectively. The effect of the strip footing on the wall will be explained in two
behaviors that might occur during loading of the strip footing close to the wall. The
down drag or uplift stresses could be imposed on the back of the wall by the loaded
strip footing according to the schematic shown in Figure 59. During vertical loading
of the strip footing, a slip wedge started to develop at the back of the wall, as shown
in Figure 59a. At the early stage of footing stresses, the soil slip wedge is assumed to
be small and superficial. Due to the friction between the wall and the soil wedge
developed under the footing, normal and tangential stresses, (N) and (T) are
developed at the surface of contact (i.e. wall back). It is expected that the sliding
wedge increased with the increase of the applied stress on the strip footing. Therefore,
at an early stage of the loading (i.e. at small footing stress) the sliding soil wedge is
small, as shown in Figure 59a.
With the increase of the footing applied stress, the sliding soil wedge increased in
size, as shown in Figure 59b. For the stress state in Figure 59a, it could be seen that
the vertical component of (NS) is larger than the vertical component of (TS). In
addition, the resultant is expected to be directed upward as (NSSinWs) is much larger
(TSCosWs), which indicates uplift force. As the size of the sliding wedge increased
due to the increase in the footing vertical stress, the resultant of the vertical stress is
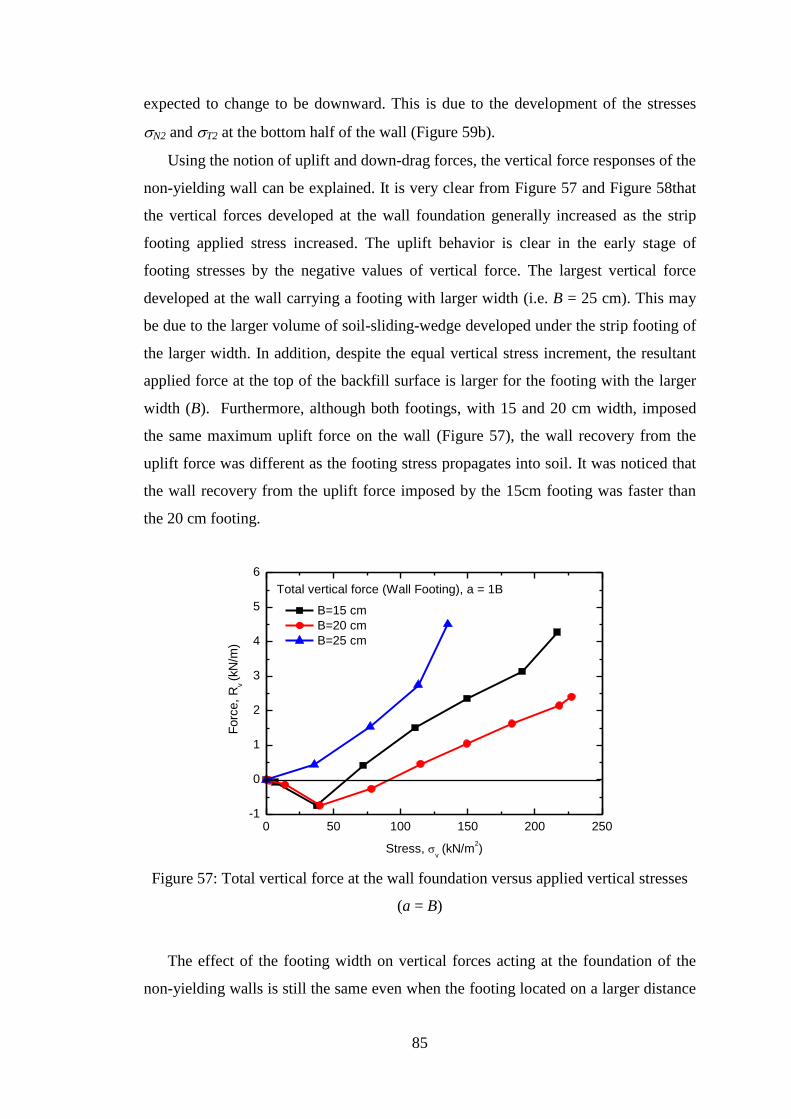
85
expected to change to be downward. This is due to the development of the stresses
N2 and T2 at the bottom half of the wall (Figure 59b).
Using the notion of uplift and down-drag forces, the vertical force responses of the
non-yielding wall can be explained. It is very clear from Figure 57 and Figure 58that
the vertical forces developed at the wall foundation generally increased as the strip
footing applied stress increased. The uplift behavior is clear in the early stage of
footing stresses by the negative values of vertical force. The largest vertical force
developed at the wall carrying a footing with larger width (i.e. B = 25 cm). This may
be due to the larger volume of soil-sliding-wedge developed under the strip footing of
the larger width. In addition, despite the equal vertical stress increment, the resultant
applied force at the top of the backfill surface is larger for the footing with the larger
width (B). Furthermore, although both footings, with 15 and 20 cm width, imposed
the same maximum uplift force on the wall (Figure 57), the wall recovery from the
uplift force was different as the footing stress propagates into soil. It was noticed that
the wall recovery from the uplift force imposed by the 15cm footing was faster than
the 20 cm footing.
0 50 100 150 200 250-1
0
1
2
3
4
5
6
B=15 cm
B=20 cm
B=25 cm
Total vertical force (Wall Footing), a = 1B
Forc
e,
Rv (k
N/m
)
Stress, v (kN/m
2)
Figure 57: Total vertical force at the wall foundation versus applied vertical stresses
(a = B)
The effect of the footing width on vertical forces acting at the foundation of the
non-yielding walls is still the same even when the footing located on a larger distance
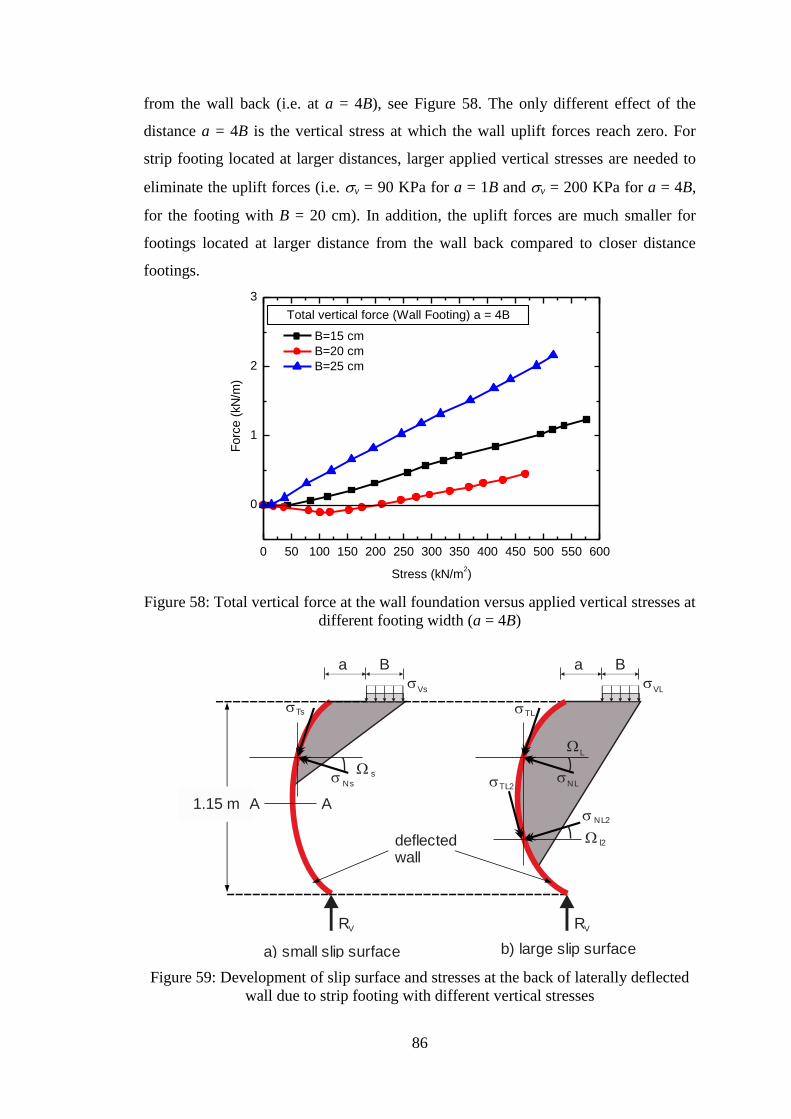
86
from the wall back (i.e. at a = 4B), see Figure 58. The only different effect of the
distance a = 4B is the vertical stress at which the wall uplift forces reach zero. For
strip footing located at larger distances, larger applied vertical stresses are needed to
eliminate the uplift forces (i.e. v = 90 KPa for a = 1B and v = 200 KPa for a = 4B,
for the footing with B = 20 cm). In addition, the uplift forces are much smaller for
footings located at larger distance from the wall back compared to closer distance
footings.
0 50 100 150 200 250 300 350 400 450 500 550 600
0
1
2
3
B=15 cm
B=20 cm
B=25 cm
Total vertical force (Wall Footing) a = 4B
Forc
e (
kN
/m)
Stress (kN/m2)
Figure 58: Total vertical force at the wall foundation versus applied vertical stresses at
different footing width (a = 4B)
Figure 59: Development of slip surface and stresses at the back of laterally deflected
wall due to strip footing with different vertical stresses
Ns
Ts
1.15 m
deflectedwall
a) small slip surface
W s
RV
B
Vs
NL
b) large slip surface
WL
RV
B
VL
NL2
TL2
W l2
A A
TL
aa
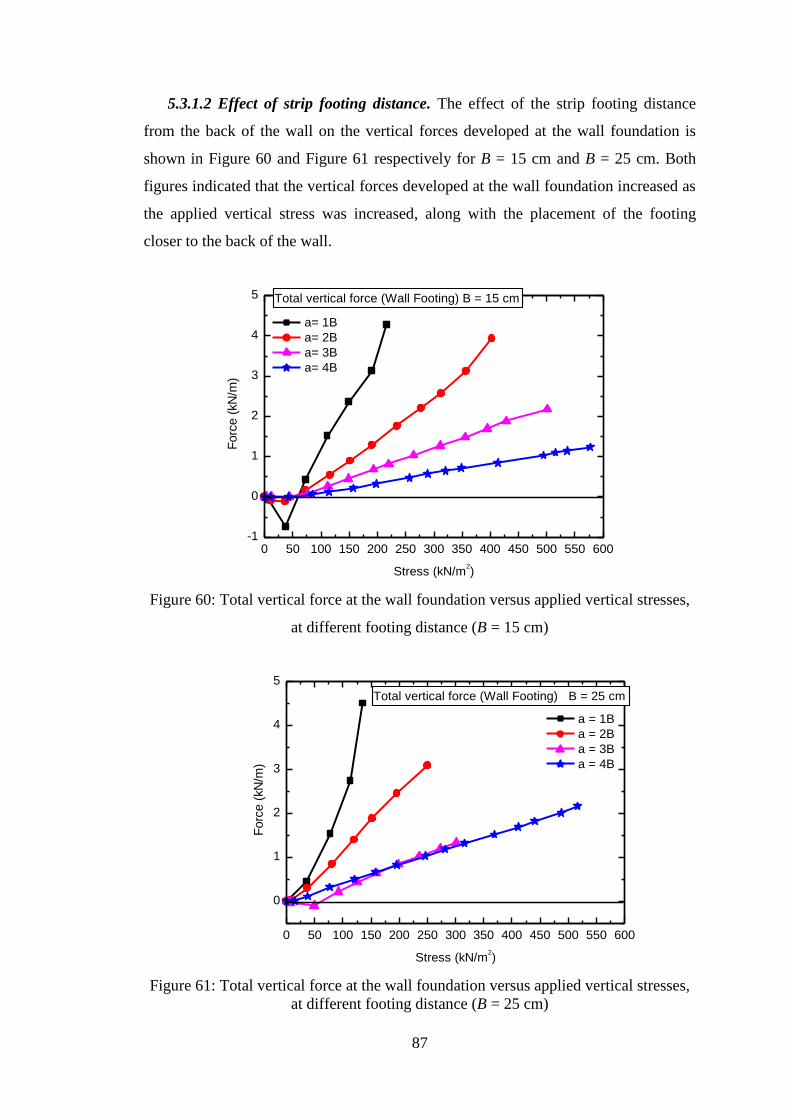
87
5.3.1.2 Effect of strip footing distance. The effect of the strip footing distance
from the back of the wall on the vertical forces developed at the wall foundation is
shown in Figure 60 and Figure 61 respectively for B = 15 cm and B = 25 cm. Both
figures indicated that the vertical forces developed at the wall foundation increased as
the applied vertical stress was increased, along with the placement of the footing
closer to the back of the wall.
0 50 100 150 200 250 300 350 400 450 500 550 600-1
0
1
2
3
4
5
a= 1B
a= 2B
a= 3B
a= 4B
Total vertical force (Wall Footing) B = 15 cm
Forc
e (
kN
/m)
Stress (kN/m2)
Figure 60: Total vertical force at the wall foundation versus applied vertical stresses,
at different footing distance (B = 15 cm)
0 50 100 150 200 250 300 350 400 450 500 550 600
0
1
2
3
4
5
a = 1B
a = 2B
a = 3B
a = 4B
Total vertical force (Wall Footing) B = 25 cm
Forc
e (
kN
/m)
Stress (kN/m2)
Figure 61: Total vertical force at the wall foundation versus applied vertical stresses,
at different footing distance (B = 25 cm)
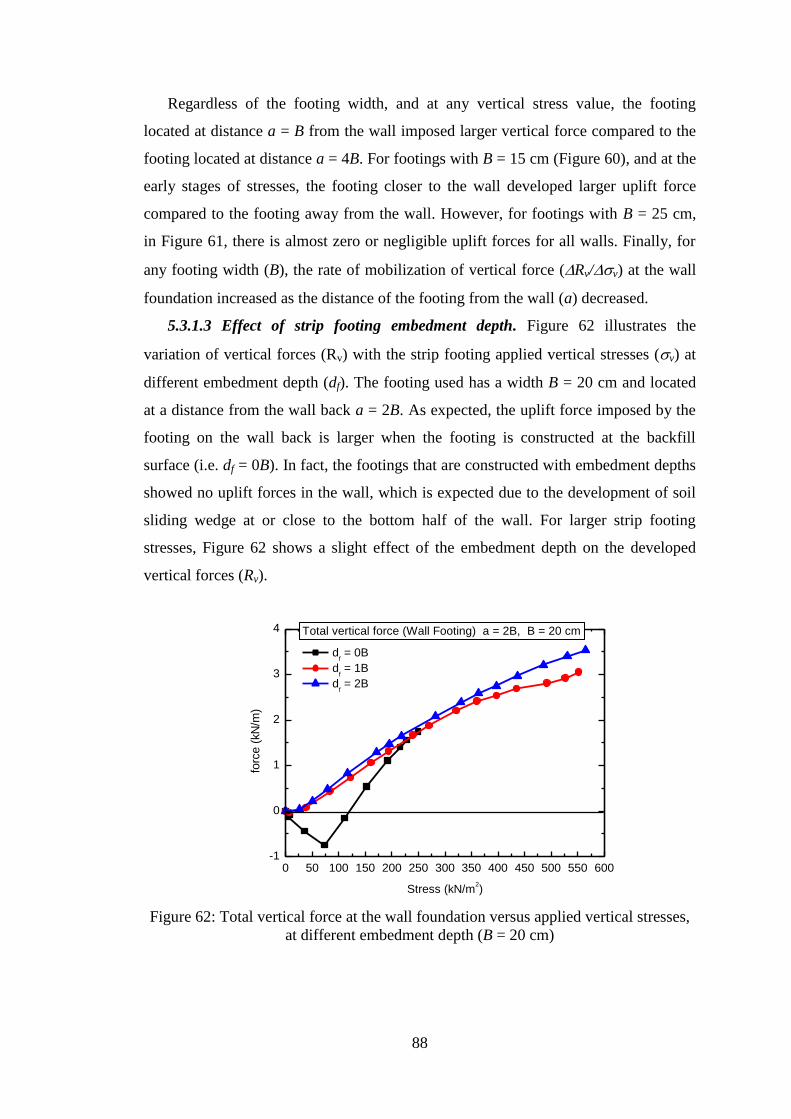
88
Regardless of the footing width, and at any vertical stress value, the footing
located at distance a = B from the wall imposed larger vertical force compared to the
footing located at distance a = 4B. For footings with B = 15 cm (Figure 60), and at the
early stages of stresses, the footing closer to the wall developed larger uplift force
compared to the footing away from the wall. However, for footings with B = 25 cm,
in Figure 61, there is almost zero or negligible uplift forces for all walls. Finally, for
any footing width (B), the rate of mobilization of vertical force (Rv/v) at the wall
foundation increased as the distance of the footing from the wall (a) decreased.
5.3.1.3 Effect of strip footing embedment depth. Figure 62 illustrates the
variation of vertical forces (Rv) with the strip footing applied vertical stresses (v) at
different embedment depth (df). The footing used has a width B = 20 cm and located
at a distance from the wall back a = 2B. As expected, the uplift force imposed by the
footing on the wall back is larger when the footing is constructed at the backfill
surface (i.e. df = 0B). In fact, the footings that are constructed with embedment depths
showed no uplift forces in the wall, which is expected due to the development of soil
sliding wedge at or close to the bottom half of the wall. For larger strip footing
stresses, Figure 62 shows a slight effect of the embedment depth on the developed
vertical forces (Rv).
0 50 100 150 200 250 300 350 400 450 500 550 600-1
0
1
2
3
4
df = 0B
df = 1B
df = 2B
Total vertical force (Wall Footing) a = 2B, B = 20 cm
forc
e (
kN
/m)
Stress (kN/m2)
Figure 62: Total vertical force at the wall foundation versus applied vertical stresses,
at different embedment depth (B = 20 cm)
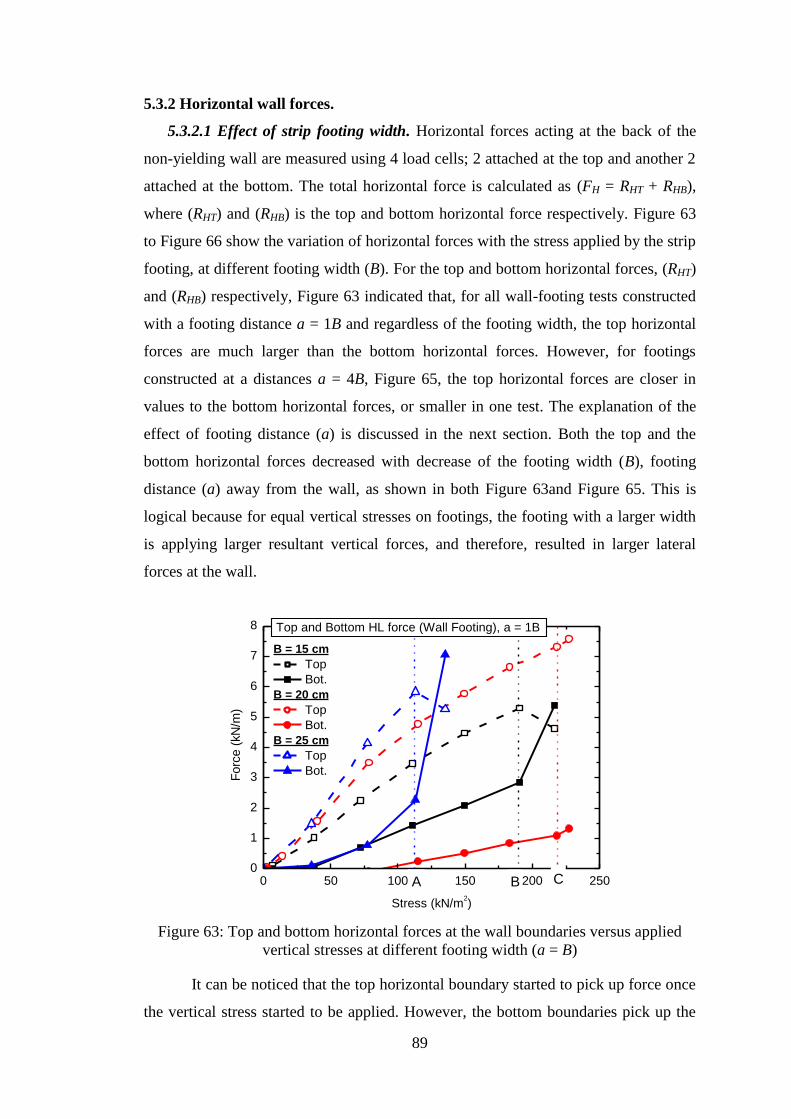
89
5.3.2 Horizontal wall forces.
5.3.2.1 Effect of strip footing width. Horizontal forces acting at the back of the
non-yielding wall are measured using 4 load cells; 2 attached at the top and another 2
attached at the bottom. The total horizontal force is calculated as (FH = RHT + RHB),
where (RHT) and (RHB) is the top and bottom horizontal force respectively. Figure 63
to Figure 66 show the variation of horizontal forces with the stress applied by the strip
footing, at different footing width (B). For the top and bottom horizontal forces, (RHT)
and (RHB) respectively, Figure 63 indicated that, for all wall-footing tests constructed
with a footing distance a = 1B and regardless of the footing width, the top horizontal
forces are much larger than the bottom horizontal forces. However, for footings
constructed at a distances a = 4B, Figure 65, the top horizontal forces are closer in
values to the bottom horizontal forces, or smaller in one test. The explanation of the
effect of footing distance (a) is discussed in the next section. Both the top and the
bottom horizontal forces decreased with decrease of the footing width (B), footing
distance (a) away from the wall, as shown in both Figure 63and Figure 65. This is
logical because for equal vertical stresses on footings, the footing with a larger width
is applying larger resultant vertical forces, and therefore, resulted in larger lateral
forces at the wall.
0 50 100 150 200 2500
1
2
3
4
5
6
7
8
CBA
B = 15 cm
Top
Bot.
B = 20 cm
Top
Bot.
B = 25 cm
Top
Bot.
Top and Bottom HL force (Wall Footing), a = 1B
Forc
e (
kN
/m)
Stress (kN/m2)
Figure 63: Top and bottom horizontal forces at the wall boundaries versus applied
vertical stresses at different footing width (a = B)
It can be noticed that the top horizontal boundary started to pick up force once
the vertical stress started to be applied. However, the bottom boundaries pick up the
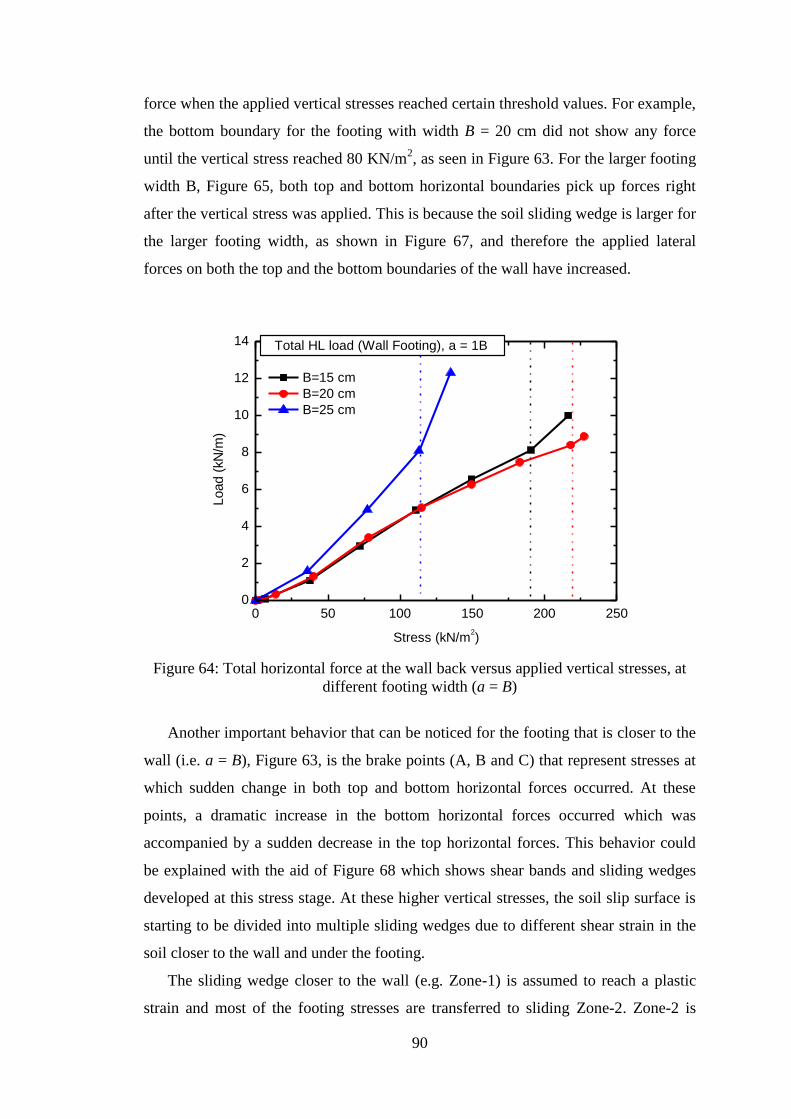
90
force when the applied vertical stresses reached certain threshold values. For example,
the bottom boundary for the footing with width B = 20 cm did not show any force
until the vertical stress reached 80 KN/m2, as seen in Figure 63. For the larger footing
width B, Figure 65, both top and bottom horizontal boundaries pick up forces right
after the vertical stress was applied. This is because the soil sliding wedge is larger for
the larger footing width, as shown in Figure 67, and therefore the applied lateral
forces on both the top and the bottom boundaries of the wall have increased.
0 50 100 150 200 2500
2
4
6
8
10
12
14
B=15 cm
B=20 cm
B=25 cm
Total HL load (Wall Footing), a = 1B
Load (
kN
/m)
Stress (kN/m2)
Figure 64: Total horizontal force at the wall back versus applied vertical stresses, at
different footing width (a = B)
Another important behavior that can be noticed for the footing that is closer to the
wall (i.e. a = B), Figure 63, is the brake points (A, B and C) that represent stresses at
which sudden change in both top and bottom horizontal forces occurred. At these
points, a dramatic increase in the bottom horizontal forces occurred which was
accompanied by a sudden decrease in the top horizontal forces. This behavior could
be explained with the aid of Figure 68 which shows shear bands and sliding wedges
developed at this stress stage. At these higher vertical stresses, the soil slip surface is
starting to be divided into multiple sliding wedges due to different shear strain in the
soil closer to the wall and under the footing.
The sliding wedge closer to the wall (e.g. Zone-1) is assumed to reach a plastic
strain and most of the footing stresses are transferred to sliding Zone-2. Zone-2 is
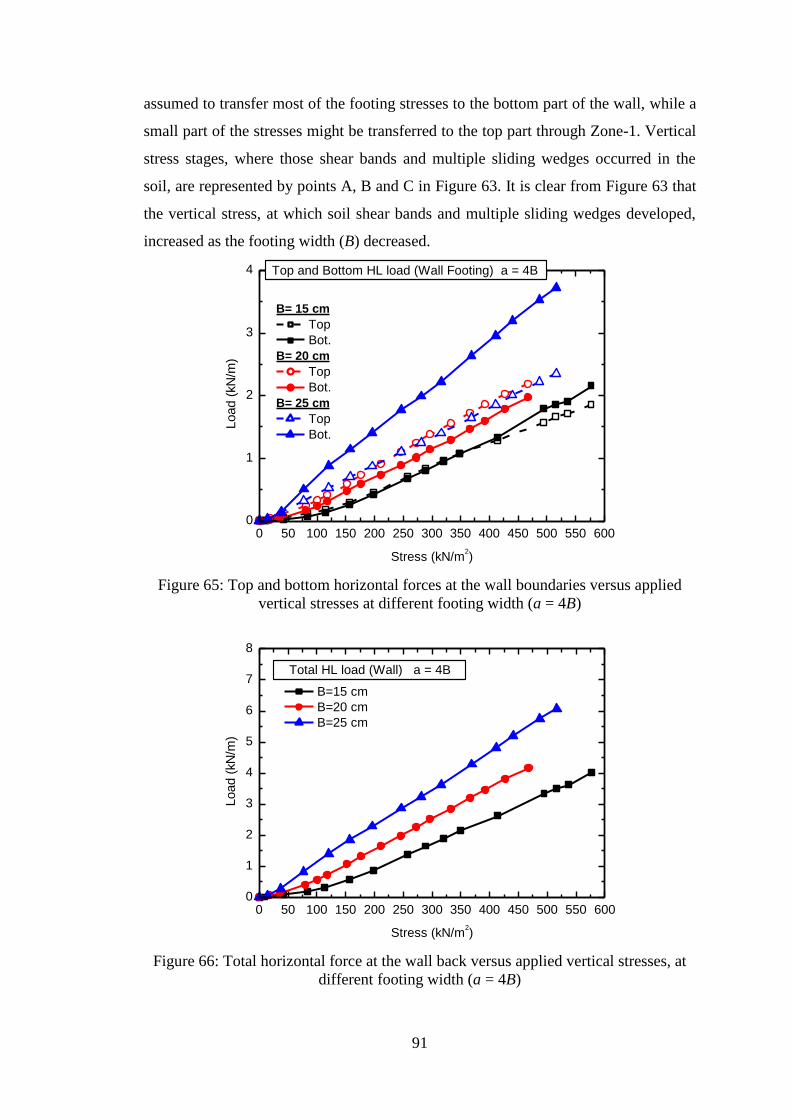
91
assumed to transfer most of the footing stresses to the bottom part of the wall, while a
small part of the stresses might be transferred to the top part through Zone-1. Vertical
stress stages, where those shear bands and multiple sliding wedges occurred in the
soil, are represented by points A, B and C in Figure 63. It is clear from Figure 63 that
the vertical stress, at which soil shear bands and multiple sliding wedges developed,
increased as the footing width (B) decreased.
0 50 100 150 200 250 300 350 400 450 500 550 6000
1
2
3
4
B= 15 cm
Top
Bot.
B= 20 cm
Top
Bot.
B= 25 cm
Top
Bot.
Top and Bottom HL load (Wall Footing) a = 4B
Load (
kN
/m)
Stress (kN/m2)
Figure 65: Top and bottom horizontal forces at the wall boundaries versus applied
vertical stresses at different footing width (a = 4B)
0 50 100 150 200 250 300 350 400 450 500 550 6000
1
2
3
4
5
6
7
8
B=15 cm
B=20 cm
B=25 cm
Total HL load (Wall) a = 4B
Load (
kN
/m)
Stress (kN/m2)
Figure 66: Total horizontal force at the wall back versus applied vertical stresses, at
different footing width (a = 4B)
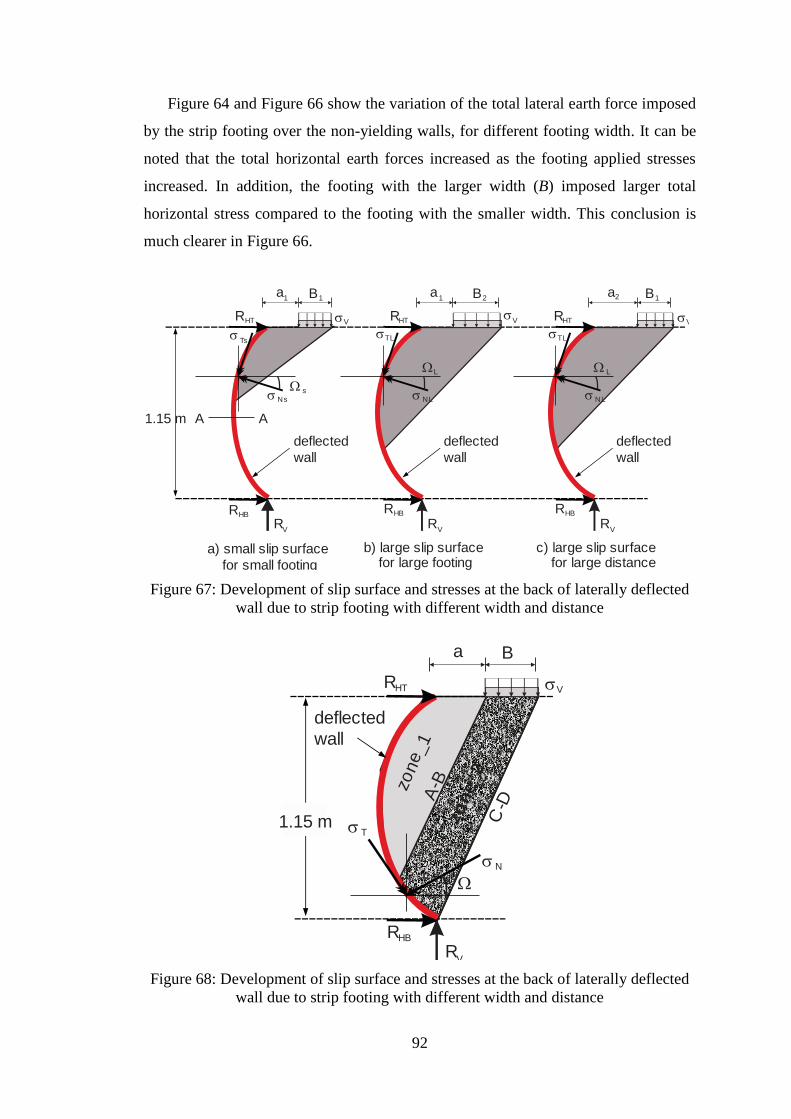
92
Figure 64 and Figure 66 show the variation of the total lateral earth force imposed
by the strip footing over the non-yielding walls, for different footing width. It can be
noted that the total horizontal earth forces increased as the footing applied stresses
increased. In addition, the footing with the larger width (B) imposed larger total
horizontal stress compared to the footing with the smaller width. This conclusion is
much clearer in Figure 66.
Figure 67: Development of slip surface and stresses at the back of laterally deflected
wall due to strip footing with different width and distance
Figure 68: Development of slip surface and stresses at the back of laterally deflected
wall due to strip footing with different width and distance
Ns
Ts
1.15 m
deflected
wall
a) small slip surface
for small footing
W s
RV
V
NL
b) large slip surface for large footing
WL
RV
V
A A
TL
B1 B2
NL
c) large slip surface for large distance
W L
RV
V
TL
B1
deflected
wall
deflected
wall
RHBRHB RHB
a2a1
a1
RHTRHTRHT
deflected
wall
N
W
RV
V
T
B
RHB
a
RHT
zone_1
zone_2
1.15 m
A-B
C-D
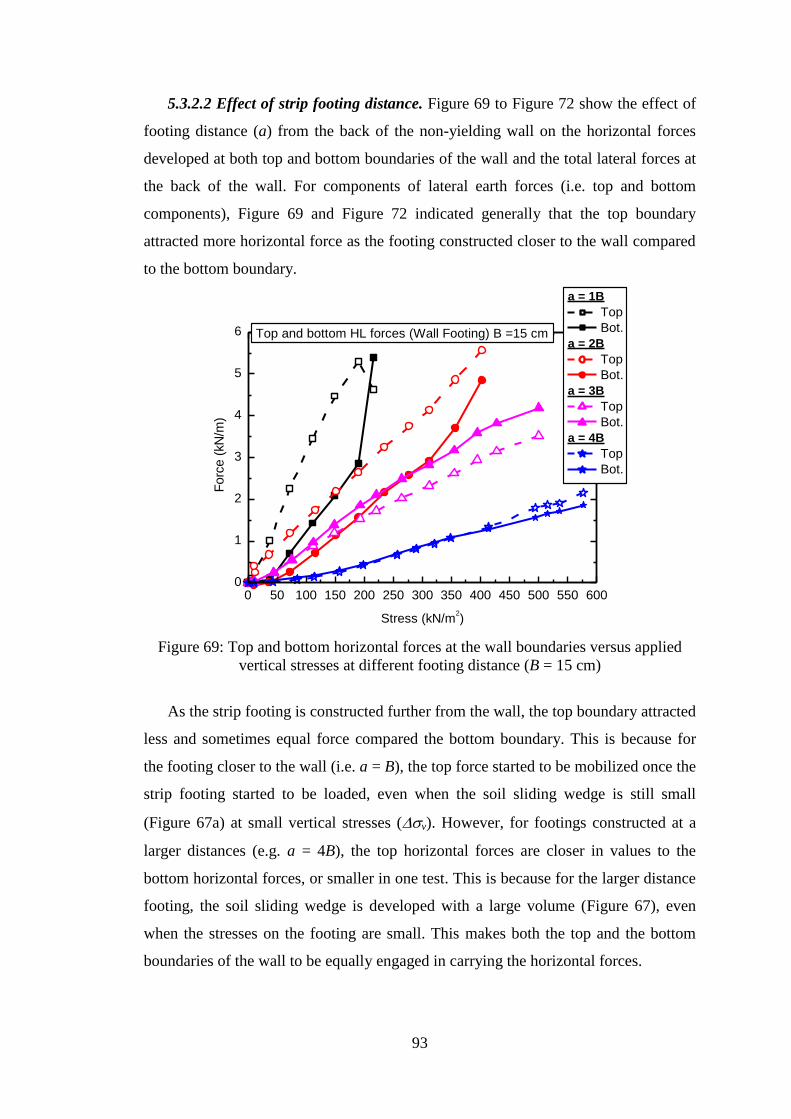
93
5.3.2.2 Effect of strip footing distance. Figure 69 to Figure 72 show the effect of
footing distance (a) from the back of the non-yielding wall on the horizontal forces
developed at both top and bottom boundaries of the wall and the total lateral forces at
the back of the wall. For components of lateral earth forces (i.e. top and bottom
components), Figure 69 and Figure 72 indicated generally that the top boundary
attracted more horizontal force as the footing constructed closer to the wall compared
to the bottom boundary.
0 50 100 150 200 250 300 350 400 450 500 550 6000
1
2
3
4
5
6
a = 1B
Top
Bot.
a = 2B
Top
Bot.
a = 3B
Top
Bot.
a = 4B
Top
Bot.
Top and bottom HL forces (Wall Footing) B =15 cm
Forc
e (
kN
/m)
Stress (kN/m2)
Figure 69: Top and bottom horizontal forces at the wall boundaries versus applied
vertical stresses at different footing distance (B = 15 cm)
As the strip footing is constructed further from the wall, the top boundary attracted
less and sometimes equal force compared the bottom boundary. This is because for
the footing closer to the wall (i.e. a = B), the top force started to be mobilized once the
strip footing started to be loaded, even when the soil sliding wedge is still small
(Figure 67a) at small vertical stresses (v). However, for footings constructed at a
larger distances (e.g. a = 4B), the top horizontal forces are closer in values to the
bottom horizontal forces, or smaller in one test. This is because for the larger distance
footing, the soil sliding wedge is developed with a large volume (Figure 67), even
when the stresses on the footing are small. This makes both the top and the bottom
boundaries of the wall to be equally engaged in carrying the horizontal forces.
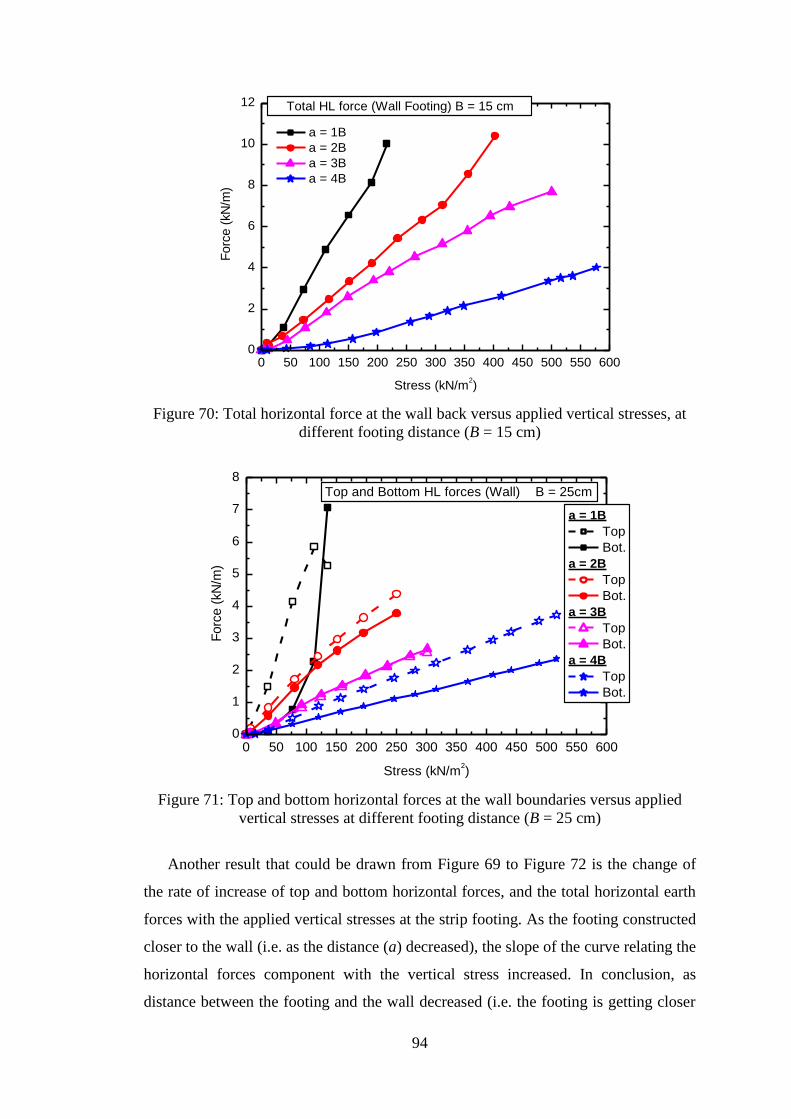
94
0 50 100 150 200 250 300 350 400 450 500 550 6000
2
4
6
8
10
12
a = 1B
a = 2B
a = 3B
a = 4B
Total HL force (Wall Footing) B = 15 cm
Forc
e (
kN
/m)
Stress (kN/m2)
Figure 70: Total horizontal force at the wall back versus applied vertical stresses, at
different footing distance (B = 15 cm)
0 50 100 150 200 250 300 350 400 450 500 550 6000
1
2
3
4
5
6
7
8
a = 1B
Top
Bot.
a = 2B
Top
Bot.
a = 3B
Top
Bot.
a = 4B
Top
Bot.
Top and Bottom HL forces (Wall) B = 25cm
Forc
e (
kN
/m)
Stress (kN/m2)
Figure 71: Top and bottom horizontal forces at the wall boundaries versus applied
vertical stresses at different footing distance (B = 25 cm)
Another result that could be drawn from Figure 69 to Figure 72 is the change of
the rate of increase of top and bottom horizontal forces, and the total horizontal earth
forces with the applied vertical stresses at the strip footing. As the footing constructed
closer to the wall (i.e. as the distance (a) decreased), the slope of the curve relating the
horizontal forces component with the vertical stress increased. In conclusion, as
distance between the footing and the wall decreased (i.e. the footing is getting closer
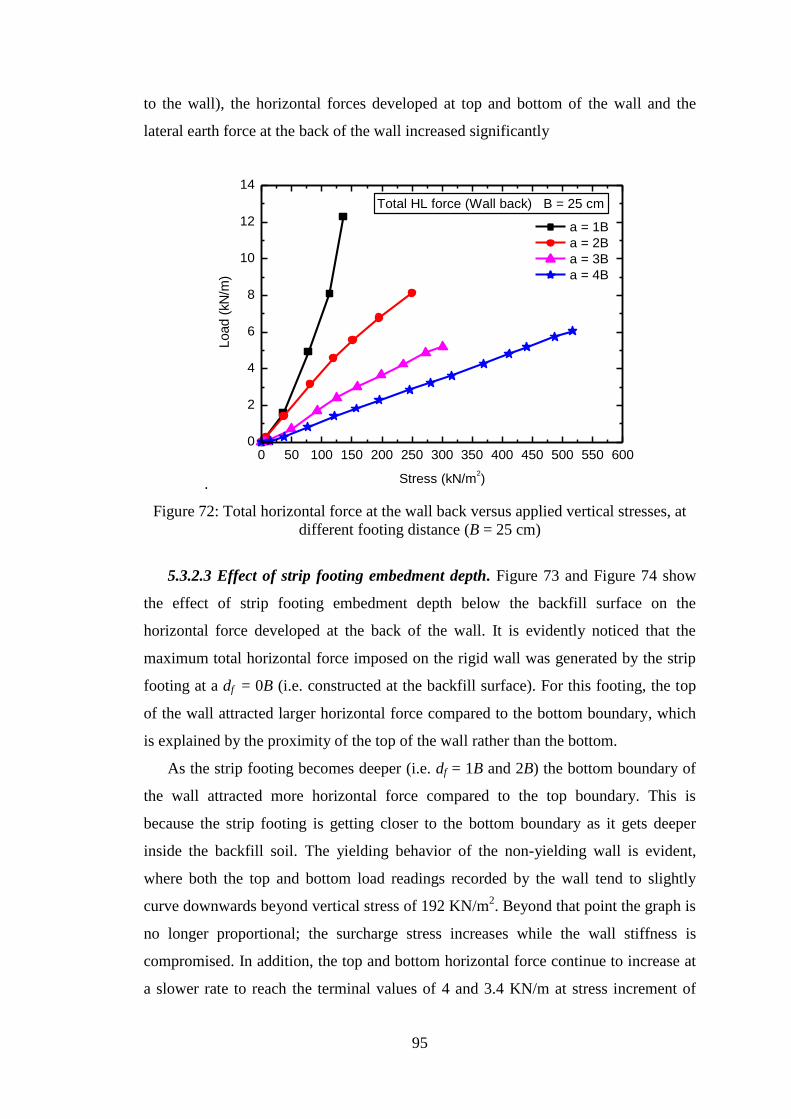
95
to the wall), the horizontal forces developed at top and bottom of the wall and the
lateral earth force at the back of the wall increased significantly
.
0 50 100 150 200 250 300 350 400 450 500 550 6000
2
4
6
8
10
12
14
a = 1B
a = 2B
a = 3B
a = 4B
Total HL force (Wall back) B = 25 cm
Load (
kN
/m)
Stress (kN/m2)
Figure 72: Total horizontal force at the wall back versus applied vertical stresses, at
different footing distance (B = 25 cm)
5.3.2.3 Effect of strip footing embedment depth. Figure 73 and Figure 74 show
the effect of strip footing embedment depth below the backfill surface on the
horizontal force developed at the back of the wall. It is evidently noticed that the
maximum total horizontal force imposed on the rigid wall was generated by the strip
footing at a df = 0B (i.e. constructed at the backfill surface). For this footing, the top
of the wall attracted larger horizontal force compared to the bottom boundary, which
is explained by the proximity of the top of the wall rather than the bottom.
As the strip footing becomes deeper (i.e. df = 1B and 2B) the bottom boundary of
the wall attracted more horizontal force compared to the top boundary. This is
because the strip footing is getting closer to the bottom boundary as it gets deeper
inside the backfill soil. The yielding behavior of the non-yielding wall is evident,
where both the top and bottom load readings recorded by the wall tend to slightly
curve downwards beyond vertical stress of 192 KN/m2. Beyond that point the graph is
no longer proportional; the surcharge stress increases while the wall stiffness is
compromised. In addition, the top and bottom horizontal force continue to increase at
a slower rate to reach the terminal values of 4 and 3.4 KN/m at stress increment of
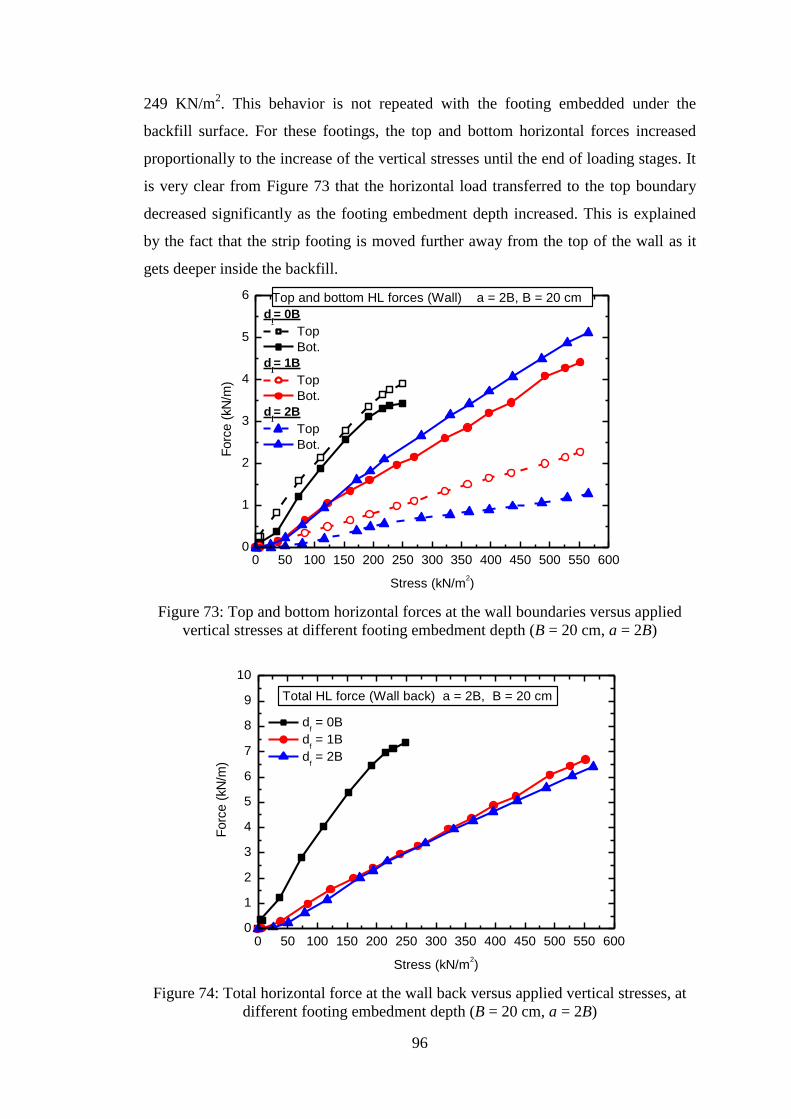
96
249 KN/m2. This behavior is not repeated with the footing embedded under the
backfill surface. For these footings, the top and bottom horizontal forces increased
proportionally to the increase of the vertical stresses until the end of loading stages. It
is very clear from Figure 73 that the horizontal load transferred to the top boundary
decreased significantly as the footing embedment depth increased. This is explained
by the fact that the strip footing is moved further away from the top of the wall as it
gets deeper inside the backfill.
0 50 100 150 200 250 300 350 400 450 500 550 6000
1
2
3
4
5
6
df= 0B
Top
Bot.
df= 1B
Top
Bot.
df= 2B
Top
Bot.
Top and bottom HL forces (Wall) a = 2B, B = 20 cm
Forc
e (
kN
/m)
Stress (kN/m2)
Figure 73: Top and bottom horizontal forces at the wall boundaries versus applied
vertical stresses at different footing embedment depth (B = 20 cm, a = 2B)
0 50 100 150 200 250 300 350 400 450 500 550 6000
1
2
3
4
5
6
7
8
9
10
df = 0B
df = 1B
df = 2B
Total HL force (Wall back) a = 2B, B = 20 cm
Forc
e (
kN
/m)
Stress (kN/m2)
Figure 74: Total horizontal force at the wall back versus applied vertical stresses, at
different footing embedment depth (B = 20 cm, a = 2B)
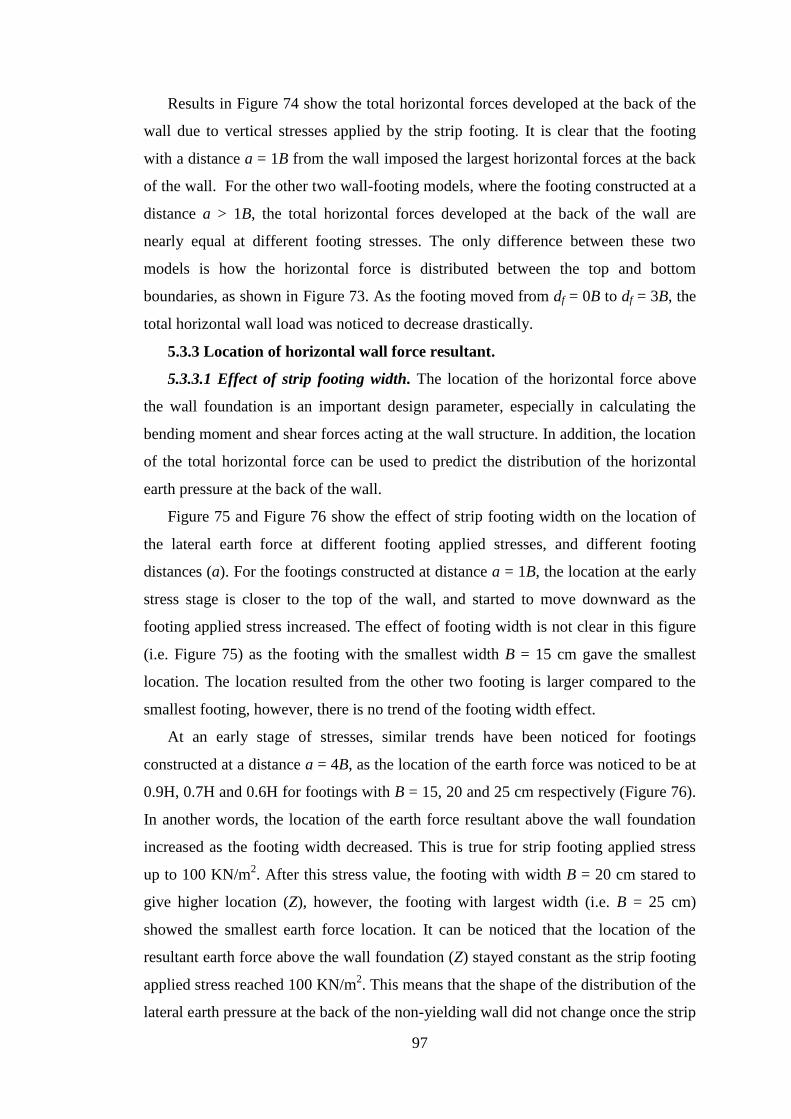
97
Results in Figure 74 show the total horizontal forces developed at the back of the
wall due to vertical stresses applied by the strip footing. It is clear that the footing
with a distance a = 1B from the wall imposed the largest horizontal forces at the back
of the wall. For the other two wall-footing models, where the footing constructed at a
distance a > 1B, the total horizontal forces developed at the back of the wall are
nearly equal at different footing stresses. The only difference between these two
models is how the horizontal force is distributed between the top and bottom
boundaries, as shown in Figure 73. As the footing moved from df = 0B to df = 3B, the
total horizontal wall load was noticed to decrease drastically.
5.3.3 Location of horizontal wall force resultant.
5.3.3.1 Effect of strip footing width. The location of the horizontal force above
the wall foundation is an important design parameter, especially in calculating the
bending moment and shear forces acting at the wall structure. In addition, the location
of the total horizontal force can be used to predict the distribution of the horizontal
earth pressure at the back of the wall.
Figure 75 and Figure 76 show the effect of strip footing width on the location of
the lateral earth force at different footing applied stresses, and different footing
distances (a). For the footings constructed at distance a = 1B, the location at the early
stress stage is closer to the top of the wall, and started to move downward as the
footing applied stress increased. The effect of footing width is not clear in this figure
(i.e. Figure 75) as the footing with the smallest width B = 15 cm gave the smallest
location. The location resulted from the other two footing is larger compared to the
smallest footing, however, there is no trend of the footing width effect.
At an early stage of stresses, similar trends have been noticed for footings
constructed at a distance a = 4B, as the location of the earth force was noticed to be at
0.9H, 0.7H and 0.6H for footings with B = 15, 20 and 25 cm respectively (Figure 76).
In another words, the location of the earth force resultant above the wall foundation
increased as the footing width decreased. This is true for strip footing applied stress
up to 100 KN/m2. After this stress value, the footing with width B = 20 cm stared to
give higher location (Z), however, the footing with largest width (i.e. B = 25 cm)
showed the smallest earth force location. It can be noticed that the location of the
resultant earth force above the wall foundation (Z) stayed constant as the strip footing
applied stress reached 100 KN/m2. This means that the shape of the distribution of the
lateral earth pressure at the back of the non-yielding wall did not change once the strip
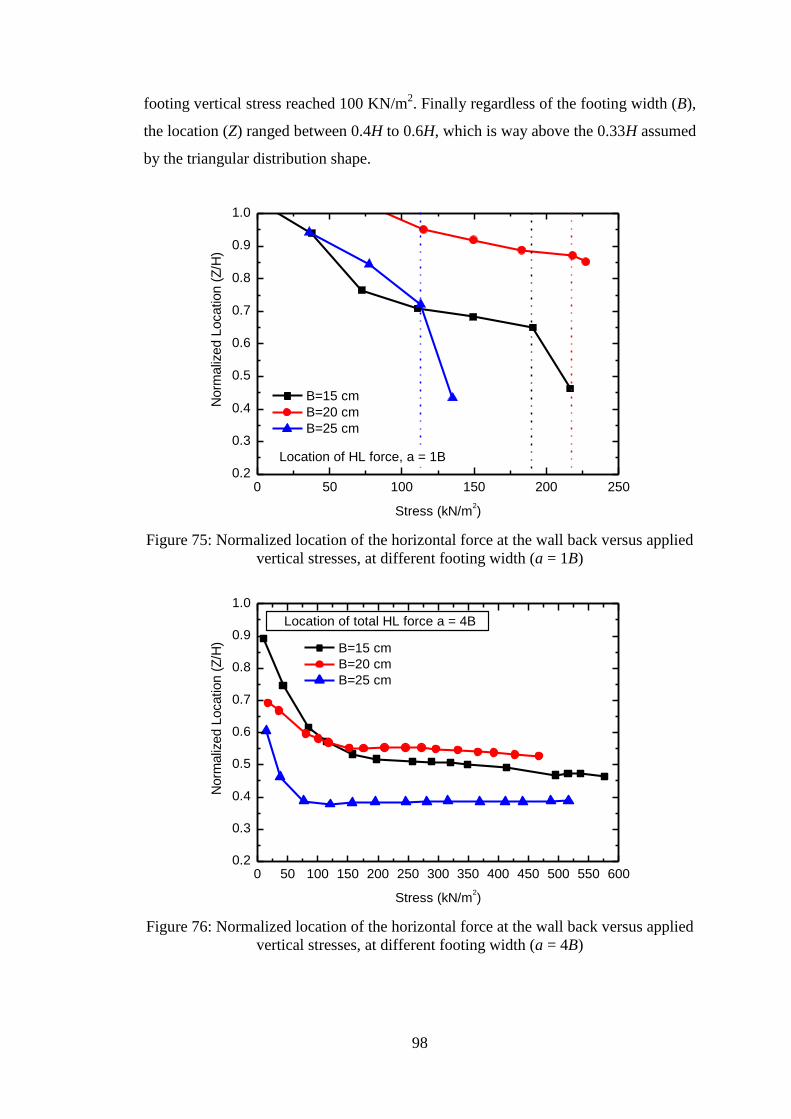
98
footing vertical stress reached 100 KN/m2. Finally regardless of the footing width (B),
the location (Z) ranged between 0.4H to 0.6H, which is way above the 0.33H assumed
by the triangular distribution shape.
0 50 100 150 200 2500.2
0.3
0.4
0.5
0.6
0.7
0.8
0.9
1.0
B=15 cm
B=20 cm
B=25 cm
Location of HL force, a = 1B
Norm
aliz
ed L
ocation (
Z/H
)
Stress (kN/m2)
Figure 75: Normalized location of the horizontal force at the wall back versus applied
vertical stresses, at different footing width (a = 1B)
0 50 100 150 200 250 300 350 400 450 500 550 6000.2
0.3
0.4
0.5
0.6
0.7
0.8
0.9
1.0
B=15 cm
B=20 cm
B=25 cm
Location of total HL force a = 4B
Norm
aliz
ed L
ocation (
Z/H
)
Stress (kN/m2)
Figure 76: Normalized location of the horizontal force at the wall back versus applied
vertical stresses, at different footing width (a = 4B)
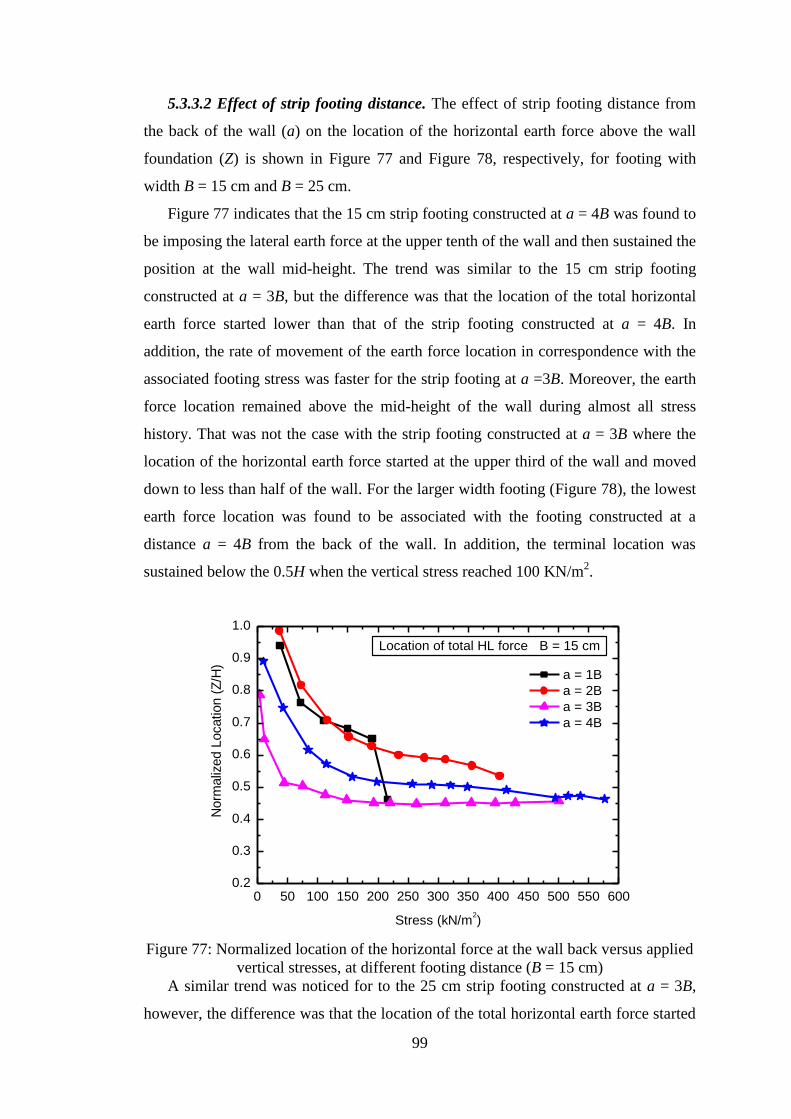
99
5.3.3.2 Effect of strip footing distance. The effect of strip footing distance from
the back of the wall (a) on the location of the horizontal earth force above the wall
foundation (Z) is shown in Figure 77 and Figure 78, respectively, for footing with
width B = 15 cm and B = 25 cm.
Figure 77 indicates that the 15 cm strip footing constructed at a = 4B was found to
be imposing the lateral earth force at the upper tenth of the wall and then sustained the
position at the wall mid-height. The trend was similar to the 15 cm strip footing
constructed at a = 3B, but the difference was that the location of the total horizontal
earth force started lower than that of the strip footing constructed at a = 4B. In
addition, the rate of movement of the earth force location in correspondence with the
associated footing stress was faster for the strip footing at a =3B. Moreover, the earth
force location remained above the mid-height of the wall during almost all stress
history. That was not the case with the strip footing constructed at a = 3B where the
location of the horizontal earth force started at the upper third of the wall and moved
down to less than half of the wall. For the larger width footing (Figure 78), the lowest
earth force location was found to be associated with the footing constructed at a
distance a = 4B from the back of the wall. In addition, the terminal location was
sustained below the 0.5H when the vertical stress reached 100 KN/m2.
0 50 100 150 200 250 300 350 400 450 500 550 6000.2
0.3
0.4
0.5
0.6
0.7
0.8
0.9
1.0
a = 1B
a = 2B
a = 3B
a = 4B
Location of total HL force B = 15 cm
Norm
aliz
ed L
ocation (
Z/H
)
Stress (kN/m2)
Figure 77: Normalized location of the horizontal force at the wall back versus applied
vertical stresses, at different footing distance (B = 15 cm)
A similar trend was noticed for to the 25 cm strip footing constructed at a = 3B,
however, the difference was that the location of the total horizontal earth force started
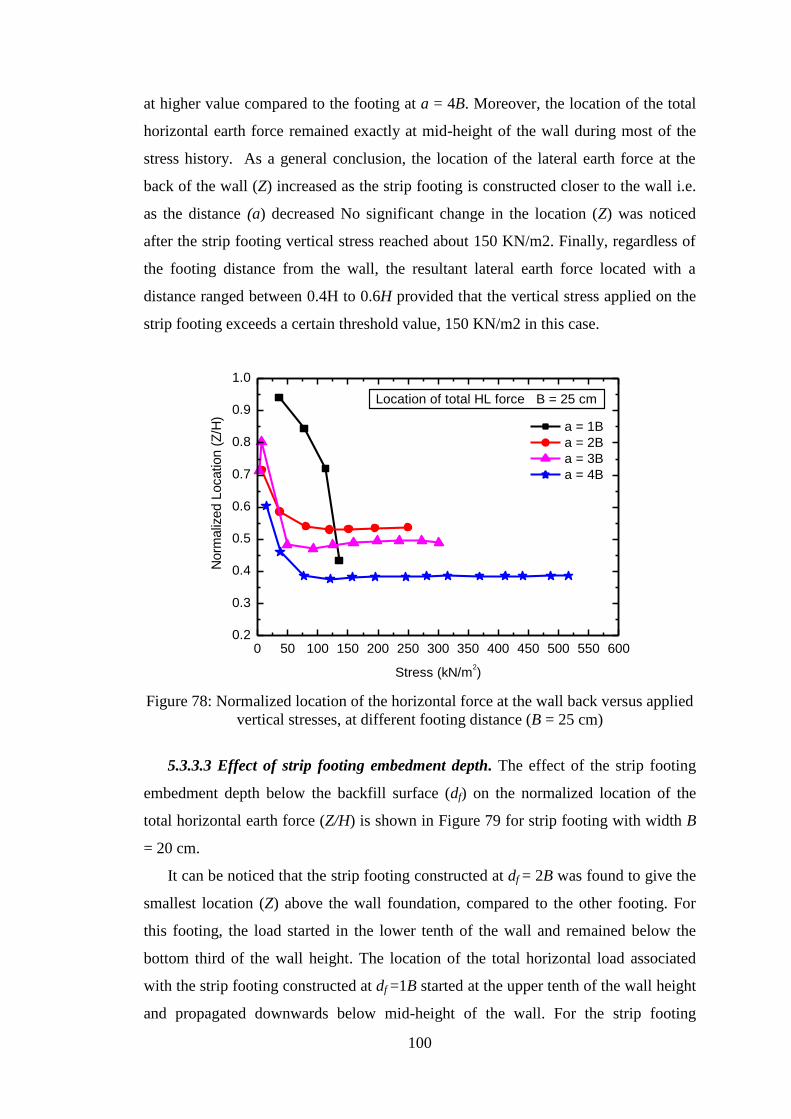
100
at higher value compared to the footing at a = 4B. Moreover, the location of the total
horizontal earth force remained exactly at mid-height of the wall during most of the
stress history. As a general conclusion, the location of the lateral earth force at the
back of the wall (Z) increased as the strip footing is constructed closer to the wall i.e.
as the distance (a) decreased No significant change in the location (Z) was noticed
after the strip footing vertical stress reached about 150 KN/m2. Finally, regardless of
the footing distance from the wall, the resultant lateral earth force located with a
distance ranged between 0.4H to 0.6H provided that the vertical stress applied on the
strip footing exceeds a certain threshold value, 150 KN/m2 in this case.
0 50 100 150 200 250 300 350 400 450 500 550 6000.2
0.3
0.4
0.5
0.6
0.7
0.8
0.9
1.0
a = 1B
a = 2B
a = 3B
a = 4B
Location of total HL force B = 25 cm
Norm
aliz
ed L
ocation (
Z/H
)
Stress (kN/m2)
Figure 78: Normalized location of the horizontal force at the wall back versus applied
vertical stresses, at different footing distance (B = 25 cm)
5.3.3.3 Effect of strip footing embedment depth. The effect of the strip footing
embedment depth below the backfill surface (df) on the normalized location of the
total horizontal earth force (Z/H) is shown in Figure 79 for strip footing with width B
= 20 cm.
It can be noticed that the strip footing constructed at df = 2B was found to give the
smallest location (Z) above the wall foundation, compared to the other footing. For
this footing, the load started in the lower tenth of the wall and remained below the
bottom third of the wall height. The location of the total horizontal load associated
with the strip footing constructed at df =1B started at the upper tenth of the wall height
and propagated downwards below mid-height of the wall. For the strip footing
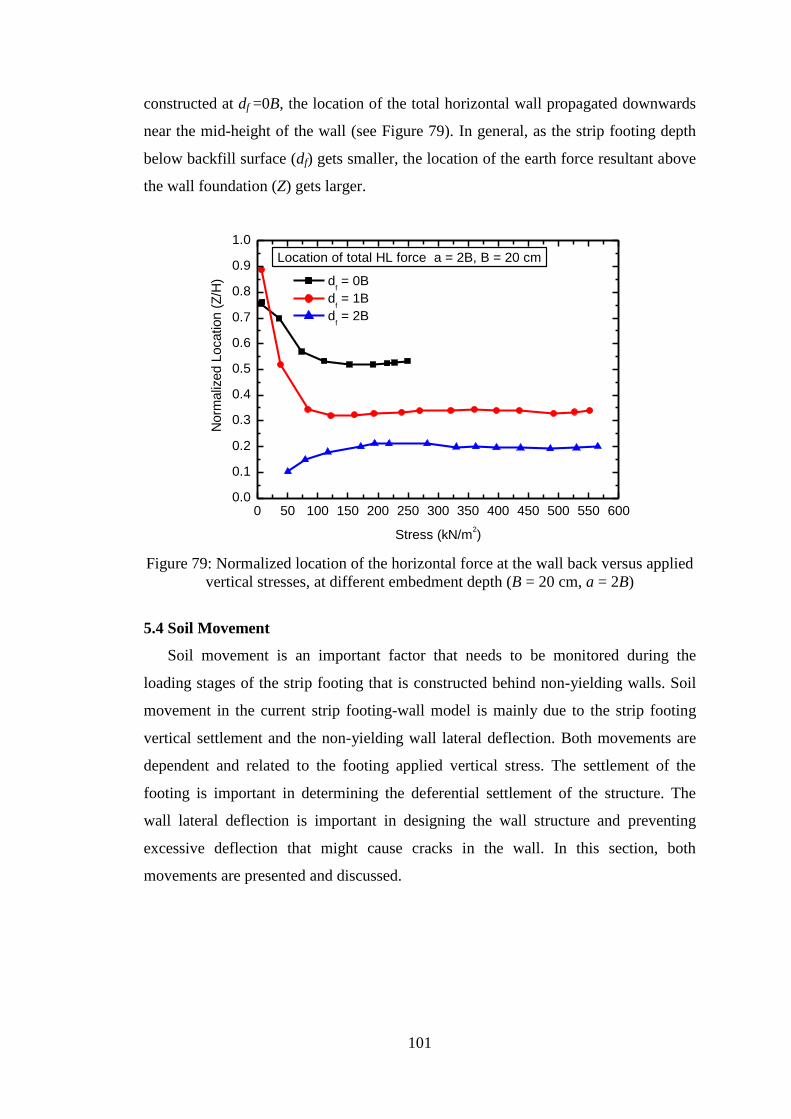
101
constructed at df =0B, the location of the total horizontal wall propagated downwards
near the mid-height of the wall (see Figure 79). In general, as the strip footing depth
below backfill surface (df) gets smaller, the location of the earth force resultant above
the wall foundation (Z) gets larger.
0 50 100 150 200 250 300 350 400 450 500 550 6000.0
0.1
0.2
0.3
0.4
0.5
0.6
0.7
0.8
0.9
1.0
df = 0B
df = 1B
df = 2B
Location of total HL force a = 2B, B = 20 cm
N
orm
aliz
ed L
ocation (
Z/H
)
Stress (kN/m2)
Figure 79: Normalized location of the horizontal force at the wall back versus applied
vertical stresses, at different embedment depth (B = 20 cm, a = 2B)
5.4 Soil Movement
Soil movement is an important factor that needs to be monitored during the
loading stages of the strip footing that is constructed behind non-yielding walls. Soil
movement in the current strip footing-wall model is mainly due to the strip footing
vertical settlement and the non-yielding wall lateral deflection. Both movements are
dependent and related to the footing applied vertical stress. The settlement of the
footing is important in determining the deferential settlement of the structure. The
wall lateral deflection is important in designing the wall structure and preventing
excessive deflection that might cause cracks in the wall. In this section, both
movements are presented and discussed.
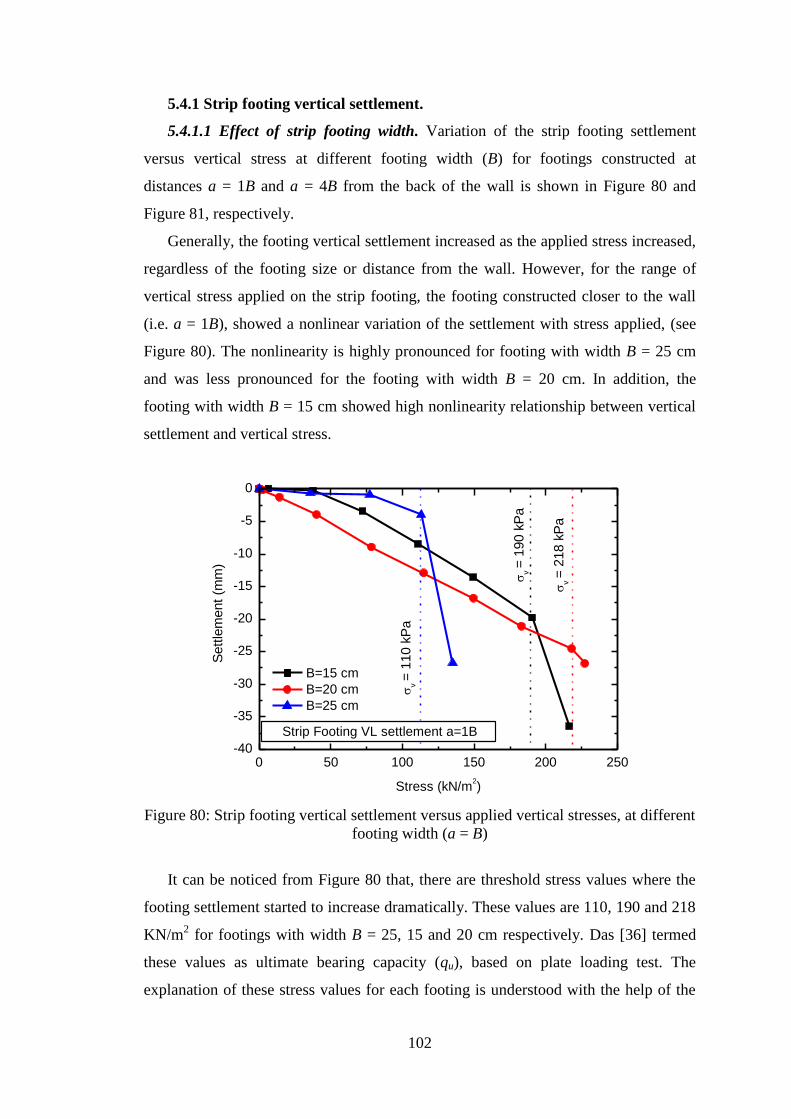
102
5.4.1 Strip footing vertical settlement.
5.4.1.1 Effect of strip footing width. Variation of the strip footing settlement
versus vertical stress at different footing width (B) for footings constructed at
distances a = 1B and a = 4B from the back of the wall is shown in Figure 80 and
Figure 81, respectively.
Generally, the footing vertical settlement increased as the applied stress increased,
regardless of the footing size or distance from the wall. However, for the range of
vertical stress applied on the strip footing, the footing constructed closer to the wall
(i.e. a = 1B), showed a nonlinear variation of the settlement with stress applied, (see
Figure 80). The nonlinearity is highly pronounced for footing with width B = 25 cm
and was less pronounced for the footing with width B = 20 cm. In addition, the
footing with width B = 15 cm showed high nonlinearity relationship between vertical
settlement and vertical stress.
0 50 100 150 200 250-40
-35
-30
-25
-20
-15
-10
-5
0
v =
218 k
Pa
v =
190 k
Pa
v =
110 k
Pa
B=15 cm
B=20 cm
B=25 cm
Strip Footing VL settlement a=1B
Sett
lem
ent
(mm
)
Stress (kN/m2)
Figure 80: Strip footing vertical settlement versus applied vertical stresses, at different
footing width (a = B)
It can be noticed from Figure 80 that, there are threshold stress values where the
footing settlement started to increase dramatically. These values are 110, 190 and 218
KN/m2 for footings with width B = 25, 15 and 20 cm respectively. Das [36] termed
these values as ultimate bearing capacity (qu), based on plate loading test. The
explanation of these stress values for each footing is understood with the help of the
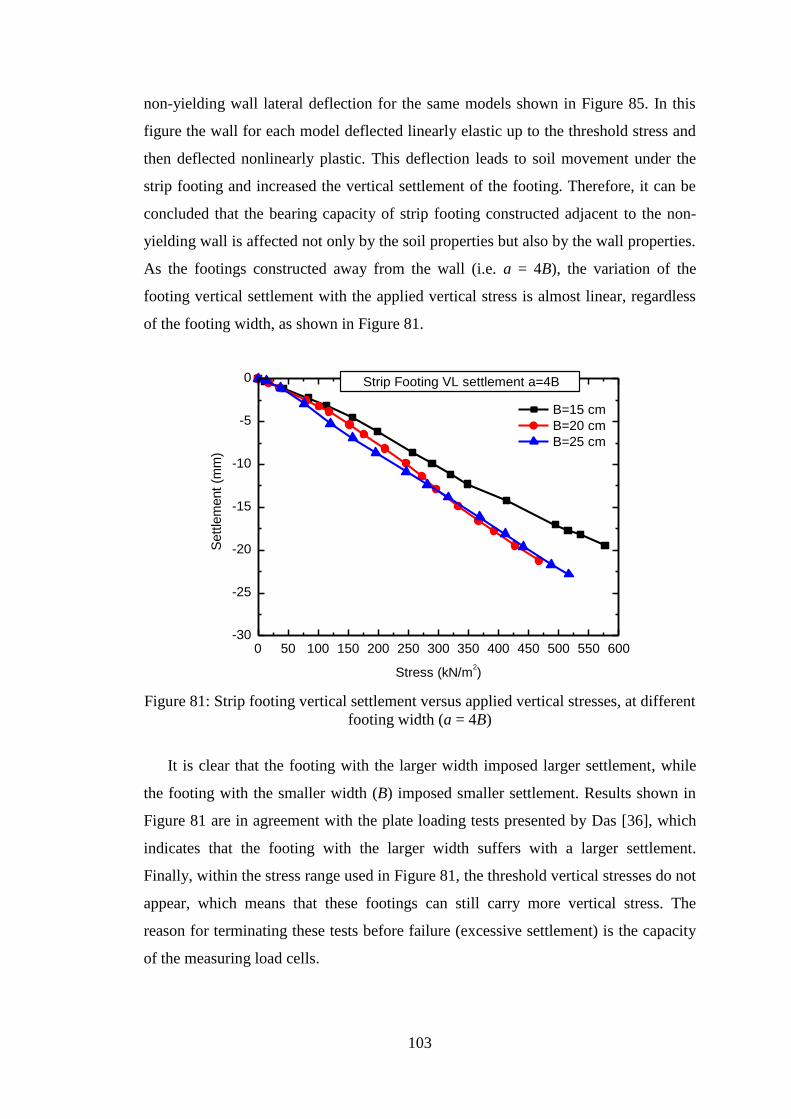
103
non-yielding wall lateral deflection for the same models shown in Figure 85. In this
figure the wall for each model deflected linearly elastic up to the threshold stress and
then deflected nonlinearly plastic. This deflection leads to soil movement under the
strip footing and increased the vertical settlement of the footing. Therefore, it can be
concluded that the bearing capacity of strip footing constructed adjacent to the non-
yielding wall is affected not only by the soil properties but also by the wall properties.
As the footings constructed away from the wall (i.e. a = 4B), the variation of the
footing vertical settlement with the applied vertical stress is almost linear, regardless
of the footing width, as shown in Figure 81.
0 50 100 150 200 250 300 350 400 450 500 550 600-30
-25
-20
-15
-10
-5
0
B=15 cm
B=20 cm
B=25 cm
Strip Footing VL settlement a=4B
Sett
lem
ent
(mm
)
Stress (kN/m2)
Figure 81: Strip footing vertical settlement versus applied vertical stresses, at different
footing width (a = 4B)
It is clear that the footing with the larger width imposed larger settlement, while
the footing with the smaller width (B) imposed smaller settlement. Results shown in
Figure 81 are in agreement with the plate loading tests presented by Das [36], which
indicates that the footing with the larger width suffers with a larger settlement.
Finally, within the stress range used in Figure 81, the threshold vertical stresses do not
appear, which means that these footings can still carry more vertical stress. The
reason for terminating these tests before failure (excessive settlement) is the capacity
of the measuring load cells.
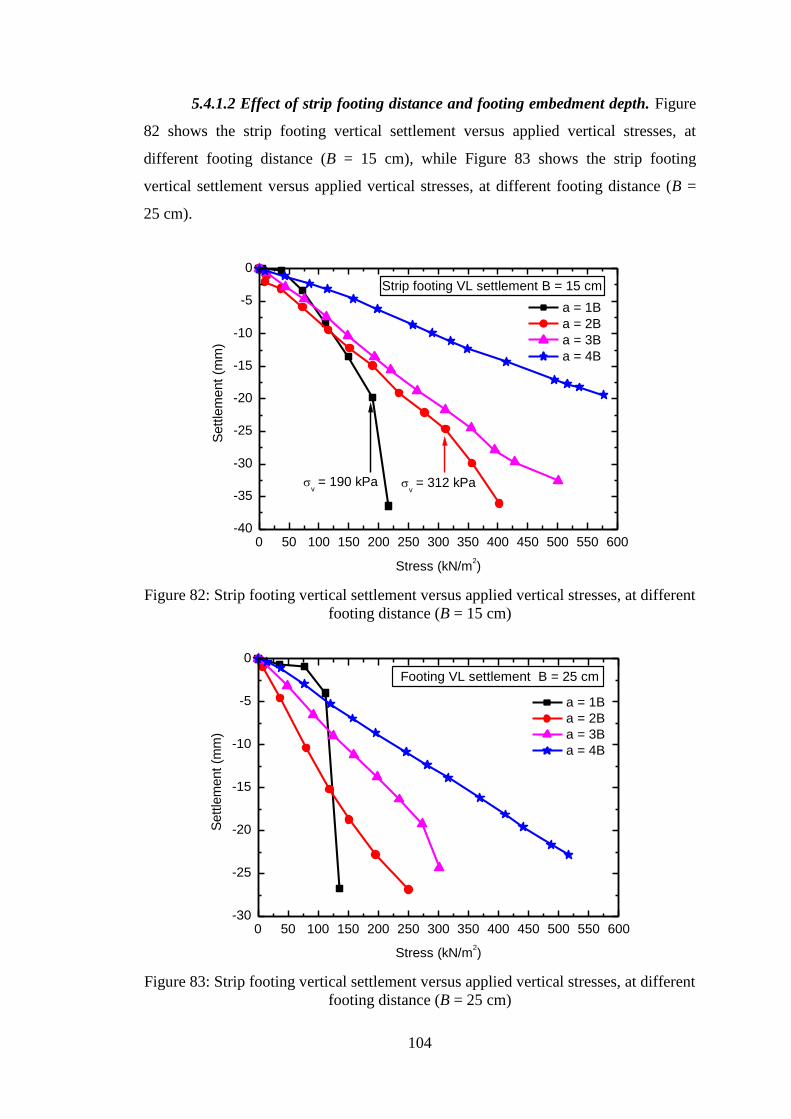
104
5.4.1.2 Effect of strip footing distance and footing embedment depth. Figure
82 shows the strip footing vertical settlement versus applied vertical stresses, at
different footing distance (B = 15 cm), while Figure 83 shows the strip footing
vertical settlement versus applied vertical stresses, at different footing distance (B =
25 cm).
0 50 100 150 200 250 300 350 400 450 500 550 600-40
-35
-30
-25
-20
-15
-10
-5
0
v = 312 kPa
v = 190 kPa
a = 1B
a = 2B
a = 3B
a = 4B
Strip footing VL settlement B = 15 cm
Sett
lem
ent
(mm
)
Stress (kN/m2)
Figure 82: Strip footing vertical settlement versus applied vertical stresses, at different
footing distance (B = 15 cm)
0 50 100 150 200 250 300 350 400 450 500 550 600-30
-25
-20
-15
-10
-5
0
a = 1B
a = 2B
a = 3B
a = 4B
Footing VL settlement B = 25 cm
Sett
lem
ent
(mm
)
Stress (kN/m2)
Figure 83: Strip footing vertical settlement versus applied vertical stresses, at different
footing distance (B = 25 cm)
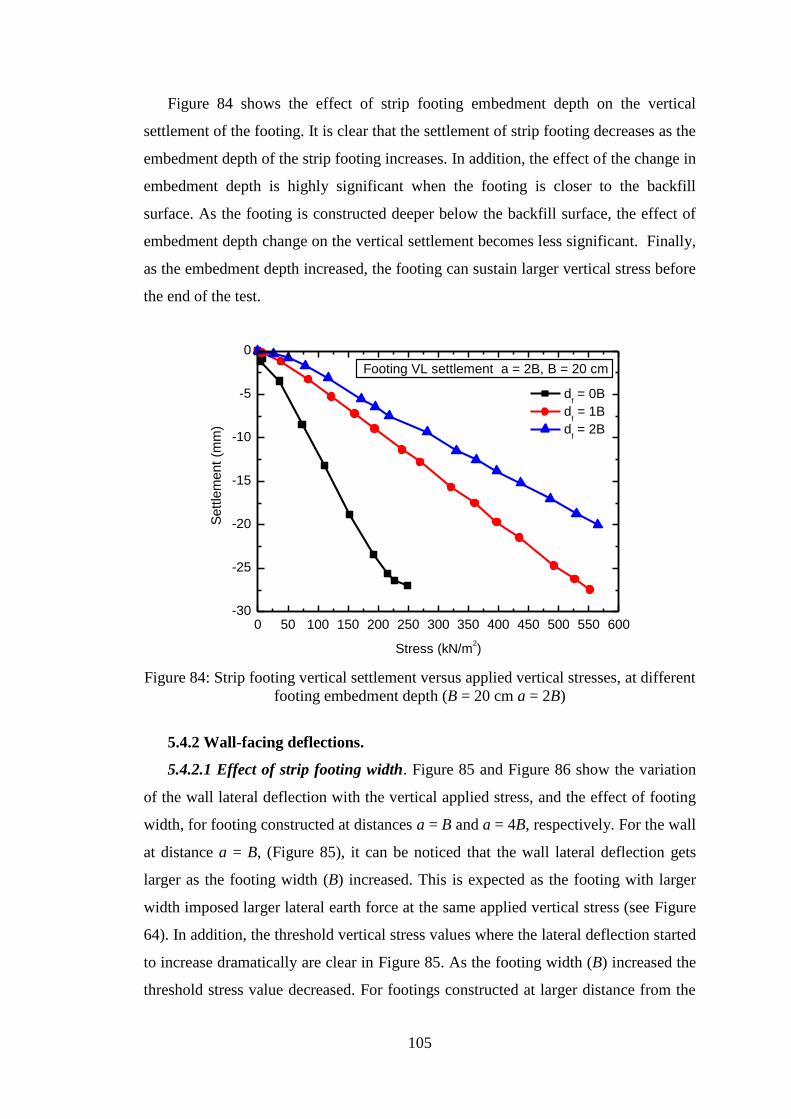
105
Figure 84 shows the effect of strip footing embedment depth on the vertical
settlement of the footing. It is clear that the settlement of strip footing decreases as the
embedment depth of the strip footing increases. In addition, the effect of the change in
embedment depth is highly significant when the footing is closer to the backfill
surface. As the footing is constructed deeper below the backfill surface, the effect of
embedment depth change on the vertical settlement becomes less significant. Finally,
as the embedment depth increased, the footing can sustain larger vertical stress before
the end of the test.
0 50 100 150 200 250 300 350 400 450 500 550 600-30
-25
-20
-15
-10
-5
0
df = 0B
df = 1B
df = 2B
Footing VL settlement a = 2B, B = 20 cm
Sett
lem
ent
(mm
)
Stress (kN/m2)
Figure 84: Strip footing vertical settlement versus applied vertical stresses, at different
footing embedment depth (B = 20 cm a = 2B)
5.4.2 Wall-facing deflections.
5.4.2.1 Effect of strip footing width. Figure 85 and Figure 86 show the variation
of the wall lateral deflection with the vertical applied stress, and the effect of footing
width, for footing constructed at distances a = B and a = 4B, respectively. For the wall
at distance a = B, (Figure 85), it can be noticed that the wall lateral deflection gets
larger as the footing width (B) increased. This is expected as the footing with larger
width imposed larger lateral earth force at the same applied vertical stress (see Figure
64). In addition, the threshold vertical stress values where the lateral deflection started
to increase dramatically are clear in Figure 85. As the footing width (B) increased the
threshold stress value decreased. For footings constructed at larger distance from the
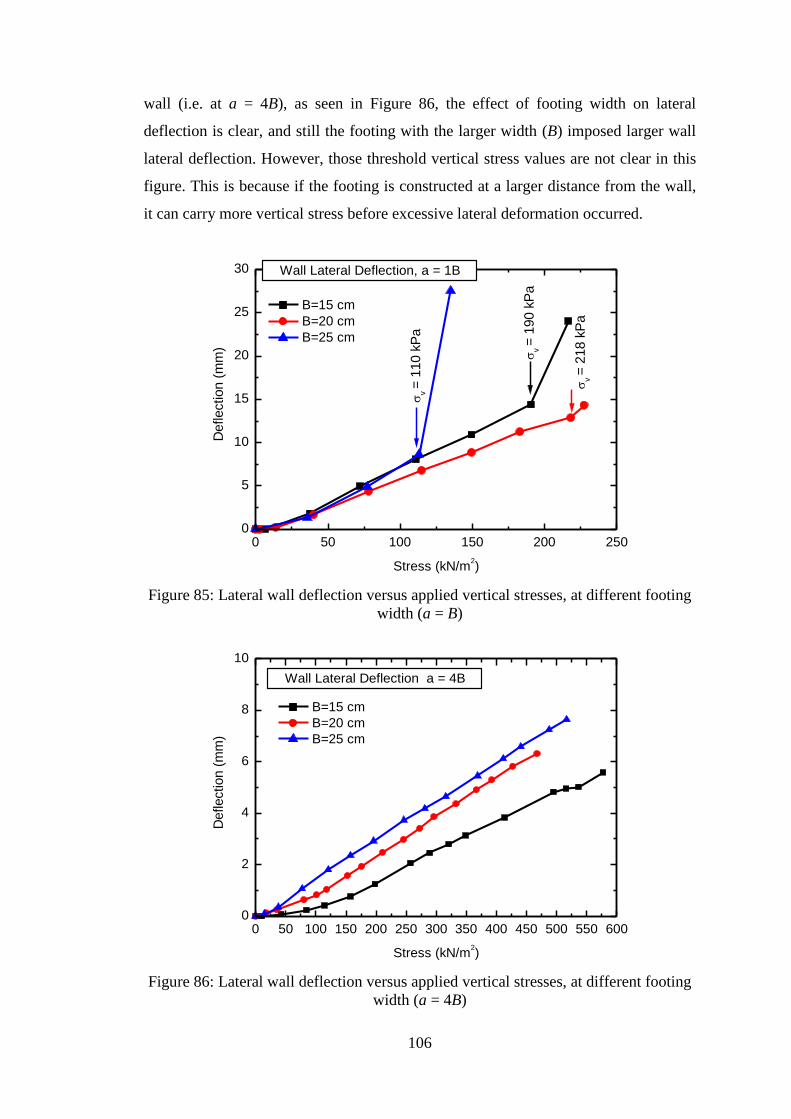
106
wall (i.e. at a = 4B), as seen in Figure 86, the effect of footing width on lateral
deflection is clear, and still the footing with the larger width (B) imposed larger wall
lateral deflection. However, those threshold vertical stress values are not clear in this
figure. This is because if the footing is constructed at a larger distance from the wall,
it can carry more vertical stress before excessive lateral deformation occurred.
0 50 100 150 200 2500
5
10
15
20
25
30
v =
218 k
Pa
v =
190 k
Pa
v =
110 k
Pa
B=15 cm
B=20 cm
B=25 cm
Wall Lateral Deflection, a = 1B
Deflection (
mm
)
Stress (kN/m2)
Figure 85: Lateral wall deflection versus applied vertical stresses, at different footing
width (a = B)
0 50 100 150 200 250 300 350 400 450 500 550 6000
2
4
6
8
10
B=15 cm
B=20 cm
B=25 cm
Wall Lateral Deflection a = 4B
Deflection (
mm
)
Stress (kN/m2)
Figure 86: Lateral wall deflection versus applied vertical stresses, at different footing
width (a = 4B)
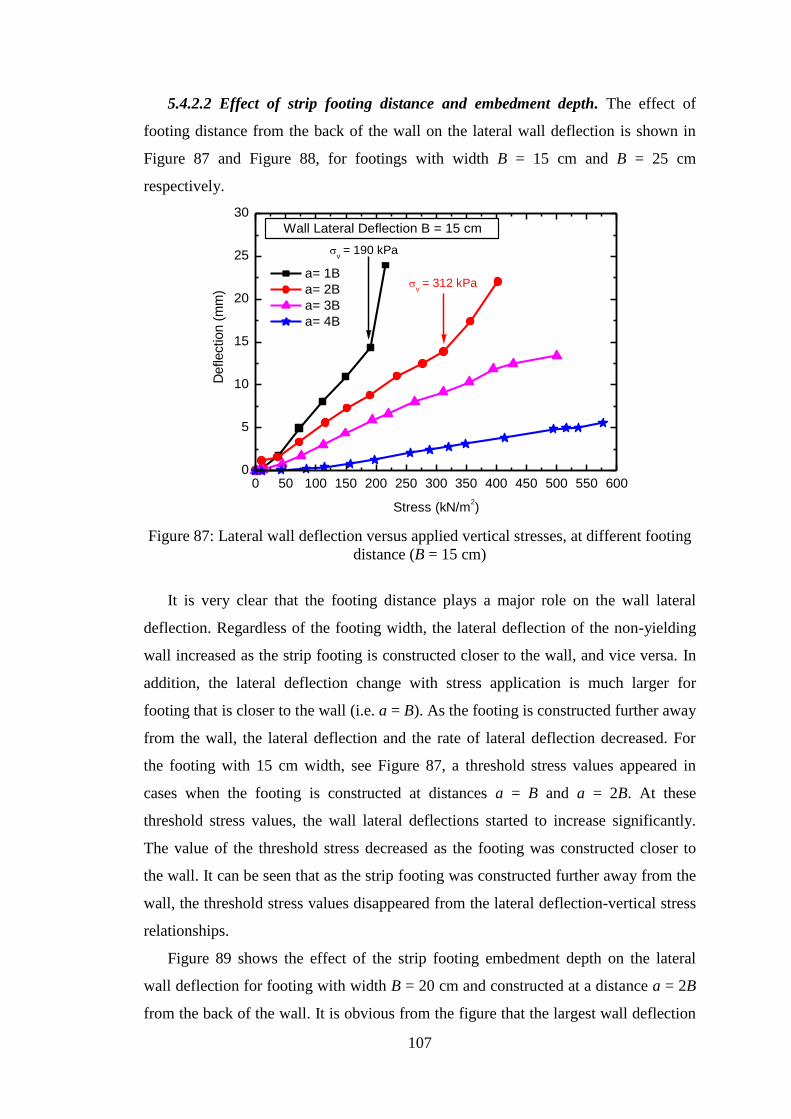
107
5.4.2.2 Effect of strip footing distance and embedment depth. The effect of
footing distance from the back of the wall on the lateral wall deflection is shown in
Figure 87 and Figure 88, for footings with width B = 15 cm and B = 25 cm
respectively.
0 50 100 150 200 250 300 350 400 450 500 550 6000
5
10
15
20
25
30
v = 312 kPa
v = 190 kPa
a= 1B
a= 2B
a= 3B
a= 4B
Wall Lateral Deflection B = 15 cm
Deflection (
mm
)
Stress (kN/m2)
Figure 87: Lateral wall deflection versus applied vertical stresses, at different footing
distance (B = 15 cm)
It is very clear that the footing distance plays a major role on the wall lateral
deflection. Regardless of the footing width, the lateral deflection of the non-yielding
wall increased as the strip footing is constructed closer to the wall, and vice versa. In
addition, the lateral deflection change with stress application is much larger for
footing that is closer to the wall (i.e. a = B). As the footing is constructed further away
from the wall, the lateral deflection and the rate of lateral deflection decreased. For
the footing with 15 cm width, see Figure 87, a threshold stress values appeared in
cases when the footing is constructed at distances a = B and a = 2B. At these
threshold stress values, the wall lateral deflections started to increase significantly.
The value of the threshold stress decreased as the footing was constructed closer to
the wall. It can be seen that as the strip footing was constructed further away from the
wall, the threshold stress values disappeared from the lateral deflection-vertical stress
relationships.
Figure 89 shows the effect of the strip footing embedment depth on the lateral
wall deflection for footing with width B = 20 cm and constructed at a distance a = 2B
from the back of the wall. It is obvious from the figure that the largest wall deflection
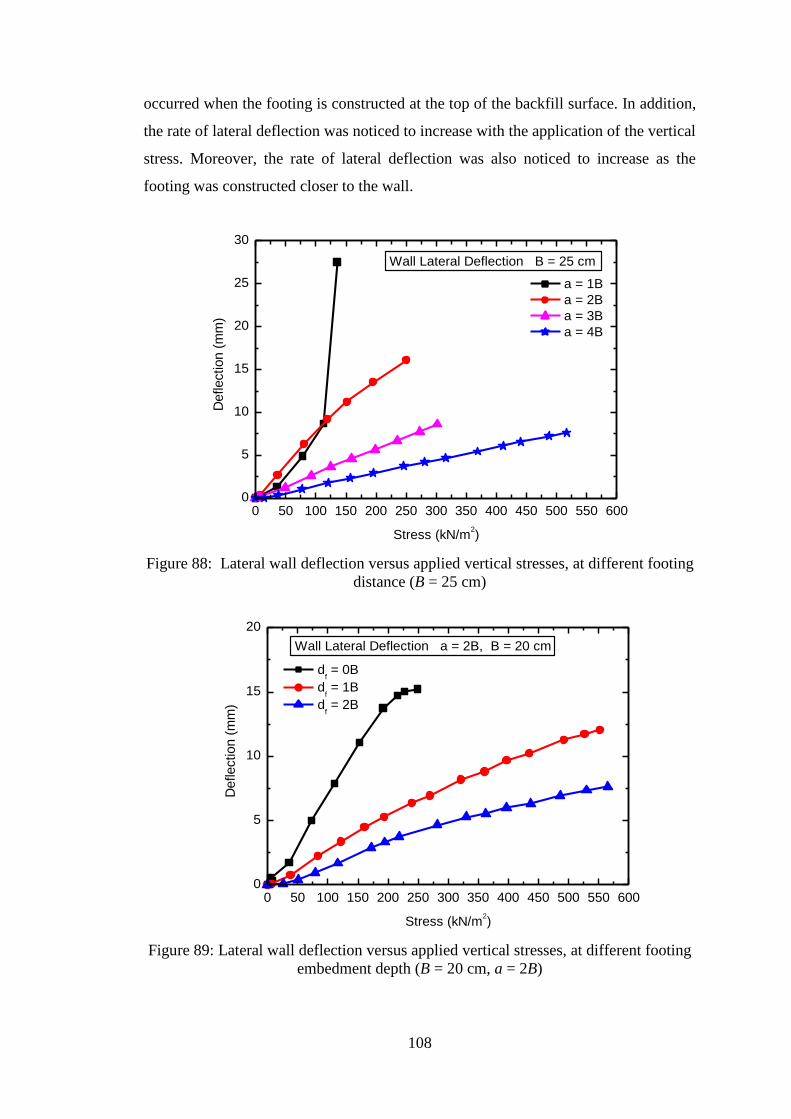
108
occurred when the footing is constructed at the top of the backfill surface. In addition,
the rate of lateral deflection was noticed to increase with the application of the vertical
stress. Moreover, the rate of lateral deflection was also noticed to increase as the
footing was constructed closer to the wall.
0 50 100 150 200 250 300 350 400 450 500 550 6000
5
10
15
20
25
30
a = 1B
a = 2B
a = 3B
a = 4B
Wall Lateral Deflection B = 25 cm
D
eflection (
mm
)
Stress (kN/m2)
Figure 88: Lateral wall deflection versus applied vertical stresses, at different footing
distance (B = 25 cm)
0 50 100 150 200 250 300 350 400 450 500 550 6000
5
10
15
20
df = 0B
df = 1B
df = 2B
Wall Lateral Deflection a = 2B, B = 20 cm
Deflection (
mm
)
Stress (kN/m2)
Figure 89: Lateral wall deflection versus applied vertical stresses, at different footing
embedment depth (B = 20 cm, a = 2B)
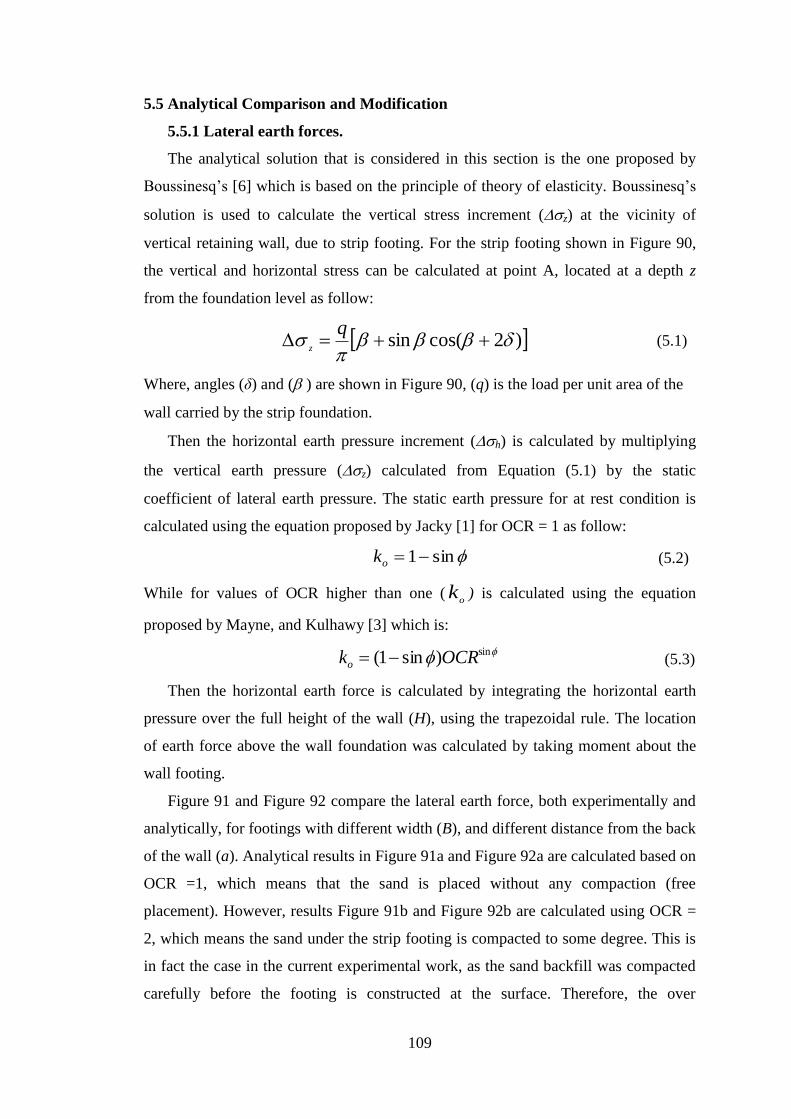
109
5.5 Analytical Comparison and Modification
5.5.1 Lateral earth forces.
The analytical solution that is considered in this section is the one proposed by
Boussinesq’s [6] which is based on the principle of theory of elasticity. Boussinesq’s
solution is used to calculate the vertical stress increment (z) at the vicinity of
vertical retaining wall, due to strip footing. For the strip footing shown in Figure 90,
the vertical and horizontal stress can be calculated at point A, located at a depth z
from the foundation level as follow:
)2cos(sin
qz
(5.1)
Where, angles (δ) and ( ) are shown in Figure 90, (q) is the load per unit area of the
wall carried by the strip foundation.
Then the horizontal earth pressure increment (h) is calculated by multiplying
the vertical earth pressure (z) calculated from Equation (5.1) by the static
coefficient of lateral earth pressure. The static earth pressure for at rest condition is
calculated using the equation proposed by Jacky [1] for OCR = 1 as follow:
sin1ok (5.2)
While for values of OCR higher than one (o
k ) is calculated using the equation
proposed by Mayne, and Kulhawy [3] which is:
sin)sin1( OCRko (5.3)
Then the horizontal earth force is calculated by integrating the horizontal earth
pressure over the full height of the wall (H), using the trapezoidal rule. The location
of earth force above the wall foundation was calculated by taking moment about the
wall footing.
Figure 91 and Figure 92 compare the lateral earth force, both experimentally and
analytically, for footings with different width (B), and different distance from the back
of the wall (a). Analytical results in Figure 91a and Figure 92a are calculated based on
OCR =1, which means that the sand is placed without any compaction (free
placement). However, results Figure 91b and Figure 92b are calculated using OCR =
2, which means the sand under the strip footing is compacted to some degree. This is
in fact the case in the current experimental work, as the sand backfill was compacted
carefully before the footing is constructed at the surface. Therefore, the over
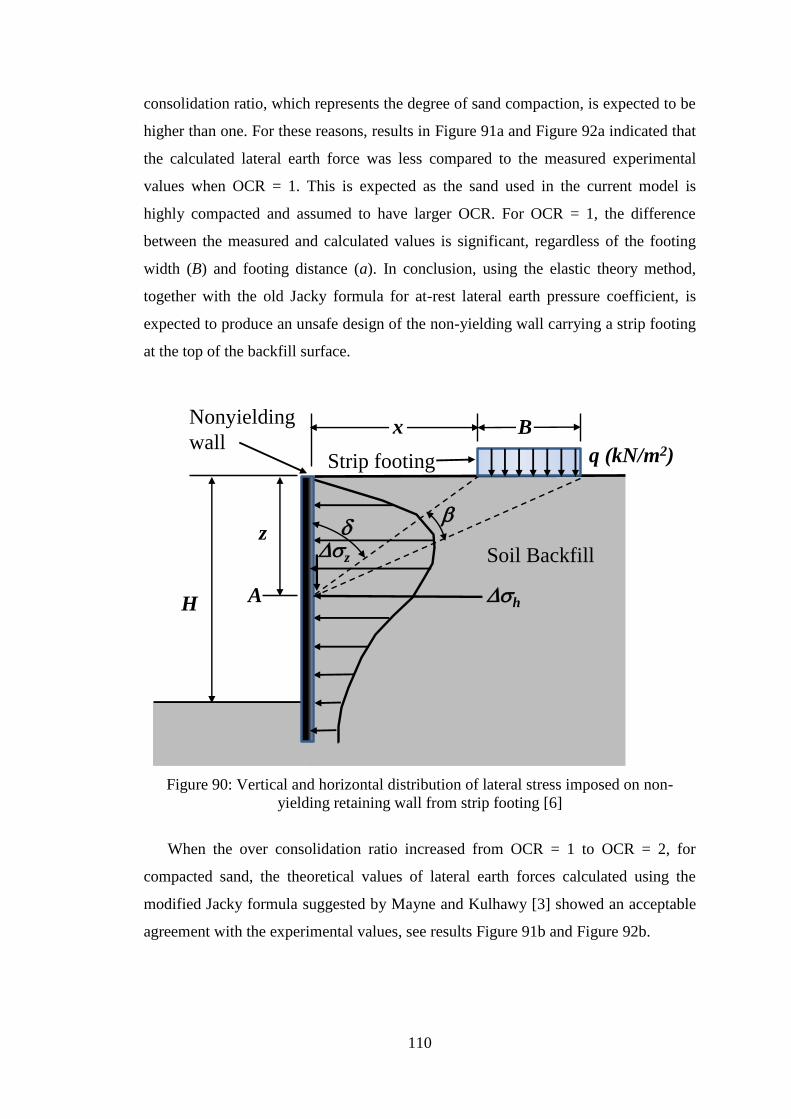
110
consolidation ratio, which represents the degree of sand compaction, is expected to be
higher than one. For these reasons, results in Figure 91a and Figure 92a indicated that
the calculated lateral earth force was less compared to the measured experimental
values when OCR = 1. This is expected as the sand used in the current model is
highly compacted and assumed to have larger OCR. For OCR = 1, the difference
between the measured and calculated values is significant, regardless of the footing
width (B) and footing distance (a). In conclusion, using the elastic theory method,
together with the old Jacky formula for at-rest lateral earth pressure coefficient, is
expected to produce an unsafe design of the non-yielding wall carrying a strip footing
at the top of the backfill surface.
Figure 90: Vertical and horizontal distribution of lateral stress imposed on non-
yielding retaining wall from strip footing [6]
When the over consolidation ratio increased from OCR = 1 to OCR = 2, for
compacted sand, the theoretical values of lateral earth forces calculated using the
modified Jacky formula suggested by Mayne and Kulhawy [3] showed an acceptable
agreement with the experimental values, see results Figure 91b and Figure 92b.
z
H
q (kN/m2)
x
h
A
B
z
Strip footing
Nonyielding
wall
Soil Backfill
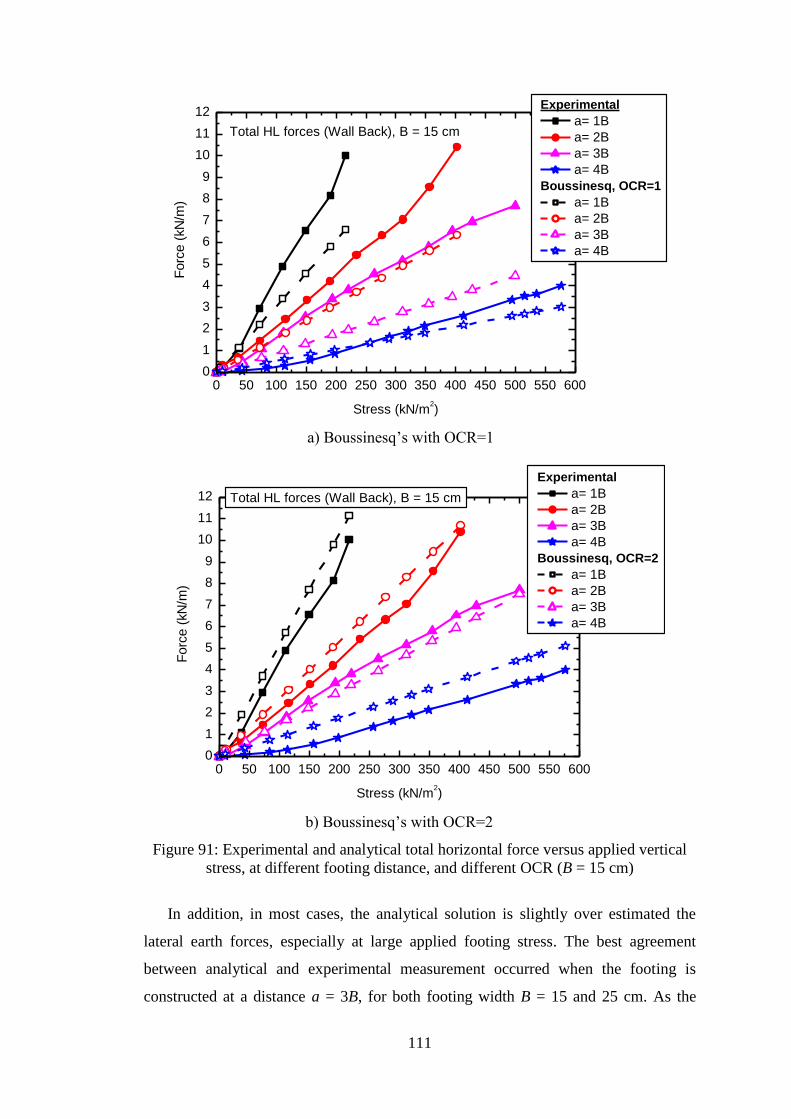
111
0 50 100 150 200 250 300 350 400 450 500 550 6000
1
2
3
4
5
6
7
8
9
10
11
12Experimental
a= 1B
a= 2B
a= 3B
a= 4B
Boussinesq, OCR=1
a= 1B
a= 2B
a= 3B
a= 4B
Total HL forces (Wall Back), B = 15 cm
Forc
e (
kN
/m)
Stress (kN/m2)
a) Boussinesq’s with OCR=1
0 50 100 150 200 250 300 350 400 450 500 550 6000
1
2
3
4
5
6
7
8
9
10
11
12
Experimental
a= 1B
a= 2B
a= 3B
a= 4B
Boussinesq, OCR=2
a= 1B
a= 2B
a= 3B
a= 4B
Total HL forces (Wall Back), B = 15 cm
Forc
e (
kN
/m)
Stress (kN/m2)
b) Boussinesq’s with OCR=2
Figure 91: Experimental and analytical total horizontal force versus applied vertical
stress, at different footing distance, and different OCR (B = 15 cm)
In addition, in most cases, the analytical solution is slightly over estimated the
lateral earth forces, especially at large applied footing stress. The best agreement
between analytical and experimental measurement occurred when the footing is
constructed at a distance a = 3B, for both footing width B = 15 and 25 cm. As the
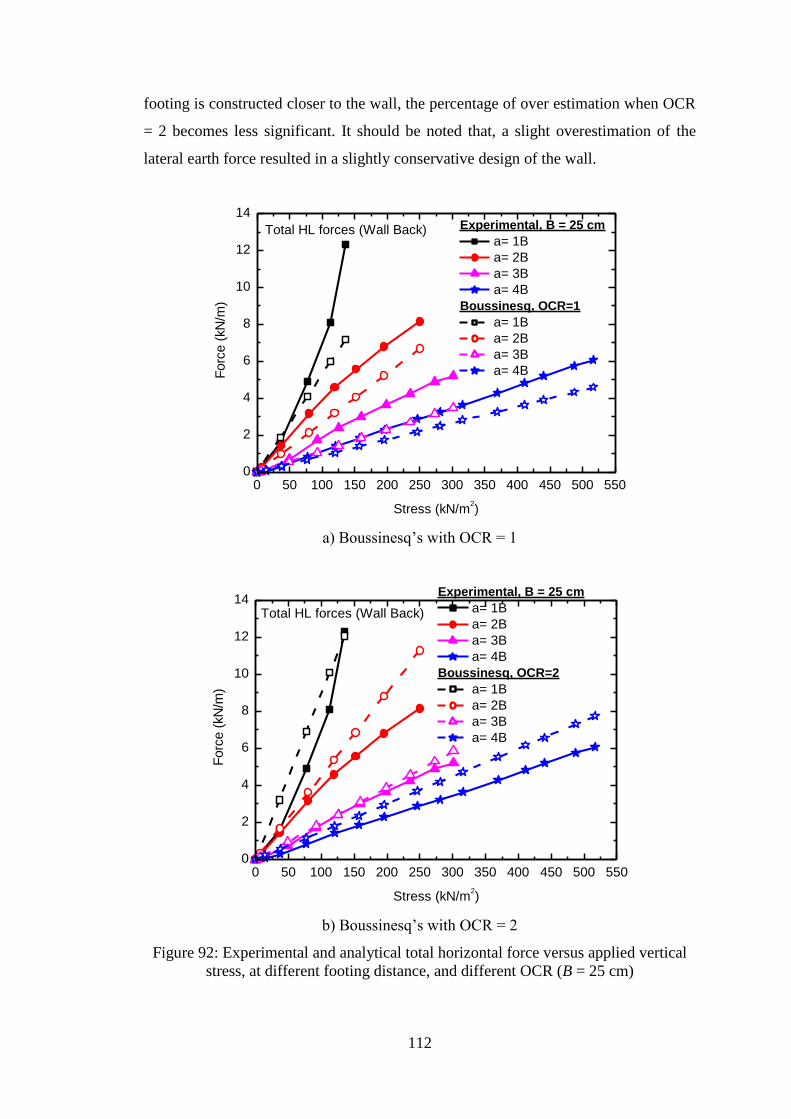
112
footing is constructed closer to the wall, the percentage of over estimation when OCR
= 2 becomes less significant. It should be noted that, a slight overestimation of the
lateral earth force resulted in a slightly conservative design of the wall.
0 50 100 150 200 250 300 350 400 450 500 5500
2
4
6
8
10
12
14Experimental, B = 25 cm
a= 1B
a= 2B
a= 3B
a= 4B
Boussinesq, OCR=1
a= 1B
a= 2B
a= 3B
a= 4B
Total HL forces (Wall Back)
Forc
e (
kN
/m)
Stress (kN/m2)
a) Boussinesq’s with OCR = 1
0 50 100 150 200 250 300 350 400 450 500 5500
2
4
6
8
10
12
14Experimental, B = 25 cm
a= 1B
a= 2B
a= 3B
a= 4B
Boussinesq, OCR=2
a= 1B
a= 2B
a= 3B
a= 4B
Total HL forces (Wall Back)
Forc
e (
kN
/m)
Stress (kN/m2)
b) Boussinesq’s with OCR = 2
Figure 92: Experimental and analytical total horizontal force versus applied vertical
stress, at different footing distance, and different OCR (B = 25 cm)
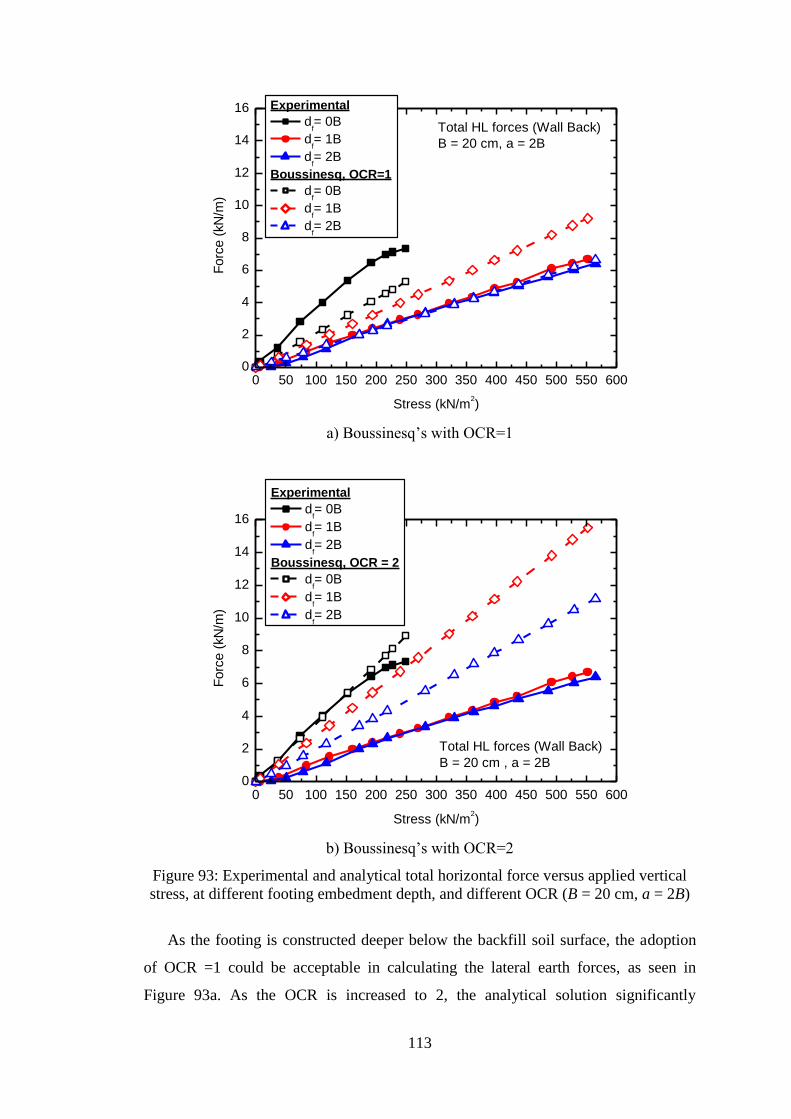
113
0 50 100 150 200 250 300 350 400 450 500 550 6000
2
4
6
8
10
12
14
16 Experimental
df= 0B
df= 1B
df= 2B
Boussinesq, OCR=1
df= 0B
df= 1B
df= 2B
Total HL forces (Wall Back)
B = 20 cm, a = 2B
Forc
e (
kN
/m)
Stress (kN/m2)
a) Boussinesq’s with OCR=1
0 50 100 150 200 250 300 350 400 450 500 550 6000
2
4
6
8
10
12
14
16
Experimental
df= 0B
df= 1B
df= 2B
Boussinesq, OCR = 2
df= 0B
df= 1B
df= 2B
Total HL forces (Wall Back)
B = 20 cm , a = 2B
Forc
e (
kN
/m)
Stress (kN/m2)
b) Boussinesq’s with OCR=2
Figure 93: Experimental and analytical total horizontal force versus applied vertical
stress, at different footing embedment depth, and different OCR (B = 20 cm, a = 2B)
As the footing is constructed deeper below the backfill soil surface, the adoption
of OCR =1 could be acceptable in calculating the lateral earth forces, as seen in
Figure 93a. As the OCR is increased to 2, the analytical solution significantly
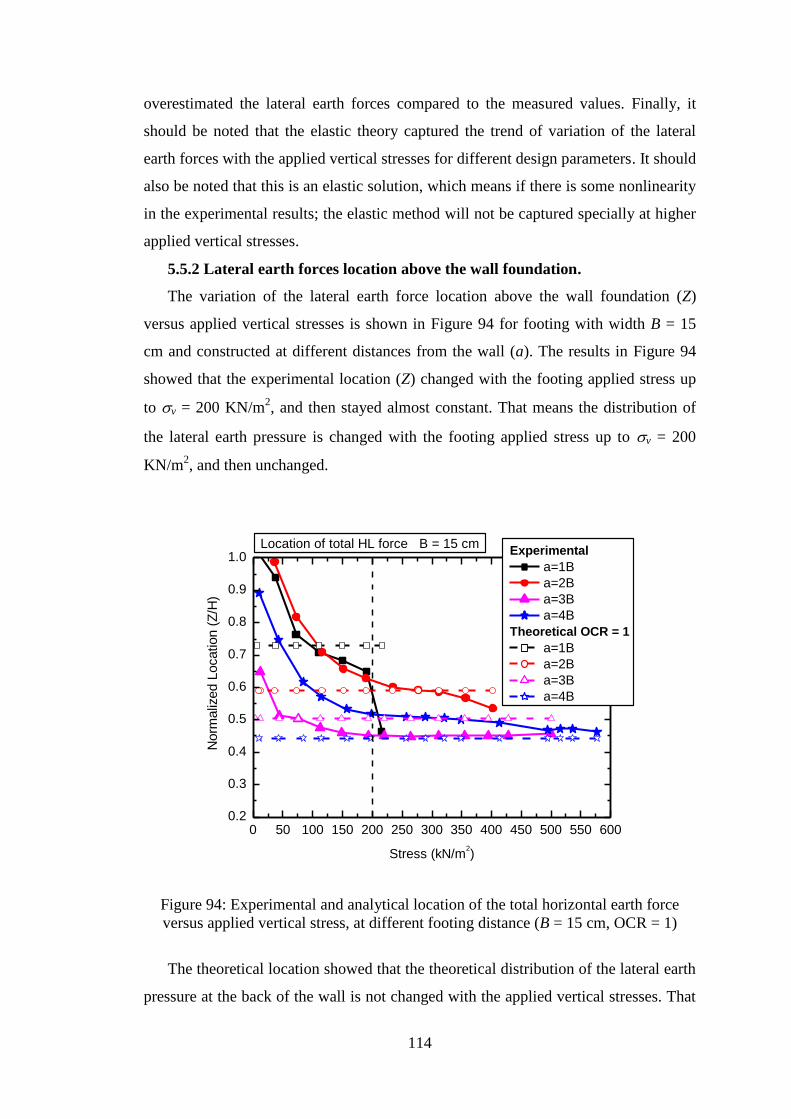
114
overestimated the lateral earth forces compared to the measured values. Finally, it
should be noted that the elastic theory captured the trend of variation of the lateral
earth forces with the applied vertical stresses for different design parameters. It should
also be noted that this is an elastic solution, which means if there is some nonlinearity
in the experimental results; the elastic method will not be captured specially at higher
applied vertical stresses.
5.5.2 Lateral earth forces location above the wall foundation.
The variation of the lateral earth force location above the wall foundation (Z)
versus applied vertical stresses is shown in Figure 94 for footing with width B = 15
cm and constructed at different distances from the wall (a). The results in Figure 94
showed that the experimental location (Z) changed with the footing applied stress up
to v = 200 KN/m2, and then stayed almost constant. That means the distribution of
the lateral earth pressure is changed with the footing applied stress up to v = 200
KN/m2, and then unchanged.
0 50 100 150 200 250 300 350 400 450 500 550 6000.2
0.3
0.4
0.5
0.6
0.7
0.8
0.9
1.0Experimental
a=1B
a=2B
a=3B
a=4B
Theoretical OCR = 1
a=1B
a=2B
a=3B
a=4B
Location of total HL force B = 15 cm
Norm
aliz
ed L
ocation (
Z/H
)
Stress (kN/m2)
Figure 94: Experimental and analytical location of the total horizontal earth force
versus applied vertical stress, at different footing distance (B = 15 cm, OCR = 1)
The theoretical location showed that the theoretical distribution of the lateral earth
pressure at the back of the wall is not changed with the applied vertical stresses. That
115
means the theoretical location is not in agreement with the experimental location for
applied vertical stresses less than 200 KN/m2. Then the trend of the location is in good
agreement with the experimental trend for applied stress larger than 200 KN/m2.
However, the theoretical solution slightly over estimated the location compared to the
experimental values, for stresses larger than 200 KN/m2. The only exception of this is
the footing constructed at a distance a = 4B, where the analytical solution
underestimated the location slightly. As a general conclusion, the earth force location
calculated using the elastic theory method could be acceptable for relatively larger
applied footing stress. Finally, the value of OCR does not have any effect on the
location; rather it affects the magnitude of the forces only.
5.6 Conclusions
The forces developed at the boundary of the footing are mainly controlled by down
drag force or uplift force that are experienced by the wall adjacent to the strip
footing.
The vertical forces developed at the wall foundation generally increased as the strip
footing applied stress increased.
The vertical resultant applied force at the top of the backfill surface is larger for the
footing with larger width (B).
Wall recovery from the uplift force imposed by the smaller footing was faster than
the larger footing.
The vertical forces experienced by the wall were noticed to increase with the
increase of the footing applied vertical stress.
The vertical forces experienced by the wall were noticed to increase as the footing
is located closer to the back of the wall.
The vertical forces experienced by the wall tend to decrease as the embedment
depth increased.
Due to the vertical stress applied by the strip footing, top and bottom horizontal
forces experienced by the wall, tend to be equal in magnitude as the distance away
from the back of the wall increases, regardless of footing width.
For strip footings located near the back of the wall, the magnitude of the top
horizontal force experienced by the wall is more than the magnitude of the bottom
horizontal force.
116
The total horizontal earth forces increased as the footing applied stresses increased.
As distance between the footing and the wall decreased (i.e. the footing is getting
closer to the wall), the horizontal forces developed at the top and the bottom of the
wall and the lateral earth force at the back of the wall increased significantly.
The maximum total horizontal force imposed on the rigid wall was generated by
the strip footing at surcharge.
As the embedment depth increases, the bottom of the wall experiences higher
magnitudes of horizontal force imposed by the strip footing and vice versa.
As the footing moved deeper into the soil, the total horizontal wall load was
noticed to decrease drastically.
As the distance away from the wall increases, the location of the resultant
horizontal force tends to move down the wall, however, there were no clear
associated trends between footing size and the location of the resultant.
As the strip footing depth below backfill surface (df) is getting smaller, the location
of the earth force resultant above the wall foundation (Z) is getting larger.
As the footing vertical settlement increased the applied stress increased, regardless
of the footing size or distance from the wall.
As the footing width increased the imposed vertical stress noticed to increase, as
well as the imposed settlements that were noticed to increase too.
There was a clear inversely proportional relationship between the footing
settlement and the distance away from the wall, i.e. the footing settlement
increased as the distance away from the wall decreased.
The settlement of strip footing decreased as the embedment depth of the strip
footing increased.
As the embedment depth increased, the footing can sustain larger vertical stress
before the end of the test.
The wall lateral deflection gets larger as the footing width (B) increased
Regardless of the footing width, the lateral deflection of the non-yielding wall
increased as the strip footing is constructed closer to the wall, and vice versa.
The largest wall deflection occurred when the footing is constructed at top of the
backfill surface
Using the elastic theory method, together with the old Jacky formula for at-rest
lateral earth pressure coefficient, produced unsafe predictions of lateral earth
117
pressure induced on the non-yielding wall carrying a strip footing at the top of the
backfill surface.
The calculated lateral earth force was smaller in comparison with the measured
experimental values when OCR = 1, while when OCR = 2 was used in the
calculations, predictions matched experimental values.
A slight overestimation of the lateral earth force resulted in a slightly conservative
design of the wall.
The best agreement between analytical and experimental measurement occurred
when the footing is constructed at the furthest distance away from the wall.
As the footing is constructed deeper below the backfill soil surface, the adoption of
OCR = 1 could be acceptable in calculating the lateral earth forces.
The elastic solution did not capture nonlinearity in the experimental results; the
elastic method will not be applicable at higher applied vertical stresses.
It was shown that the value of OCR does not have any effect on the location; rather
it affects the magnitude of the forces only.
118
Chapter 6: Conclusion and Recommendations
6.1 Conclusion
A number of 15 wall-footing systems were experimentally tested and analyzed in
this study. Results are presented in two formats; time domain and stress domain.
Major design parameters such as footing stress-settlement relation, wall lateral earth
forces versus applied stress, and wall footing vertical forces are presented. Effects of
strip footing rent design parameters such as footing width, distances from the wall,
and embedment depth on the wall-footing response have been studied. In addition, the
wall lateral deflections for different design configuration were presented in the results.
The major finding from the results of the physical reduced scale models are
summarized in this chapter.
6.2 Wall Forces
The vertical forces, developed at wall bottom boundary, are expected to transfer to
the building foundation. Therefore they are considered highly significant for complete
design of the building. These forces are developed by down drag or uplift force that
are experienced by the wall and the adjacent soil. It could be concluded that:
Vertical forces, imposed by a strip footing constructed in the vicinity of non-
yielding basement wall, increased as the footing is constructed closer to the wall
back.
Vertical forces are increased with the strip footing width (B), and with the vertical
stresses applied on the strip footing.
Vertical forces transferred to the wall foundation decreased as the footing depth
below backfill surface increased.
Horizontal (lateral) forces, imposed by the strip footing on adjacent basement
walls, are transferred to the building foundation and basement slab. To design these
structure elements safely, the external horizontal forces from the adjacent strip footing
needed to be measured and considered. The following points could be summarized:
The total horizontal forces imposed on the basement wall increased as the stress
applied by the adjacent strip footing increased.
At the same applied vertical stresses, the total horizontal earth forces imposed by
strip footing increased as the footing width (B) increased.
119
At the same vertical applied stresses and for the same footing width, the total
horizontal earth pressure imposed on the adjacent non-yielding wall increased as
the footing built closer to the wall.
As the strip footing embedment depth below the backfill soil surface increased,
the total horizontal earth forces developed at the back of the wall decreased.
As the strip footing is located closer to the back of the wall, the magnitude of the
horizontal force attracted by the top boundary (i.e. basement slab) is larger
compared to the magnitude of the force attracted to the bottom boundary of the
wall (i.e. wall foundation).
For strip footings constructed at larger distances of the wall, both bottom and top
boundaries attracted near equal magnitudes of horizontal earth forces.
As the embedment depth of the strip footing increased, the bottom of the wall
experiences higher magnitudes of horizontal earth force, compared to the top of
the wall.
The location of the total horizontal forces at the back of the wall (i.e. point of
application) above the wall foundation (Z) is another important parameter. It reflects
the probable distribution shape of the lateral earth pressure imposed by the strip
footing. In addition, it could be used to estimate the bending moment on the non-
yielding wall panel. In this point the following could be summarized:
Generally, the location of lateral horizontal forces above the basement wall
foundation (Z) is between 0.4H to 0.5H depending on the width of the strip
footing (B).
As the strip footing width (B) increased, the lateral horizontal earth forces moved
downward towards the wall foundation (i.e. Z is decreased).
As the distance between the strip footing and the wall (a) increased, the location
of the resultant horizontal earth force (Z) decreased. The effect of the footing size
on the earth force location is not clear.
As the strip footing embedment depth below backfill soil surface (df) is getting
smaller, the location of the earth force resultant above the wall foundation (Z) is
getting larger.
6.3 Soil Movement
Soil and model movement in the experimental tests was due to the footing
settlement and the lateral wall deflection. Both movements are due to the strip footing
120
applied stress. However, the footing settlement depends on its applied vertical stress
and the adjacent wall deflection. In this regard, the following points could be stated:
Footing vertical settlement increased as the applied vertical stress increased
regardless of the footing width or distances from the wall.
For the same applied vertical stress, the strip footing vertical settlement increased
as the footing width (B) increased.
As the footing is constructed closer to the wall (i.e. the distance a decreased), the
vertical settlement of the footing increased, and vice versa.
The settlement of strip footing decreased as the embedment depth of the strip
footing below the backfill soil surface increased.
The lateral deflection of the non-yielding wall increased when the vertical stress
applied at the strip footing increased.
The strip footing with larger width (B) imposed more lateral deflection on the
non-yielding wall, compared to the footing with smaller width, despite of equal
vertical stress.
Regardless of the footing width and vertical stress, the lateral deflection of the
non-yielding wall increased as the strip footing distance from the wall (a)
decreased and as the embedment depth (df) decreased.
6.4 Analytical Implications
The comparison between the experimentally measured lateral earth forces with the
values obtained using analytical solution indicated the following important points:
Using the elastic theory method together with the old Jacky formula [1]for at-rest
lateral earth pressure coefficient produced unsafe predictions of lateral earth
pressure induced on the non-yielding wall due adjacent strip footing at the top of
the backfill surface.
The elastic solution did not capture the nonlinearity in the experimental results,
and therefore, the elastic method showed less agreement with the experimental
values at higher applied vertical stresses.
As the strip footing distance from the wall increased, the effect of the wall
diminished, and good agreement between analytical and experimental
measurement occurred.
121
The effect of compaction on the experimentally resulted lateral earth forces is
significant. This effect could be considered in the analytical solution by the OCR
factor included in the modified Jaky equation.
Using OCR = 1 for the currently compacted sand tended to underestimated the
lateral earth forces at the back of the wall due to the strip footing. Therefore, a
value of OCR = 1 was found reasonable in the current study and give an
acceptable agreement between both analytical and experimental values of lateral
earth forces.
For strip footing constructed deeper below the backfill soil surface, the adoption
of OCR =1 could be acceptable in calculating the lateral earth forces.
The value of OCR did not show any effect on the location of the lateral earth
forces; rather it affects the magnitude of the forces only.
6.5 Recommendations for Future Research
Based on lessons learned in this investigation and conclusions presented in the
preceding sections, the following recommendations are made for future work:
1. The tested models can be used to calibrate a numerical model to simulate the
basement wall-footing response. The calibrated numerical model together with the
experimental results will be used to further update or modify the current design
methods dealing with the problem of shallow foundation adjacent to basement
wall.
2. The experimental program could be extended to include different footing shapes,
as the general rectangular shape.
3. Moreover, the experimental program could be further developed to include
different soil friction angles (ϕ), different degree of compaction (consolidation) of
sand backfill (OCR), moisture contents and different soil gradation.
4. Other parameters could be also studied such as different wall rigidity (EI),
different embedment depths (df). In addition to that, the wall would be modified
with tiebacks embedded in backfill soil layers to reduce wall deflection that is the
main reason behind footing limited capacity.
5. The introduction of a layer of geofoam (elasticized Styrofoam) to reduce lateral
earth pressure imposed by the footing on the basement wall should be explored.
122
References
[1] J. Jaky, "The coefficient of earth pressure at rest," Journal for Society of
Hungarian Architects and Engineers, pp. 355-358, Oct. 1944 (in Hungarian).
[2] A. Hanna, and R. Al-Romhein, "At-Rest Earth Pressure of Overconsolidated
Cohesionless Soil," Journal of Geotechnical and Geo-environmental
Engineering ASCE, vol. 134, no. 3, pp. 408-412, 2008.
[3] P. W. Mayne and F. H. Kulhawy, "Ko-OCR relationships in soil," Journal of the
Geotechnical Engineering Division ASCE, vol. 108, no. No. GT6, pp. 851-872,
Jun. 1982.
[4] M. Sherif, Y. S. Fang, and R. Sherif, "Ka and Ko behind rotating and non-
yielding walls," Journal of Geotechnical Engineering, vol. 110, no. 1, pp. 41-56,
Jan. 1984.
[5] M. El- Emam, "Experimental study of at rest static lateral earth pressure for
overconsolidated Sand," Journal of Nevada Water Resources Association,, vol. 6,
no. 1, pp. 327-337, 2011.
[6] M. El-Emam, "Experimental and numerical study of at-rest lateral earth pressure
of over-consolidated sand," Advances in Civil Engineering, vol. 2011, p. 12, Jun.
2011.
[7] D. Municipality, "Shallow foundation in the vacinity of a basement wall," Case
Study, 2012.
[8] J. Boussinesq, "Application des Potentials a L’Etude de L’Equilibri et
dueMouvement des Solides Elastiques," Gauthier- Villars, 1883.
[9] A. Bigdeli and M. El-Emam, "Effect of material properties on static response of
non-yielding retaining walls," in International Conference on Geotechnical
Engineering, ICGE’13, Hammamet, Tunisia, 2013, pp. 243-252.
[10] K. Terzaghi, "Old earth pressure theories and new test results," Engineering
News-Record, vol. 85, no. 14, pp. 632-637, 1920.
[11] A. W. Bishop, "Test requirements for measuring Ko," Int. Soc. of Soil Mech. and
Found. Engr., pp. 2-14, 1958.
[12] K. Z. Andrawes and M. A. El-Sohby, "Factors affecting coefficient of earth
pressure Ko," J. Soil Mech. and Found. Div., vol. 99, no. 7, pp. 527-539, 1973.
123
[13] R. Jalla, "Basement wall design: geotechnical aspects," Journal of Architectural
Engineering, vol. 5, pp. 89-94, Sep. 1999.
[14] Y. S. Fang, J. M. Chen, and C. Y. Chen, "Earth pressures with sloping backfill,"
Journal of Geotechnical and Geoenvironmental Engineering, vol. 123, no. 3, pp.
250-259, 1997.
[15] Y. S. Fang and I. Ishibashi, "Static earth pressures with various wall movements
," Journal of Geotechnical Engineering , vol. 112, no. 3, pp. 317-333, 1986.
[16] R. D. Mackey and D. P. Kirk, "At rest earth pressures with various wall
movements," in Proceedings of the South East Asian Conference on Soil
Mechanics and Foundation Engineering, Bangkok, Thailand, 1967, pp. 187-199.
[17] R. B. Seed and R. B. Duncan, "Finite element analysis: compaction induced
stresses and deformations," Journal of Geotechnical Engineering, vol. 112, no. 1,
pp. 22-43, 1986.
[18] F. Schnaid and G. T. Houlsby, "Measurement of the properties of sand by the
cohesion pressuremeter test," University of Oxford, Oxford, Soil Mechanics
Report 113/91, 1991.
[19] D. P. Coduto, Foundation Design: Principles and Practices, 2nd ed. Michigan,
USA: Prentice Hall, 2001.
[20] P. W. Mayne, "In-situ and lab tests, deformation characteristics of geomaterials,"
in Integrated Ground Behavior, London, 2005, pp. 155-177.
[21] P. W. Mayne, "Synthesis on Cone Penetration Test: State-of-Practice.,"
Transportation Research Board, National Academies Press, Washington, D.C,
NCHRP Report, 2007.
[22] T. N. Dave and S. M. Dasaka, "Transition of earth pressure on rigid retaining
walls subjected to surcharge loading," International Journal of Geotechnical
Engineering, vol. 2012, no. 6, pp. 427-435, 2012.
[23] R. Jarquio, "Total lateral surcharge pressure due to strip load," Geotechnical
Engineering Div. ASCE, vol. 107, no. 10, pp. 1424-1428, 1981.
[24] E. Motta, "Generalized coulomb active earth pressures for distanced surcharge,"
Geotechnical Engineering, vol. 120, no. 6, pp. 1072-1079, Feb. 1994.
[25] B. Misra, "Lateral pressures on retaining walls due to loads of surface of granular
124
backfill," Soils and Foundations, vol. 20, no. 2, pp. 31-44, 1980.
[26] J. N. Carnica, "Foundation Design," John Wiley & Sons Inc., New York,
Geotechnical Engineering Report , 1995.
[27] E. Yildiz, "Lateral pressures on rigid retaining walls: a neural network approach,"
MSc Thesis, Middle East Technical University, Ankara, 2003.
[28] B. Kalender, "Beton Kalender Method," Verlag von Wilhelm Ernst and Sohn
Geotechnical, 1983 (in German).
[29] J. S. Steenfelt and B. Hansen , "Total lateral surcharge pressure due to strip load
(Discussion)," Journal of Geotechnical Engineering ASCE, vol. 109, no. 2, pp.
271-273, 1983.
[30] J. S. Steenfelt and B. Hansen , "Sheet pile design earth pressure for strip load,"
Journal of Geotechnical Engineering ASCE, vol. 110, no. 7, pp. 976-986, 1984.
[31] M. Georgiadis and C. Anagnostopoulos, "Lateral earth pressures on sheet pile
walls due to strip loads," Journal of Geotechnical and Geoenvironmental
Engineering, vol. 124, no. 1, pp. 95-98, Jan. 1998.
[32] J. Zhang, Y. Shamoto, and K. Tokimatsu, "Evaluation of earth pressure under
any lateral deformation," Soils and Foundations, vol. 38, no. 1, pp. 15-33, 1998.
[33] J. S. Kim and R. M. Barker, "Effect of Live Load Surcharge on Retaining Walls
and Abutments," J. Geotech. Geoenviron. Eng., vol. 128, pp. 803-813, 2002.
[34] M. Georgiadis and C. Anagnostopoulos, "Lateral earth pressures on sheet pile
walls due to strip loads," Journal of Geotechnical and Geoenvironmental
Engineering, vol. 124, no. 1, pp. 95-98, 1998.
[35] B. Satyanarayana, "Earth pressure for bilinear backfill surface," Soil Mechanics
& Foundation Div., vol. 91, no. 1, pp. 99-110, 1965.
[36] B. M. Das, Principles of Geotechnical Engineering, 7th ed. Stanford, CT, USA:
Cengage Learning, 2010.
[37] G. F. Sowers, Robb, A.D., C. H. Mullis, and A. J. Glenn, "The residual lateral
pressures produced by compacting soils," in Proceedings of the 4th International
Conference on Soil Mechanics and Foundation Engineering, London, UK, 1957.
[38] M. S. Aggour and C. B. Brown, "The prediction of earth pressure on retaining
walls due to compaction. ," Geotechnique, vol. 24, no. 4, pp. 489-502, 1974.
125
[39] T. S. Ingold, "The effects of compaction on retaining walls," Geotechnique, vol.
29, no. 3, pp. 265-283, 1979.
[40] J. M. Duncan and R. B. Seed, "Compaction induced earth pressure under Ko-
condition ," Journal of Geotechnical Engineering, vol. 112, no. 1, pp. 1-22,
1986.
[41] K. R. Massarsch and B. H. Fellinius, "Vibratory compaction of course grained
soils," Canadian Geotechnical Journal, vol. 39, no. 3, pp. 695-709, 2002.
[42] Y. S. Fang, S. H. Tzeng , and T. J. Chen, "Earth pressure on an unyielding wall
due to a strip surcharge," in International Offshore and Polar engineering
conference, Lisbon, 2007, pp. 1233-1238.
[43] G. A. Leonards and J. D. Frost, "Settlement of shallow foundations on granular
soils," Journal of Geotechnical Engineering, vol. 114, no. 7, pp. 791-809, 1988.
[44] K. R. Massarsch, "Settlement analysis of compacted backfill," in Proceedings of
the 13th International Conference on Soil Mechanics and Foundation
Engineering (ICSMFE'94), New Delhi, India, 1994, pp. Vol1,325-328.
[45] R. B. Peck and M. G., "Discussion of compaction induced earth pressure under
Ko condition," Journal of Geotechnical Engineering, vol. 113, no. 11, pp. 1406-
1408, 1987.
[46] T.-J. Chen and Y.-S. Fang, "Earth Pressure due to Vibratory Compaction," J.
Geotech. Geoenviron. Eng., vol. 134, pp. 437-444, Apr. 2008.
[47] T. S. O'Neal and D. J. Hagerty, "Earth pressures in confined cohesionless backfill
against rigid walls - a case history," Canadian Journal of Geotechnical
Engineering, vol. 48, no. 2011, pp. 1188-1197, 2011.
[48] K. Terzaghi, Theoretical Soil Mechanics. New York, USA: John Wiley and
Sons, 1943.
[49] W. A. Take and J. A. Valsangkar, "Earth pressures on un-yielding retaining walls
of narrow backfill width," Canadian Geotechnical Journal, vol. 38, no. 6, pp.
1220-1230, Dec. 2001.
[50] S. Frydman and I. Keissar, "Earth pressures on retaining walls near rock faces,"
Journal of Geotechnical Engineering , vol. 113, no. 6, pp. 586-599, 1987.
[51] K. T. Kniss, K.-H. Yang, S. G. Wright, and J. G. Zornberg, "Earth Pressures and
126
Design Considerations," ASCE Texas Section, Texas, Research Grant Project
Report TX DOT Project No. 0-5506., Apr. 2007.
[52] P. V. Berg, "Effect of surface loading behind earth retaining walls," Delft
Geotechnics, vol. 2, pp. 767-771, 1991.
[53] S. E. Rehnman and B. B. Broms, "Lateral pressures on basement wall: results
from full-scale tests," in 5th European Conference on Soil Mechanics and
Foundation Engineering, Stockholm, 1972, pp. 189-197.
[54] U. Smoltczyk, N. Vogt, and K. Hilmer, "Lateral earth pressure due to surcharge
loads," Design Parameters in Geotechnical Engineering, vol. 2, pp. 131-139,
1979.
[55] S. Iai, "Similitude for shaking table tests on soil-structure-fluid models in 1-g
gravitational field.," Soils and Foundations, vol. 29, no. 1, pp. 105-118, 1989.
[56] American Society for Testing and Materials, "Standard test method for bearing
capacity of soil for static load and spread footings," 1994.
[57] E. Motta, "Sulla valutazione della spinta attiva in terrapieni di altezza finita,"
Rivista Italiana di Geotecnica, vol. XXVII, no. 3, pp. 235-245, 1993 (in Italian).
[58] J. H. Schmertmann, "Measure and use of the in situ lateral stress," in The
Practice of Foundation Engineering. Evanston, USA, Ill: Department of Civil
Engineering, Northwestern University, 1985, pp. 189-213.
[59] K. R. Massarsch, "Deep soil compaction using vibrotory probes," in Proceedings
of the ASTM Symposium on Design Construction and Testing of Deep
Foundation Improvement: Stone Columns and Related Techniques, London, UK,
1991, pp. 279-319.
[60] A. M. Ghaly and A. M. Hanna, "Stress and strains around helical screw anchors
in sand.," Soils and Foundations, vol. 32, no. 4, pp. 27-42, 1992.
[61] M. S. Dixit and K. A. Patil, "Effect of roughness of footings on ultimate bearing
capacity, settlement and Nγ values," The Electronic Journal of Geotechnical
Engineering, vol. 18, no. 2013, pp. 3167-3184, 2013.
127
Vita
Majid Touqan was born on February 20, 1992, in Dubai, UAE. He was educated
in Al Ma’arifa International School in the British curriculum and graduated as class
valedictorian in 2009. He received a Merit scholarship to the American University of
Sharjah, from which he graduated, in 2013. His degree was a Bachelor of Science in
Civil Engineering. In Fall 2013, he began a Master’s program in Civil Engineering at
the American University of Sharjah. During his studies he worked as a teaching
assistant. Mr. Touqan is a member of the American Society of Civil Engineers.