Embed Size (px)
Citation preview
Division of Pharmaceutical Chemistry and TechnologyFaculty of PharmacyUniversity of Helsinki
Finland
ANALYSIS OF NEUROTRANSMITTERS,NEUROSTEROIDS AND THEIR METABOLITES IN
BIOLOGICAL SAMPLES
Tina Suominen
ACADEMIC DISSERTATION
To be presented, with the permission of the Faculty of Pharmacy ofthe University of Helsinki, for public examination in Auditorium XII,
University Main Building, on May 22nd 2015, at 12 noon.
Helsinki 2015
Supervisor
Professor Risto KostiainenDivision of Pharmaceutical Chemistry and TechnologyFaculty of PharmacyUniversity of Helsinki
Reviewers
Professor Mario ThevisInstitute of Biochemistry / Center for Preventive Doping ResearchGerman Sport University Cologne
Professor Seppo AuriolaDepartment of Analytical Chemistry, School of PharmacyUniversity of Eastern Finland
Opponent
Professor Thomas HankemeierFaculty of Science, Leiden Academic Centre for Drug ResearchLeiden University
© Tina Suominen 2015ISBN 978-951-51-1175-3 (pbk.)ISBN 978-951-51-1176-0 (PDF)ISSN 2342-3161 (Print)ISSN 2342-317X (Online)
Helsinki University Printing HouseHelsinki 2015
3
ABSTRACT
Neurotransmitters and neurosteroids are compounds that regulate thefunctions of the brain. The neurotransmitters dopamine (DA) and serotonin(5-HT) play a role in several psychological conditions, includingschizophrenia, depression and anxiety. DA also has an important role inParkinson’s disease. Neurosteroids are involved in neurodegenerativediseases. In Alzheimer’s disease and multiple sclerosis, the levels ofneurosteroids are decreased in certain areas of the brain. Neurosteroids differfrom classical neurotransmitters in that they are lipid-soluble and can easilycross the blood-brain barrier (BBB).
Neurotransmission can be studied in vivo by microdialysis, but as theconcentrations of neurotransmitters in the microdialysates are very low,sensitive analytical methods are needed for their analysis. In this work anUPLC-MS/MS method was developed for the determination of 5-HT, DA, theirphase I metabolites 5-HIAA, DOPAC and HVA, and their sulfonate andglucuronide conjugates. The method was validated and applied for analyzinghuman brain microdialysis and cerebrospinal fluid (CSF) samples. Intactglucuronide and sulfate conjugates were identified and quantified for the firsttime in the human brain.
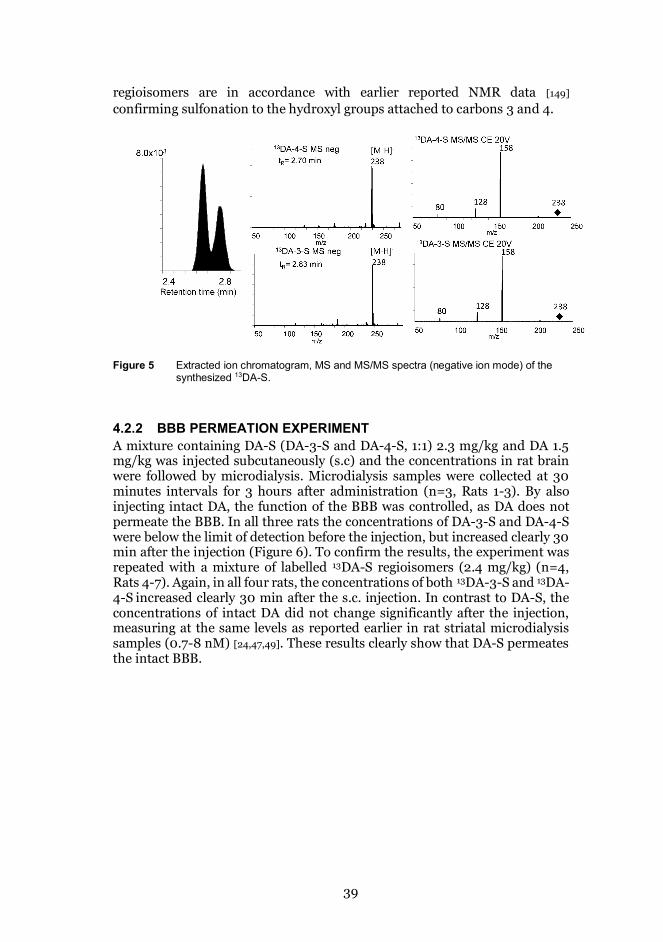
The origin of the determined phase II metabolites in the brain is unknown.Even though sulfonate-conjugated compounds such as dopamine sulfonate(DA-S) and 5-HIAA-S were detected in the human brain, it is unclear whetherthey were locally formed or transported into the brain through the BBB fromperipheral sources. The BBB permeation of DA-S was studied byadministration of isotope (13C6)-labelled DA-S, which can be distinguishedfrom endogenous DA-S by mass spectrometry, subcutaneously (s.c.) whilebrain microdialysis samples were collected and analyzed by UPLC-MS/MS.The fate of 13DA-S in brain was followed by monitoring 13C6-labelled DA-Smetabolites and hydrolysis products. The results proved that DA-S permeatesthrough the BBB, and indicated that DA-S finally either permeates through theBBB back to the peripheral circulation or is dissociated or metabolized byunknown mechanisms.
While the hydrophilic neurotransmitters DA and 5-HT are well suited foranalysis by liquid chromatography coupled to atmospheric pressureionization, the neurosteroids have more commonly been analyzed by methodsbased on gas chromatography (GC) coupled to ionization in vacuum. RecentlyGC has been combined to atmospheric pressure photoionization utilizingheated nebulizer microchips (μAPPI). We now constructed a simpler interfacefor combining GC to mass spectrometry (MS) using dopant-assisted
4
atmospheric pressure photoionization (APPI), utilizing commerciallyavailable hardware. The neurosteroids were analyzed as trimethylsilyl (TMS)derivatives, and the effect of different dopants (chlorobenzene, toluene andanisole) on the ionization and on the sensitivity of the method wasinvestigated. Chlorobenzene was chosen as the best dopant, as theneurosteroid-TMS derivatives formed intense molecular ions with minimalfragmentation, while with toluene and anisole also protonated molecules wereobserved. The molecular ions of the steroids formed by APPI ionizationshowed fragmentation patterns in their MS/MS spectra similar to the patternsseen in corresponding spectra obtained by electron impact ionization (EI).Therefore the use of EI libraries could be possible, thus enabling theidentification of a wide range of unknown compounds.
5
ACKNOWLEDGEMENTS
This work was carried out at the Division of Pharmaceutical Chemistry andTechnology at the Faculty of Pharmacy, University of Helsinki, during theyears 2009-2015.
I am deeply grateful to my supervisor, Prof. Risto Kostiainen, for hisguidance and support, criticism and neverending interest in science. I alsowant to express my deepest gratitude to my other supervisor during my firstyears as a researcher, Doc. Raimo Ketola, for his precious advice both in theoryand in the laboratory.
Among other people I want to mention are Doc. Tiia Kuuranne and Dr.Antti Leinonen, to whom I am most grateful for introducing me to the worldof mass spectrometry during my master’s thesis work and during the followingyears when I worked in a laboratory outside the university.
I also want to thank all my coauthors for their valuable contributions to mywork, especially Dr. Päivi Uutela and Dr. Markus Haapala for their crucialinvolvement in my work, Dr. Moshe Finel and Dr. Hongbo Zhang for their helpand advice, and Prof., M.D. Jonas Bergquist and Dr., M.D. Aki Laakso forproviding me with human brain microdialysis and cerebrospinal fluidsamples. Additionally, I want to acknowledge Professor Seppo Auriola andProfessor Mario Thevis for their thorough review and valuable comments,which lead to significant improvement of this thesis.
I also want to thank the head of our division, Prof. Jari Yli-Kauhaluoma,for being a great and helpful boss during these years, as well as Prof. TapioKotiaho for advice concerning mass spectrometry. I am also very grateful to allpast and present colleagues at the Division of Pharmaceutical Chemistry; ithas been a great opportunity to work with so many talented scientists, whohave a very genuine interest in science. Even though we’ve all sometimesworked very long hours in the laboratory, and good results have been difficultto obtain from time to time, working has been inspiring and fun. Theatmosphere in our division has been relaxed, especially during the coffeebreaks, where the discussion topics vary from gossip to highly scientificmatters.
Finally I want to thank Kride for supporting me through this project, andour son Daniel for taking my mind (almost) completely off everything that hasto do with work when I’m at home. Moreover I want to thank my parents andmy sister for always being supportive.

6
CONTENTS
Abstract .......................................................................................................... 3
Acknowledgements ....................................................................................... 5
Contents ......................................................................................................... 6
List of original publications .......................................................................... 9
Author’s contribution to the publications included in this thesis ........... 10
Abbreviations ................................................................................................ 11
1 INTRODUCTION ............................................................................... 13
1.1 Neurotransmitters and neurosteroids ..................................... 13
1.1.1 Phase I metabolism ................................................................ 14
1.1.2 Phase II metabolism: conjugation with glucuronic acid orsulfonate ...............................................................................................15
1.2 Analysis of neurotransmitters ................................................... 17
1.2.1 Brain extracellular fluid .......................................................... 17
1.2.2 Cerebrospinal fluid ................................................................. 19
1.2.3 Sample pretreatment ............................................................. 19
1.2.4 Liquid chromatography – mass spectrometry ..................... 20
1.2.5 Other detectors ....................................................................... 20
1.3 Analysis of neurosteroids ......................................................... 22
1.3.1 Matrixes .................................................................................. 22
1.3.2 GC-MS ..................................................................................... 22
1.3.3 LC-MS ..................................................................................... 23
1.3.4 Coupling GC to API mass spectrometry ............................... 23
2 AIMS OF THE STUDY ....................................................................... 25
3 MATERIALS AND METHODS ......................................................... 26
3.1 Chemicals ................................................................................... 26
7
3.2 Samples and pretreatment procedures ................................... 26
3.2.1 Human brain microdialysis samples .................................... 26
3.2.2 Human cerebrospinal fluid samples .....................................27
3.2.3 Rat brain microdialysis samples ............................................27
3.2.4 Human urine samples ........................................................... 28
3.2.5 Synthesis of reference compounds ....................................... 28
3.2.6 UGT experiments ................................................................... 29
3.3 Analytical methods and instrumentation ............................... 29
3.3.1 Liquid chromatography-mass spectrometry ....................... 29
3.3.2 Gas chromatography-mass spectrometry ............................ 30
3.3.2.1 GC-APPI-MS interface ................................................ 31
3.3.2.2 GC-CPI-MS.................................................................. 31
4 RESULTS AND DISCUSSION .......................................................... 33
4.1 Analysis of human brain microdialysis and human CSFsamples .................................................................................................... 33
4.1.1 UPLC-MS/MS method development ................................... 33
4.1.2 Neurotransmitters and their metabolites in human brainmicrodialysis and CSF samples ........................................................ 35
4.1.3 UGT screening experiments for 5-HT and HVA ..................37
4.2 Permeation of dopamine sulfate through the blood-brainbarrier.. .................................................................................................... 38
4.2.1 Synthesis of 13C-labeled dopamine sulfate ........................... 38
4.2.2 BBB permeation experiment................................................. 39
4.2.3 Effect of the injected DA-S on the concentrations of otherneurotransmitters in the brain ......................................................... 40
4.3 Development of a gas chromatographic – tandem massspectrometric analysis method for neurosteroids using atmosphericpressure photoionization ........................................................................ 41
4.3.1 Chromatographic separation ................................................. 41
8
4.3.2 Positioning of the GC transfer line and krypton dischargelamp…. ................................................................................................. 42
4.3.3 Dopants ................................................................................... 43
4.3.4 Mass spectrometry ................................................................. 44
4.3.5 Validation of the method and analysis of urine samples .... 45
4.3.6 Capillary photoionization ...................................................... 48
5 SUMMARY AND CONCLUSIONS .................................................... 50
References .................................................................................................... 52
9
LIST OF ORIGINAL PUBLICATIONS
This thesis is based on the following publications:
I. Suominen, T, Uutela, P, Ketola, RA, Bergquist, J, Hillered, L, Finel,M, Zhang, H, Laakso, A and Kostiainen, R (2013). Determination ofserotonin and dopamine metabolites in human brain microdialysisand cerebrospinal fluid samples by UPLC-MS/MS: discovery ofintact glucuronide and sulfate conjugates. PLoS ONE 8(6): e68007
II. Suominen, T, Haapala, M, Takala, A, Ketola, RA, Kostiainen, R(2013). Neurosteroid analysis by gas chromatography –atmospheric pressure photoionization – tandem massspectrometry. Anal. Chim. Acta 794, 76–81
III. Haapala, M, Suominen, T, Kostiainen, R (2013). CapillaryPhotoionization: A High Sensitivity Ionization Method for MassSpectrometry. Anal. Chem. 85 (12), 5715–5719
IV. Suominen, T, Piepponen TP, Kostiainen, R (2015). Permeation ofdopamine sulfate through the blood-brain barrier. Submitted toPLoS ONE 23.1.2015
The publications are referred to in the text by their roman numerals.
10
AUTHOR’S CONTRIBUTION TO THEPUBLICATIONS INCLUDED IN THIS THESIS
I. The experimental work was carried out by the author. The humanbrain microdialysis samples were provided by Jonas Bergquist andthe human CSF samples by Jonas Bergquist and Aki Laakso. TheUGT experiments were carried out by Hongbo Zhang and MosheFinel with contribution from the author. The manuscript waswritten by the author with contributions from the co-authors.
II. The experimental work was carried out by the author with somecontribution from Anna Takala and Markus Haapala. Themanuscript was written by the author with contributions from theco-authors.
III. The experimental work was carried out by the author and MarkusHaapala. The CPI interface was designed by Markus Haapala. Themanuscript was written mainly by Markus Haapala withcontribution from the author and co-authors.
IV. The experimental work was carried out by the author, except for themicrodialysis experiments, which were carried out by the author,Petteri Piepponen and Marjo Vaha. The manuscript was written bythe author with contributions from the co-authors.
11
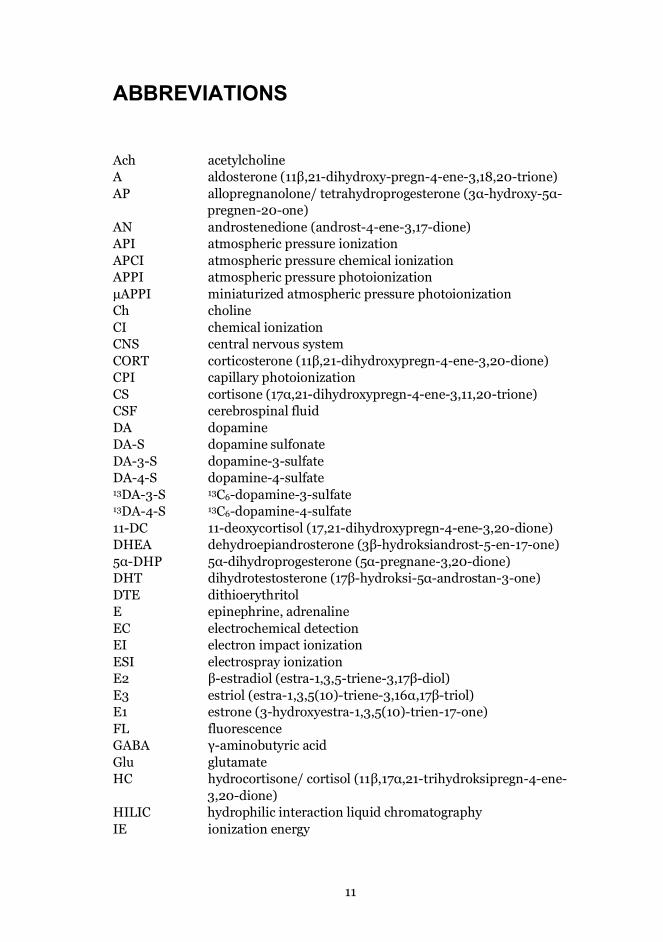
ABBREVIATIONS
Ach acetylcholineA aldosterone (11β,21-dihydroxy-pregn-4-ene-3,18,20-trione)AP allopregnanolone/ tetrahydroprogesterone (3α-hydroxy-5α-
pregnen-20-one)AN androstenedione (androst-4-ene-3,17-dione)API atmospheric pressure ionizationAPCI atmospheric pressure chemical ionizationAPPI atmospheric pressure photoionizationμAPPI miniaturized atmospheric pressure photoionizationCh cholineCI chemical ionizationCNS central nervous systemCORT corticosterone (11β,21-dihydroxypregn-4-ene-3,20-dione)CPI capillary photoionizationCS cortisone (17α,21-dihydroxypregn-4-ene-3,11,20-trione)CSF cerebrospinal fluidDA dopamineDA-S dopamine sulfonateDA-3-S dopamine-3-sulfateDA-4-S dopamine-4-sulfate13DA-3-S 13C6-dopamine-3-sulfate13DA-4-S 13C6-dopamine-4-sulfate11-DC 11-deoxycortisol (17,21-dihydroxypregn-4-ene-3,20-dione)DHEA dehydroepiandrosterone (3β-hydroksiandrost-5-en-17-one)5α-DHP 5α-dihydroprogesterone (5α-pregnane-3,20-dione)DHT dihydrotestosterone (17β-hydroksi-5α-androstan-3-one)DTE dithioerythritolE epinephrine, adrenalineEC electrochemical detectionEI electron impact ionizationESI electrospray ionizationE2 β-estradiol (estra-1,3,5-triene-3,17β-diol)E3 estriol (estra-1,3,5(10)-triene-3,16α,17β-triol)E1 estrone (3-hydroxyestra-1,3,5(10)-trien-17-one)FL fluorescenceGABA γ-aminobutyric acidGlu glutamateHC hydrocortisone/ cortisol (11β,17α,21-trihydroksipregn-4-ene-
3,20-dione)HILIC hydrophilic interaction liquid chromatographyIE ionization energy
12
IP isopregnanolone (3β-hydroxy-5α-pregnen-20-one)5-HT serotoninLLE liquid-liquid extractionLOD limit of detectionMS mass spectrometryMS/MS tandem mass spectrometryMSTFA N-Methyl-N-(trimethylsilyl)trifluoroacetamideMT methyltestosterone (androst-4-en-3-one)NE norepinephrine (noradrenaline)NH4I ammonium iodidePA proton affinityPAPS 3’-phosphoadenosine 5’-phosphosulfatePREG pregnenolone (3β-hydroksipregn-5-en-20-one)17-OH-PREG 17-hydroxypregnenolone (3β,17α-dihydroxypregn-5-en-20-
one)PROG progesterone (pregn-4-en-3,20-dione)RP reversed-phase chromatographys.c. subcutaneousSPE solid-phase extractionSIM selected ion monitoringSRM selected reaction monitoringSULT sulfotransferaseT testosterone (17β-hydroksiandrost-4-en-3-oni)TMS trimethylsilyl5α-THDOC 5α-tetrahydrodeoxycorticosterone (3α,21-dihydroxy-5α-
pregnan-20-one)UDPGA Uridine 5’–diphospho glucuronic acidUGT UDP-glucuronosyltransferaseUHPLC/UPLC ultra-high pressure liquid chromatographyVUV vacuum ultraviolet
13
1 INTRODUCTION
Neurons (nerve cells) form the building blocks of the central nervous system(CNS). Together, the billions of neurons in the brain communicate and processinformation through highly organized networks. The nerve impulse istransferred from a neuron to another with the help of neurotransmitters,which are endogenous chemicals that transmit signals from a neuron to atarget cell across a synapse. Neurotransmitters are involved in maintaining thenormal function of the brain, such as sleep and consciousness, as well as insome brain disorders, such as Parkinson’s disease, epilepsy, schizophrenia,depression, anxiety, and dementia. The brain and the spinal cord togetherconstitute the CNS, which lies inside the skull and the vertebral canal. Aphysical and biochemical barrier, the blood-brain barrier (BBB) formed by thecapillary endothelial cells, prevents the access of many substances to the brain.Due to the BBB, the development of new drugs to target brain-related diseasesproves challenging, since the BBB prevents entry into the brain of most drugsand endogenous compounds from the blood. Only small lipophilic compoundscan diffuse passively through the BBB, while other compounds are usually onlyable to cross the BBB with the help of carrier proteins [1,2].
There are several groups of neurotransmitters with different chemicalstructures, including: monoamines (serotonin, 5-HT) and catecholamines(dopamine, DA and noradrenaline, NE), choline esters (acethylcholine, Ach),amino acids (glutamate, Glu and aspartate, Asp), γ-aminobutyric acid (GABA),peptides, and steroids [3]. As the neurotransmitters are involved both in thenormal and pathological conditions of the brain, it is essentially important todevelop methods by which they can be analyzed and quantitated in biologicalsamples.
1.1 NEUROTRANSMITTERS AND NEUROSTEROIDS
Most neurotransmitters are synthezised from precursors in the axon terminalsin the CNS, stored in vesicles and released to a synaptic cleft between thepresynaptic and postsynaptic neurons. To terminate the signal,neurotransmitters are removed from the synaptic cleft by active uptakemechanisms or they are enzymatically broken down. DA and 5-HT are two ofthe main monoamine neurotransmitters in the brain. 5-HT is involved in theregulation of several physiological functions, including the sleep-wake cycles,body temperature, blood pressure, perception of pain, hormonal functions ofthe hypothalamus, and psychological functions, such as depression andanxiety [4,5], while DA has a role in Parkinson’s disease, schizophrenia,depression, and the regulation of motoric movements [6,7].
INTRODUCTION
14
Neurosteroids are generally classified as steroids with local function in thebrain. They differ from other neurotransmitters in that they are lipid-solubleand can easily cross the BBB, and can therefore be formed in the brain in situor in the periphery [3,8]. Peripherally formed neurosteroids are thecorticosteroids, corticosterone (CORT) and aldosterone (A), as well astestosterone (T) and estradiol(E2); neurosteroids formed both in theperiphery and the CNS are progesterone (PROG), allopregnenolone (AP), andpregnenolone (PREG), while the neurosteroid dehydroepiandrosterone(DHEA) found in the CNS is formed locally in the CNS. Steroids formed in theperiphery with local function in the brain are sometimes called neuroactivesteroids, and only those formed in the brain in situ neurosteroids, but in thisthesis the term neurosteroid will be used for all steroids with local function inthe CNS. The neurosteroids exert their effects by binding to the intracellularnuclear steroid receptors, but also by interaction with neurotransmitter-gatedion channels and membrane steroid receptors [9–11]. Neurosteroids regulateseveral cerebral functions, including protein synthesis, gene activation, andactivity of the brain through the activation of gamma-aminobutyric acid(GABA) and N-methyl-D-aspartate (NMDA) receptors, as well as nicotinic,muscarinic and serotonergic receptors [11,12]. Neurodegenerative diseases havebeen shown to alter neurosteroid levels. In Alzheimer’s disease and multiplesclerosis, for example, the levels of neurosteroids are decreased in certainareas of the brain [13].
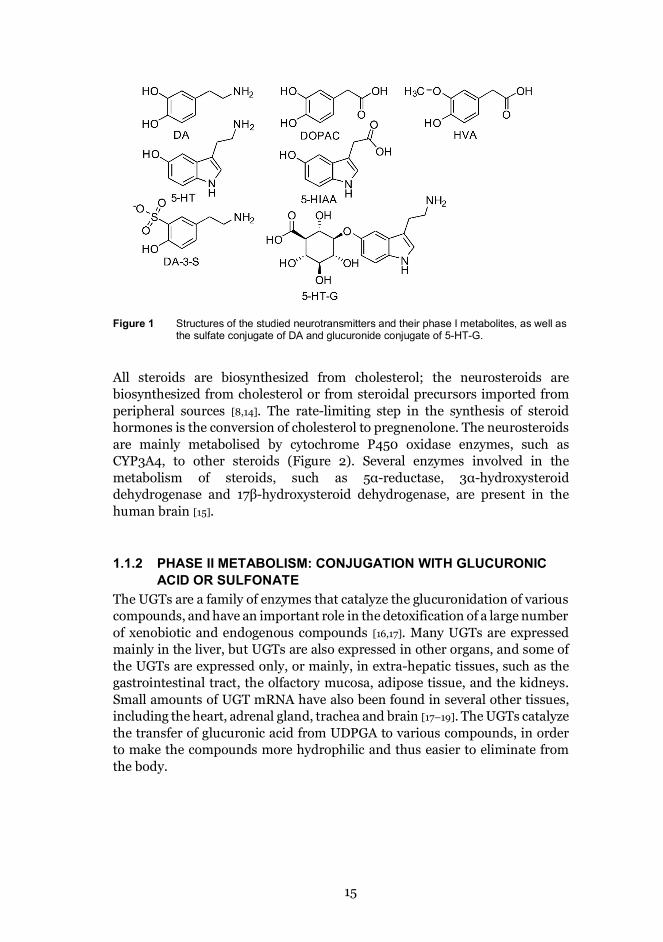
1.1.1 PHASE I METABOLISM5-HT is synthesized from the amino acid tryptophan, while the synthesis of DAstarts from tyrosine. Both DA and 5-HT are metabolized by monoamineoxidase (MAO) to the phase I metabolites 3,4-dihydroxyphenylacetic acid(DOPAC) and 5-hydroxyindoleacetic acid (5-HIAA), respectively. DOPAC isfurther metabolized to homovanillic acid (HVA) by catechol-O-methyltrasferase (COMT) (Figure 1). Both DA and 5-HT, and their respectivemetabolites, can undergo conjugation with glucuronic acid or sulfonatemediated by catalysis with UDP-glucuronosyltransferases (UGTs) andsulfotransferases (SULTs), respectively.
15
Figure 1 Structures of the studied neurotransmitters and their phase I metabolites, as well asthe sulfate conjugate of DA and glucuronide conjugate of 5-HT-G.
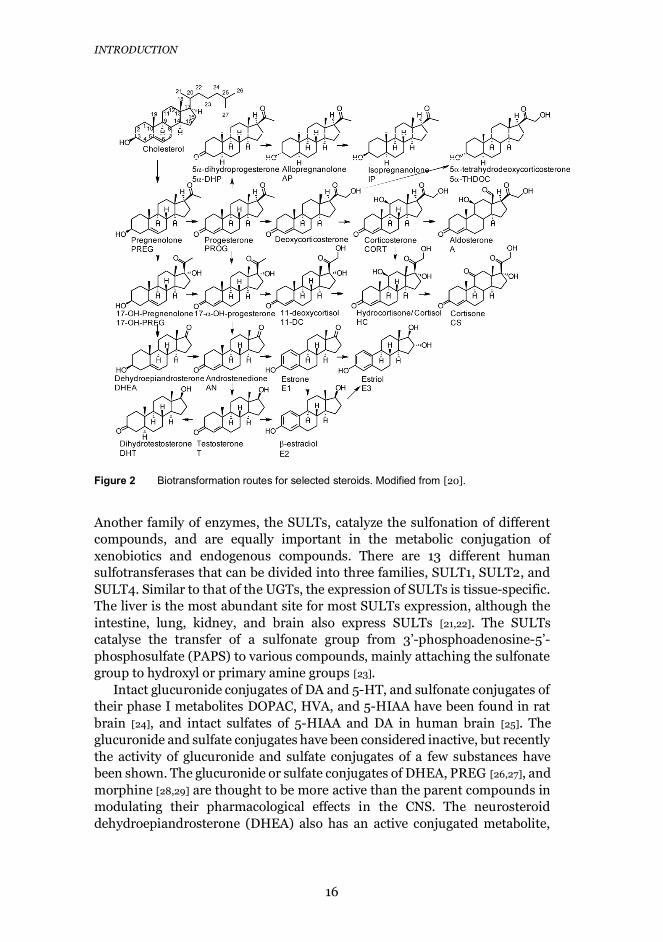
All steroids are biosynthesized from cholesterol; the neurosteroids arebiosynthesized from cholesterol or from steroidal precursors imported fromperipheral sources [8,14]. The rate-limiting step in the synthesis of steroidhormones is the conversion of cholesterol to pregnenolone. The neurosteroidsare mainly metabolised by cytochrome P450 oxidase enzymes, such asCYP3A4, to other steroids (Figure 2). Several enzymes involved in themetabolism of steroids, such as 5α-reductase, 3α-hydroxysteroiddehydrogenase and 17β-hydroxysteroid dehydrogenase, are present in thehuman brain [15].
1.1.2 PHASE II METABOLISM: CONJUGATION WITH GLUCURONICACID OR SULFONATE
The UGTs are a family of enzymes that catalyze the glucuronidation of variouscompounds, and have an important role in the detoxification of a large numberof xenobiotic and endogenous compounds [16,17]. Many UGTs are expressedmainly in the liver, but UGTs are also expressed in other organs, and some ofthe UGTs are expressed only, or mainly, in extra-hepatic tissues, such as thegastrointestinal tract, the olfactory mucosa, adipose tissue, and the kidneys.Small amounts of UGT mRNA have also been found in several other tissues,including the heart, adrenal gland, trachea and brain [17–19]. The UGTs catalyzethe transfer of glucuronic acid from UDPGA to various compounds, in orderto make the compounds more hydrophilic and thus easier to eliminate fromthe body.
INTRODUCTION
16
Figure 2 Biotransformation routes for selected steroids. Modified from [20].
Another family of enzymes, the SULTs, catalyze the sulfonation of differentcompounds, and are equally important in the metabolic conjugation ofxenobiotics and endogenous compounds. There are 13 different humansulfotransferases that can be divided into three families, SULT1, SULT2, andSULT4. Similar to that of the UGTs, the expression of SULTs is tissue-specific.The liver is the most abundant site for most SULTs expression, although theintestine, lung, kidney, and brain also express SULTs [21,22]. The SULTscatalyse the transfer of a sulfonate group from 3’-phosphoadenosine-5’-phosphosulfate (PAPS) to various compounds, mainly attaching the sulfonategroup to hydroxyl or primary amine groups [23].
Intact glucuronide conjugates of DA and 5-HT, and sulfonate conjugates oftheir phase I metabolites DOPAC, HVA, and 5-HIAA have been found in ratbrain [24], and intact sulfates of 5-HIAA and DA in human brain [25]. Theglucuronide and sulfate conjugates have been considered inactive, but recentlythe activity of glucuronide and sulfate conjugates of a few substances havebeen shown. The glucuronide or sulfate conjugates of DHEA, PREG [26,27], andmorphine [28,29] are thought to be more active than the parent compounds inmodulating their pharmacological effects in the CNS. The neurosteroiddehydroepiandrosterone (DHEA) also has an active conjugated metabolite,
17
DHEA sulfate, which is thought to be involved in several physiological andneuroprotective processes as well as in the regulation of the excretion ofcatecholamines [26]. The glucuronidation of steroids has been suggested tohave neuroprotective effects by eliminating high steroid concentrations thathave been linked, for instance, to breast cancer [30], and DA sulfonation hasbeen suggested to serve as a transport form of DA into cells, where free DAcould be regenerated [31].
1.2 ANALYSIS OF NEUROTRANSMITTERS
The concentration of neurotransmitters can be sampled directly in vivo fromdifferent parts of the brain using different techniques; microdialysis is themost common. Neurotransmission can also be studied in brain tissue, whichenables the study of different regions of the brain, but has to be performedpost mortem in most cases. In addition, cerebrospinal fluid (CSF) can also beanalyzed, but CSF concentrations reflect average concentrations accumulatedfrom all brain regions, and analysis of a specific brain area is not possible. Inanimal studies, often in rats, it is possible to select the appropriate matrixbased on the researcher’s needs. In humans, however, the use of ventricularCSF, brain tissue, or microdialysis of the extracellular fluid are possible onlyduring certain neurosurgical operations or post mortem. Lumbar puncture isthe most important and widely used diagnostic tool in the study of monoaminemetabolite concentrations in humans [32].
1.2.1 BRAIN EXTRACELLULAR FLUIDWhen neurotransmitters are released, a small fraction leaks out of the synapticclefts to the extracellular matrix. Thus, the concentration of aneurotransmitter in the extracellular fluid is a relatively reliable measure of aparticular neuronal activity [33]. The concentration of neurotransmitters inbrain extracellular fluid have been measured by different techniques.
Prior to the use of microdialysis, other in vivo techniques were employed,such as the cortical cup, which is a cylinder that is placed above a small hole inthe studied animal’s head, and enables sampling of chemicals released on thesurface of the cortex. The extracellular levels of AK, GABA, and Glu have beendetermined by the cortical cup method [34–36], but the drawback to thismethod is that it is limited to only a certain region of the brain.
In voltammetry, an electrode is placed in the tissue examined and thecurrent caused by oxidation of analytes is proportional to their concentration.Fast-scan cyclic voltammetry makes measurements of changes in theextracellular level of dopamine or other monoamines at millisecond timeresolution possible. The narrow probes (diameter 5–20 μm) cause minimaltissue damage, but the drawbacks are relatively poor sensitivity and selectivity.Voltammetric measurements are usually in the μM or high nM concentrations
INTRODUCTION
18
range, and thus do not allow assessment of basal levels [37]. The technique islimited to analytes that are electroactive and can be oxidized, such asmonoamines. Fast-scan cyclic voltammetry is a differential technique and thusonly changes in analyte concentration can be measured; the technique is notsuited for measuring long-term changes or constant basal concentrations [38].Another drawback to voltammetry is that no drugs or other substances can belocally applied in the tissue examined [39].
Push-pull perfusion can be considered to be a precursor to themicrodialysis technique. It includes two cannulas implanted in a certain brainregion, using an open flow system. Various substances can be sampled anddetected by this technique, and it has been used for sampling ofneurotransmitters and other endogenous substances. The push–pullperfusion method is an open system where the perfusion fluid directly contactsthe tissue under study at the tip. In earlier designs the size of the probe andthe flow at the tip often caused tissue damage or bacterial contamination atthe site of perfusion [40]. However, to overcome this problem, miniaturizedpush–pull cannulae have been constructed utilizing low nl/min flowrates forsuccessful analysis of Ach, 5-HT, DA, GABA, Glu, and Asp [41,42].
In microdialysis a cannula with a tip covered with a semipermeablemembrane is used. An advantage compared to the push-pull technique is thatthe perfusion fluid (artificial CSF) does not come directly into contact with theextracellular fluid. The dialysis membrane is permeable to small molecules butnot to macromolecules such as proteins. Endogenous compounds are sampledvia the probe, because the levels of neurotransmitters and metabolites arehigher in the extracellular space than in the perfusion fluid [43,44]. A drawbackof microdialysis is the fact that the recovery of the measured substances in themicrodialysis probe can be low and differ according to the dialyzed molecule.Due to the low flow rates used, time resolution is low, samples are usuallycollected in a time frame of 20-30 minutes [39,40]. The small sample volumesand the fact that the concentrations of most neurotransmitters are in the pMor low nM range leads to a demand for highly sensitive analysis techniques,such as LC-MS/MS.
Microdialysis has been largely used in the analysis of neurotransmittersand their metabolites in the central nervous system of laboratory animals,mainly in rats and mice [24,45–52]. In the human brain microdialysis has beenused to monitor neurointensive care patients with subarachnoid hemorrhage,traumatic brain injury, thromboembolic stroke, or epilepsy [53–56].Microdialysis of the human brain has also been performed in order to sampleextracellular dopamine in the human amygdala during the performance ofcognitive tasks in patients undergoing evaluation for epilepsy surgery [57],during thalamotomy intended to relieve tremor in patients with Parkinson'sdisease [58], in patients undergoing deep brain stimulation surgery foradvanced Parkinson’s disease [59], in patients with pharmacologicallyintractable seizures that underwent implantation of intracranial depthelectrodes [60], and in patients with severe head injuries or subarachnoid
19
haemorrhage, in which microdialysis probes were placed together with aventriculostomy catheter for drainage of CSF [61].
1.2.2 CEREBROSPINAL FLUIDIn addition to the brain extracellular fluid, neurotransmitters have commonlybeen analysed in the CSF, especially in humans [53,62–67]. CSF is producedmainly from arterial blood by the choroid plexuses of the lateral and fourthventricles of the brain. Around 80% of the CSF is secreted by the choroidplexuses, with the remaining 20% coming from the interstitial fluid of thebrain. The epithelial cells in the choroid plexuses, and the tight junctionsbetween them, form the blood-CSF barrier. At the blood-CSF barrier, sometransporter proteins similar to those at the BBB have been identified [1,68–70].
The monoamine metabolite concentrations in the CSF reflect averageconcentrations accumulated from all brain regions together with the regionalchanges that occur within the spinal cord. Some neurotransmitters, such as 5-HIAA and HVA, have a rostrocaudal gradient, i.e. the concentrations differdepending on the site of sampling and changes if multiple samples are drawnfrom the lumbar section [32,71,72]. The CSF contains several proteins that canalso be found in plasma, such as albumin, although at smaller concentrations[69,73].
1.2.3 SAMPLE PRETREATMENTNeurotransmitters such as serotonin, dopamine, and their metabolites aresmall hydrophilic compounds, and have thus been analysed mostly by analysistechniques based on liquid chromatography with electrochemical or massspectrometric detection.
Microdialysis samples require virtually no pretreatment, but if MSdetection is used, the inorganic salts of the artificial CSF used as perfusionfluid have to be prevented from entering the mass spectrometer, as they mightcause ion suppression [43]. As CSF samples contain proteins, they have to beremoved prior to analysis by liquid chromatography, usually by proteinprecipitation and centrifugation [32,67,74] or by ultrafiltration [25,75–77].Concerning brain tissue samples, the matrix is much more complicated andcontains, for example, several different lipids, that might clog the analyticalHPLC column and suppress ionization in mass spectrometry (ESI) [55,78].Neurotransmitters are often extracted from brain tissue by homogenization ofthe sample and denaturing of proteins followed by analysis of the supernatant,usually after centrifugation and/or filtration [79–82], liquid-liquid extraction(LLE) [83], or solid-phase extraction (SPE) [84,85].
INTRODUCTION
20
1.2.4 LIQUID CHROMATOGRAPHY – MASS SPECTROMETRYLiquid chromatography using reversed-phase (RP) columns, most commonlyC-18-columns, have previously been widely used [45,49,50,80–83,85–89]. Since themonoamines are polar molecules with low molecular weights, they are poorlyretained in reversed chromatography. Ion-pair agents such as sodium octylsulfate are generally employed in the mobile phase in order to increaseretention times of polar analytes such as DA and 5-HT. However, theseadditives are not volatile, and therefore not compatible with MS detection. Thephase II metabolites of the neurotransmitters are even more hydrophilic thanthe unconjugated parent compounds, and therefore hydrophilic-interation(HILIC) [42] or pentafluorophenyl-propyl columns have been utilized morerecently in the analysis of intact phase II metabolites [24,25,47,48].
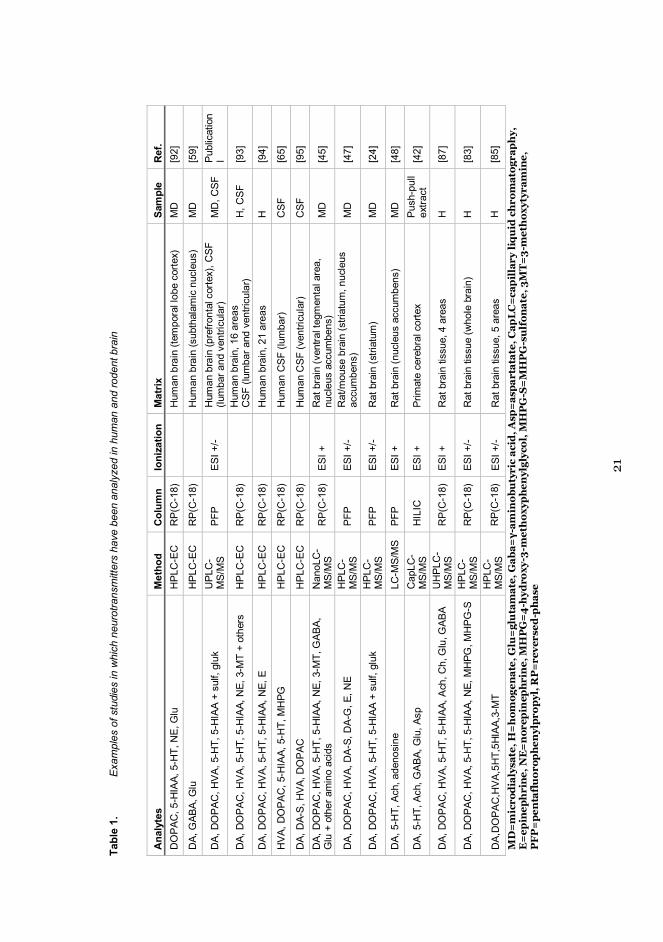
Mass spectrometric (MS) methods have become more common inneurotransmitter analysis, mostly coupled to high-pressure liquidchromatography (HPLC) or ultra-high pressure chromatography (UHPLC),utilizing atmospheric pressure ionization(API), usually electrospray (ESI)which is most suitable for polar compounds (Table 1). Since neurotransmittersare present in the brain at very low levels, usually triple quadrupoles inselective reaction monitoring (SRM) mode have been used, either in positiveor negative mode [24,25,42,47,83,87]. Analysis of neurotransmitters by MS usuallydoes not require derivatization, but derivatisation with benzoyl chloride [45] ordeuterated acetaldehyde [90] has been used prior to analysis by LC-MS/MS toimprove sensitivity and selectivity. A major advantage of MS using ESI is thatthe analysis of intact phase II conjugates (glucuronide and sulfonateconjugates) of neurotransmitters is possible [24,25,47].
1.2.5 OTHER DETECTORSIn addition to mass spectrometry, neurotransmitters are often analysed usingother detectors, such as ultraviolet (UV), electrochemical (EC), andfluorimetric (FL) detection. As monoamine neurotransmitters are easilyoxidized, electrochemical (EC) detection has been widely used (Table 1) [46,49–
51,80,81,89]. EC detection is a form of voltammetry, and is based on the oxidation(or reduction) of the analytes in the mobile phase. EC is generally moresensitive than UV detection, and has thus been more widely used inneurotransmitter analysis.
Also fluorometric detection is generally more sensitive than UV detection,but often requires derivatization of the analyte with a fluorophore-containingreagent. For DA fluorometric detection utilizing derivatisation withdiphenylethylenediamine has been proved more sensitive than UV detection[86], and also other monoamine neurotransmitters have been analysed withfluorescence detection, usually after derivatization [62,63,88,91] or utilizing theirnative fluorescence [82].
21
Tabl
e 1.
Exa
mpl
es o
f stu
dies
in w
hich
neu
rotra
nsm
itter
s ha
ve b
een
anal
yzed
in h
uman
and
rode
nt b
rain
Ana
lyte
sM
etho
dC
olum
n Io
niza
tion
Mat
rixSa
mpl
e R
ef.
DO
PAC
, 5-H
IAA,
5-H
T, N
E, G
luH
PLC
-EC
R
P(C
-18)
Hum
an b
rain
(tem
pora
l lob
e co
rtex)
MD
[92]
DA,
GAB
A, G
luH
PLC
-EC
R
P(C
-18)
Hum
an b
rain
(sub
thal
amic
nuc
leus
)M
D[5
9]
DA,
DO
PAC
, HVA
, 5-H
T, 5
-HIA
A +
sul
f, gl
ukU
PLC
-M
S/M
SPF
PES
I +/-
Hum
an b
rain
(pre
front
al c
orte
x), C
SF(lu
mba
r and
ven
tricu
lar)
MD
, CSF
Publ
icat
ion
I
DA,
DO
PAC
, HVA
, 5-H
T, 5
-HIA
A, N
E, 3
-MT
+ ot
hers
HPL
C-E
C
RP(
C-1
8)H
uman
bra
in, 1
6 ar
eas
CSF
(lum
bar a
nd v
entri
cula
r)H
, CSF
[93]
DA,
DO
PAC
, HVA
, 5-H
T, 5
-HIA
A, N
E, E
HPL
C-E
C
RP(
C-1
8)H
uman
bra
in, 2
1 ar
eas
H[9
4]
HVA
, DO
PAC
, 5-H
IAA,
5-H
T, M
HPG
HPL
C-E
C
RP(
C-1
8)H
uman
CSF
(lum
bar)
CSF
[65]
DA,
DA-
S, H
VA, D
OPA
CH
PLC
-EC
R
P(C
-18)
Hum
an C
SF (v
entri
cula
r)C
SF[9
5]D
A, D
OPA
C, H
VA, 5
-HT,
5-H
IAA,
NE,
3-M
T, G
ABA,
Glu
+ o
ther
am
ino
acid
sN
anoL
C-
MS/
MS
RP(
C-1
8)
ESI +
Rat
bra
in (v
entra
l teg
men
tal a
rea,
nucl
eus
accu
mbe
ns)
MD
[45]
DA,
DO
PAC
, HVA
, DA-
S, D
A-G
, E, N
EH
PLC
-M
S/M
SPF
PES
I +/-
Rat
/mou
se b
rain
(stri
atum
, nuc
leus
accu
mbe
ns)
MD
[47]
DA,
DO
PAC
, HVA
, 5-H
T, 5
-HIA
A +
sul
f, gl
ukH
PLC
-M
S/M
SPF
PES
I +/-
Rat
bra
in (s
triat
um)
MD
[24]
DA,
5-H
T, A
ch, a
deno
sine
LC-M
S/M
S PF
PES
I +R
at b
rain
(nuc
leus
acc
umbe
ns)
MD
[48]
DA,
5-H
T, A
ch, G
ABA,
Glu
, Asp
Cap
LC-
MS/
MS
HIL
ICES
I +Pr
imat
e ce
rebr
al c
orte
xPu
sh-p
ull
extra
ct[4
2]
DA,
DO
PAC
, HVA
, 5-H
T, 5
-HIA
A, A
ch, C
h, G
lu, G
ABA
UH
PLC
-M
S/M
SR
P(C
-18)
ES
I +R
at b
rain
tiss
ue, 4
are
asH
[87]
DA,
DO
PAC
, HVA
, 5-H
T, 5
-HIA
A, N
E, M
HPG
, MH
PG-S
HPL
C-
MS/
MS
RP(
C-1
8)
ESI +
/-R
at b
rain
tiss
ue (w
hole
bra
in)
H[8
3]
DA,
DO
PAC
,HVA
,5H
T,5H
IAA,
3-M
TH
PLC
-M
S/M
SR
P(C
-18)
ESI +
/-R
at b
rain
tiss
ue, 5
are
asH
[85]
MD
=m
icro
dia
lysa
te,H
=h
omog
enat
e, G
lu=
glu
tam
ate,
Gab
a=γ-
amin
obu
tyri
c ac
id, A
sp=
aspa
rtat
ate,
Cap
LC
=ca
pil
lary
liq
uid
ch
rom
atog
rap
hy,
E=
epin
eph
rin
e, N
E=
nor
epin
eph
rin
e, M
HP
G=
4-h
ydro
xy-3
-met
hox
yph
enyl
glyc
ol, M
HP
G-S
=M
HP
G-s
ulf
onat
e, 3
MT
=3-
met
hox
ytyr
amin
e,P
FP
=pe
nta
flu
orop
hen
ylpr
opyl
, RP
=re
vers
ed-p
has
e
INTRODUCTION
22
1.3 ANALYSIS OF NEUROSTEROIDS
In contrast to the hydrophilic neurotransmitters, neurosteroids are lipophiliccompounds and have traditionally been analysed mostly by gaschromatography – mass spectrometry (GC-MS). However, LC-MS techniqueshave also become more common in neurosteroid analysis as they allow theanalysis of intact steroid conjugates. Additionally, steroids can be analysed byUV detection, and also fluorescence detection after derivatisation has beenperformed [96].
1.3.1 MATRIXESAs steroids are lipophilic compounds, microdialysis is not suitable forsampling of neurosteroids, and therefore they are often analysed in CSF [97–
101]. The levels of neurosteroids in CSF have been shown to correlate with levelsin the brain [98]. Due to their lipophilic properties, neurosteroids can permeatethe BBB, and therefore analysis in matrixes other than the brain is alsopossible. In addition to CSF, neurosteroids have often been analysed in plasma[102–105]. Several factors affect neurosteroid levels, such as stress, sex, andhealth status.
Steroids are commonly extracted from biological matrixes by LLEextraction using diethyl ether or dichloromethane as the organic phase, or SPEextraction on a C-18 phase, or a combination of these [106,107]. As conjugatedsteroids cannot be analysed by GC-MS, they are commonly hydrolyzed priorto analysis enzymatically by the enzymatic extract from the snail H. Pomatia,which contains both glucuronidase and sulfatase activity [108], or by β-glucuronidase derived from Escherichia coli [109], chemically [13,110], or directlyby derivatization, which causes simultaneous deconjugation [111].
1.3.2 GC-MSGas chromatographic analysis of steroids usually requires derivatisation toimprove the thermal stability and volatility of the analytes. After hydrolysis ofany conjugates, the remaining polar groups are commonly derivatised, mostlyby silylation to trimethylsilyl (TMS) conjugates prior to GC-MS analysis[10,112]. Traditional GC-MS methods have utilized ionization in vacuum, suchas electron impact (EI) or chemical ionisation (CI). Electron ionization (EI),which is commonly used in the GC-MS analysis of steroids, provides highsensitivity and reproducible spectra for all types of compounds, and it enablesthe use of EI spectral libraries [101,113–115]. However, EI is an energeticionization technique, and many compounds such as the relatively labilederivatives of steroids are strongly fragmented and the formation of molecularions is weak. CI provides less energetic ionization for steroids, and both
23
positive CI [116,117] and negative CI [98,118,119] have been successfully used in theanalysis of steroids by GC-MS.
1.3.3 LC-MSLC-MS is increasingly favored as it allows the analysis of intact steroids andtheir conjugates without derivatization or hydrolysis of the conjugates [120]. Allthe common atmospheric pressure ionization techniques, i.e., ESI [121,122],atmospheric pressure chemical ionization (APCI) [123,124], and atmosphericpressure photoionization (APPI) [125–127], have been applied in the analysis ofsteroids by LC-MS. Since the ionization efficiency of ESI is relatively low fornonpolar steroids, these are often derivatized, e.g. with hydroxylamine, toachieve sufficient sensitivity. On the other hand, ESI enables the analysis ofintact conjugates, such as glucuronides and sulfates [101,128]. APCI, and moreparticularly APPI, provide better ionization efficiency than ESI for nonpolarsteroids, and high sensitivity can be achieved without the need forderivatization. However, APCI and APPI are more energetic ionizationprocesses than ESI, and conjugates are usually cleaved during the ionization[128,129].
Despite the advantages of LC-MS techniques, GC-MS continues to bewidely used in the analysis of steroids, despite the need for derivatization andhydrolysis. GC-MS is more robust than LC-MS, and although LC methods arecompatible with atmospheric pressure ionisation, the resolving power of GCstill exceeds that of LC, giving it an advantage in the separation of steroidisomers, for example. Thus the coupling of GC to API ionization is of highinterest.
1.3.4 COUPLING GC TO API MASS SPECTROMETRY
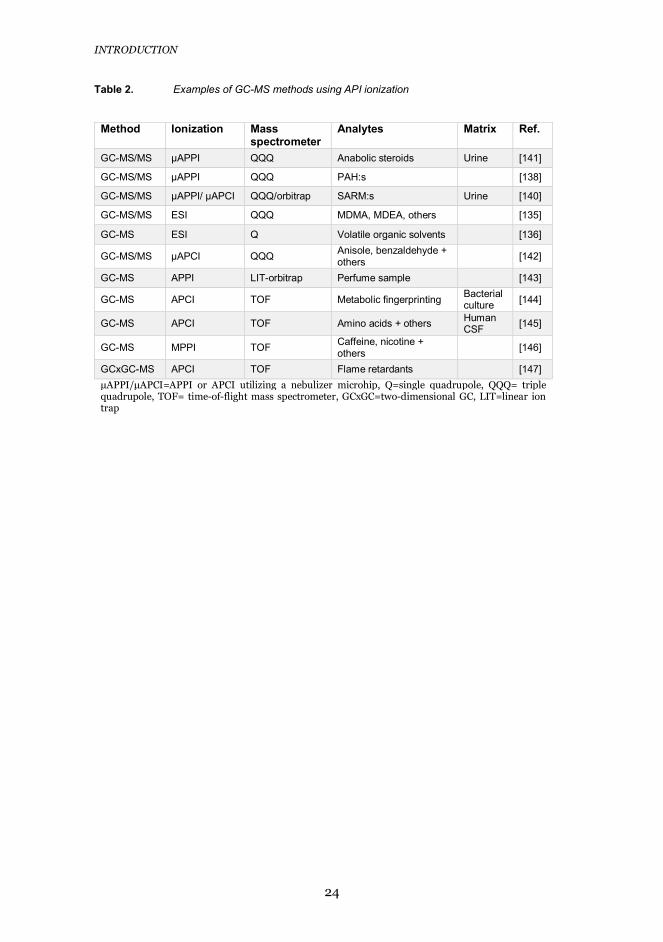
As early as 1973, Horning et al. [130] interfaced GC to MS by using a 63Ni APCIsource. Later, APCI with a corona discharge needle [131], APPI [132–134], ESI[135,136], and plasma ionization [137] have been successfully used in theinterfacing of GC to MS. Commercially available GC-APCI-MS interfaces arealso available nowadays. Our group has developed miniaturized APCI (μAPCI)and APPI (μAPPI) GC-MS interfaces utilizing microfabricated, heatednebulizer microchips and their potential in the analysis of steroids, polycyclicaromatic hydrocarbons, amphetamines, polychlorinated biphenyls, andselective androgen receptor modulators (SARMs) has been demonstrated(Table 2) [138–141]. However, the fabrication of heated nebulizer microchipsrequires advanced microfabrication technology and clean-room facilities, andtherefore we wanted to combine GC to MS via an APPI interface constructedfrom simple commercially available hardware.
INTRODUCTION
24
Table 2. Examples of GC-MS methods using API ionization
Method Ionization Massspectrometer
Analytes Matrix Ref.
GC-MS/MS μAPPI QQQ Anabolic steroids Urine [141]
GC-MS/MS μAPPI QQQ PAH:s [138]
GC-MS/MS μAPPI/ μAPCI QQQ/orbitrap SARM:s Urine [140]
GC-MS/MS ESI QQQ MDMA, MDEA, others [135]
GC-MS ESI Q Volatile organic solvents [136]
GC-MS/MS μAPCI QQQ Anisole, benzaldehyde +others [142]
GC-MS APPI LIT-orbitrap Perfume sample [143]
GC-MS APCI TOF Metabolic fingerprinting Bacterialculture [144]
GC-MS APCI TOF Amino acids + others HumanCSF [145]
GC-MS MPPI TOF Caffeine, nicotine +others [146]
GCxGC-MS APCI TOF Flame retardants [147]μAPPI/μAPCI=APPI or APCI utilizing a nebulizer microhip, Q=single quadrupole, QQQ= triplequadrupole, TOF= time-of-flight mass spectrometer, GCxGC=two-dimensional GC, LIT=linear iontrap
25
2 AIMS OF THE STUDY
The aim of this work was to develop sensitive and specific mass spectrometricmethods for the analysis of neurotransmitters and their glucuronide andsulfate conjugates in microdialysis and cerebrospinal fluid samples.Additionally, a quantitative method for the analysis of neurosteroids inbiological samples was developed.
The more detailed aims were: to develop and validate a quantitative UPLC-MS/MS methods for the
analysis of human brain microdialysates and CSF samples (I) to develop an UPLC-MS/MS method for the analysis of intact
neurotransmitter glucuronides and sulfates (I) to evaluate whether the sulfate conjugates of dopamine (DA-3- and DA-
4-S) are able to permeate the blood-brain barrier (IV) to develop a sensitive and quantitative GC-MS/MS method for the
analysis of neurosteroids by coupling of GC to atmospheric pressurephotoionization (II, III)
MATERIALS AND METHODS
26
3 MATERIALS AND METHODS
3.1 CHEMICALS
All chemicals used in this study were analytical or chromatographic grade. Thestructures of the compounds studied are shown in figures 1 and 2.
3.2 SAMPLES AND PRETREATMENT PROCEDURES
3.2.1 HUMAN BRAIN MICRODIALYSIS SAMPLESHuman brain microdialysis samples (publication I) were obtained from theNeurointensive care unit of the Uppsala University Hospital from two patientswith acute brain injuries (subarachnoid hemorrhage). Altogether 172 fractionswere collected from a female patient, aged 71 years (patient 1). The samplevolume was about 5-10 μL per fraction, collected in a time-resolved mode fromday 1-8. The other patient was also female, aged 50 years (patient 2); 132fractions of similar volume were collected from patient 2 in a time-resolvedmode from day 1-6. Both patients had a decreased level of consciousness, wereintubated and received artificial ventilation. Intracerebral microdialysissampling was initiated in conjunction with the insertion of an ICP monitoringdevice through microdialysis catheters inserted via a bur hole placed 1–2 cmanterior to the coronal suture.
Microdialysis catheters with a membrane length of 10 mm and a 20 kDanominal molecular weight cut-off polyamide membrane (70 BrainMicrodialysis Catheter; M Dialysis AB, Solna, Sweden) were used. The outflowhydrostatic pressure of the perfusion system was set at the zero mid-cranialreference level by taping the collecting vials next to the bandage on thepatient’s head. Perfusion of the catheters was performed using artificial CSF(Perfusion Fluid CNS, M Dialysis AB), containing NaCl 147 mM, CaCl2 1.7mM, KCl 2.7 mM, MgCl 0.85 mM, total chloride contents 153.8 mM,osmolarity 305 mOsm/kg), delivered at a rate of 0.3 μL/min by using amicrodialysis pump (106 MD Pump, M Dialysis AB). At least 2 hours passedbetween insertion of the probe and the start of sampling to allow fornormalization of changes due to probe insertion. The samples were stored at -70°C until the analysis. The samples were injected as such and theneurotransmitters and their glucuronide and sulfate conjugate contents weremeasured.
The sampling was approved by the Regional Research Ethics Committee atUppsala University, and a written informed consent was obtained from thepatient or the patient's closest relative, in case the patient was unconscious.
27
3.2.2 HUMAN CEREBROSPINAL FLUID SAMPLESHuman ventricular cerebrospinal fluid samples (publication I) were obtainedfrom the Department of Neurosurgery at Helsinki University Central Hospital.The samples were obtained by ventriculostomy, and approximately 10 mL ofventricular CSF was obtained from each patient. The patients were beingtreated in the neurosurgical intensive care unit for obstructive hydrocephalus.The patients were an 82-year old male with a cerebellar infarct (patient 3), a46-year old female with subarachnoid hemorrhage (patient 4), a 35-year oldmale with a cerebellar infarct (patient 5), and a 55-year old female with atumor (patient 6). The samples were taken from CSF waste accumulatedduring therapeutic CSF drainage (appr. 200 ml/day/patient). Since thesamples were taken from CSF waste and were going to be discarded as a partof the clinical routine, no informed consent from the patients or the next of kinwas deemed necessary.
A pool of CSF from 200 subjects, all without a neurologic or psychiatricdisease, most who underwent lumbar puncture for non-diagnostic reasons andwho had normal CSF clinical laboratory values, was obtained from theNeurointensive care unit at the Uppsala University Hospital (publication I).Ages of the patients ranged from 16 to 65 years with a median of 44 years;50:50 female: male. These samples were collected on ice and cells wereremoved by centrifugation. Approval for the conduct of this study wasobtained from the local Ethics Committee at Uppsala University as well asGöteborg University, Sweden. The participants provided their writteninformed consent to participate in this study. A written informed consent wasobtained from the next of kin, caretaker, or guardian on the behalf ofparticipants that were not able to sign the informed consent themselves. Theethics committees approved of this consent procedure.
All CSF samples were kept at -70 °C until analysis. After thawing, thesamples were ultrafiltered by centrifugation (Millipore Amicon Ultrafree-MC,30 000 NMWL : 12 000 g, 15 min), and the filtrate was injected as such. AllCSF samples were analyzed in triplicate.
3.2.3 RAT BRAIN MICRODIALYSIS SAMPLESRat brain microdialysis samples (publication IV) were obtained from Wistarrats at 8-12 weeks of age. The rats were housed in groups of four to five percage and had free access to chow and water. They were maintained under a12:12 h light/dark cycle with lights on from 06:00 to 18:00 at an ambienttemperature of 20-22 °C before the experiments.
The animals were implanted with a guide cannula (BAS MD-2250,Bioanalytical Systems Inc., IN) using a stereotaxic device (Stoelting, WoodDale, IL) under isoflurane anesthesia (4.5 % during induction for 5 min andthen 3.5 % during surgery). The guide cannula was aimed above the rat dorsalstriatum (A/P +1.0, L/M 2.7, D/V-6.0) according to the atlas by Paxinos andWatson [148]. The cannula was fastened to the skull with dental cement
MATERIALS AND METHODS
28
(Aqualox, Voco, Germany). A microdialysis probe (BAS MD-2200, 2 mmmembrane, Bioanalytical Systems Inc., IN) was inserted into the striatumthrough the guide cannula on the morning of the experimental day. Theprotocols were approved by the National Animal Experiment Board ofFinland.
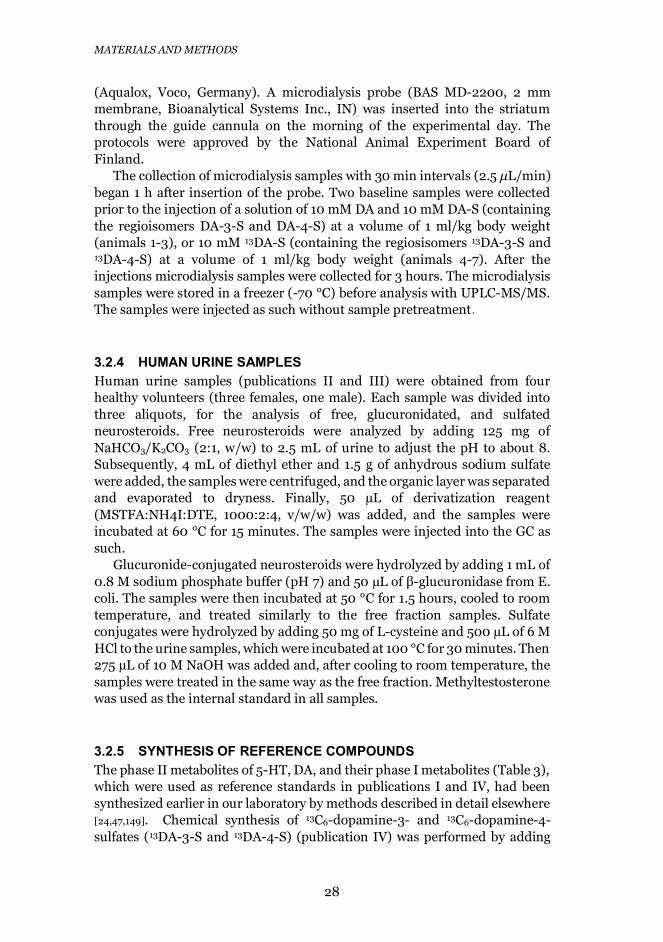
The collection of microdialysis samples with 30 min intervals (2.5 μL/min)began 1 h after insertion of the probe. Two baseline samples were collectedprior to the injection of a solution of 10 mM DA and 10 mM DA-S (containingthe regioisomers DA-3-S and DA-4-S) at a volume of 1 ml/kg body weight(animals 1-3), or 10 mM 13DA-S (containing the regiosisomers 13DA-3-S and13DA-4-S) at a volume of 1 ml/kg body weight (animals 4-7). After theinjections microdialysis samples were collected for 3 hours. The microdialysissamples were stored in a freezer (-70 °C) before analysis with UPLC-MS/MS.The samples were injected as such without sample pretreatment.
3.2.4 HUMAN URINE SAMPLESHuman urine samples (publications II and III) were obtained from fourhealthy volunteers (three females, one male). Each sample was divided intothree aliquots, for the analysis of free, glucuronidated, and sulfatedneurosteroids. Free neurosteroids were analyzed by adding 125 mg ofNaHCO3/K2CO3 (2:1, w/w) to 2.5 mL of urine to adjust the pH to about 8.Subsequently, 4 mL of diethyl ether and 1.5 g of anhydrous sodium sulfatewere added, the samples were centrifuged, and the organic layer was separatedand evaporated to dryness. Finally, 50 μL of derivatization reagent(MSTFA:NH4I:DTE, 1000:2:4, v/w/w) was added, and the samples wereincubated at 60 °C for 15 minutes. The samples were injected into the GC assuch.
Glucuronide-conjugated neurosteroids were hydrolyzed by adding 1 mL of0.8 M sodium phosphate buffer (pH 7) and 50 μL of β-glucuronidase from E.coli. The samples were then incubated at 50 °C for 1.5 hours, cooled to roomtemperature, and treated similarly to the free fraction samples. Sulfateconjugates were hydrolyzed by adding 50 mg of L-cysteine and 500 μL of 6 MHCl to the urine samples, which were incubated at 100 °C for 30 minutes. Then275 μL of 10 M NaOH was added and, after cooling to room temperature, thesamples were treated in the same way as the free fraction. Methyltestosteronewas used as the internal standard in all samples.
3.2.5 SYNTHESIS OF REFERENCE COMPOUNDSThe phase II metabolites of 5-HT, DA, and their phase I metabolites (Table 3),which were used as reference standards in publications I and IV, had beensynthesized earlier in our laboratory by methods described in detail elsewhere[24,47,149]. Chemical synthesis of 13C6-dopamine-3- and 13C6-dopamine-4-sulfates (13DA-3-S and 13DA-4-S) (publication IV) was performed by adding

29
cold concentrated H2SO4 (200 μL) to 20 mg of 13C6-DA HCl. The reactionmixture was kept in ice for 20 minutes and then pipetted over 1 mL of frozenwater. The pH of the reaction mixture was adjusted to 3 with 5 M NaOH. Thesulfates were fractionated, evaporated to dryness under vacuum, lyophilizedand reconstituted in Ringer’s solution. The synthesis process is described inmore detail in publication IV.
3.2.6 UGT EXPERIMENTSThe glucuronidation activity of 19 human UGTs of subfamilies 1A, 2A, and 2Bwere screened towards 5-HT and HVA (Publication I). All UGTs used had beenexpressed in our laboratory as described earlier [150–152]. Glucuronidationactivities were determined with 2 mM 5-HT or HVA, and 5 mM UDPGA, 50mM phosphate buffer pH 7.4 and 10 mM MgCl2, and the samples wereincubated at 37 °C for 60 min. All UGTs were screened as duplicates, exceptfor 5-HT as a substrate for 2B15, which was analyzed as a single sample andshowed no activity. Negative control samples, including all the reaction assaycomponents, with the exception of UDPGA, were also analyzed.
3.3 ANALYTICAL METHODS AND INSTRUMENTATION
3.3.1 LIQUID CHROMATOGRAPHY-MASS SPECTROMETRYThe UPLC used for the analysis of microdialysis and CSF samples was anAquity UPLC (Waters, Milford, MA). The column used was apentafluorophenyl column (Thermo Scientific Gold PFP Hypersil, 2.1 x 150mm, 1.9 μm). Detailed conditions are listed in Table 3.
An Agilent 6410 triple-quadrupole mass spectrometer (AgilentTechnologies, Santa Clara, CA) equipped with an electrospray ion source wasused as the detector in all analyses. Nitrogen (Parker Balston N2-22 nitrogengenerator, Parker Hannifin Corporation, Haverhill) was used as the nebulizer(40 psi), curtain (12 L/min, 350 °C), and collision gas. The fragmentor voltagesand collision energies were optimized for each compound, and AgilentMassHunter software versions B.04.00 or B.06.00 (quantitative data analysis)and B.03.01 or B.05.00 (qualitative data analysis) were used for dataacquisition and processing.
MATERIALS AND METHODS
30
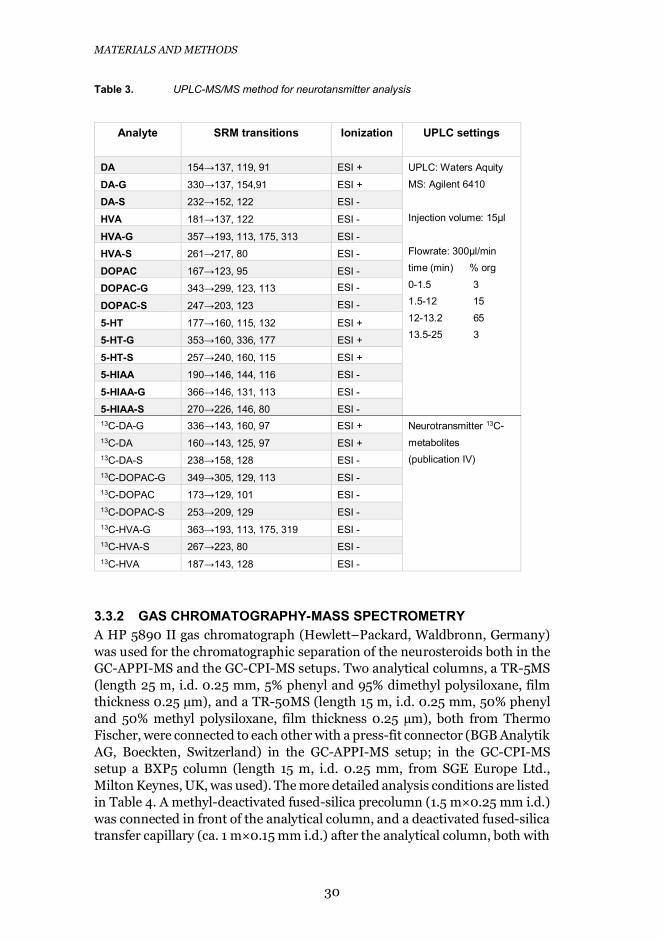
Table 3. UPLC-MS/MS method for neurotansmitter analysis
Analyte SRM transitions Ionization UPLC settings
DA 154→137, 119, 91 ESI + UPLC: Waters AquityMS: Agilent 6410
Injection volume: 15μl
Flowrate: 300μl/mintime (min) % org0-1.5 31.5-12 1512-13.2 6513.5-25 3
DA-G 330→137, 154,91 ESI +
DA-S 232→152, 122 ESI -
HVA 181→137, 122 ESI -
HVA-G 357→193, 113, 175, 313 ESI -
HVA-S 261→217, 80 ESI -
DOPAC 167→123, 95 ESI -
DOPAC-G 343→299, 123, 113 ESI -
DOPAC-S 247→203, 123 ESI -
5-HT 177→160, 115, 132 ESI +
5-HT-G 353→160, 336, 177 ESI +
5-HT-S 257→240, 160, 115 ESI +
5-HIAA 190→146, 144, 116 ESI -
5-HIAA-G 366→146, 131, 113 ESI -
5-HIAA-S 270→226, 146, 80 ESI -13C-DA-G 336→143, 160, 97 ESI + Neurotransmitter 13C-
metabolites(publication IV)
13C-DA 160→143, 125, 97 ESI +13C-DA-S 238→158, 128 ESI -13C-DOPAC-G 349→305, 129, 113 ESI -13C-DOPAC 173→129, 101 ESI -13C-DOPAC-S 253→209, 129 ESI -13C-HVA-G 363→193, 113, 175, 319 ESI -13C-HVA-S 267→223, 80 ESI -13C-HVA 187→143, 128 ESI -
3.3.2 GAS CHROMATOGRAPHY-MASS SPECTROMETRYA HP 5890 II gas chromatograph (Hewlett–Packard, Waldbronn, Germany)was used for the chromatographic separation of the neurosteroids both in theGC-APPI-MS and the GC-CPI-MS setups. Two analytical columns, a TR-5MS(length 25 m, i.d. 0.25 mm, 5% phenyl and 95% dimethyl polysiloxane, filmthickness 0.25 μm), and a TR-50MS (length 15 m, i.d. 0.25 mm, 50% phenyland 50% methyl polysiloxane, film thickness 0.25 μm), both from ThermoFischer, were connected to each other with a press-fit connector (BGB AnalytikAG, Boeckten, Switzerland) in the GC-APPI-MS setup; in the GC-CPI-MSsetup a BXP5 column (length 15 m, i.d. 0.25 mm, from SGE Europe Ltd.,Milton Keynes, UK, was used). The more detailed analysis conditions are listedin Table 4. A methyl-deactivated fused-silica precolumn (1.5 m×0.25 mm i.d.)was connected in front of the analytical column, and a deactivated fused-silicatransfer capillary (ca. 1 m×0.15 mm i.d.) after the analytical column, both with
31
press-fit connectors. The carrier gas was 99.996% pure helium (AGA, Espoo,Finland) with 150 kPa column pressure.
3.3.2.1 GC-APPI-MS interfaceThe fused-silica transfer capillary connected after the analytical column wasfed through a stainless steel (SS) T-piece placed inside the GC oven and thenthrough a SS capillary (i.d. 0.5 mm) acting as transfer line to the MS. The SStransfer line was connected to the SS T-piece and heated to 330 oC with a self-made resistance wire heater. Nitrogen was used as an auxiliary gas at 80mL/min. Chlorobenzene, used as dopant, was pumped with a syringe pump(PHD 2000; Harvard Apparatus, Holliston, MA) at a flow rate of 3.5 μL/min,vaporized, and mixed with the nitrogen flow. The nitrogen–dopant gasmixture was led through 1/16” o.d. SS tubing into the T-piece, and coaxiallythrough the heated transfer line to the APPI source. The tip of the fused silicatransfer capillary from the GC was positioned with a zyx-manipulator(Proxeon Biosystems A/S, Odense, Denmark) ca. 5-10 mm in front of the tipof the MS extended capillary.
The Agilent 6410 triple-quadrupole mass spectrometer was also used as thedetector in this study, now utilizing APPI ionization. The MS was equippedwith a commercial extended transfer capillary (KR Analytical Ltd., Sandbach,UK). Nitrogen was used as curtain (12 L/min, 350 °C) and collision gas. Thefragmentor voltages and collision energies were optimized for each compound.Ionizing 10 eV photons were generated by a krypton rf discharge vacuumultraviolet (VUV) lamp (PKR 100, Heraeus Noblelight Analytics Ltd.,Cambridge, UK). SRM transitions and the GC temperature program are shownin Table 4.
3.3.2.2 GC-CPI-MSThe CPI device consisted of a 1.5 mm i.d. stainless steel (SS) capillary (calledCPI capillary) with a 1 mm wide and 15 mm long opening, a flat SS plate witha similar opening hard-soldered on the capillary, a 3 mm thick MgF2 window(Thorlabs Sweden AB, Goteborg, Sweden), a top plate with an 18 mm circularopening, and Teflon rings used as seals to hold the MgF2 window in place. Thecapillary (bottom) side of the setup was painted with heat-resistant black paintand heated with IR radiation from a halogen lamp driven by a DC powersupply (ISO-TECH IPS2010, RS Components, Northants, U.K.). The injectionend of the CPI capillary was heated with a resistance wire heater, also drivenby a DC power supply (ISO-TECH IPS603, RS Components). An rf-excited 10eV (124 nm) krypton discharge vacuum ultraviolet (VUV) lamp (PKR 100,Heraeus Noblelight Analytics Ltd., Cambridge, U.K.) was used to initiatephotoionization.
MATERIALS AND METHODS
32
The mass spectrometer in the CPI experiments was an Agilent 6330 iontrap MS (Agilent Technologies, Santa Clara, CA) with a commercial capillaryextension (KR Analytical Ltd., Sandbach, U.K.). The CPI setup was connectedto the capillary extensionby inserting the extension a few millimeters into theCPI capillary.
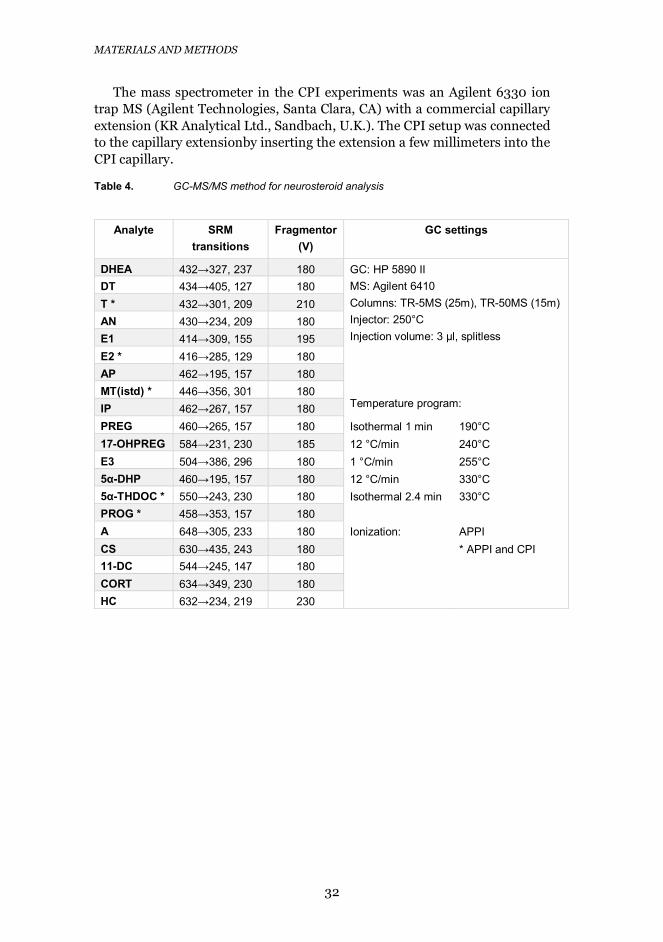
Table 4. GC-MS/MS method for neurosteroid analysis
Analyte SRMtransitions
Fragmentor(V)
GC settings
DHEA 432→327, 237 180 GC: HP 5890 IIMS: Agilent 6410Columns: TR-5MS (25m), TR-50MS (15m)Injector: 250°CInjection volume: 3 μl, splitless
Temperature program:
DT 434→405, 127 180T * 432→301, 209 210AN 430→234, 209 180E1 414→309, 155 195E2 * 416→285, 129 180AP 462→195, 157 180MT(istd) * 446→356, 301 180IP 462→267, 157 180PREG 460→265, 157 180 Isothermal 1 min 190°C17-OHPREG 584→231, 230 185 12 °C/min 240°CE3 504→386, 296 180 1 °C/min 255°C5α-DHP 460→195, 157 180 12 °C/min 330°C5α-THDOC * 550→243, 230 180 Isothermal 2.4 min 330°CPROG * 458→353, 157 180A 648→305, 233 180 Ionization: APPICS 630→435, 243 180 * APPI and CPI11-DC 544→245, 147 180CORT 634→349, 230 180HC 632→234, 219 230

33
4 RESULTS AND DISCUSSION
This chapter summarizes the results of this work; more detailed descriptionscan be found in publications I-IV. The analysis of neurotransmitters wasperformed with a more traditional UPLC-MS/MS method, although themicrodialysis sample matrix and the baseline concentrations of theneurotransmitters required a very sensitive method with goodchromatographic separation. In addition to the many compounds included inthe analysis, Ringer’s solution contains high amounts of inorganic salts, whichhad to be separated from the analytes chromatographically and preventedfrom reaching the mass spectrometer, as they cause ion suppression.Concerning neurosteroid analysis, the focus was on developing a new interfacebetween GC and MS, making it possible to combine GC to MS by building aninterface for ionization at atmospheric pressure, but as also neurosteroids arepresent in the brain at low concentrations, the developed method had to besensitive and selective.
4.1 ANALYSIS OF HUMAN BRAIN MICRODIALYSIS ANDHUMAN CSF SAMPLES
4.1.1 UPLC-MS/MS METHOD DEVELOPMENTAn UPLC-MS/MS method was developed for the analysis of DA, 5-HT, andtheir phase I and phase II metabolites in human brain microdialysis and CSFsamples. The use of a pentafluorophenylpropyl column, instead of a commonlyused C-18 column, provided good retention and separation of the metabolitesfrom each other, and also from the inorganic salts in the Ringer’s solution. Thesalts were directed to waste using column switching before the elution of theanalytes, in order to avoid contamination of the ion source.
The UPLC method provided high separation resolution for the analytes, aswell as for the regioisomers, DA-3-sulfate (DA-3-S) and DA-4-sulfate (DA-4-S), in addition to HVA-O-glucuronide (HVA-O-G) and HVA-COO-glucuronide(HVA-COO-G) (Figure 3). Electrospray ionization (ESI) in the positive ionmode provided high ionization efficiency for 5-HT, DA, 5-HT-glucuronide (5-HT-G), 5-HT-sulfate (5-HT-S), and DA-glucuronide (DA-G), whereas thenegative ion mode provided better ionization efficiency for DA-3-S and DA-4-S, as well as for DOPAC, HVA, 5-HIAA, and their glucuronide and sulfateconjugates (Table 3) . The positive and negative ion ESI mass spectra showedabundant [M+H]+ and [M–H]− ions, respectively, which were chosen as theprecursor ions. The identification of the neurotransmitters and theirmetabolites was based on the comparison of the retention times and relativeabundances of 2-3 selected reaction monitoring (SRM) transitions (Table 3) of
RESULTS AND DISCUSSION
34
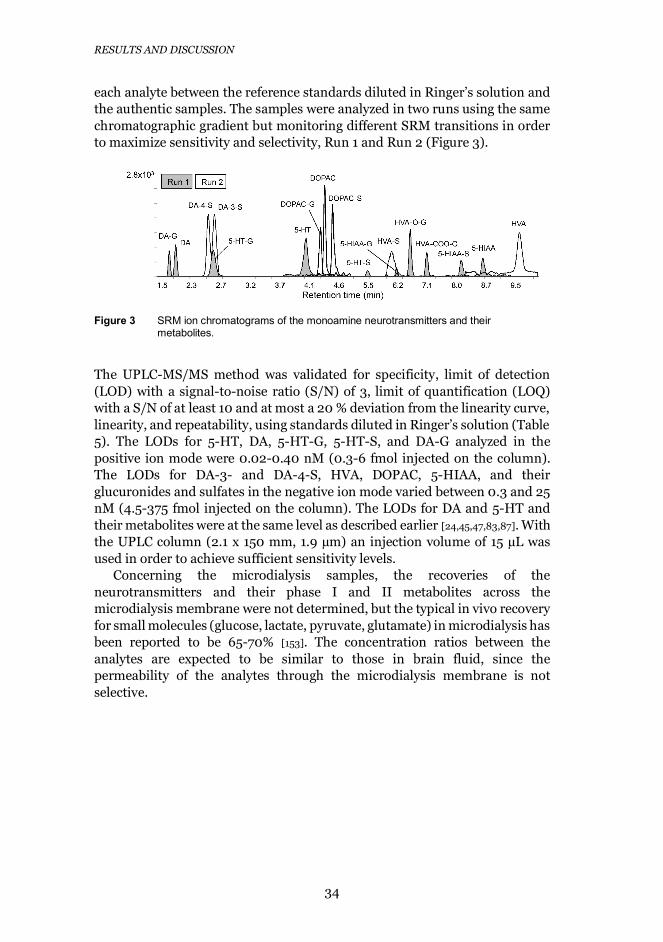
each analyte between the reference standards diluted in Ringer’s solution andthe authentic samples. The samples were analyzed in two runs using the samechromatographic gradient but monitoring different SRM transitions in orderto maximize sensitivity and selectivity, Run 1 and Run 2 (Figure 3).
Figure 3 SRM ion chromatograms of the monoamine neurotransmitters and theirmetabolites.
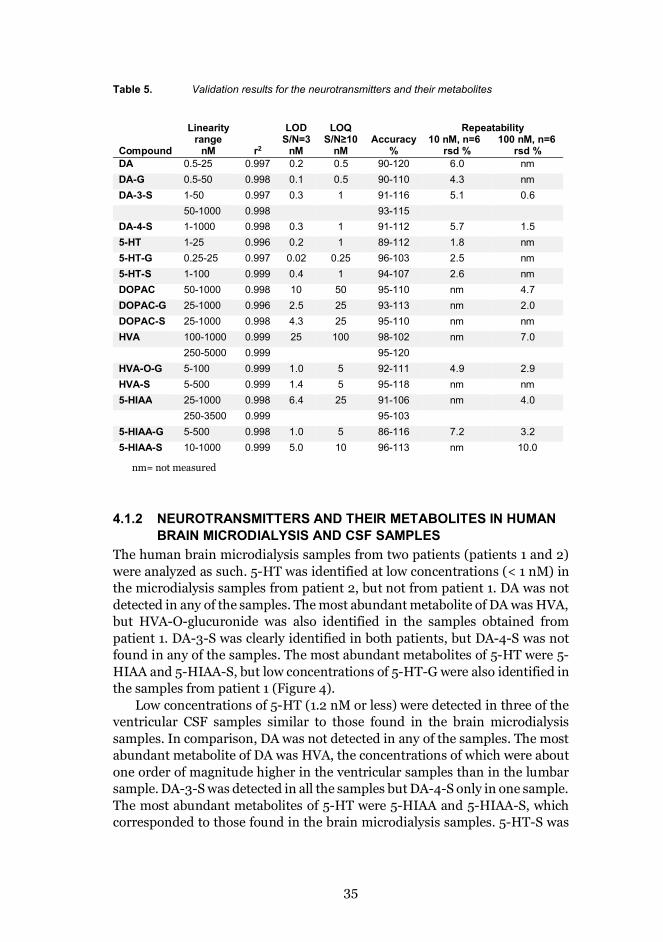
The UPLC-MS/MS method was validated for specificity, limit of detection(LOD) with a signal-to-noise ratio (S/N) of 3, limit of quantification (LOQ)with a S/N of at least 10 and at most a 20 % deviation from the linearity curve,linearity, and repeatability, using standards diluted in Ringer’s solution (Table5). The LODs for 5-HT, DA, 5-HT-G, 5-HT-S, and DA-G analyzed in thepositive ion mode were 0.02-0.40 nM (0.3-6 fmol injected on the column).The LODs for DA-3- and DA-4-S, HVA, DOPAC, 5-HIAA, and theirglucuronides and sulfates in the negative ion mode varied between 0.3 and 25nM (4.5-375 fmol injected on the column). The LODs for DA and 5-HT andtheir metabolites were at the same level as described earlier [24,45,47,83,87]. Withthe UPLC column (2.1 x 150 mm, 1.9 μm) an injection volume of 15 μL wasused in order to achieve sufficient sensitivity levels.
Concerning the microdialysis samples, the recoveries of theneurotransmitters and their phase I and II metabolites across themicrodialysis membrane were not determined, but the typical in vivo recoveryfor small molecules (glucose, lactate, pyruvate, glutamate) in microdialysis hasbeen reported to be 65-70% [153]. The concentration ratios between theanalytes are expected to be similar to those in brain fluid, since thepermeability of the analytes through the microdialysis membrane is notselective.
35
Table 5. Validation results for the neurotransmitters and their metabolites
Compound
Linearityrange
nM r2
LODS/N=3
nM
LOQS/N≥10
nMAccuracy
%
Repeatability10 nM, n=6
rsd %100 nM, n=6
rsd %DA 0.5-25 0.997 0.2 0.5 90-120 6.0 nmDA-G 0.5-50 0.998 0.1 0.5 90-110 4.3 nmDA-3-S 1-50 0.997 0.3 1 91-116 5.1 0.6
50-1000 0.998 93-115DA-4-S 1-1000 0.998 0.3 1 91-112 5.7 1.55-HT 1-25 0.996 0.2 1 89-112 1.8 nm5-HT-G 0.25-25 0.997 0.02 0.25 96-103 2.5 nm5-HT-S 1-100 0.999 0.4 1 94-107 2.6 nmDOPAC 50-1000 0.998 10 50 95-110 nm 4.7DOPAC-G 25-1000 0.996 2.5 25 93-113 nm 2.0DOPAC-S 25-1000 0.998 4.3 25 95-110 nm nmHVA 100-1000 0.999 25 100 98-102 nm 7.0
250-5000 0.999 95-120HVA-O-G 5-100 0.999 1.0 5 92-111 4.9 2.9HVA-S 5-500 0.999 1.4 5 95-118 nm nm5-HIAA 25-1000 0.998 6.4 25 91-106 nm 4.0
250-3500 0.999 95-1035-HIAA-G 5-500 0.998 1.0 5 86-116 7.2 3.25-HIAA-S 10-1000 0.999 5.0 10 96-113 nm 10.0
nm= not measured
4.1.2 NEUROTRANSMITTERS AND THEIR METABOLITES IN HUMANBRAIN MICRODIALYSIS AND CSF SAMPLES
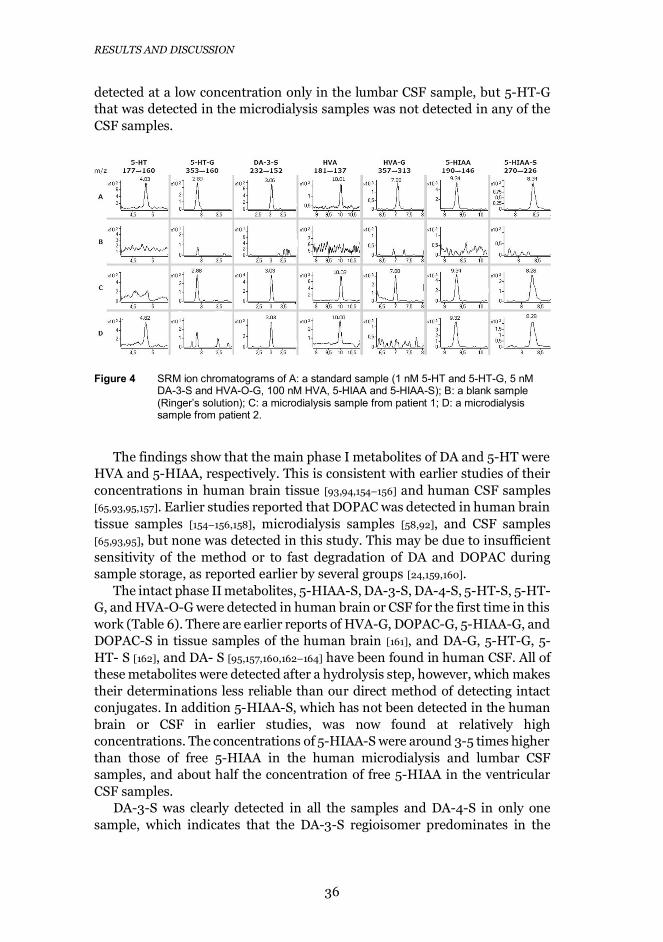
The human brain microdialysis samples from two patients (patients 1 and 2)were analyzed as such. 5-HT was identified at low concentrations (< 1 nM) inthe microdialysis samples from patient 2, but not from patient 1. DA was notdetected in any of the samples. The most abundant metabolite of DA was HVA,but HVA-O-glucuronide was also identified in the samples obtained frompatient 1. DA-3-S was clearly identified in both patients, but DA-4-S was notfound in any of the samples. The most abundant metabolites of 5-HT were 5-HIAA and 5-HIAA-S, but low concentrations of 5-HT-G were also identified inthe samples from patient 1 (Figure 4).
Low concentrations of 5-HT (1.2 nM or less) were detected in three of theventricular CSF samples similar to those found in the brain microdialysissamples. In comparison, DA was not detected in any of the samples. The mostabundant metabolite of DA was HVA, the concentrations of which were aboutone order of magnitude higher in the ventricular samples than in the lumbarsample. DA-3-S was detected in all the samples but DA-4-S only in one sample.The most abundant metabolites of 5-HT were 5-HIAA and 5-HIAA-S, whichcorresponded to those found in the brain microdialysis samples. 5-HT-S was
RESULTS AND DISCUSSION
36
detected at a low concentration only in the lumbar CSF sample, but 5-HT-Gthat was detected in the microdialysis samples was not detected in any of theCSF samples.
Figure 4 SRM ion chromatograms of A: a standard sample (1 nM 5-HT and 5-HT-G, 5 nMDA-3-S and HVA-O-G, 100 nM HVA, 5-HIAA and 5-HIAA-S); B: a blank sample(Ringer’s solution); C: a microdialysis sample from patient 1; D: a microdialysissample from patient 2.
The findings show that the main phase I metabolites of DA and 5-HT wereHVA and 5-HIAA, respectively. This is consistent with earlier studies of theirconcentrations in human brain tissue [93,94,154–156] and human CSF samples[65,93,95,157]. Earlier studies reported that DOPAC was detected in human braintissue samples [154–156,158], microdialysis samples [58,92], and CSF samples[65,93,95], but none was detected in this study. This may be due to insufficientsensitivity of the method or to fast degradation of DA and DOPAC duringsample storage, as reported earlier by several groups [24,159,160].
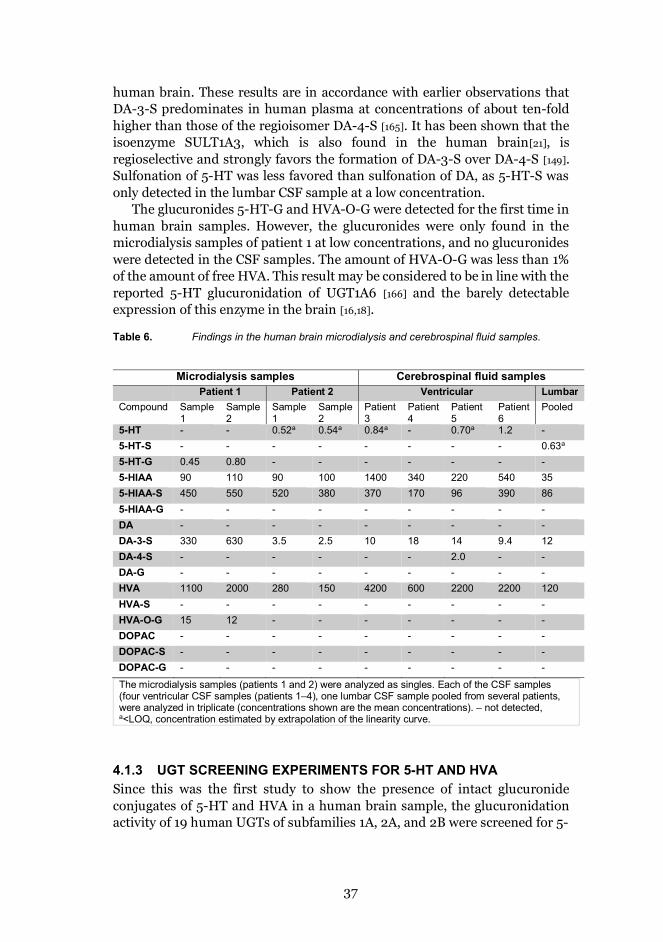
The intact phase II metabolites, 5-HIAA-S, DA-3-S, DA-4-S, 5-HT-S, 5-HT-G, and HVA-O-G were detected in human brain or CSF for the first time in thiswork (Table 6). There are earlier reports of HVA-G, DOPAC-G, 5-HIAA-G, andDOPAC-S in tissue samples of the human brain [161], and DA-G, 5-HT-G, 5-HT- S [162], and DA- S [95,157,160,162–164] have been found in human CSF. All ofthese metabolites were detected after a hydrolysis step, however, which makestheir determinations less reliable than our direct method of detecting intactconjugates. In addition 5-HIAA-S, which has not been detected in the humanbrain or CSF in earlier studies, was now found at relatively highconcentrations. The concentrations of 5-HIAA-S were around 3-5 times higherthan those of free 5-HIAA in the human microdialysis and lumbar CSFsamples, and about half the concentration of free 5-HIAA in the ventricularCSF samples.
DA-3-S was clearly detected in all the samples and DA-4-S in only onesample, which indicates that the DA-3-S regioisomer predominates in the
37
human brain. These results are in accordance with earlier observations thatDA-3-S predominates in human plasma at concentrations of about ten-foldhigher than those of the regioisomer DA-4-S [165]. It has been shown that theisoenzyme SULT1A3, which is also found in the human brain[21], isregioselective and strongly favors the formation of DA-3-S over DA-4-S [149].Sulfonation of 5-HT was less favored than sulfonation of DA, as 5-HT-S wasonly detected in the lumbar CSF sample at a low concentration.
The glucuronides 5-HT-G and HVA-O-G were detected for the first time inhuman brain samples. However, the glucuronides were only found in themicrodialysis samples of patient 1 at low concentrations, and no glucuronideswere detected in the CSF samples. The amount of HVA-O-G was less than 1%of the amount of free HVA. This result may be considered to be in line with thereported 5-HT glucuronidation of UGT1A6 [166] and the barely detectableexpression of this enzyme in the brain [16,18].
Table 6. Findings in the human brain microdialysis and cerebrospinal fluid samples.
Microdialysis samples Cerebrospinal fluid samplesPatient 1 Patient 2 Ventricular Lumbar
Compound Sample1
Sample2
Sample1
Sample2
Patient3
Patient4
Patient5
Patient6
Pooled
5-HT - - 0.52a 0.54a 0.84a - 0.70a 1.2 -5-HT-S - - - - - - - - 0.63a
5-HT-G 0.45 0.80 - - - - - - -5-HIAA 90 110 90 100 1400 340 220 540 355-HIAA-S 450 550 520 380 370 170 96 390 865-HIAA-G - - - - - - - - -DA - - - - - - - - -DA-3-S 330 630 3.5 2.5 10 18 14 9.4 12DA-4-S - - - - - - 2.0 - -DA-G - - - - - - - - -HVA 1100 2000 280 150 4200 600 2200 2200 120HVA-S - - - - - - - - -HVA-O-G 15 12 - - - - - - -DOPAC - - - - - - - - -DOPAC-S - - - - - - - - -DOPAC-G - - - - - - - - -
The microdialysis samples (patients 1 and 2) were analyzed as singles. Each of the CSF samples(four ventricular CSF samples (patients 1–4), one lumbar CSF sample pooled from several patients,were analyzed in triplicate (concentrations shown are the mean concentrations). – not detected,a<LOQ, concentration estimated by extrapolation of the linearity curve.
4.1.3 UGT SCREENING EXPERIMENTS FOR 5-HT AND HVASince this was the first study to show the presence of intact glucuronideconjugates of 5-HT and HVA in a human brain sample, the glucuronidationactivity of 19 human UGTs of subfamilies 1A, 2A, and 2B were screened for 5-
RESULTS AND DISCUSSION
38
HT and HVA in order to evaluate the relevance of the finding. 5-HTglucuronidation has been previously well documented [16,166,167], but theconjugation of HVA by recombinant UGTs is elusive. In this study, serotoninwas shown to be conjugated mainly by UGT1A6, but also by the UGTs 1A7-1A10 in minor amounts. This was almost in agreement with previous results,though low levels of UGT2B7 activity have also been observed for 5-HT [151].
HVA can be glucuronidated both at the phenolic hydroxyl and thecarboxylic acid group sites [24]. This screening experiment revealed thatUGT1A10 is the most active human UGT in the formation of HVA-O-glucuronide, whereas UGT2A1 is the most active for the conjugation of HVAat the –COOH-group (UGT screening experiment described in more detail inpublication I). The glucuronidation results showed that glucuronidation is nota major biotransformation pathway for 5-HT and HVA in the human brain. Ingeneral, the results suggest that conjugation with sulfonate is the major phaseII metabolism pathway in the human brain.
4.2 PERMEATION OF DOPAMINE SULFATE THROUGHTHE BLOOD-BRAIN BARRIER
Even though several sulfonate conjugates of neurotransmitters were detectedin the human brain, the origin of these was not studied. It is not knownwhether the conjugates were locally formed in the brain, or whether they cancross the BBB. Therefore the BBB permeation of DA and its sulfonateconjugates was studied by peripheral (subcutaneous) injections of DA, DA-3-and DA-4-S, as well as 13C6-isotopically labeled DA-3-S (13DA-3-S) and DA-4-S (13DA-4-S) in rats, while the concentrations of these compounds in the brainwere simultaneously monitored by microdialysis. The fate of the injectedcompounds, and their possible effects on the concentrations of DA, 5-HT andtheir metabolites, were studied by analyzing the rat brain microdialysissamples using ultra-performance liquid chromatography-tandem massspectrometry (UPLC-MS/MS).
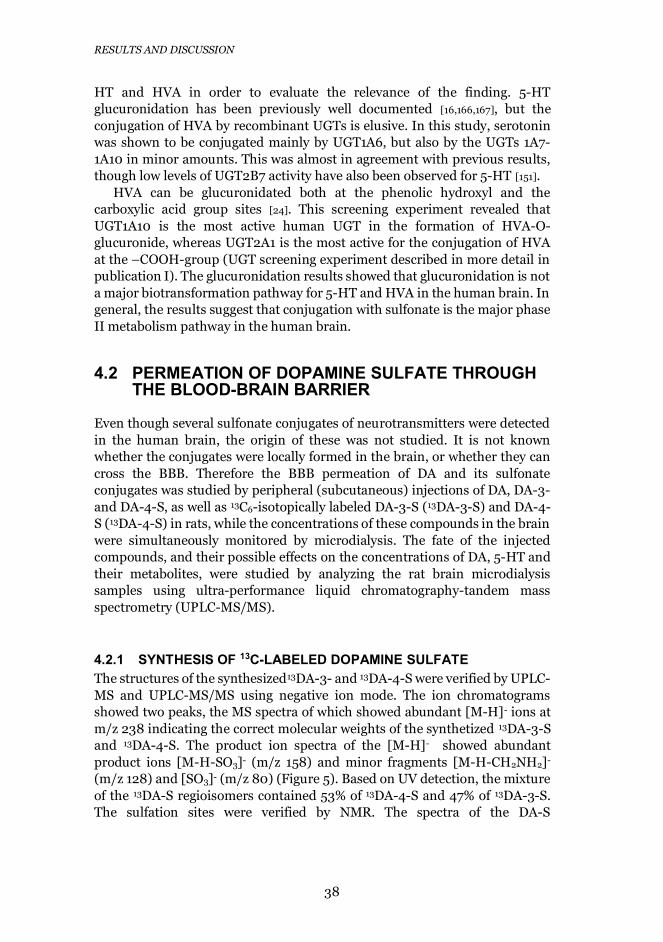
4.2.1 SYNTHESIS OF 13C-LABELED DOPAMINE SULFATEThe structures of the synthesized13DA-3- and 13DA-4-S were verified by UPLC-MS and UPLC-MS/MS using negative ion mode. The ion chromatogramsshowed two peaks, the MS spectra of which showed abundant [M-H]- ions atm/z 238 indicating the correct molecular weights of the synthetized 13DA-3-Sand 13DA-4-S. The product ion spectra of the [M-H]- showed abundantproduct ions [M-H-SO3]- (m/z 158) and minor fragments [M-H-CH2NH2]-
(m/z 128) and [SO3]- (m/z 80) (Figure 5). Based on UV detection, the mixtureof the 13DA-S regioisomers contained 53% of 13DA-4-S and 47% of 13DA-3-S.The sulfation sites were verified by NMR. The spectra of the DA-S
39
regioisomers are in accordance with earlier reported NMR data [149]
confirming sulfonation to the hydroxyl groups attached to carbons 3 and 4.
Figure 5 Extracted ion chromatogram, MS and MS/MS spectra (negative ion mode) of thesynthesized 13DA-S.
4.2.2 BBB PERMEATION EXPERIMENTA mixture containing DA-S (DA-3-S and DA-4-S, 1:1) 2.3 mg/kg and DA 1.5mg/kg was injected subcutaneously (s.c) and the concentrations in rat brainwere followed by microdialysis. Microdialysis samples were collected at 30minutes intervals for 3 hours after administration (n=3, Rats 1-3). By alsoinjecting intact DA, the function of the BBB was controlled, as DA does notpermeate the BBB. In all three rats the concentrations of DA-3-S and DA-4-Swere below the limit of detection before the injection, but increased clearly 30min after the injection (Figure 6). To confirm the results, the experiment wasrepeated with a mixture of labelled 13DA-S regioisomers (2.4 mg/kg) (n=4,Rats 4-7). Again, in all four rats, the concentrations of both 13DA-3-S and 13DA-4-S increased clearly 30 min after the s.c. injection. In contrast to DA-S, theconcentrations of intact DA did not change significantly after the injection,measuring at the same levels as reported earlier in rat striatal microdialysissamples (0.7-8 nM) [24,47,49]. These results clearly show that DA-S permeatesthe intact BBB.
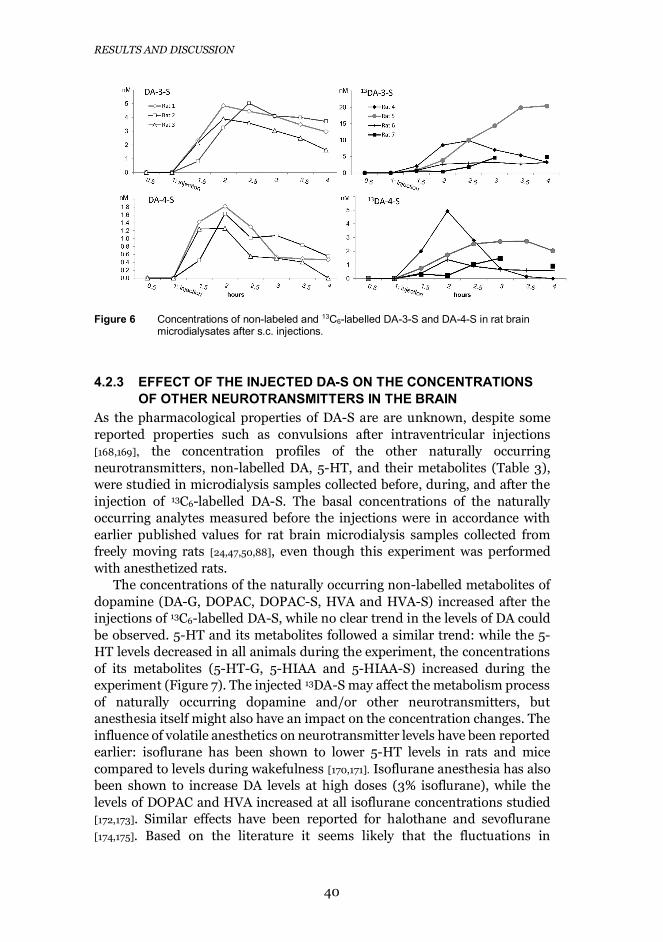
RESULTS AND DISCUSSION
40
Figure 6 Concentrations of non-labeled and 13C6-labelled DA-3-S and DA-4-S in rat brainmicrodialysates after s.c. injections.
4.2.3 EFFECT OF THE INJECTED DA-S ON THE CONCENTRATIONSOF OTHER NEUROTRANSMITTERS IN THE BRAIN
As the pharmacological properties of DA-S are are unknown, despite somereported properties such as convulsions after intraventricular injections[168,169], the concentration profiles of the other naturally occurringneurotransmitters, non-labelled DA, 5-HT, and their metabolites (Table 3),were studied in microdialysis samples collected before, during, and after theinjection of 13C6-labelled DA-S. The basal concentrations of the naturallyoccurring analytes measured before the injections were in accordance withearlier published values for rat brain microdialysis samples collected fromfreely moving rats [24,47,50,88], even though this experiment was performedwith anesthetized rats.
The concentrations of the naturally occurring non-labelled metabolites ofdopamine (DA-G, DOPAC, DOPAC-S, HVA and HVA-S) increased after theinjections of 13C6-labelled DA-S, while no clear trend in the levels of DA couldbe observed. 5-HT and its metabolites followed a similar trend: while the 5-HT levels decreased in all animals during the experiment, the concentrationsof its metabolites (5-HT-G, 5-HIAA and 5-HIAA-S) increased during theexperiment (Figure 7). The injected 13DA-S may affect the metabolism processof naturally occurring dopamine and/or other neurotransmitters, butanesthesia itself might also have an impact on the concentration changes. Theinfluence of volatile anesthetics on neurotransmitter levels have been reportedearlier: isoflurane has been shown to lower 5-HT levels in rats and micecompared to levels during wakefulness [170,171]. Isoflurane anesthesia has alsobeen shown to increase DA levels at high doses (3% isoflurane), while thelevels of DOPAC and HVA increased at all isoflurane concentrations studied[172,173]. Similar effects have been reported for halothane and sevoflurane[174,175]. Based on the literature it seems likely that the fluctuations in
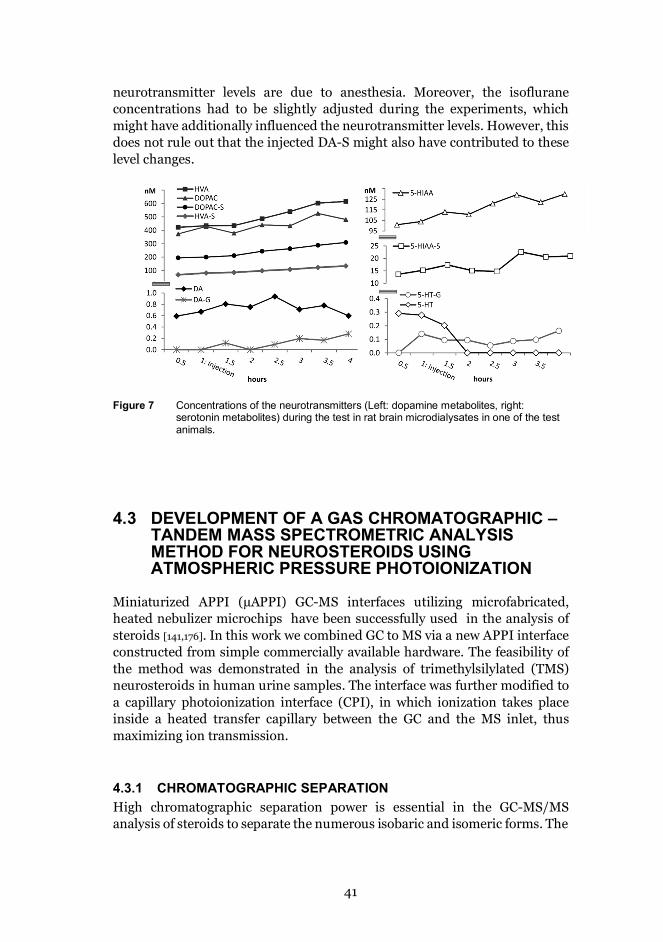
41
neurotransmitter levels are due to anesthesia. Moreover, the isofluraneconcentrations had to be slightly adjusted during the experiments, whichmight have additionally influenced the neurotransmitter levels. However, thisdoes not rule out that the injected DA-S might also have contributed to theselevel changes.
Figure 7 Concentrations of the neurotransmitters (Left: dopamine metabolites, right:serotonin metabolites) during the test in rat brain microdialysates in one of the testanimals.
4.3 DEVELOPMENT OF A GAS CHROMATOGRAPHIC –TANDEM MASS SPECTROMETRIC ANALYSISMETHOD FOR NEUROSTEROIDS USINGATMOSPHERIC PRESSURE PHOTOIONIZATION
Miniaturized APPI (μAPPI) GC-MS interfaces utilizing microfabricated,heated nebulizer microchips have been successfully used in the analysis ofsteroids [141,176]. In this work we combined GC to MS via a new APPI interfaceconstructed from simple commercially available hardware. The feasibility ofthe method was demonstrated in the analysis of trimethylsilylated (TMS)neurosteroids in human urine samples. The interface was further modified toa capillary photoionization interface (CPI), in which ionization takes placeinside a heated transfer capillary between the GC and the MS inlet, thusmaximizing ion transmission.
4.3.1 CHROMATOGRAPHIC SEPARATIONHigh chromatographic separation power is essential in the GC-MS/MSanalysis of steroids to separate the numerous isobaric and isomeric forms. The
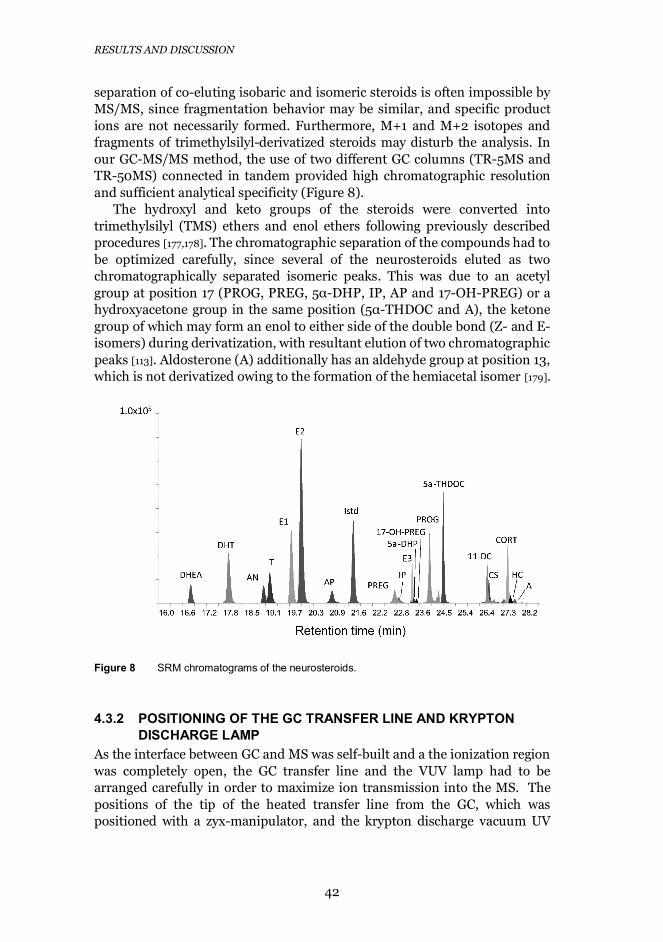
RESULTS AND DISCUSSION
42
separation of co-eluting isobaric and isomeric steroids is often impossible byMS/MS, since fragmentation behavior may be similar, and specific productions are not necessarily formed. Furthermore, M+1 and M+2 isotopes andfragments of trimethylsilyl-derivatized steroids may disturb the analysis. Inour GC-MS/MS method, the use of two different GC columns (TR-5MS andTR-50MS) connected in tandem provided high chromatographic resolutionand sufficient analytical specificity (Figure 8).
The hydroxyl and keto groups of the steroids were converted intotrimethylsilyl (TMS) ethers and enol ethers following previously describedprocedures [177,178]. The chromatographic separation of the compounds had tobe optimized carefully, since several of the neurosteroids eluted as twochromatographically separated isomeric peaks. This was due to an acetylgroup at position 17 (PROG, PREG, 5α-DHP, IP, AP and 17-OH-PREG) or ahydroxyacetone group in the same position (5α-THDOC and A), the ketonegroup of which may form an enol to either side of the double bond (Z- and E-isomers) during derivatization, with resultant elution of two chromatographicpeaks [113]. Aldosterone (A) additionally has an aldehyde group at position 13,which is not derivatized owing to the formation of the hemiacetal isomer [179].
Figure 8 SRM chromatograms of the neurosteroids.
4.3.2 POSITIONING OF THE GC TRANSFER LINE AND KRYPTONDISCHARGE LAMP
As the interface between GC and MS was self-built and a the ionization regionwas completely open, the GC transfer line and the VUV lamp had to bearranged carefully in order to maximize ion transmission into the MS. Thepositions of the tip of the heated transfer line from the GC, which waspositioned with a zyx-manipulator, and the krypton discharge vacuum UV
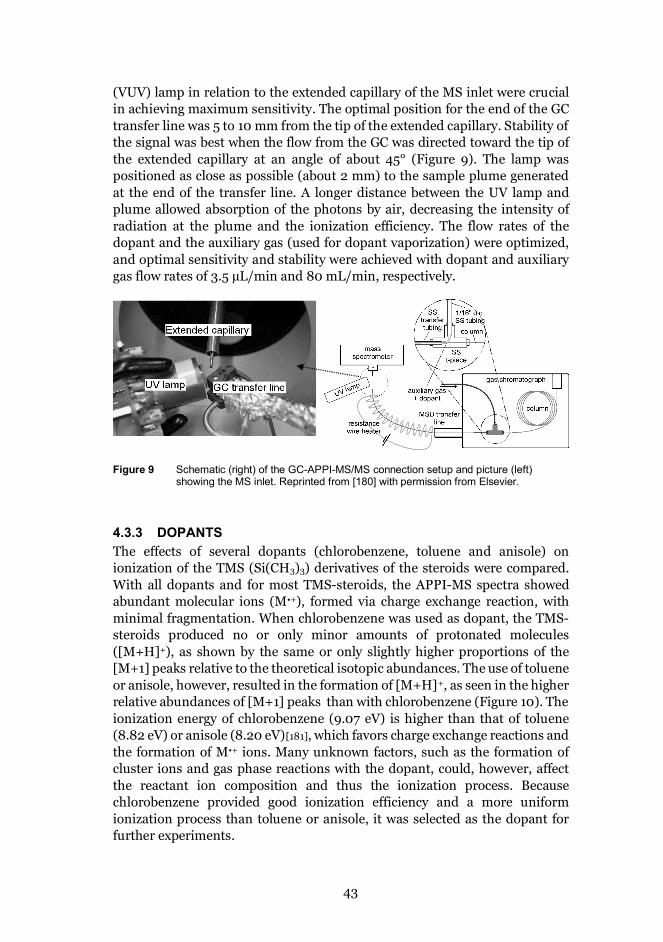
43
(VUV) lamp in relation to the extended capillary of the MS inlet were crucialin achieving maximum sensitivity. The optimal position for the end of the GCtransfer line was 5 to 10 mm from the tip of the extended capillary. Stability ofthe signal was best when the flow from the GC was directed toward the tip ofthe extended capillary at an angle of about 45° (Figure 9). The lamp waspositioned as close as possible (about 2 mm) to the sample plume generatedat the end of the transfer line. A longer distance between the UV lamp andplume allowed absorption of the photons by air, decreasing the intensity ofradiation at the plume and the ionization efficiency. The flow rates of thedopant and the auxiliary gas (used for dopant vaporization) were optimized,and optimal sensitivity and stability were achieved with dopant and auxiliarygas flow rates of 3.5 μL/min and 80 mL/min, respectively.
Figure 9 Schematic (right) of the GC-APPI-MS/MS connection setup and picture (left)showing the MS inlet. Reprinted from [180] with permission from Elsevier.
4.3.3 DOPANTSThe effects of several dopants (chlorobenzene, toluene and anisole) onionization of the TMS (Si(CH3)3) derivatives of the steroids were compared.With all dopants and for most TMS-steroids, the APPI-MS spectra showedabundant molecular ions (M•+), formed via charge exchange reaction, withminimal fragmentation. When chlorobenzene was used as dopant, the TMS-steroids produced no or only minor amounts of protonated molecules([M+H]+), as shown by the same or only slightly higher proportions of the[M+1] peaks relative to the theoretical isotopic abundances. The use of tolueneor anisole, however, resulted in the formation of [M+H]+, as seen in the higherrelative abundances of [M+1] peaks than with chlorobenzene (Figure 10). Theionization energy of chlorobenzene (9.07 eV) is higher than that of toluene(8.82 eV) or anisole (8.20 eV)[181], which favors charge exchange reactions andthe formation of M•+ ions. Many unknown factors, such as the formation ofcluster ions and gas phase reactions with the dopant, could, however, affectthe reactant ion composition and thus the ionization process. Becausechlorobenzene provided good ionization efficiency and a more uniformionization process than toluene or anisole, it was selected as the dopant forfurther experiments.
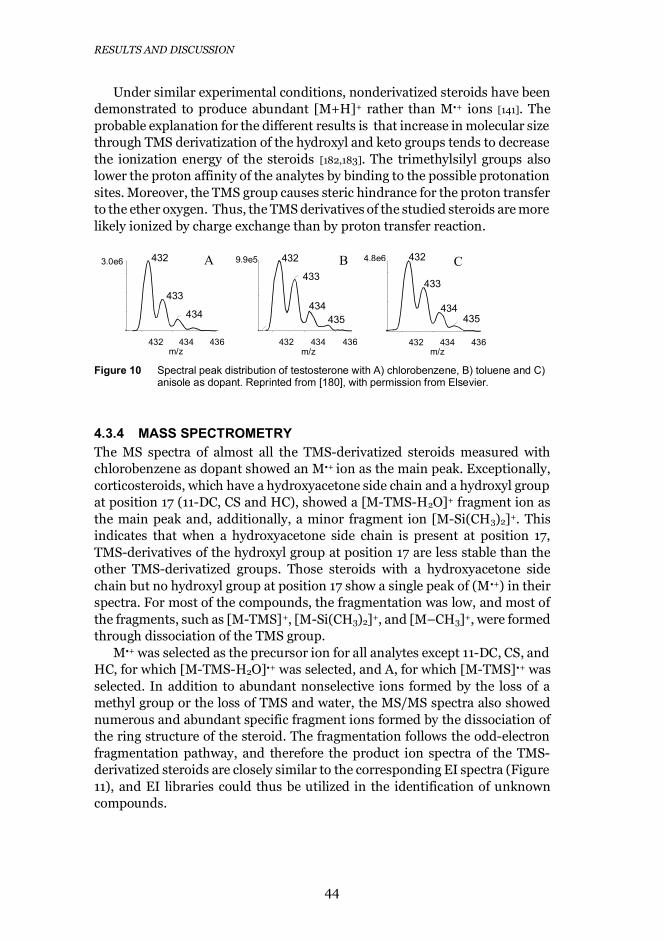
RESULTS AND DISCUSSION
44
Under similar experimental conditions, nonderivatized steroids have beendemonstrated to produce abundant [M+H]+ rather than M•+ ions [141]. Theprobable explanation for the different results is that increase in molecular sizethrough TMS derivatization of the hydroxyl and keto groups tends to decreasethe ionization energy of the steroids [182,183]. The trimethylsilyl groups alsolower the proton affinity of the analytes by binding to the possible protonationsites. Moreover, the TMS group causes steric hindrance for the proton transferto the ether oxygen. Thus, the TMS derivatives of the studied steroids are morelikely ionized by charge exchange than by proton transfer reaction.
Figure 10 Spectral peak distribution of testosterone with A) chlorobenzene, B) toluene and C)anisole as dopant. Reprinted from [180], with permission from Elsevier.
4.3.4 MASS SPECTROMETRYThe MS spectra of almost all the TMS-derivatized steroids measured withchlorobenzene as dopant showed an M•+ ion as the main peak. Exceptionally,corticosteroids, which have a hydroxyacetone side chain and a hydroxyl groupat position 17 (11-DC, CS and HC), showed a [M-TMS-H2O]+ fragment ion asthe main peak and, additionally, a minor fragment ion [M-Si(CH3)2]+. Thisindicates that when a hydroxyacetone side chain is present at position 17,TMS-derivatives of the hydroxyl group at position 17 are less stable than theother TMS-derivatized groups. Those steroids with a hydroxyacetone sidechain but no hydroxyl group at position 17 show a single peak of (M•+) in theirspectra. For most of the compounds, the fragmentation was low, and most ofthe fragments, such as [M-TMS]+, [M-Si(CH3)2]+, and [M–CH3]+, were formedthrough dissociation of the TMS group.
M•+ was selected as the precursor ion for all analytes except 11-DC, CS, andHC, for which [M-TMS-H2O]•+ was selected, and A, for which [M-TMS]•+ wasselected. In addition to abundant nonselective ions formed by the loss of amethyl group or the loss of TMS and water, the MS/MS spectra also showednumerous and abundant specific fragment ions formed by the dissociation ofthe ring structure of the steroid. The fragmentation follows the odd-electronfragmentation pathway, and therefore the product ion spectra of the TMS-derivatized steroids are closely similar to the corresponding EI spectra (Figure11), and EI libraries could thus be utilized in the identification of unknowncompounds.
432 434 436m/z
432
433
434
3.0e6
432 434 436m/z
432
433
434435
4,8e6
432 434 436m/z
9.9e5 432
433
434435
B CA
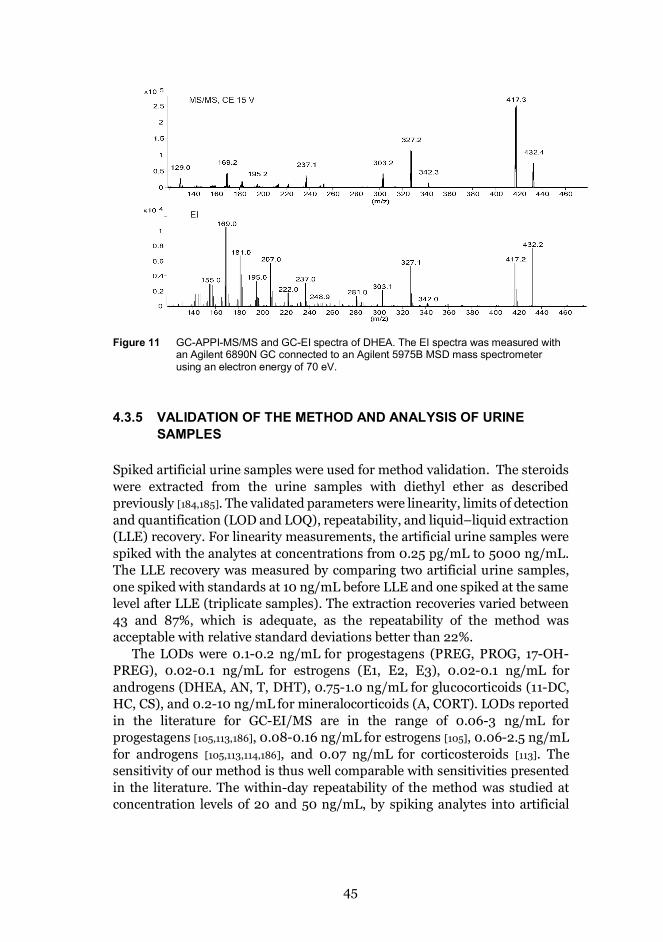
45
Figure 11 GC-APPI-MS/MS and GC-EI spectra of DHEA. The EI spectra was measured withan Agilent 6890N GC connected to an Agilent 5975B MSD mass spectrometerusing an electron energy of 70 eV.
4.3.5 VALIDATION OF THE METHOD AND ANALYSIS OF URINESAMPLES
Spiked artificial urine samples were used for method validation. The steroidswere extracted from the urine samples with diethyl ether as describedpreviously [184,185]. The validated parameters were linearity, limits of detectionand quantification (LOD and LOQ), repeatability, and liquid–liquid extraction(LLE) recovery. For linearity measurements, the artificial urine samples werespiked with the analytes at concentrations from 0.25 pg/mL to 5000 ng/mL.The LLE recovery was measured by comparing two artificial urine samples,one spiked with standards at 10 ng/mL before LLE and one spiked at the samelevel after LLE (triplicate samples). The extraction recoveries varied between43 and 87%, which is adequate, as the repeatability of the method wasacceptable with relative standard deviations better than 22%.
The LODs were 0.1-0.2 ng/mL for progestagens (PREG, PROG, 17-OH-PREG), 0.02-0.1 ng/mL for estrogens (E1, E2, E3), 0.02-0.1 ng/mL forandrogens (DHEA, AN, T, DHT), 0.75-1.0 ng/mL for glucocorticoids (11-DC,HC, CS), and 0.2-10 ng/mL for mineralocorticoids (A, CORT). LODs reportedin the literature for GC-EI/MS are in the range of 0.06-3 ng/mL forprogestagens [105,113,186], 0.08-0.16 ng/mL for estrogens [105], 0.06-2.5 ng/mLfor androgens [105,113,114,186], and 0.07 ng/mL for corticosteroids [113]. Thesensitivity of our method is thus well comparable with sensitivities presentedin the literature. The within-day repeatability of the method was studied atconcentration levels of 20 and 50 ng/mL, by spiking analytes into artificial
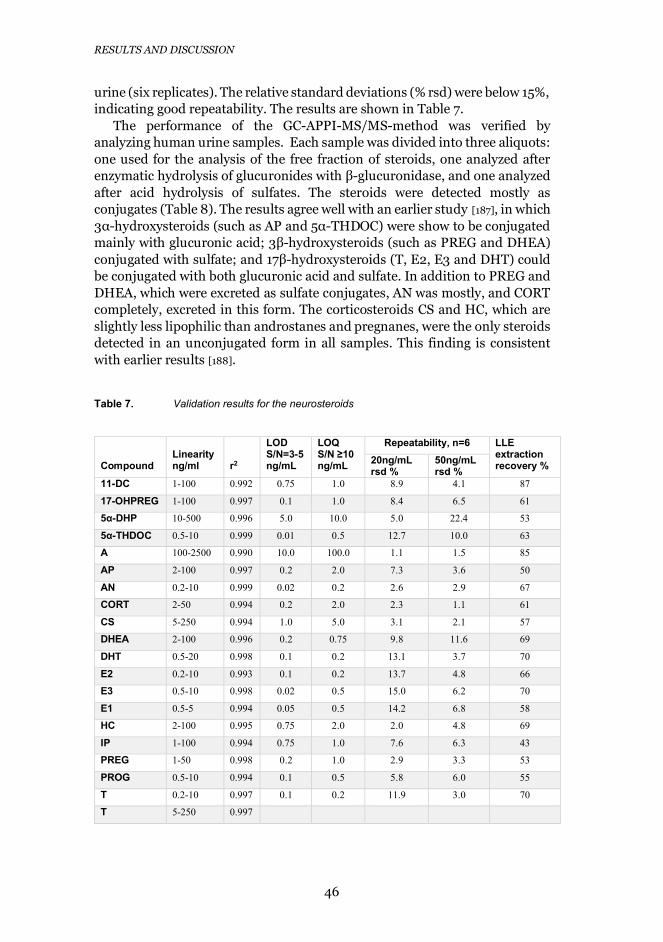
RESULTS AND DISCUSSION
46
urine (six replicates). The relative standard deviations (% rsd) were below 15%,indicating good repeatability. The results are shown in Table 7.
The performance of the GC-APPI-MS/MS-method was verified byanalyzing human urine samples. Each sample was divided into three aliquots:one used for the analysis of the free fraction of steroids, one analyzed afterenzymatic hydrolysis of glucuronides with β-glucuronidase, and one analyzedafter acid hydrolysis of sulfates. The steroids were detected mostly asconjugates (Table 8). The results agree well with an earlier study [187], in which3α-hydroxysteroids (such as AP and 5α-THDOC) were show to be conjugatedmainly with glucuronic acid; 3β-hydroxysteroids (such as PREG and DHEA)conjugated with sulfate; and 17β-hydroxysteroids (T, E2, E3 and DHT) couldbe conjugated with both glucuronic acid and sulfate. In addition to PREG andDHEA, which were excreted as sulfate conjugates, AN was mostly, and CORTcompletely, excreted in this form. The corticosteroids CS and HC, which areslightly less lipophilic than androstanes and pregnanes, were the only steroidsdetected in an unconjugated form in all samples. This finding is consistentwith earlier results [188].
Table 7. Validation results for the neurosteroids
CompoundLinearityng/ml r2
LODS/N=3-5ng/mL
LOQS/N ≥10ng/mL
Repeatability, n=6 LLEextractionrecovery %20ng/mL
rsd %50ng/mLrsd %
11-DC 1-100 0.992 0.75 1.0 8.9 4.1 87
17-OHPREG 1-100 0.997 0.1 1.0 8.4 6.5 61
5α-DHP 10-500 0.996 5.0 10.0 5.0 22.4 53
5α-THDOC 0.5-10 0.999 0.01 0.5 12.7 10.0 63
A 100-2500 0.990 10.0 100.0 1.1 1.5 85
AP 2-100 0.997 0.2 2.0 7.3 3.6 50
AN 0.2-10 0.999 0.02 0.2 2.6 2.9 67
CORT 2-50 0.994 0.2 2.0 2.3 1.1 61
CS 5-250 0.994 1.0 5.0 3.1 2.1 57
DHEA 2-100 0.996 0.2 0.75 9.8 11.6 69
DHT 0.5-20 0.998 0.1 0.2 13.1 3.7 70
E2 0.2-10 0.993 0.1 0.2 13.7 4.8 66
E3 0.5-10 0.998 0.02 0.5 15.0 6.2 70
E1 0.5-5 0.994 0.05 0.5 14.2 6.8 58
HC 2-100 0.995 0.75 2.0 2.0 4.8 69
IP 1-100 0.994 0.75 1.0 7.6 6.3 43
PREG 1-50 0.998 0.2 1.0 2.9 3.3 53
PROG 0.5-10 0.994 0.1 0.5 5.8 6.0 55
T 0.2-10 0.997 0.1 0.2 11.9 3.0 70
T 5-250 0.997
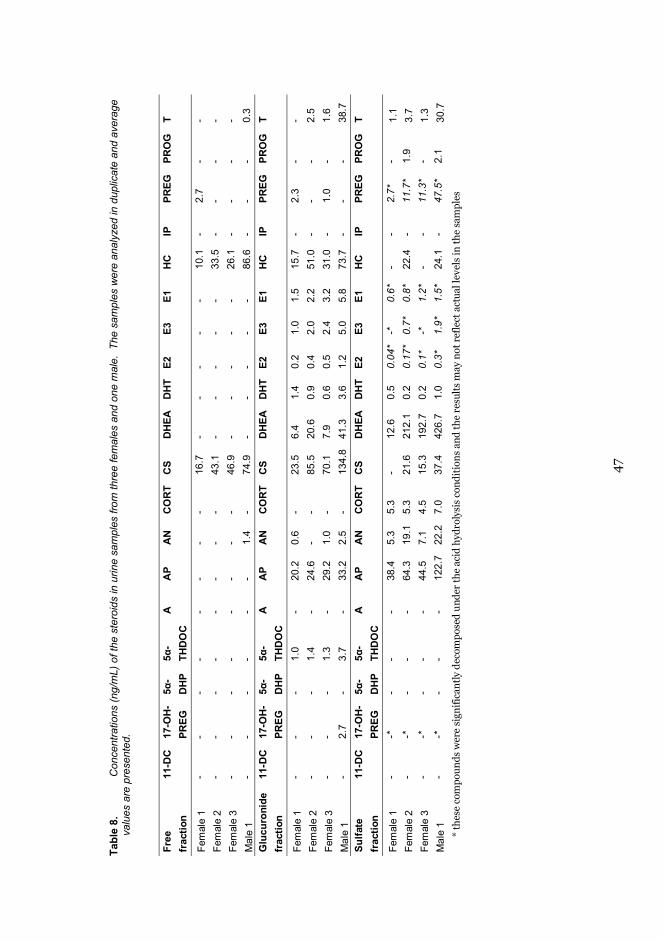
47
Tabl
e 8.
Con
cent
ratio
ns (n
g/m
L) o
f the
ste
roid
s in
urin
e sa
mpl
es fr
om th
ree
fem
ales
and
one
mal
e. T
he s
ampl
es w
ere
anal
yzed
in d
uplic
ate
and
aver
age
valu
es a
re p
rese
nted
.
Free
11-D
C
17-O
H-
5α-
5α-
AA
PA
N
C
OR
T C
SD
HEA
D
HT
E2E3
E1
HC
IP
PREG
PR
OG
T
frac
tion
PREG
D
HP
THD
OC
Fem
ale
1-
--
--
--
-16
.7
--
--
-10
.1
-2.
7-
-
Fem
ale
2-
--
--
--
-43
.1
--
--
-33
.5
--
--
Fem
ale
3-
--
--
--
-46
.9
--
--
-26
.1
--
--
Mal
e 1
--
--
--
1.4
-74
.9
--
--
-86
.6
--
-0.
3G
lucu
roni
de
11-D
C
17-O
H-
5α-
5α-
AA
PA
N
C
OR
T C
SD
HEA
D
HT
E2E3
E1
HC
IP
PREG
PR
OG
T
frac
tion
PREG
D
HP
THD
OC
Fem
ale
1-
--
1.0
-20
.2
0.6
-23
.5
6.4
1.4
0.2
1.0
1.5
15.7
-
2.3
--
Fem
ale
2-
--
1.4
-24
.6
--
85.5
20
.6
0.9
0.4
2.0
2.2
51.0
-
--
2.5
Fem
ale
3-
--
1.3
-29
.2
1.0
-70
.1
7.9
0.6
0.5
2.4
3.2
31.0
-
1.0
-1.
6
Mal
e 1
-2.
7-
3.7
-33
.2
2.5
-13
4.8
41.3
3.
6 1.
2 5.
0 5.
8 73
.7
--
-38
.7Su
lfate
11-D
C
17-O
H-
5α-
5α-
AA
PA
N
C
OR
T C
SD
HEA
D
HT
E2E3
E1
HC
IP
PREG
PR
OG
T
frac
tion
PREG
D
HP
THD
OC
Fem
ale
1-
-*-
--
38.4
5.
3 5.
3-
12.6
0.
50.
04*
-*0.
6*-
-2.
7*-
1.1
Fem
ale
2-
-*-
--
64.3
19
.1
5.3
21.6
21
2.1
0.2
0.17
* 0.
7*
0.8*
22.4
-
11.7
*1.
93.
7Fe
mal
e 3
--*
--
-44
.5
7.1
4.5
15.3
19
2.7
0.2
0.1*
-*
1.2*
--
11.3
*-
1.3
Mal
e 1
--*
--
-12
2.7
22.2
7.
037
.4
426.
7 1.
00.
3*
1.9*
1.
5*24
.1
-47
.5*
2.1
30.7
* th
ese
com
poun
ds w
ere
sign
ifica
ntly
dec
ompo
sed
unde
r th
e ac
id h
ydro
lysi
s co
ndit
ions
and
the
resu
lts m
ay n
ot r
efle
ct a
ctua
l lev
els
in th
e sa
mpl
es
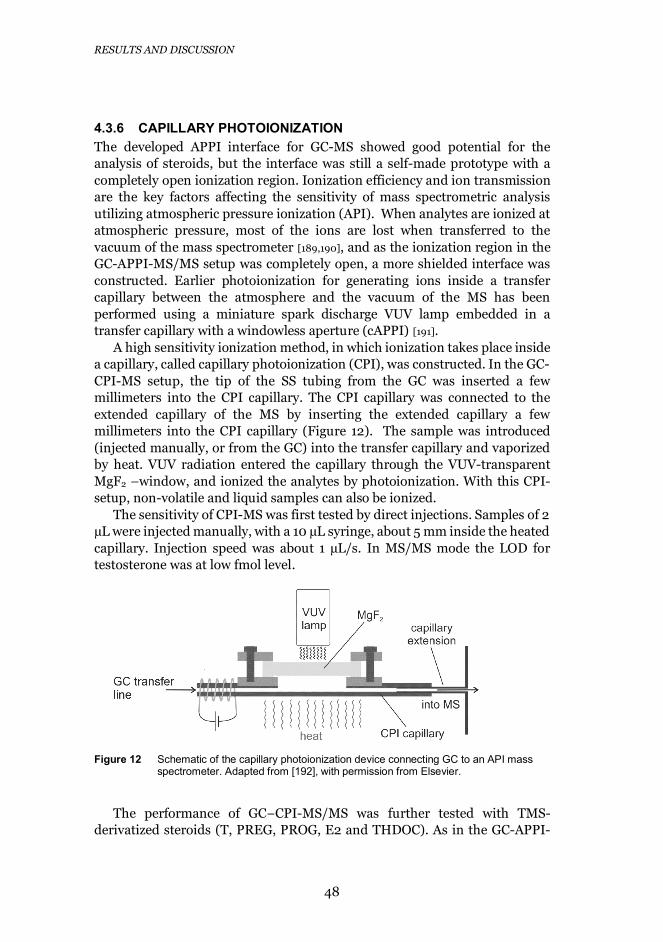
RESULTS AND DISCUSSION
48
4.3.6 CAPILLARY PHOTOIONIZATIONThe developed APPI interface for GC-MS showed good potential for theanalysis of steroids, but the interface was still a self-made prototype with acompletely open ionization region. Ionization efficiency and ion transmissionare the key factors affecting the sensitivity of mass spectrometric analysisutilizing atmospheric pressure ionization (API). When analytes are ionized atatmospheric pressure, most of the ions are lost when transferred to thevacuum of the mass spectrometer [189,190], and as the ionization region in theGC-APPI-MS/MS setup was completely open, a more shielded interface wasconstructed. Earlier photoionization for generating ions inside a transfercapillary between the atmosphere and the vacuum of the MS has beenperformed using a miniature spark discharge VUV lamp embedded in atransfer capillary with a windowless aperture (cAPPI) [191].
A high sensitivity ionization method, in which ionization takes place insidea capillary, called capillary photoionization (CPI), was constructed. In the GC-CPI-MS setup, the tip of the SS tubing from the GC was inserted a fewmillimeters into the CPI capillary. The CPI capillary was connected to theextended capillary of the MS by inserting the extended capillary a fewmillimeters into the CPI capillary (Figure 12). The sample was introduced(injected manually, or from the GC) into the transfer capillary and vaporizedby heat. VUV radiation entered the capillary through the VUV-transparentMgF2 –window, and ionized the analytes by photoionization. With this CPI-setup, non-volatile and liquid samples can also be ionized.
The sensitivity of CPI-MS was first tested by direct injections. Samples of 2μL were injected manually, with a 10 μL syringe, about 5 mm inside the heatedcapillary. Injection speed was about 1 μL/s. In MS/MS mode the LOD fortestosterone was at low fmol level.
Figure 12 Schematic of the capillary photoionization device connecting GC to an API massspectrometer. Adapted from [192], with permission from Elsevier.
The performance of GC−CPI-MS/MS was further tested with TMS-derivatized steroids (T, PREG, PROG, E2 and THDOC). As in the GC-APPI-
49
MS setup, with chlorobenzene as dopant, the TMS-steroids produced intensemolecular ions (M+•) via charge exchange reaction, with no formation ofprotonated molecules and minimal fragmentation. No peak broadening ortailing was caused by the CPI interface, due to the high temperature of thesetup.
Artificial urine samples spiked with steroids (T, PROG, PREG, E2, andTHDOC) were used for the validation of the GC-CPI-MS method. The samplepretreatment was similar to the GC-APPI-MS/MS method. The validatedparameters were linearity, limits of detection (LOD), and injectionrepeatability. The application was verified by analyzing human urine samplesfrom two healthy males. The LODs (with a S/N of 3) for the steroids spiked inartificial urine were between 2 and 6 pg/mL, being lower or equal to thosepresented for GC-EI-MS/MS [105,113]. Repeatability of injection with GC-CPI-MS/MS was good: RSDs of the peak areas were 7% or less at a concentrationof 5 ng/mL. The linearity of the method was measured in the range of 10pg/mL to 100 ng/mL, and the coefficient of determination (r2) was higher than0.993, indicating good linearity.
As the CPI-device is heated, and can also handle liquid samples andnonvolatile compounds, it can be used both for direct liquid injection and forconnecting LC to MS. CPI also enables GC instruments to be used with APImass spectrometers intended for LC-MS. The initial results indicated highsensitivity, thanks to the high iontransmission efficiency. The results from theanalysis of selected steroids in urine samples show that the method has goodpotential for being used in applications of analyzing less polar compoundssuch as steroids in biological samples. Further experiments with GC, LC, andother types of mass spectrometers are needed to demonstrate the full potentialof CPI.
SUMMARY AND CONCLUSIONS
50
5 SUMMARY AND CONCLUSIONS
The microdialyis sampling and the developed UPLC-MS/MS-analysis methodrequire minimal sample pretreatment, and provide sensitive and selectiveanalysis of intact phase II metabolites of neurotransmitters in the humanbrain. In this study, intact phase II metabolites of 5-HT and DA were analyzedin human brain samples without hydrolysis of the conjugates, and severalintact glucuronides and sulfates were unambiguously identified andquantified in human brain microdialysis and CSF samples for the first time. 5-HIAA-S was also determined for the first time in human brain. As the directmethod provides analysis of regioisomers of conjugates, we were able to showthat DA-3-S predominates over DA-4-S in the human brain. The results showthat sulfonation is a more important phase II metabolism pathway thanglucuronidation in the human brain. Further studies, including samples froma larger group of patients, are still required to study interindividual differencesin the amounts of conjugated neurotransmitters versus the concentrations ofthe parent compounds.
The role and the origin of the conjugated neurotransmitter in the brainremains unknown. It is also unknown whether the conjugates possessneurotoxic or neuroprotective properties, if they are pharmacologically activeor not, and additional experiments are needed to study the pharmacologicalimpact of conjugated and especially sulfonated neurotransmitters on differentbrain functions. DA-S is assumed to be biologically less active than DA,possibly providing a source for free DA in brain through enzymatic hydrolysis.Therefore, the study of the permeation of DA-S through the human BBB andthe fate of DA-S in human brain is of great interest.
The peripheral injections of 13C-labelled DA-S followed by analysis of brainmicrodialysis samples by UPLC-MS/MS provides a reliable method to studythe permeation of DA-S through the BBB. The study clearly shows that DA-S,but not DA, is able to permeate the BBB of rats. The result is interesting, sinceDA-S is more polar than DA, and the passive permeation of DA-S through theBBB is not obvious. Therefore, it can be concluded that DA-S most likelypermeates the BBB by binding to an active transporter-protein located in theBBB. However, it is unknown which transporter protein is responsible fortransporting DA-S through the BBB into the brain, which will be a focus offuture studies.
Even though the results show that DA-S crosses the BBB, no informationon the fate of the permeated DA-S in the brain was acquired. The resultsshowed that DA-S is not hydrolyzed to DA or transformed into any commonmetabolites of DA with concentrations above the limits of detection of thismethod. It is therefore possible that DA-S is metabolized by an unknownmechanism, or is transported out of the brain by active transporters. However,these results obtained from experiments with rats cannot be directly applied
51
to humans. DA-S has been found in human brain microdialysis samplespreviously [25], but not in rat brain microdialysis samples, indicating that theconcentration of DA-S in human brain is significantly higher than in rat brain.
Steroids have recently been analyzed by methods combining gaschromatography (GC) to atmospheric pressure photoionization utilizingheated nebulizer microchips (μAPPI). The interface constructed in this workfor combining GC to mass spectrometry (MS) using dopant-assistedatmospheric pressure photoionization (APPI) utilized only commerciallyavailable hardware. The developed GC-APPI-MS/MS method provided highchromatographic resolution and efficient ionization of neurosteroids, whichformed mainly abundant radical cations (M•+) with minimal fragmentationwhen chlorobenzene was used as the dopant. The method showed goodspecificity and sensitivity and is therefore well suited for the analysis ofneurosteroids in biological samples. The APPI interface provides an easymeans to couple GC to MS, allowing the high chromatographic resolutioncapacity of gas chromatography to be exploited with any mass spectrometerequipped with an atmospheric pressure ionization interface. The radicalcations of the steroids formed by APPI ionization showed fragmentationpatterns in their MS/MS spectra similar to the patterns seen in thecorresponding EI spectra. Use of EI libraries could thus be possible, enablingthe identification of a wide range of unknown compounds.
The GC-APPI-MS interface was nevertheless a self-made prototype, andthe interface was further developed in order to maximize ion transmission andthus increase the sensitivity of the method. The presented prototype capillaryphotoionization device, CPI, showed good potential as a simple and effectiveion source for the analysis of both polar and nonpolar compounds. Comparedto the GC-APPI-MS/MS method, which employed a completely open ionsource, ion transmission is higher with the CPI device, where the ionizationregion is shielded. Further experiments with GC, LC, and other types of massspectrometers are needed to demonstrate the full potential of CPI.
SUMMARY AND CONCLUSIONS
52
REFERENCES
1. Pardridge WM. Drug transport across the blood–brain barrier. J Cereb BloodFlow Metab. 2012;32: 1959–1972. doi:10.1038/jcbfm.2012.126
2. Pajouhesh H, Lenz GR. Medicinal Chemical Properties of Successful CentralNervous System Drugs. NeuroRx. 2005;2: 541–553.
3. Webster R, editor. Neurotransmitters, Drugs and Brain Function. 1st ed.Wiley; 2001.
4. Owens MJ, Nemeroff CB. Role of serotonin in the pathophysiology ofdepression: focus on the serotonin transporter. Clin Chem. 1994;40: 288–295.
5. Berger M, Gray JA, Roth BL. The Expanded Biology of Serotonin. Annu RevMed. 2009;60: 355–366. doi:10.1146/annurev.med.60.042307.110802
6. Barbeau A. L-Dopa Therapy in Parkinson’s Disease. Can Med Assoc J.1969;101: 59–68.
7. Dunlop BW, Nemeroff CB. The role of dopamine in the pathophysiology ofdepression. Arch Gen Psychiatry. 2007;64: 327–337.
8. Baulieu EE. Neurosteroids: a novel function of the brain.Psychoneuroendocrinology. 1998;23: 963–987.
9. Kawato S, Yamada M, Kimoto T. Brain neurosteroids are 4th generationneuromessengers in the brain: Cell biophysical analysis of steroid signaltransduction. Adv Biophys. 2003;37: 1–48. doi:10.1016/S0065-227X(03)80002-3
10. Wang Y, Karu K, Griffiths WJ. Analysis of neurosterols and neurosteroids bymass spectrometry. Biochimie. 2007;89: 182–191.doi:10.1016/j.biochi.2006.10.008
11. Mellon SH, Griffin LD. Neurosteroids: biochemistry and clinical significance.Trends Endocrinol Metab. 2002;13: 35–43. doi:10.1016/S1043-2760(01)00503-3
12. Stoffel-Wagner B. Neurosteroid biosynthesis in the human brain and itsclinical implications. Ann N Y Acad Sci. 2003;1007: 64–78.
13. Weill-Engerer S. Neurosteroid Quantification in Human Brain Regions:Comparison between Alzheimer’s and Nondemented Patients. J ClinEndocrinol Metab. 2002;87: 5138–5143. doi:10.1210/jc.2002-020878
14. Baulieu E-E, Robel P. Neurosteroids: A new brain function? J SteroidBiochem Mol Biol. 1990;37: 395–403. doi:10.1016/0960-0760(90)90490-C
15. Stoffel-Wagner B. Neurosteroid metabolism in the human brain. Eur JEndocrinol. 2001;145: 669–679.
53
16. King CD, Rios GR, Assouline JA, Tephly TR. Expression of UDP-Glucuronosyltransferases (UGTs) 2B7 and 1A6 in the Human Brain andIdentification of 5-Hydroxytryptamine as a Substrate. Arch Biochem Biophys.1999;365: 156–162. doi:10.1006/abbi.1999.1155
17. Tukey RH, Strassburg CP. Human UDP-glucuronosyltransferases:metabolism, expression, and disease. Annu Rev Pharmacol Toxicol. 2000;40:581–616. doi:10.1146/annurev.pharmtox.40.1.581
18. Court MH, Zhang X, Ding X, Yee KK, Hesse LM, Finel M. Quantitativedistribution of mRNAs encoding the 19 human UDP-glucuronosyltransferaseenzymes in 26 adult and 3 fetal tissues. Xenobiotica. 2012;42: 266–277.doi:10.3109/00498254.2011.618954
19. Ohno S, Nakajin S. Determination of mRNA expression of human UDP-glucuronosyltransferases and application for localization in various humantissues by real-time reverse transcriptase-polymerase chain reaction. DrugMetab Dispos. 2009;37: 32–40. doi:10.1124/dmd.108.023598
20. Schumacher M, Weill-Engerer S, Liere P, Robert F, Franklin RJM, Garcia-Segura LM, et al. Steroid hormones and neurosteroids in normal andpathological aging of the nervous system. Prog Neurobiol. 2003;71: 3–29.
21. Gamage N, Barnett A, Hempel N, Duggleby RG, Windmill KF, Martin JL, etal. Human Sulfotransferases and Their Role in Chemical Metabolism. ToxicolSci. 2006;90: 5–22. doi:10.1093/toxsci/kfj061
22. Riches Z, Stanley EL, Bloomer JC, Coughtrie MWH. Quantitative Evaluationof the Expression and Activity of Five Major Sulfotransferases (SULTs) inHuman Tissues: The SULT “Pie.” Drug Metab Dispos. 2009;37: 2255–2261.doi:10.1124/dmd.109.028399
23. Falany CN. Enzymology of human cytosolic sulfotransferases. FASEB J.1997;11: 206–216.
24. Uutela P, Reinilä R, Harju K, Piepponen P, Ketola RA, Kostiainen R. Analysisof Intact Glucuronides and Sulfates of Serotonin, Dopamine, and Their PhaseI Metabolites in Rat Brain Microdialysates by LiquidChromatography−Tandem Mass Spectrometry. Anal Chem. 2009;81: 8417–8425. doi:10.1021/ac901320z
25. Suominen T, Uutela P, Ketola RA, Bergquist J, Hillered L, Finel M, et al.Determination of Serotonin and Dopamine Metabolites in Human BrainMicrodialysis and Cerebrospinal Fluid Samples by UPLC-MS/MS: Discoveryof Intact Glucuronide and Sulfate Conjugates. PLoS ONE. 2013;8: e68007.doi:10.1371/journal.pone.0068007
26. Maninger N, Wolkowitz OM, Reus VI, Epel ES, Mellon SH. Neurobiologicaland neuropsychiatric effects of dehydroepiandrosterone (DHEA) and DHEAsulfate (DHEAS). Front Neuroendocrinol. 2009;30: 65–91.doi:10.1016/j.yfrne.2008.11.002
27. Schumacher M, Liere P, Akwa Y, Rajkowski K, Griffiths W, Bodin K, et al.Pregnenolone sulfate in the brain: A controversial neurosteroid. NeurochemInt. 2008;52: 522–540. doi:10.1016/j.neuint.2007.08.022
SUMMARY AND CONCLUSIONS
54
28. Klimas R, Mikus G. Morphine-6-glucuronide is responsible for the analgesiceffect after morphine administration: a quantitative review of morphine,morphine-6-glucuronide, and morphine-3-glucuronide. Br J Anaesth. 2014;aeu186. doi:10.1093/bja/aeu186
29. Shimomura K, Kamata O, Ueki S, Ida S, Oguri K, Yoshimura H, et al.Analgesic effect of morphine glucuronides. Tohoku J Exp Med. 1971;105: 45–52.
30. Guillemette C, Bélanger A, Lépine J, others. Metabolic inactivation ofestrogens in breast tissue by UDP-glucuronosyltransferase enzymes: anoverview. Breast Cancer Res. 2004;6: 246–261.
31. Goldstein DS, Holmes C. Neuronal Source of Plasma Dopamine. Clin Chem.2008;54: 1864–1871. doi:10.1373/clinchem.2008.107193
32. Malm J, Kristensen B, Ekstedt J, Wester P. CSF concentration gradients ofmonoamine metabolites in patients with hydrocephalus. J Neurol NeurosurgPsychiatry. 1994;57: 1026–1033.
33. Cooper JR, Bloom FE, Roth RH. The Biochemical Basis ofNeuropharmacology. Oxford University Press; 2003.
34. Moroni F, Corradetti R, Casamenti F, Moneti G, Pepeu G. The release ofendogenous GABA and glutamate from the cerebral cortex in the rat. NaunynSchmiedebergs Arch Pharmacol. 1981;316: 235–239.doi:10.1007/BF00505655
35. J. W Phillis, Smith-Barbour M, O’Regan MH. Changes in extracellular aminoacid neurotransmitters and purines during and following ischemias ofdifferent durations in the rat cerebral cortex. Neurochem Int. 1996;29: 115–120. doi:10.1016/0197-0186(95)00154-9
36. Erickson CK, Graham DT, U’Prichard T. Cortical cups for collecting freeacetylcholine in awake rats. Pharmacol Biochem Behav. 1973;1: 743–746.doi:10.1016/0091-3057(73)90041-5
37. Jones SR, Gainetdinov RR, Caron MG. Application of microdialysis andvoltammetry to assess dopamine functions in genetically altered.Psychopharmacology (Berl). 1999;147: 30–32. doi:10.1007/s002130051137
38. Robinson DL, Venton BJ, Heien MLAV, Wightman RM. Detecting SubsecondDopamine Release with Fast-Scan Cyclic Voltammetry in Vivo. Clin Chem.2003;49: 1763–1773. doi:10.1373/49.10.1763
39. Singewald N, Philippu A. Release of neurotransmitters in the locus coeruleus.Prog Neurobiol. 1998;56: 237–267. doi:10.1016/S0301-0082(98)00039-2
40. Myers RD, Adell A, Lankford MF. Simultaneous comparison of cerebraldialysis and push–pull perfusion in the brain of rats: a critical review.Neurosci Biobehav Rev. 1998;22: 371–387. doi:10.1016/S0149-7634(97)00025-0
41. Kottegoda S, Shaik I, Shippy SA. Demonstration of low flow push–pullperfusion. J Neurosci Methods. 2002;121: 93–101. doi:10.1016/S0165-0270(02)00245-5
55
42. Zhang X, Rauch A, Lee H, Xiao H, Rainer G, Logothetis NK. Capillaryhydrophilic interaction chromatography/mass spectrometry for simultaneousdetermination of multiple neurotransmitters in primate cerebral cortex.Rapid Commun Mass Spectrom. 2007;21: 3621–3628. doi:10.1002/rcm.3251
43. Davies MI, Cooper JD, Desmond SS, Lunte CE, Lunte SM. Analyticalconsiderations for microdialysis sampling. Adv Drug Deliv Rev. 2000;45:169–188.
44. Westerink BHC. Analysis of biogenic amines in microdialysates of the brain. JChromatogr B Biomed Sci App. 2000;747: 21–32. doi:10.1016/S0378-4347(00)00338-8
45. Song P, Mabrouk OS, Hershey ND, Kennedy RT. In Vivo NeurochemicalMonitoring Using Benzoyl Chloride Derivatization and LiquidChromatography–Mass Spectrometry. Anal Chem. 2011;84: 412–419.doi:10.1021/ac202794q
46. Zetterström T, Sharp T, Marsden CA, Ungerstedt U. In Vivo Measurement ofDopamine and Its Metabolites by Intracerebral Dialysis: Changes After d-Amphetamine. J Neurochem. 1983;41: 1769–1773. doi:10.1111/j.1471-4159.1983.tb00893.x
47. Uutela P, Karhu L, Piepponen P, Käenmäki M, Ketola RA, Kostiainen R.Discovery of Dopamine Glucuronide in Rat and Mouse Brain MicrodialysisSamples Using Liquid Chromatography Tandem Mass Spectrometry. AnalChem. 2009;81: 427–434. doi:10.1021/ac801846w
48. Cannazza G, Carrozzo MM, Cazzato AS, Bretis IM, Troisi L, Parenti C, et al.Simultaneous measurement of adenosine, dopamine, acetylcholine and 5-hydroxytryptamine in cerebral mice microdialysis samples by LC–ESI-MS/MS. J Pharm Biomed Anal. 2012;71: 183–186.doi:10.1016/j.jpba.2012.08.004
49. Panin F, Cathala A, Piazza PV, Spampinato U. Coupled intracerebralmicrodialysis and electrophysiology for the assessment of dopamine neuronfunction in vivo. J Pharmacol Toxicol Methods. 2012;65: 83–92.doi:10.1016/j.vascn.2012.01.003
50. Nowak P, Bortel A, Dabrowska J, Oswiecimska J, Drosik M, Kwiecinski A, etal. Amphetamine and mCPP Effects on Dopamine and Serotonin Striatal invivo Microdialysates in an Animal Model of Hyperactivity. Neurotox Res.2007;11: 131–144.
51. Wang D, Zhu W, An Y, Zheng J, Zhang W, Jin L, et al. LC with NovelElectrochemical Detection for Analysis of Monoamine Neurotransmitters inRat Brain After Administration of (R)-Salsolinol and (R)-N-Methylsalsolinol.Chromatographia. 2008;67: 369–374. doi:10.1365/s10337-008-0532-7
52. Ji C, Li W, Ren X, El-Kattan AF, Kozak R, Fountain S, et al. DiethylationLabeling Combined with UPLC/MS/MS for Simultaneous Determination of aPanel of Monoamine Neurotransmitters in Rat Prefrontal CortexMicrodialysates. Anal Chem. 2008;80: 9195–9203. doi:10.1021/ac801339z
SUMMARY AND CONCLUSIONS
56
53. Engström M, Polito A, Reinstrup P, Romner B, Ryding E, Ungerstedt U, et al.Intracerebral microdialysis in severe brain trauma: the importance of catheterlocation. J Neurosurg. 2005;102: 460–469.
54. Hillered L, Persson L, Ponten U, Ungerstedt U. Neurometabolic monitoringof the ischaemic human brain using microdialysis. Acta Neurochir (Wien).1990;102: 91–97. doi:10.1007/BF01405420
55. Hillered L, Vespa PM, Hovda DA. Translational Neurochemical Research inAcute Human Brain Injury: The Current Status and Potential Future forCerebral Microdialysis. J Neurotrauma. 2005;22: 3–41.doi:10.1089/neu.2005.22.3
56. Kanthan R, Shuaib A, Goplen G, Miyashita H. A new method of in-vivomicrodialysis of the human brain. J Neurosci Methods. 1995;60: 151–155.
57. Fried I, Wilson CL, Morrow JW, Cameron KA, Behnke ED, Ackerson LC, et al.Increased dopamine release in the human amygdala during performance ofcognitive tasks. Nat Neurosci. 2001;4: 201–206. doi:10.1038/84041
58. Meyerson BA, Linderoth B, Karlsson H, Ungerstedt U. Microdialysis in thehuman brain: Extracellular measurements in the thalamus of parkinsonianpatients. Life Sci. 1990;46: 301–308. doi:10.1016/0024-3205(90)90037-R
59. Kilpatrick M, Church E, Danish S, Stiefel M, Jaggi J, Halpern C, et al.Intracerebral microdialysis during deep brain stimulation surgery. J NeurosciMethods. 2010;190: 106–111. doi:10.1016/j.jneumeth.2010.04.013
60. Fried I, Wilson CL, Maidment NT, Engel J, Behnke E, Fields TA, et al.Cerebral microdialysis combined with single-neuron andelectroencephalographic recording in neurosurgical patients. J Neurosurg.1999;91: 697–705. doi:10.3171/jns.1999.91.4.0697
61. Staub F, Graf R, Gabel P, Köchling M, Klug N, Heiss WD. Multiple interstitialsubstances measured by microdialysis in patients with subarachnoidhemorrhage. Neurosurgery. 2000;47: 1106.
62. Vermeiren Y, Le Bastard N, Van Hemelrijck A, Drinkenburg WH,Engelborghs S, De Deyn PP. Behavioral correlates of cerebrospinal fluidamino acid and biogenic amine neurotransmitter alterations in dementia.Alzheimers Dement. 2013;9: 488–498. doi:10.1016/j.jalz.2012.06.010
63. Brouns R, Van Hemelrijck A, Drinkenburg WH, Van Dam D, De SurgelooseD, De Deyn PP. Excitatory amino acids and monoaminergicneurotransmitters in cerebrospinal fluid of acute ischemic stroke patients.Neurochem Int. 2010;56: 865–870. doi:10.1016/j.neuint.2009.12.014
64. Van Kammen DP, van Kammen WB, Mann LS, Seppala T, Linnoila M.Dopamine metabolism in the cerebrospinal fluid of drug-free schizophrenicpatients with and without cortical atrophy. Arch Gen Psychiatry. 1986;43:978–983.
65. Koyama E, Minegishi A, Ishizaki T. Simultaneous determination of fourmonoamine metabolites and serotonin in cerebrospinal fluid by “high-performance” liquid chromatography with electrochemical detection;
57
application for patients with Alzheimer’s disease. Clin Chem. 1988;34: 680–684.
66. Luykx JJ, Bakker SC, Lentjes E, Boks MPM, van Geloven N, Eijkemans MJC,et al. Season of Sampling and Season of Birth Influence Serotonin MetaboliteLevels in Human Cerebrospinal Fluid. PLoS ONE. 2012;7: e30497.doi:10.1371/journal.pone.0030497
67. Wester P, Bergström U, Eriksson A, Gezelius C, Hardy J, Winblad B.Ventricular cerebrospinal fluid monoamine transmitter and metaboliteconcentrations reflect human brain neurochemistry in autopsy cases. JNeurochem. 1990;54: 1148–1156.
68. Damkier HH, Brown PD, Praetorius J. Cerebrospinal Fluid Secretion by theChoroid Plexus. Physiol Rev. 2013;93: 1847–1892.doi:10.1152/physrev.00004.2013
69. Segal MB. The Choroid Plexuses and the Barriers Between the Blood and theCerebrospinal Fluid. Cell Mol Neurobiol. 2000;20: 183–196.doi:10.1023/A:1007045605751
70. Strazielle N, Khuth ST, Ghersi-Egea J-F. Detoxification systems, passive andspecific transport for drugs at the blood–CSF barrier in normal andpathological situations. Adv Drug Deliv Rev. 2004;56: 1717–1740.doi:10.1016/j.addr.2004.07.006
71. Hyland K. Clinical Utility of Monoamine Neurotransmitter MetaboliteAnalysis in Cerebrospinal Fluid. Clin Chem. 2008;54: 633–641.doi:10.1373/clinchem.2007.099986
72. Sjostrom R, Ekstedt J, Anggard E. Concentration gradients of monoaminemetabolites in human cerebrospinal fluid. J Neurol Neurosurg Psychiatry.1975;38: 666–668. doi:10.1136/jnnp.38.7.666
73. Shen DD, Artru AA, Adkison KK. Principles and applicability of CSF samplingfor the assessment of CNS drug delivery and pharmacodynamics. Adv DrugDeliv Rev. 2004;56: 1825–1857. doi:10.1016/j.addr.2004.07.011
74. Müller T, Sällström Baum S, Häussermann P, Przuntek H, RommelspacherH, Kuhn W. R- and S-salsolinol are not increased in cerebrospinal fluid ofParkinsonian patients. J Neurol Sci. 1999;164: 158–162.
75. Hölttä M, Zetterberg H, Mirgorodskaya E, Mattsson N, Blennow K, Gobom J.Peptidome Analysis of Cerebrospinal Fluid by LC-MALDI MS. PLoS ONE.2012;7: e42555. doi:10.1371/journal.pone.0042555
76. Noben J-P, Dumont D, Kwasnikowska N, Verhaert P, Somers V, Hupperts R,et al. Lumbar Cerebrospinal Fluid Proteome in Multiple Sclerosis: Characterization by Ultrafiltration, Liquid Chromatography, and MassSpectrometry. J Proteome Res. 2006;5: 1647–1657. doi:10.1021/pr0504788
77. Young SN, Garelis E, Lal S, Martin JB, Molina-Negro P, Ethier R, et al.Tryptophan and 5-hydroxyindoleacetic acid in human cerebrospinal fluid. JNeurochem. 1974;22: 777–779. doi:10.1111/j.1471-4159.1974.tb04294.x
SUMMARY AND CONCLUSIONS
58
78. O’Brien JS, Sampson EL. Lipid composition of the normal human brain: graymatter, white matter, and myelin. J Lipid Res. 1965;6: 537–544.
79. Kumar AM, Fernandez JB, Gonzalez L, Kumar M. Ultra Micro Quantificationof Dopamine and Homovanillic Acid in Human Brain Tissue: Quest forHigher Recovery and Sensitivity with CoulArray HPLC-ECD System. J LiqChromatogr Relat Technol. 2006;29: 777–799.doi:10.1080/10826070500530245
80. Del Bigio MR, Vriend JP. Monoamine neurotransmitters and amino acids inthe cerebrum and striatum of immature rats with kaolin-inducedhydrocephalus. Brain Res. 1998;798: 119–126.
81. Warnhoff M. Simultaneous determination of norepinephrine, dopamine, 5-hydroxytryptamine and their main metabolites in rat brain using high-performance liquid chromatography with electrochemical detection.Enzymatic hydrolysis of metabolites prior to chromatography. J Chromatogr.1984;307: 271–281.
82. De Benedetto GE, Fico D, Pennetta A, Malitesta C, Nicolardi G, LofrumentoDD, et al. A rapid and simple method for the determination of 3,4-dihydroxyphenylacetic acid, norepinephrine, dopamine, and serotonin inmouse brain homogenate by HPLC with fluorimetric detection. J PharmBiomed Anal. 2014;98: 266–270. doi:10.1016/j.jpba.2014.05.039
83. Su F, Wang F, Zhu R, Li H. Determination of 5-Hydroxytryptamine,Norepinephrine, Dopamine and Their Metabolites in Rat Brain Tissue by LC–ESI–MS–MS. Chromatographia. 2009;69: 207–213. doi:10.1365/s10337-008-0879-9
84. Bucht G, Adolfsson R, Gottfries CG, Roos B-E, Winblad B. Distribution of 5-hydroxytryptamine and 5-hydroxyindoleacetic acid in human brain inrelation to age, drug influence, agonal status and circadian variation. J NeuralTransm. 1981;51: 185–203. doi:10.1007/BF01248951
85. Tareke E, Bowyer JF, Doerge DR. Quantification of rat brainneurotransmitters and metabolites using liquid chromatography/electrospraytandem mass spectrometry and comparison with liquidchromatography/electrochemical detection. Rapid Commun Mass Spectrom.2007;21: 3898–3904. doi:10.1002/rcm.3295
86. Muzzi C, Bertocci E, Terzuoli L, Porcelli B, Ciari I, Pagani R, et al.Simultaneous determination of serum concentrations of levodopa, dopamine,3-O-methyldopa and α-methyldopa by HPLC. Biomed Pharmacother.2008;62: 253–258. doi:10.1016/j.biopha.2007.10.018
87. González RR, Fernández RF, Vidal JLM, Frenich AG, Pérez MLG.Development and validation of an ultra-high performance liquidchromatography-tandem mass-spectrometry (UHPLC-MS/MS) method forthe simultaneous determination of neurotransmitters in rat brain samples. JNeurosci Methods. 2011;198: 187–194. doi:10.1016/j.jneumeth.2011.03.023
88. Yoshitake T, Kehr J, Yoshitake S, Fujino K, Nohta H, Yamaguchi M.Determination of serotonin, noradrenaline, dopamine and their metabolitesin rat brain extracts and microdialysis samples by column liquidchromatography with fluorescence detection following derivatization with
59
benzylamine and 1,2-diphenylethylenediamine. J Chromatogr B. 2004;807:177–183. doi:10.1016/j.jchromb.2004.03.069
89. Xu H, Wang D, Zhang W, Zhu W, Yamamoto K, Jin L. Determination of isatinand monoamine neurotransmitters in rat brain with liquid chromatographyusing palladium hexacyanoferrate modified electrode. Anal Chim Acta.2006;577: 207–213. doi:10.1016/j.aca.2006.06.042
90. Ji C, Li W, Ren X-D, El-Kattan AF, Kozak R, Fountain S, et al. Diethylationlabeling combined with UPLC/MS/MS for simultaneous determination of apanel of monoamine neurotransmitters in rat prefrontal cortexmicrodialysates. Anal Chem. 2008;80: 9195–9203. doi:10.1021/ac801339z
91. Kai M, Iida H, Nohta H, Lee MK, Ohta K. Fluorescence derivatizing procedurefor 5-hydroxytryptamine and 5-hydroxyindoleacetic acid using 1,2-diphenylethylenediamine reagent and their sensitive liquid chromatographicdetermination. J Chromatogr B Biomed Sci App. 1998;720: 25–31.doi:10.1016/S0378-4347(98)00420-4
92. Kanthan R, Shuaib DA, Griebel R, El-Alazounni H, Miyashita H, Kalra J.Evaluation of monoaminergic neurotransmitters in the acute focal ischemichuman brain model by intracerebral in vivo microdialysis. Neurochem Res.1996;21: 563–566. doi:10.1007/BF02527754
93. Wester P, Gottfries J, Winblad B. Simultaneous liquid chromatographicdetermination of seventeen of the major monoamine neurotransmitters,precursors and metabolites: II. Assessment of human brain and cerebrospinalfluid concentrations. J Chromatogr B Biomed Sci App. 1987;415: 275–288.doi:10.1016/S0378-4347(00)83219-3
94. Herregodts P, Ebinger G, Michotte Y. Distribution of monoamines in humanbrain: evidence for neurochemical heterogeneity in subcortical as well as incortical areas. Brain Res. 1991;542: 300–306.
95. Przedborski S, Levivier M, Raftopoulos C, Naini AB, Hildebrand J. Peripheraland central pharmacokinetics of apomorphine and its effect on dopaminemetabolism in humans. Mov Disord. 1995;10: 28–36.doi:10.1002/mds.870100107
96. Appelblad P, Irgum K. Separation and detection of neuroactive steroids frombiological matrices. J Chromatogr A. 2002;955: 151–182. doi:10.1016/S0021-9673(02)00227-3
97. George MS, Guidotti A, Rubinow D, Pan B, Mikalauskas K, Post RM. CSFneuroactive steroids in affective disorders: Pregnenolone, progesterone, andDBI. Biol Psychiatry. 1994;35: 775–780. doi:10.1016/0006-3223(94)91139-8
98. Naylor JC, Hulette CM, Steffens DC, Shampine LJ, Ervin JF, Payne VM, et al.Cerebrospinal Fluid Dehydroepiandrosterone Levels Are Correlated withBrain Dehydroepiandrosterone Levels, Elevated in Alzheimer’s Disease, andRelated to Neuropathological Disease Stage. J Clin Endocrinol Metab.2008;93: 3173–3178. doi:10.1210/jc.2007-1229
99. Kim S-B, Hill M, Kwak Y-T, Hampl R, Jo D-H, Morfin R. Neurosteroids:Cerebrospinal fluid levels for Alzheimer’s disease and vascular dementiadiagnostics. J Clin Endocrinol Metab. 2003;88: 5199–5206.
SUMMARY AND CONCLUSIONS
60
100. Chatman K, Hollenbeck T, Hagey L, Vallee M, Purdy R, Weiss F, et al.Nanoelectrospray Mass Spectrometry and Precursor Ion Monitoring forQuantitative Steroid Analysis and Attomole Sensitivity. Anal Chem. 1999;71:2358–2363. doi:10.1021/ac9806411
101. Kancheva R, Hill M, Novák Z, Chrastina J, Velíková M, Kancheva L, et al.Peripheral neuroactive steroids may be as good as the steroids in thecerebrospinal fluid for the diagnostics of CNS disturbances. J SteroidBiochem Mol Biol. 2010;119: 35–44. doi:10.1016/j.jsbmb.2009.12.006
102. Bicikova M, Putz Z, Hill M, Hampl R, Diebbelt L, Tallova J, et al. SerumLevels of Neurosteroid Allopregnanolone in Patients with PremenstrualSyndrome and Patients after Thyroidectomy. Endocr Regul. 1998;32: 87–92.
103. Kim YS, Zhang H, Kim HY. Profiling neurosteroids in cerebrospinal fluidsand plasma by gas chromatography/electron capture negative chemicalionization mass spectrometry. Anal Biochem. 2000;277: 187–195.doi:10.1006/abio.1999.4384
104. Hill M, Havlíková H, Vrbíková J, Kancheva R, Kancheva L, Pouzar V, et al.The identification and simultaneous quantification of 7-hydroxylatedmetabolites of pregnenolone, dehydroepiandrosterone, 3β,17β-androstenediol, and testosterone in human serum using gaschromatography–mass spectrometry. J Steroid Biochem Mol Biol. 2005;96:187–200. doi:10.1016/j.jsbmb.2005.02.009
105. Hansen M, Jacobsen NW, Nielsen FK, Björklund E, Styrishave B, Halling-Sørensen B. Determination of steroid hormones in blood by GC–MS/MS.Anal Bioanal Chem. 2011;400: 3409–3417. doi:10.1007/s00216-011-5038-8
106. Chao A, Schlinger BA, Remage-Healey L. Combined Liquid and Solid-PhaseExtraction Improves Quantification of Brain Estrogen Content. FrontNeuroanat. 2011;5. doi:10.3389/fnana.2011.00057
107. Gonzalo-Lumbreras R, Pimentel-Trapero D, Izqierdo-Hornillos R. Solventand solid-phase extraction of natural and synthetic anabolic steroids inhuman urine. J Chromatogr B Biomed Sci App. 2001;754: 419–425.doi:10.1016/S0378-4347(01)00027-5
108. Palermo M, Gomez-Sanchez C, Roitman E, Shackleton CHL. Quantitation ofcortisol and related 3-oxo-4-ene steroids in urine using gaschromatography/mass spectrometry with stable isotope-labeled internalstandards. Steroids. 1996;61: 583–589. doi:10.1016/S0039-128X(96)00118-9
109. Gomes RL, Meredith W, Snape CE, Sephton MA. Conjugated steroids:analytical approaches and applications. Anal Bioanal Chem. 2009;393: 453–458. doi:10.1007/s00216-008-2451-8
110. Liere P, Akwa Y, Weill-Engerer S, Eychenne B, Pianos A, Robel P, et al.Validation of an analytical procedure to measure trace amounts ofneurosteroids in brain tissue by gas chromatography–mass spectrometry. JChromatogr B Biomed Sci App. 2000;739: 301–312. doi:10.1016/S0378-4347(99)00563-0
111. Liere P, Pianos A, Eychenne B, Cambourg A, Liu S, Griffiths W, et al. Novellipoidal derivatives of pregnenolone and dehydroepiandrosterone and
61
absence of their sulfated counterparts in rodent brain. J Lipid Res. 2004;45:2287–2302. doi:10.1194/jlr.M400244-JLR200
112. Segura J, Ventura R, Jurado C. Derivatization procedures for gaschromatographic–mass spectrometric determination of xenobiotics inbiological samples, with special attention to drugs of abuse and dopingagents. J Chromatogr B Biomed Sci App. 1998;713: 61–90.doi:10.1016/S0378-4347(98)00089-9
113. Magnisali P, Dracopoulou M, Mataragas M, Dacou-Voutetakis A, MoutsatsouP. Routine method for the simultaneous quantification of 17α-hydroxyprogesterone, testosterone, dehydroepiandrosterone,androstenedione, cortisol, and pregnenolone in human serum of neonatesusing gas chromatography–mass spectrometry. J Chromatogr A. 2008;1206:166–177. doi:10.1016/j.chroma.2008.07.057
114. Van Renterghem P, Van Eenoo P, Geyer H, Schänzer W, Delbeke FT.Reference ranges for urinary concentrations and ratios of endogenoussteroids, which can be used as markers for steroid misuse, in a Caucasianpopulation of athletes. Steroids. 2010;75: 154–163.doi:10.1016/j.steroids.2009.11.008
115. Halket JM, Waterman D, Przyborowska AM, Patel RKP, Fraser PD, BramleyPM. Chemical derivatization and mass spectral libraries in metabolic profilingby GC/MS and LC/MS/MS. J Exp Bot. 2005;56: 219–243.doi:10.1093/jxb/eri069
116. Zhang Y, Tobias HJ, Brenna JT. Highly sensitive and selective analysis ofurinary steroids by comprehensive two-dimensional gas chromatographycombined with positive chemical ionization quadrupole mass spectrometry.The Analyst. 2012;137: 3102. doi:10.1039/c2an35087d
117. Zhang Y, Tobias HJ, Auchus RJ, Brenna JT. Comprehensive 2-dimensionalgas chromatography fast quadrupole mass spectrometry (GC × GC-qMS) forurinary steroid profiling: mass spectral characteristics with chemicalionization. Drug Test Anal. 2011;3: 857–867. doi:10.1002/dta.380
118. Vallée M, Rivera JD, Koob GF, Purdy RH, Fitzgerald RL. Quantification ofneurosteroids in rat plasma and brain following swim stress andallopregnanolone administration using negative chemical ionization gaschromatography/mass spectrometry. Anal Biochem. 2000;287: 153–166.doi:10.1006/abio.2000.4841
119. Marx CE, Stevens RD, Shampine LJ, Uzunova V, Trost WT, Butterfield MI, etal. Neuroactive Steroids are Altered in Schizophrenia and Bipolar Disorder:Relevance to Pathophysiology and Therapeutics. Neuropsychopharmacology.2006;31: 1249–1263. doi:10.1038/sj.npp.1300952
120. Ketola RA, Hakala KS. Direct analysis of glucuronides with liquidchromatography-mass spectrometric techniques and methods. Curr DrugMetab. 2010;11: 561–582.
121. Liu S, Griffiths WJ, Sjövall J. Capillary Liquid Chromatography/ElectrosprayMass Spectrometry for Analysis of Steroid Sulfates in Biological Samples.Anal Chem. 2003;75: 791–797. doi:10.1021/ac0262154
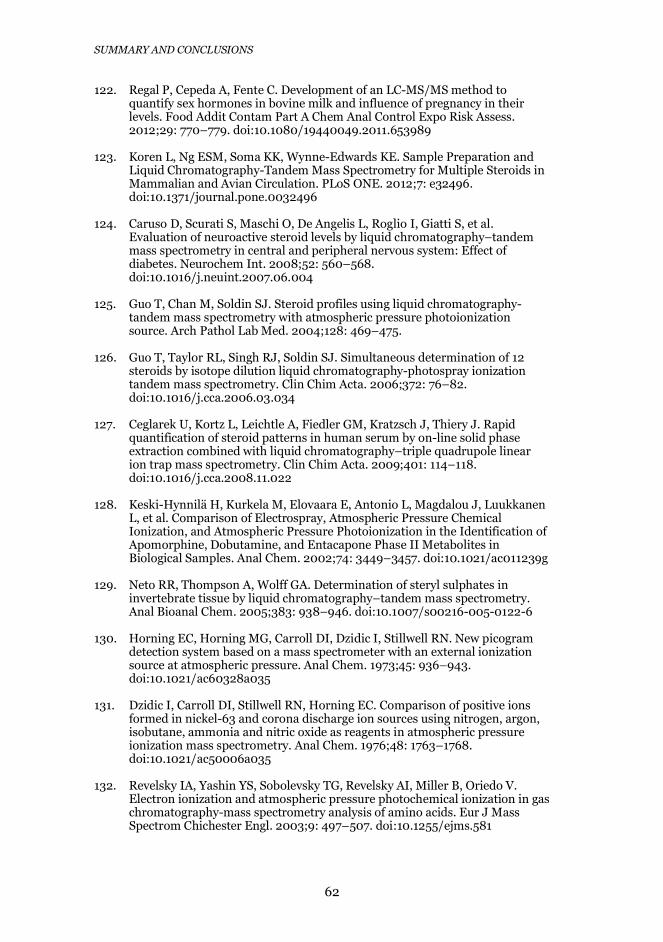
SUMMARY AND CONCLUSIONS
62
122. Regal P, Cepeda A, Fente C. Development of an LC-MS/MS method toquantify sex hormones in bovine milk and influence of pregnancy in theirlevels. Food Addit Contam Part A Chem Anal Control Expo Risk Assess.2012;29: 770–779. doi:10.1080/19440049.2011.653989
123. Koren L, Ng ESM, Soma KK, Wynne-Edwards KE. Sample Preparation andLiquid Chromatography-Tandem Mass Spectrometry for Multiple Steroids inMammalian and Avian Circulation. PLoS ONE. 2012;7: e32496.doi:10.1371/journal.pone.0032496
124. Caruso D, Scurati S, Maschi O, De Angelis L, Roglio I, Giatti S, et al.Evaluation of neuroactive steroid levels by liquid chromatography–tandemmass spectrometry in central and peripheral nervous system: Effect ofdiabetes. Neurochem Int. 2008;52: 560–568.doi:10.1016/j.neuint.2007.06.004
125. Guo T, Chan M, Soldin SJ. Steroid profiles using liquid chromatography-tandem mass spectrometry with atmospheric pressure photoionizationsource. Arch Pathol Lab Med. 2004;128: 469–475.
126. Guo T, Taylor RL, Singh RJ, Soldin SJ. Simultaneous determination of 12steroids by isotope dilution liquid chromatography-photospray ionizationtandem mass spectrometry. Clin Chim Acta. 2006;372: 76–82.doi:10.1016/j.cca.2006.03.034
127. Ceglarek U, Kortz L, Leichtle A, Fiedler GM, Kratzsch J, Thiery J. Rapidquantification of steroid patterns in human serum by on-line solid phaseextraction combined with liquid chromatography–triple quadrupole linearion trap mass spectrometry. Clin Chim Acta. 2009;401: 114–118.doi:10.1016/j.cca.2008.11.022
128. Keski-Hynnilä H, Kurkela M, Elovaara E, Antonio L, Magdalou J, LuukkanenL, et al. Comparison of Electrospray, Atmospheric Pressure ChemicalIonization, and Atmospheric Pressure Photoionization in the Identification ofApomorphine, Dobutamine, and Entacapone Phase II Metabolites inBiological Samples. Anal Chem. 2002;74: 3449–3457. doi:10.1021/ac011239g
129. Neto RR, Thompson A, Wolff GA. Determination of steryl sulphates ininvertebrate tissue by liquid chromatography–tandem mass spectrometry.Anal Bioanal Chem. 2005;383: 938–946. doi:10.1007/s00216-005-0122-6
130. Horning EC, Horning MG, Carroll DI, Dzidic I, Stillwell RN. New picogramdetection system based on a mass spectrometer with an external ionizationsource at atmospheric pressure. Anal Chem. 1973;45: 936–943.doi:10.1021/ac60328a035
131. Dzidic I, Carroll DI, Stillwell RN, Horning EC. Comparison of positive ionsformed in nickel-63 and corona discharge ion sources using nitrogen, argon,isobutane, ammonia and nitric oxide as reagents in atmospheric pressureionization mass spectrometry. Anal Chem. 1976;48: 1763–1768.doi:10.1021/ac50006a035
132. Revelsky IA, Yashin YS, Sobolevsky TG, Revelsky AI, Miller B, Oriedo V.Electron ionization and atmospheric pressure photochemical ionization in gaschromatography-mass spectrometry analysis of amino acids. Eur J MassSpectrom Chichester Engl. 2003;9: 497–507. doi:10.1255/ejms.581
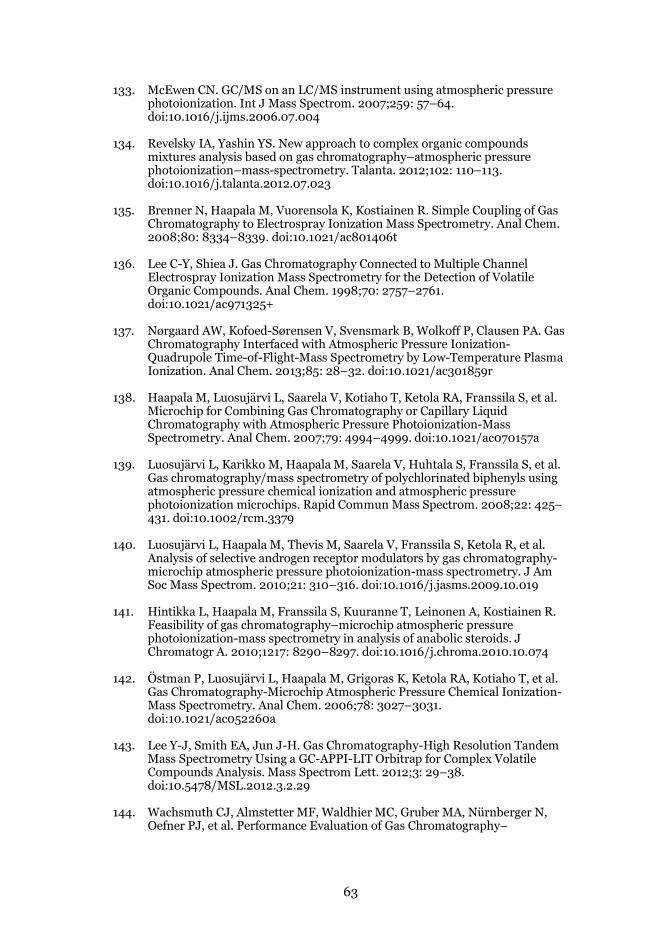
63
133. McEwen CN. GC/MS on an LC/MS instrument using atmospheric pressurephotoionization. Int J Mass Spectrom. 2007;259: 57–64.doi:10.1016/j.ijms.2006.07.004
134. Revelsky IA, Yashin YS. New approach to complex organic compoundsmixtures analysis based on gas chromatography–atmospheric pressurephotoionization–mass-spectrometry. Talanta. 2012;102: 110–113.doi:10.1016/j.talanta.2012.07.023
135. Brenner N, Haapala M, Vuorensola K, Kostiainen R. Simple Coupling of GasChromatography to Electrospray Ionization Mass Spectrometry. Anal Chem.2008;80: 8334–8339. doi:10.1021/ac801406t
136. Lee C-Y, Shiea J. Gas Chromatography Connected to Multiple ChannelElectrospray Ionization Mass Spectrometry for the Detection of VolatileOrganic Compounds. Anal Chem. 1998;70: 2757–2761.doi:10.1021/ac971325+
137. Nørgaard AW, Kofoed-Sørensen V, Svensmark B, Wolkoff P, Clausen PA. GasChromatography Interfaced with Atmospheric Pressure Ionization-Quadrupole Time-of-Flight-Mass Spectrometry by Low-Temperature PlasmaIonization. Anal Chem. 2013;85: 28–32. doi:10.1021/ac301859r
138. Haapala M, Luosujärvi L, Saarela V, Kotiaho T, Ketola RA, Franssila S, et al.Microchip for Combining Gas Chromatography or Capillary LiquidChromatography with Atmospheric Pressure Photoionization-MassSpectrometry. Anal Chem. 2007;79: 4994–4999. doi:10.1021/ac070157a
139. Luosujärvi L, Karikko M, Haapala M, Saarela V, Huhtala S, Franssila S, et al.Gas chromatography/mass spectrometry of polychlorinated biphenyls usingatmospheric pressure chemical ionization and atmospheric pressurephotoionization microchips. Rapid Commun Mass Spectrom. 2008;22: 425–431. doi:10.1002/rcm.3379
140. Luosujärvi L, Haapala M, Thevis M, Saarela V, Franssila S, Ketola R, et al.Analysis of selective androgen receptor modulators by gas chromatography-microchip atmospheric pressure photoionization-mass spectrometry. J AmSoc Mass Spectrom. 2010;21: 310–316. doi:10.1016/j.jasms.2009.10.019
141. Hintikka L, Haapala M, Franssila S, Kuuranne T, Leinonen A, Kostiainen R.Feasibility of gas chromatography–microchip atmospheric pressurephotoionization-mass spectrometry in analysis of anabolic steroids. JChromatogr A. 2010;1217: 8290–8297. doi:10.1016/j.chroma.2010.10.074
142. Östman P, Luosujärvi L, Haapala M, Grigoras K, Ketola RA, Kotiaho T, et al.Gas Chromatography-Microchip Atmospheric Pressure Chemical Ionization-Mass Spectrometry. Anal Chem. 2006;78: 3027–3031.doi:10.1021/ac052260a
143. Lee Y-J, Smith EA, Jun J-H. Gas Chromatography-High Resolution TandemMass Spectrometry Using a GC-APPI-LIT Orbitrap for Complex VolatileCompounds Analysis. Mass Spectrom Lett. 2012;3: 29–38.doi:10.5478/MSL.2012.3.2.29
144. Wachsmuth CJ, Almstetter MF, Waldhier MC, Gruber MA, Nürnberger N,Oefner PJ, et al. Performance Evaluation of Gas Chromatography–
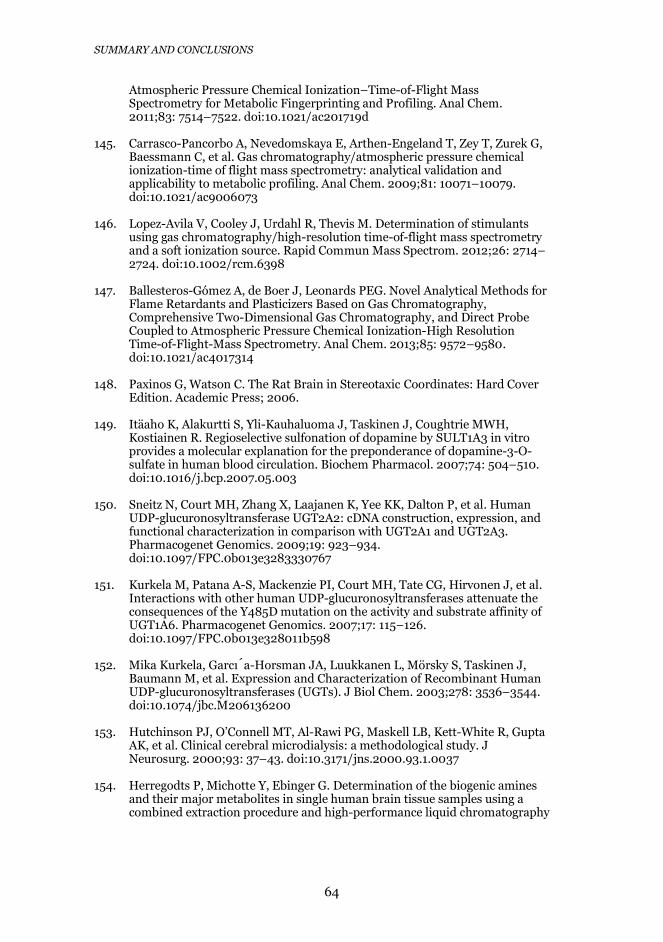
SUMMARY AND CONCLUSIONS
64
Atmospheric Pressure Chemical Ionization–Time-of-Flight MassSpectrometry for Metabolic Fingerprinting and Profiling. Anal Chem.2011;83: 7514–7522. doi:10.1021/ac201719d
145. Carrasco-Pancorbo A, Nevedomskaya E, Arthen-Engeland T, Zey T, Zurek G,Baessmann C, et al. Gas chromatography/atmospheric pressure chemicalionization-time of flight mass spectrometry: analytical validation andapplicability to metabolic profiling. Anal Chem. 2009;81: 10071–10079.doi:10.1021/ac9006073
146. Lopez-Avila V, Cooley J, Urdahl R, Thevis M. Determination of stimulantsusing gas chromatography/high-resolution time-of-flight mass spectrometryand a soft ionization source. Rapid Commun Mass Spectrom. 2012;26: 2714–2724. doi:10.1002/rcm.6398
147. Ballesteros-Gómez A, de Boer J, Leonards PEG. Novel Analytical Methods forFlame Retardants and Plasticizers Based on Gas Chromatography,Comprehensive Two-Dimensional Gas Chromatography, and Direct ProbeCoupled to Atmospheric Pressure Chemical Ionization-High ResolutionTime-of-Flight-Mass Spectrometry. Anal Chem. 2013;85: 9572–9580.doi:10.1021/ac4017314
148. Paxinos G, Watson C. The Rat Brain in Stereotaxic Coordinates: Hard CoverEdition. Academic Press; 2006.
149. Itäaho K, Alakurtti S, Yli-Kauhaluoma J, Taskinen J, Coughtrie MWH,Kostiainen R. Regioselective sulfonation of dopamine by SULT1A3 in vitroprovides a molecular explanation for the preponderance of dopamine-3-O-sulfate in human blood circulation. Biochem Pharmacol. 2007;74: 504–510.doi:10.1016/j.bcp.2007.05.003
150. Sneitz N, Court MH, Zhang X, Laajanen K, Yee KK, Dalton P, et al. HumanUDP-glucuronosyltransferase UGT2A2: cDNA construction, expression, andfunctional characterization in comparison with UGT2A1 and UGT2A3.Pharmacogenet Genomics. 2009;19: 923–934.doi:10.1097/FPC.0b013e3283330767
151. Kurkela M, Patana A-S, Mackenzie PI, Court MH, Tate CG, Hirvonen J, et al.Interactions with other human UDP-glucuronosyltransferases attenuate theconsequences of the Y485D mutation on the activity and substrate affinity ofUGT1A6. Pharmacogenet Genomics. 2007;17: 115–126.doi:10.1097/FPC.0b013e328011b598
152. Mika Kurkela, Garcı́a-Horsman JA, Luukkanen L, Mörsky S, Taskinen J,Baumann M, et al. Expression and Characterization of Recombinant HumanUDP-glucuronosyltransferases (UGTs). J Biol Chem. 2003;278: 3536–3544.doi:10.1074/jbc.M206136200
153. Hutchinson PJ, O’Connell MT, Al-Rawi PG, Maskell LB, Kett-White R, GuptaAK, et al. Clinical cerebral microdialysis: a methodological study. JNeurosurg. 2000;93: 37–43. doi:10.3171/jns.2000.93.1.0037
154. Herregodts P, Michotte Y, Ebinger G. Determination of the biogenic aminesand their major metabolites in single human brain tissue samples using acombined extraction procedure and high-performance liquid chromatography
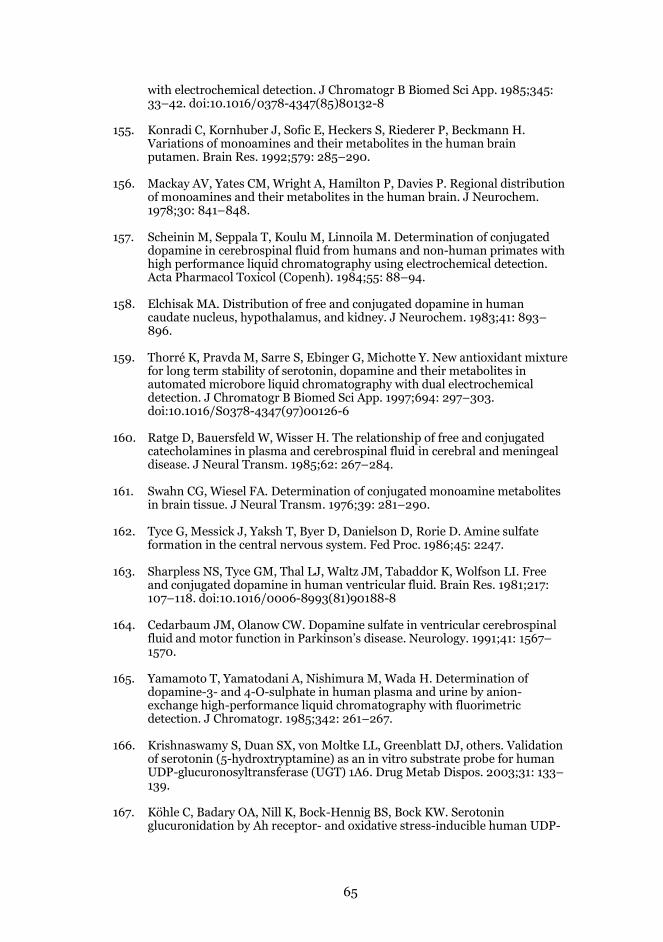
65
with electrochemical detection. J Chromatogr B Biomed Sci App. 1985;345:33–42. doi:10.1016/0378-4347(85)80132-8
155. Konradi C, Kornhuber J, Sofic E, Heckers S, Riederer P, Beckmann H.Variations of monoamines and their metabolites in the human brainputamen. Brain Res. 1992;579: 285–290.
156. Mackay AV, Yates CM, Wright A, Hamilton P, Davies P. Regional distributionof monoamines and their metabolites in the human brain. J Neurochem.1978;30: 841–848.
157. Scheinin M, Seppala T, Koulu M, Linnoila M. Determination of conjugateddopamine in cerebrospinal fluid from humans and non-human primates withhigh performance liquid chromatography using electrochemical detection.Acta Pharmacol Toxicol (Copenh). 1984;55: 88–94.
158. Elchisak MA. Distribution of free and conjugated dopamine in humancaudate nucleus, hypothalamus, and kidney. J Neurochem. 1983;41: 893–896.
159. Thorré K, Pravda M, Sarre S, Ebinger G, Michotte Y. New antioxidant mixturefor long term stability of serotonin, dopamine and their metabolites inautomated microbore liquid chromatography with dual electrochemicaldetection. J Chromatogr B Biomed Sci App. 1997;694: 297–303.doi:10.1016/S0378-4347(97)00126-6
160. Ratge D, Bauersfeld W, Wisser H. The relationship of free and conjugatedcatecholamines in plasma and cerebrospinal fluid in cerebral and meningealdisease. J Neural Transm. 1985;62: 267–284.
161. Swahn CG, Wiesel FA. Determination of conjugated monoamine metabolitesin brain tissue. J Neural Transm. 1976;39: 281–290.
162. Tyce G, Messick J, Yaksh T, Byer D, Danielson D, Rorie D. Amine sulfateformation in the central nervous system. Fed Proc. 1986;45: 2247.
163. Sharpless NS, Tyce GM, Thal LJ, Waltz JM, Tabaddor K, Wolfson LI. Freeand conjugated dopamine in human ventricular fluid. Brain Res. 1981;217:107–118. doi:10.1016/0006-8993(81)90188-8
164. Cedarbaum JM, Olanow CW. Dopamine sulfate in ventricular cerebrospinalfluid and motor function in Parkinson’s disease. Neurology. 1991;41: 1567–1570.
165. Yamamoto T, Yamatodani A, Nishimura M, Wada H. Determination ofdopamine-3- and 4-O-sulphate in human plasma and urine by anion-exchange high-performance liquid chromatography with fluorimetricdetection. J Chromatogr. 1985;342: 261–267.
166. Krishnaswamy S, Duan SX, von Moltke LL, Greenblatt DJ, others. Validationof serotonin (5-hydroxtryptamine) as an in vitro substrate probe for humanUDP-glucuronosyltransferase (UGT) 1A6. Drug Metab Dispos. 2003;31: 133–139.
167. Köhle C, Badary OA, Nill K, Bock-Hennig BS, Bock KW. Serotoninglucuronidation by Ah receptor- and oxidative stress-inducible human UDP-
SUMMARY AND CONCLUSIONS
66
glucuronosyltransferase (UGT) 1A6 in Caco-2 cells. Biochem Pharmacol.2005;69: 1397–1402. doi:10.1016/j.bcp.2005.02.010
168. Buu NT, Duhaime J, Kuchel O. The bicuculline - like properties of dopaminesulfate in rat brain. Life Sci. 1984;35: 1083–1090. doi:10.1016/0024-3205(84)90073-0
169. Buu NT, Duhaime J, Kuchel O, Genest J. The convulsive effects of dopaminesulfate conjugates in rat brain. Life Sci. 1981;29: 2311–2316.doi:10.1016/0024-3205(81)90564-6
170. Mukaida K, Shichino T, Koyanagi S, Himukashi S, Fukuda K. Activity of theserotonergic system during isoflurane anesthesia. Anesth Analg. 2007;104:836–839. doi:10.1213/01.ane.0000255200.42574.22
171. Whittington RA, Virag LM. Isoflurane Decreases Extracellular Serotonin inthe Mouse Hippocampus. Anesth Analg. 2006;103: 92–98.doi:10.1213/01.ane.0000221488.48352.61
172. Adachi YU, Yamada S, Satomoto M, Higuchi H, Watanabe K, Kazama T, et al.Isoflurane anesthesia inhibits clozapine- and risperidone-induced dopaminerelease and anesthesia-induced changes in dopamine metabolism wasmodified by fluoxetine in the rat striatum: An in vivo microdialysis study.Neurochem Int. 2008;52: 384–391. doi:10.1016/j.neuint.2007.07.012
173. Adachi YU, Yamada S, Satomoto M, Higuchi H, Watanabe K, Kazama T.Isoflurane anesthesia induces biphasic effect on dopamine release in the ratstriatum. Brain Res Bull. 2005;67: 176–181.doi:10.1016/j.brainresbull.2005.06.020
174. Kimura-Kuroiwa K, Adachi YU, Mimuro S, Obata Y, Kawamata M, Sato S, etal. The effect of aging on dopamine release and metabolism duringsevoflurane anesthesia in rat striatum: An in vivo microdialysis study. BrainRes Bull. 2012;89: 223–230. doi:10.1016/j.brainresbull.2012.08.006
175. Adachi Y, Uchihashi Y, Watanabe K, Satoh T. Halothane anesthesia decreasesthe extracellular level of dopamine in rat striatum: a microdialysis study invivo. J Anesth. 2000;14: 82–90. doi:10.1007/s005400050072
176. Hintikka L, Haapala M, Kuuranne T, Leinonen A, Kostiainen R. Analysis ofanabolic steroids in urine by gas chromatography–microchip atmosphericpressure photoionization-mass spectrometry with chlorobenzene as dopant. JChromatogr A. 2013;1312: 111–117. doi:10.1016/j.chroma.2013.08.098
177. Donike M, Zimmermann J. Zur Darstellung von Trimethylsilyl-, Triethylsilyl-und tert.-Butyldimethylsilyl-enoläthern von Ketosteroiden für gas-chromatographische und massenspektrometrische Untersuchungen. JChromatogr A. 1980;202: 483–486. doi:10.1016/S0021-9673(00)91836-3
178. Leinonen A, Vuorensola K, Lepola L-M, Kuuranne T, Kotiaho T, Ketola RA, etal. Liquid-phase microextraction for sample preparation in analysis ofunconjugated anabolic steroids in urine. Anal Chim Acta. 2006;559: 166–172.doi:10.1016/j.aca.2005.12.004
179. Duax WL, Hauptman H. Crystal structure and molecular conformation ofaldosterone. J Am Chem Soc. 1972;94: 5467–5471. doi:10.1021/ja00770a050
67
180. Suominen T, Haapala M, Takala A, Ketola RA, Kostiainen R. Neurosteroidanalysis by gas chromatography–atmospheric pressure photoionization–tandem mass spectrometry. Anal Chim Acta. 2013;794: 76–81.doi:10.1016/j.aca.2013.07.055
181. Hunter EPL, Lias SG. Evaluated Gas Phase Basicities and Proton Affinities ofMolecules: An Update. J Phys Chem Ref Data. 1998;27: 413.doi:10.1063/1.556018
182. Syage JA, Hanold KA, Lynn TC, Horner JA, Thakur RA. Atmosphericpressure photoionization: II. Dual source ionization. J Chromatogr A.2004;1050: 137–149. doi:10.1016/j.chroma.2004.08.033
183. Meot-Ner M. Ion thermochemistry of low-volatility compounds in the gasphase. 3. Polycyclic aromatics: ionization energies, proton and hydrogenaffinities. Extrapolations to graphite. J Phys Chem. 1980;84: 2716–2723.doi:10.1021/j100458a011
184. Leinonen A, Kuuranne T, Kotiaho T, Kostiainen R. Screening of free 17-alkyl-substituted anabolic steroids in human urine by liquid chromatography–electrospray ionization tandem mass spectrometry. Steroids. 2004;69: 101–109. doi:10.1016/j.steroids.2003.10.007
185. Donike, M, Zimmerman, J, Barwald, KR, Schänzer, W, Christ, V,Klostermann, K, et al. Routinebestimmung von Anabolika in Harn. Dtsch ZSportmed. 1984; 14–24.
186. Diallo S, Lecanu L, Greeson J, Papadopoulos V. A capillary gaschromatography/mass spectrometric method for the quantification ofhydroxysteroids in human plasma. Anal Biochem. 2004;324: 123–130.doi:10.1016/j.ab.2003.10.001
187. Schänzer W. Metabolism of anabolic androgenic steroids. Clin Chem.1996;42: 1001–1020.
188. Palermo M, Gomez-Sanchez C, Roitman E, Shackleton CH. Quantitation ofcortisol and related 3-oxo-4-ene steroids in urine using gaschromatography/mass spectrometry with stable isotope-labeled internalstandards. Steroids. 1996;61: 583–589.
189. Page J, Kelly R, Tang K, Smith R. Ionization and transmission efficiency in anelectrospray ionization—mass spectrometry interface. J Am Soc MassSpectrom. 2007;18: 1582–1590. doi:10.1016/j.jasms.2007.05.018
190. Cech NB, Enke CG. Practical implications of some recent studies inelectrospray ionization fundamentals. Mass Spectrom Rev. 2001;20: 362–387. doi:10.1002/mas.10008
191. Kersten H, Derpmann V, Barnes I, Brockmann K, O’Brien R, Benter T. ANovel APPI-MS Setup for In Situ Degradation Product Studies ofAtmospherically Relevant Compounds: Capillary Atmospheric Pressure PhotoIonization (cAPPI). J Am Soc Mass Spectrom. 2011;22: 2070–2081.doi:10.1007/s13361-011-0212-y
SUMMARY AND CONCLUSIONS
68
192. Haapala M, Suominen T, Kostiainen R. Capillary Photoionization: A HighSensitivity Ionization Method for Mass Spectrometry. Anal Chem. 2013;85:5715–5719. doi:10.1021/ac4002673