Embed Size (px)
Citation preview

ORIGINAL PAPER
Analysis of Myocardial Infarction Using DiscreteWavelet Transform
E. S. Jayachandran & Paul Joseph K. & R. Acharya U.
Received: 27 March 2009 /Accepted: 4 May 2009 /Published online: 20 May 2009# Springer Science + Business Media, LLC 2009
Abstract Myocardial infarction (MI), is commonly knownas a heart attack, occurs when the blood supply to theportion of the heart is blocked causing some heart cells todie. This information is depicted in the elevated ST wave,increased Q wave amplitude and inverted T wave of theelectrocardiogram (ECG) signal. ECG signals are prone tonoise during acquisition due to electrode movement, muscletremor, power line interference and baseline wander. Hence,it becomes difficult to decipher the information about thecardiac state from the morphological changes in the ECGsignal. These signals can be analyzed using different signalprocessing techniques. In this work, we have used multi-resolution properties of wavelet transformation because it issuitable tool for interpretation of subtle changes in the ECGsignal. We have analyzed the normal and MI ECG signals.ECG signal is decomposed into various resolution levelsusing the discrete wavelet transform (DWT) method. Theentropy in the wavelet domain is computed and the energy–entropy characteristics are compared for 2282 normal and718 MI beats. Our proposed method is able to detect thenormal and MI ECG beat with more than 95% accuracy.
Keywords ECG .MI .Wavelet transform . Heart . Signal .
Entropy . Energy
Introduction
In 2006, the American Heart Association report, estimatedthat 1,200,000 Americans will have a new or recurrentattack that year [1]. In addition, Americans may experiencean estimated 175,000 silent first heart attacks that year. Theaverage age for men to experience a first heart attack is65.8 years, and for women the average age is 70.4 years. InIndia, heart disease is the single largest cause of death withheart attacks being accountable for one third of all deathscaused by heart diseases [2].
The effects and chances of heart attack are reflected inthe electro-cardio-gram (ECG) of the heart. The electricalmanifestation of the entire pumping activity of the heart istermed as ECG. One cardiac cycle is represented as thePQRST waveform in its ECG. Various measurements arecarried out in this PQRST waveform to establish thepresence of any cardiac abnormality associated with a heartcycle. The magnitude, duration and area of P, T, and QRSportions contribute to the classification of abnormalities.These measurements may vary considerably even amongnormal sinus rhythms which can lead to misclassification[3–5].
The morphological analysis of ECG signals adoptsvarious signal processing strategies over the past twodecades. Analysis with Fourier transform revealed theaccurate frequency spread of the signal but lacked timeresolution [6]. The local or Short Time Fourier Transform(STFT) provided a degree of temporal resolution indicatingthe changes in the frequency spread with time [7].
The fundamentals of principal component analysis(PCA) and the relationship between PCA and Karhunen-Loève transform were explained to the application of ECGanalysis [8]. PCA techniques has been used for ST–Tsegment analysis for the detection of myocardial ischemia
J Med Syst (2010) 34:985–992DOI 10.1007/s10916-009-9314-5
E. S. Jayachandran : P. Joseph K.Department of Electrical Engineering,National Institute of Technology,Calicut, Kerala, India, 673601
R. Acharya U. (*)Department of ECE, Ngee Ann Polytechnic,Singapore 599489, Singapore,e-mail: [email protected]
and abnormalities in ventricular repolarization, extraction ofatrial fibrillatory waves for detailed characterization ofatrial fibrillation, and analysis of body surface potentialmaps.
Significant differences were observed in the recurrencequantification analysis parameters of vector cardiogram(VCG) trajectories between the Healthy Control (HC) andMI cases [9]. MI classification accuracies based on theextracted nonlinear dynamical invariants from the VCGrecurrence plots were 97% using neural network and linearregression classification model.
Fuzzy–Gaussian Neural Network (FGNN) to recognizethe ECG signals for Ischemic Heart Disease (IHD)diagnosis was proposed [10]. The proposed method usestwo main stages: (a) feature extraction from the QRST zoneof ECG signals using either the PCA or the Discrete CosineTransform (DCT); (b) pattern classification for IHDdiagnosis using the FGNN. The performance of correctclassification was 100% for 20 IHD patients.
The wavelet transform was combined with a hiddenMarkov models (HMMs) to carry out beat segmentationand classification [11]. A group of five continuous waveletfunctions were used in ECG analysis and compared usingthe same framework. The results obtained in terms of beatsegmentation and premature ventricular beat (PVC) detec-tion were comparable to others works reported in theliterature. However, by combining the original concept withtwo wavelet functions in the segmentation stage, theperformance was further improved.
Awavelet-based electrocardiogram (ECG) data compres-sion algorithm was proposed [12]. The DWT coefficientswere divided into three groups, each group was thresholdedusing a threshold based on a desired energy packingefficiency. A binary significance map was then generatedby scanning the wavelet decomposition coefficients andoutputting a binary one if the scanned coefficient wassignificant, and a binary zero if it was insignificant. Acompression ratio of 24:1 was achieved for MIT-BIHrecord 117 with a percent root mean square difference aslow as 1.08%.
Wavelet transform techniques emerged as an efficienttool for analyzing a wide class of signals with its variedtemporal and frequency resolution levels [6, 13]. DWTanalysis is basically the decomposition of a signal intovarious resolution levels. It can be viewed as the correlationof the signal with the scaled and translated versions of amother wavelet, a compactly supported signal with anaverage value zero [13]. Wavelet coefficients representmeasures of similarity of local shape of the signal withmother and baby wavelets. The multiresolution propertiesof WT were effectively utilized in identifying the charac-teristic points in the ECG waveform and hence for theanalysis of the timings of PR, RR, ST intervals [4, 6, 14,
15]. They were used as the feature vectors for theclassification of various cardiac abnormalities. Entropy isan important property that characterizes the ECG signals[16]. Entropy studies were utilized for analyzing bio-signalslike EEG especially in detecting the seizures of epilepsy[17]. Entropy measures the complexity of the signal andhence has different range of values for different types(abnormalities) of signals. In wavelet domain, entropy atvarious decomposition levels of WT of ECG signal could beindicative of the signal properties inherent in the signal.Here, an attempt is made to classify a normal ECG signaland MI ECG in terms of its energy–entropy characteristics atdifferent decomposition levels. Daubechies 6 wavelet wasused for the analysis for achieving orthogonal decompositionof signal into various levels or bands. A clear separation ofnormal and MI ECG is found in the energy and entropy plotsat relevant levels of decomposition.
Theory
The wavelet transform
Fourier transform (FT) is the representation of a signal as asum of sinusoids and is only localized in frequency. But thewavelet transform is localized in both time and frequencydomains. Wavelet Transform is used to find the instant atwhich the abrupt change has taken place in the frequencydomain at a particular instant of time. After performing WT,a set of wavelet coefficients will be produced and each ofthese coefficients represents the power of that specificcomponent of the signal in a frequency sub-band at aspecific time. The wavelets are small waves having finiteperiod of time (compactly supported, does not extend fromnegative to positive infinity). Hence, the WT is a moreuseful technique to be used for ECG signal analysis ascompared to Fourier transform.
Wavelet transform is computed as (1) ContinuousWavelet Transform (CWT) and (2) Discrete WaveletTransform (DWT).
The continuous wavelet transform of a signal x(t) isdefined as
Wyx a; bð Þ ¼ 1ffiffiffia
pZ1
�1x tð Þy* t � b
a
� �dt ð1Þ
where,
a Scaling parameterb Translation parameter.= (t) Analyzing wavelet7 (t) Scaling function corresponding to wavelet = (t)
986 J Med Syst (2010) 34:985–992

The contribution signal energy at specific scale a andtranslation b is given by
E a; bð Þ ¼ W a; bð Þj j2 ð2Þknown as scalogram, a wavelet energy density function.
The relative energy contribution at scale a is given by
E að Þ ¼ 1
Cg
Z1
�1W a; bð Þj j2db ð3Þ
A Discrete Wavelet Transform (DWT) commonly employsa dyadic grid a=2m, m∈Z and b=nb0 2
m, n∈Z. With b0=1,
ym;n tð Þ ¼ 2�m=2y 2�mt � nð Þ ð4ÞThe scaling function is defined corresponding to thewavelet
fm;n tð Þ ¼ 2�m=2f 2�mt � nð Þ ð5Þ
x tð Þ ¼X1
n¼�1SM ;nfM ;n tð Þ þ
XM
m¼�1
X1
n¼�1Wm;nym;n tð Þ ð6Þ
Where
SM ;n ¼ x tð Þ; fM ;n tð Þ� �approximation coefficients
and Wm;n ¼ x tð Þ;ym;n tð Þ� �detail coefficients
M decomposition level
Signal approximation at level M may be expressed as
xM tð Þ ¼X1
n¼�1SM ;nfM ;n tð Þ ð7Þ
Signal detail at scale m may expressed as
dm tð Þ ¼X1
n¼�1Wm;nym;n tð Þ ð8Þ
and
x tð Þ ¼ xM tð Þ þXM
m¼�1dm tð Þ ð9Þ
at decomposition level M.Energy contained in wavelet coefficients at each scale is
given by
Em ¼X
n
Wm;n
�� ��2 ð10Þ
Various features of ECG signal will be present indifferent decomposition level of the signal. The energyand entropy at each level of decomposition can becomputed.
Entropy
The cardiac state is indicated as the subtle changes in theelectrical signals (in time domain), in frequency, andmorphology. A natural approach to quantify the degree ofcomplexity of a signal is to consider its entropy [16, 17]. Theentropy of a signal {xi} is defined by Shannon as the positive
values H ¼ Pipi log 1
piwith the convention 0 log 0=0. A
concept of spectral entropy was suggested by Quigora et al.[17]. It can be extracted from the frequency domainrepresentation of the signal, the Discrete Fourier Transform(DFT). The distribution of energy in a signal x(t) can bedescribed by the probability
pi ¼ Cij j2Pk
Ckj j2 ; i; k ¼ 1; ::::N ð11Þ
Where Ck be the DFT coefficients of x(t).
Entropy Hð Þ is given by : H ¼ �X
i
pi log pi ð12Þ
The same concept can be applied to the DWT of thesignal [18]. The FT and STFT assumes signal be stationary,WT makes no assumptions about signal stationarity.Assuming that the abnormalities of the heart will reflectin the variations and uncertainties in the distribution ofenergy in various decomposition levels, one can computewavelet-based entropy at different scales.
Distribution of energy over scales of decomposition isformed with the average energy per level of decomposition.
Edm ¼ 1
Nm
X
n
Wm;n
�� ��2; m ¼ 1; 2 . . . :M ð13Þ
EaM ¼ 1
NM
X
n
SM ;n
�� ��2 ð14Þ
where Wm,n and SM,n are the detail and approximationcoefficients at level M.
Edm and Ea
M are the average energies of details andapproximation parts respectively.
The corresponding probability at all levels can be defined as
pm ¼ EdmP
mEdm þ Ea
M
m ¼ 1; 2 . . . M for detail part
ð15Þ
pM ¼ EaMP
mEdm þ Ea
M
at level M for approximation part
ð16ÞEntropy is computed using Eq. 12.
J Med Syst (2010) 34:985–992 987

Data acquisition and method
ECG data are extracted from subjects referred by cardiol-ogists as normal and affected by MI. The lead-II ecgmeasurement was carried out for normal and MI subjectsusing the “Bio Pac” instrumentation system in the biomed-ical laboratory at National Institute of Technology Calicut,India. The sampling rate selected is 250 Hz. ECG data(amplitude normalized to 1 V) over a duration of 15 minutesis extracted from six normal subjects and two MI infectedsubjects, all subjects being male and in an age groupbetween 55 and 65 years. The data for analysis is selectedfrom these recordings.
Since WT is a measure of the correlation of the givensignal with the wavelet, the ECG signal analyzer needs awavelet whose characteristics closely match. The waveletselected here is Daubechies 6 tap wavelet since it closelyresembles the typical ECG waveform. Some bi-orthogonalwavelets also have a shape close to ecg signal. ButDaubechies wavelets have an added advantage that theyconstitute an orthonormal basis and provide a non-redundant orthogonal decomposition of ECG signal energyinto various sub bands which are not possible with bi-orthogonal bases. The Daubechies 6 scaling and waveletfunctions are shown in Fig. 1.
Noise is removed incorporating wavelet shrinkage viasoft thresholding [19]. Universal threshold, a thresholdvalue s
ffiffiffiffiffiffiffiffiffiffiffiffiffiffi2 logN
p, σ the standard deviation of noise and N
number of samples i.e. number of wavelet coefficients ateach decomposition level, proposed by Donoho andJohnstone was adapted here [19]. Filtered ECG signal was
subjected to the wavelet decomposition system in a beat-to-beat basis. The energy and entropy at each level wascomputed. These were identified as the two features for thenormal and MI ECG and plotted against each other as thecharacteristics. The first level of decomposition (D1) isneglected since it corresponds to noisy part of the signal,which is considered to contain no vital information of theheart [15, 16]. Figures 2 and 3 are the reconstructed signalsfrom each decomposition level of MI and normal ECGrespectively. Figures 4, 5, 6 and 7 describe the energy–entropy characteristics of each decomposition level A4, D4,D3 and D2; A4 being the approximation at fourth level andD2, D3and D4 are the detail part. It can be seen from thesefigures that, there is a clear separation between MI andnormal classes. Hence, it justifies that, the chosen feature isvery effective for the classification of the classes.
Results
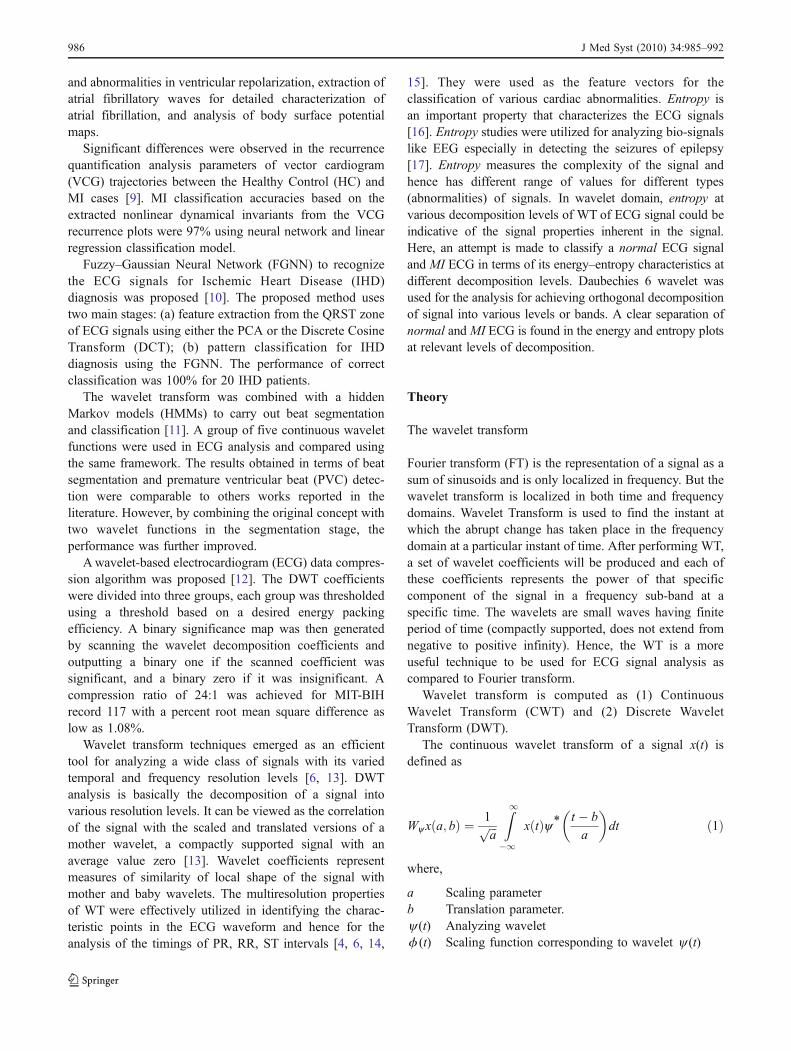
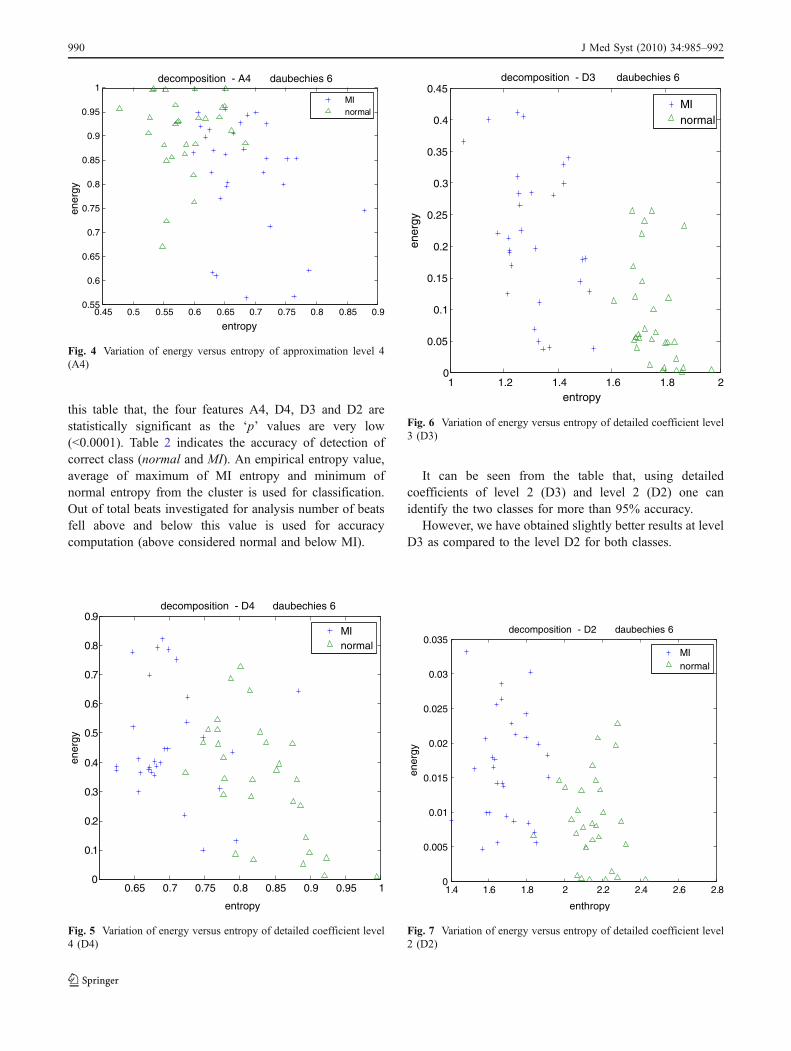
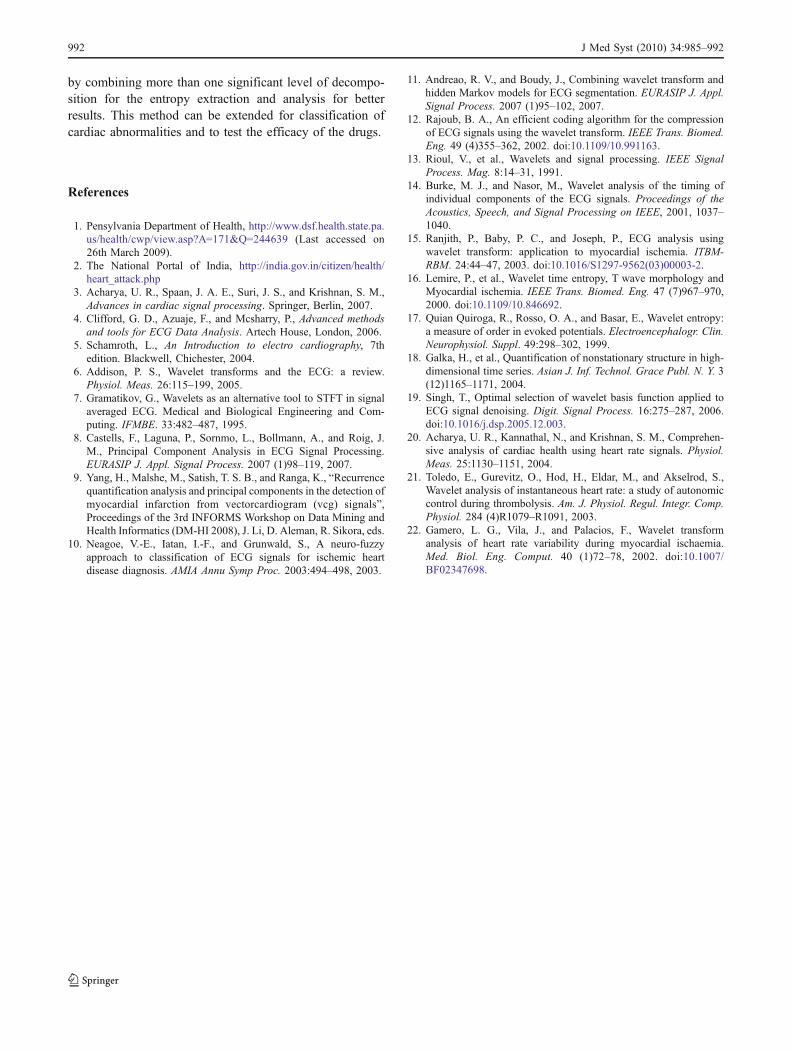
Figure 4 shows the variation of energy versus entropy ofapproximation level 4 (A4). Figure 5 shows the variation ofenergy versus entropy of detailed coefficient level 4 (D4).Figure 6 shows the variation of energy versus entropy ofdetailed coefficient level 3 (D3). Figure 7 shows thevariation of energy versus entropy of detailed coefficientlevel 2 (D2).
A total of 2,282 normal beats and 718 MI beats wereanalyzed. Table 1 shows the mean and standard deviationof the entropy values at various decomposition levels. D2and D3 levels showed minimal overlap. We can see from
0 20 40 60 80 100 120 140 160 180 100 120 140 160 180-0.4
-0.2
0
0.2
0.4
0.6
0.8
1
1.2
1.4daubechies 6 scaling function
samples0 20 40 60 80
-1.5
-1
-0.5
0
0.5
1
1.5
2
samples
Daubechies 6 wavelet function
Fig. 1 Daubechies 6 tap wavelet, scaling and wavelet functions
988 J Med Syst (2010) 34:985–992

0 100 200 300-1
0
1
samples
normal ecg signal
0 100 200 300-0. 5
0
0. 5reconstruction-A4 db3
0 100 200 300-0. 5
0
0. 5reconstruction-D4
samples
reconstruction-D3
0 100 200 300-1
0
1
samples
samplessamples
samples
0 100 200 300-0. 5
0
0. 5
0 100 200 300-0. 05
0
0. 05reconstruction-D1reconstruction-D2
Fig. 3 Decomposition levels ofnormal ECG signal
0 200 400-1
0
1
samples
MI signal
0 200 400-0 .5
0
0. 5
samples
reconstruction-A4 daubechies6
0 200 400
200 400
-0 .2
0
0. 2
samples
reconstruction-D4
0 200 400
200 400
-0 .5
0
0. 5
samples
reconstruction-D3
0-0 .1
0
0. 1
samples
reconstruction-D2
0-0 .05
0
0. 05
samples
reconstruction-D1
Fig. 2 Decomposition levels ofMI ECG signal
J Med Syst (2010) 34:985–992 989
this table that, the four features A4, D4, D3 and D2 arestatistically significant as the ‘p’ values are very low(<0.0001). Table 2 indicates the accuracy of detection ofcorrect class (normal and MI). An empirical entropy value,average of maximum of MI entropy and minimum ofnormal entropy from the cluster is used for classification.Out of total beats investigated for analysis number of beatsfell above and below this value is used for accuracycomputation (above considered normal and below MI).
It can be seen from the table that, using detailedcoefficients of level 2 (D3) and level 2 (D2) one canidentify the two classes for more than 95% accuracy.
However, we have obtained slightly better results at levelD3 as compared to the level D2 for both classes.
0.65 0.7 0.75 0.8 0.85 0.9 0.95 10
0.1
0.2
0.3
0.4
0.5
0.6
0.7
0.8
0.9
entropy
ener
gy
decomposition - D4 daubechies 6
MInormal
Fig. 5 Variation of energy versus entropy of detailed coefficient level4 (D4)
1 1.2 1.4 1.6 1.8 20
0.05
0.1
0.15
0.2
0.25
0.3
0.35
0.4
0.45
entropyen
ergy
decomposition - D3 daubechies 6
MInormal
Fig. 6 Variation of energy versus entropy of detailed coefficient level3 (D3)
1.4 1.6 1.8 2 2.2 2.4 2.6 2.80
0.005
0.01
0.015
0.02
0.025
0.03
0.035
ener
gy
enthropy
decomposition - D2 daubechies 6
MInormal
Fig. 7 Variation of energy versus entropy of detailed coefficient level2 (D2)
0.45 0.5 0.55 0.6 0.65 0.7 0.75 0.8 0.85 0.90.55
0.6
0.65
0.7
0.75
0.8
0.85
0.9
0.95
1
entropy
ener
gydecomposition - A4 daubechies 6
MInormal
Fig. 4 Variation of energy versus entropy of approximation level 4(A4)
990 J Med Syst (2010) 34:985–992

Discussion
We can see from Table 1 that entropy of detailedcoefficients at level 4, 3 and 2 are higher for normalsubjects as compared to the MI subjects. Because, in normalsubjects the beat to beat variability is higher as compared tothe abnormal subjects [20]. The normal ECG signal is morechaotic as compared to the abnormal signal.
The correlation between reperfusion and the spectralcomponents of heart rate variability (HRV), associated withautonomic cardiac control was explored [21]. They ana-lyzed the HR of patients during thrombolysis: nine anteriorwall MI (AW-MI) and eight inferoposterior wall MI (IW-MI). HRV was analyzed using a modified continuouswavelet transform, which conveyed time-dependent ver-sions of the low-frequency (LF) and high-frequency (HF)peaks and of their ratio, LF/HF. Patterns of HRV,compatible with a shift towards relative sympatheticenhancement, were found in all of the nine reperfusionevents in IW-MI patients and in three AW-MI patients.Patterns of HRV compatible with relative vagal enhance-ment were found in six AW-MI patients (P<0.001).
The wavelet transform was applied to obtain a time-scalerepresentation for very low-frequency (VLF), low-frequency (LF) and high-frequency (HF) bands using theorthogonal multiresolution pyramidal algorithm [22]. Theirresults suggest that wavelet analysis provided usefulinformation for the assessment of dynamic changes andpatterns of HRV during myocardial ischaemia.
Ranjith et al. have used quadratic spline wavelet for theidentification of myocardial ischemia [15]. The character-istic points of the ECG signal evaluated and the wavelet
transform values were used to identify any ischemicepisodes present in the ECG signal with a sensitivity of87.5%. Lemire et al. used an index of “wavelet timeentropy” for analyzing ST segment of ECG in pigs [16].The entropy was estimated from a probability extractedfrom the modulus of WT coefficients at each decompositionlevels. But in this work, we have used entropy, as a measureof complexity of entire ECG (not ST segment alone) ofhumans from DWT coefficients. Entropy is computed withprobability extracted from distribution of energy overvarious decomposition levels in the wavelet domain. Wehave used these entropy values embedded in the DWTcoefficients as the feature to identify them in to two classes.Our results can identify the MI beats with an accuracy ofmore than 95%. DWT, due to its non-redundancy inrepresentation, requires very less computation than CWTused in many analysis applications. In this method we useDWT. Further, The post-DWT operations i.e., the calcula-tion of entropy, is simple and requires less computation.
This result can be further improved using more numberof ECG beats and also signal can be analyzed for longdurations. This method can be made automatic detection,by feeding the features (D2 and D3) to a suitable classifier.
Conclusion
The Frequency domain analysis is effective for thestationary signals. The ECG is a non-stationary signal, sothe WT is an alternative efficient method for the analysis ofECG signals. Entropy represents the inherent complexity oruncertainty in a signal. All the complex (random) signalsindicate higher entropy and vice versa. Human heart is acomplex system; the signal from the heart inherits thosecomplexities. Here, the complexities of heart are analyzedusing entropy associated at various decomposition levels ofthe WT of heart signals as an index. In this study, analysiswas conducted on normal and MI ECG signals. Thecomputed normalized energy–entropy values showed agood discrimination between these two signals in certaindecomposition levels (namely D2 and D3). A healthy heartis found to posses more entropy than an abnormal heart andhence more complex. The method can be further improved
Table 2 Results of accuracy of correct class identification using decomposition levels 2 and 3
Decompositionlevel
Normal beatsanalyzed
Normal beatsdetected
%Accuracy
MI beatsanalyzed
MI beatsdetected
%Accuracy
D2 2,282 2,188 95.9 718 690 96.1
D3 2,282 2,192 96.05 718 696 96.93
Accuracy ¼ 100� number of beats correctly classifiedð Þ= number of beats analyzedð Þ.
Table 1 Results of features (entropy) for normal and MI classes fordifferent decomposition levels
Types Normal MI P-value
A4 0.59±0.07 0.68±0.06 <0.0001
D4 0.831±0.063 0.70±0.056 <0.0001
D3 1.76±0.077 1.317±0.119 <0.0001
D2 2.15±0.117 1.691±0.1253 <0.0001
J Med Syst (2010) 34:985–992 991
by combining more than one significant level of decompo-sition for the entropy extraction and analysis for betterresults. This method can be extended for classification ofcardiac abnormalities and to test the efficacy of the drugs.
References
1. Pensylvania Department of Health, http://www.dsf.health.state.pa.us/health/cwp/view.asp?A=171&Q=244639 (Last accessed on26th March 2009).
2. The National Portal of India, http://india.gov.in/citizen/health/heart_attack.php
3. Acharya, U. R., Spaan, J. A. E., Suri, J. S., and Krishnan, S. M.,Advances in cardiac signal processing. Springer, Berlin, 2007.
4. Clifford, G. D., Azuaje, F., and Mcsharry, P., Advanced methodsand tools for ECG Data Analysis. Artech House, London, 2006.
5. Schamroth, L., An Introduction to electro cardiography, 7thedition. Blackwell, Chichester, 2004.
6. Addison, P. S., Wavelet transforms and the ECG: a review.Physiol. Meas. 26:115–199, 2005.
7. Gramatikov, G., Wavelets as an alternative tool to STFT in signalaveraged ECG. Medical and Biological Engineering and Com-puting. IFMBE. 33:482–487, 1995.
8. Castells, F., Laguna, P., Sornmo, L., Bollmann, A., and Roig, J.M., Principal Component Analysis in ECG Signal Processing.EURASIP J. Appl. Signal Process. 2007 (1)98–119, 2007.
9. Yang, H., Malshe, M., Satish, T. S. B., and Ranga, K., “Recurrencequantification analysis and principal components in the detection ofmyocardial infarction from vectorcardiogram (vcg) signals”,Proceedings of the 3rd INFORMS Workshop on Data Mining andHealth Informatics (DM-HI 2008), J. Li, D. Aleman, R. Sikora, eds.
10. Neagoe, V.-E., Iatan, I.-F., and Grunwald, S., A neuro-fuzzyapproach to classification of ECG signals for ischemic heartdisease diagnosis. AMIA Annu Symp Proc. 2003:494–498, 2003.
11. Andreao, R. V., and Boudy, J., Combining wavelet transform andhidden Markov models for ECG segmentation. EURASIP J. Appl.Signal Process. 2007 (1)95–102, 2007.
12. Rajoub, B. A., An efficient coding algorithm for the compressionof ECG signals using the wavelet transform. IEEE Trans. Biomed.Eng. 49 (4)355–362, 2002. doi:10.1109/10.991163.
13. Rioul, V., et al., Wavelets and signal processing. IEEE SignalProcess. Mag. 8:14–31, 1991.
14. Burke, M. J., and Nasor, M., Wavelet analysis of the timing ofindividual components of the ECG signals. Proceedings of theAcoustics, Speech, and Signal Processing on IEEE, 2001, 1037–1040.
15. Ranjith, P., Baby, P. C., and Joseph, P., ECG analysis usingwavelet transform: application to myocardial ischemia. ITBM-RBM. 24:44–47, 2003. doi:10.1016/S1297-9562(03)00003-2.
16. Lemire, P., et al., Wavelet time entropy, T wave morphology andMyocardial ischemia. IEEE Trans. Biomed. Eng. 47 (7)967–970,2000. doi:10.1109/10.846692.
17. Quian Quiroga, R., Rosso, O. A., and Basar, E., Wavelet entropy:a measure of order in evoked potentials. Electroencephalogr. Clin.Neurophysiol. Suppl. 49:298–302, 1999.
18. Galka, H., et al., Quantification of nonstationary structure in high-dimensional time series. Asian J. Inf. Technol. Grace Publ. N. Y. 3(12)1165–1171, 2004.
19. Singh, T., Optimal selection of wavelet basis function applied toECG signal denoising. Digit. Signal Process. 16:275–287, 2006.doi:10.1016/j.dsp.2005.12.003.
20. Acharya, U. R., Kannathal, N., and Krishnan, S. M., Comprehen-sive analysis of cardiac health using heart rate signals. Physiol.Meas. 25:1130–1151, 2004.
21. Toledo, E., Gurevitz, O., Hod, H., Eldar, M., and Akselrod, S.,Wavelet analysis of instantaneous heart rate: a study of autonomiccontrol during thrombolysis. Am. J. Physiol. Regul. Integr. Comp.Physiol. 284 (4)R1079–R1091, 2003.
22. Gamero, L. G., Vila, J., and Palacios, F., Wavelet transformanalysis of heart rate variability during myocardial ischaemia.Med. Biol. Eng. Comput. 40 (1)72–78, 2002. doi:10.1007/BF02347698.
992 J Med Syst (2010) 34:985–992