Embed Size (px)
Citation preview

Analysis of Myeloid Derived SuppressorCells and the Role of Inducible Nitric
Oxide Synthase in Renal TransplantationAcross MHC Mismatched Mice
The Harvard community has made thisarticle openly available. Please share howthis access benefits you. Your story matters
Citation Aljabban, Imad. 2016. Analysis of Myeloid Derived SuppressorCells and the Role of Inducible Nitric Oxide Synthase in RenalTransplantation Across MHC Mismatched Mice. Master's thesis,Harvard Medical School.
Citable link http://nrs.harvard.edu/urn-3:HUL.InstRepos:33789918
Terms of Use This article was downloaded from Harvard University’s DASHrepository, and is made available under the terms and conditionsapplicable to Other Posted Material, as set forth at http://nrs.harvard.edu/urn-3:HUL.InstRepos:dash.current.terms-of-use#LAA


Analysis of Myeloid Derived Suppressor Cells and the Role of Inducible Nitric Oxide Synthase
in Renal Transplantation across MHC Mismatched Mice
Imad Aljabban
A Dissertation Submitted to the Faculty of Harvard Medical School in Partial Fulfillment of the Requirements for the Degree of Master of
Medical Sciences in the Department of Immunology
Harvard University
Boston, Massachusetts.
May, 2016

ii
Abstract
Despite recent advances in immunology and post-operative care, transplant recipients
continue to face major complications. This is due to immune-mediated destruction of graft
tissue and drug toxicity caused by chronic immunosuppression. A solution to both of these
issues is the induction of long-term tolerance to donor antigens. Recently, renal allograft
tolerance has been achieved between HLA-disparate individuals in the clinic without the need
for immunosuppression using a mixed chimerism protocol. However, the mechanisms and
cellular components involved in the initiation of regulatory and deletional tolerance in this
model remains to be understood. The aim of this study is to identify suppressive mechanisms
that myeloid-derived suppressor cells (MDSCs) utilize to induce regulatory tolerance. MDSCs
were enriched from the bone marrow using a negative selection protocol, and cultured with
stimulating cytokines. Flow cytometry was then used to assess the expression of surface and
intracellular molecules. Moreover, DBA donor kidneys were transplanted into B6 recipients and
were euthanized after 1, 3, and 6 weeks. Nitrosylation was assessed by immunohistochemistry
(IHC) using anti-nitrotyrosine and anti-iNOS unconjugated antibodies. CD11b+ cells were
isolated from 6 week kidney allografts, and analyzed with IHC and flow cytometry. Cell culture
showed that when MDSCs are stimulated they upregulate PD-L1, podoplanin, and F4/80.
Interestingly, Ly6C expression is dramatically reduced. Additionally, when these cells are
cultured with naïve T cells they are able to promote the induction of T regulatory cells (Tregs).
Moreover, accepted renal allografts are distinct from rejected allografts with respect to
nitrosylation. The presence of iNOS+ cells in the graft shows that nitric oxide (NO) production is

iii
occurring within the kidney microenvironment. CD11b+ cells within the Treg-rich organized
lymphoid structures (TOLS) of the graft are one source of NO production. Our findings provide
insight into the phenotype and potential role of these tissue effector cells in solid organ
transplantation.

iv
Table of Contents
Chapter 1: Biology and Regulatory Functions of Myeloid-Derived Suppressor Cells
1.1 Introduction .............................................................................................................................. 1
1.1a) Historical Perspectives ....................................................................................................... 1
1.1b) Allograft Rejection ............................................................................................................. 4
1.1c) Mixed Chimerism ................................................................................................................ 5
1.1d) Spontaneous Renal Allograft Acceptance .......................................................................... 7
1.1e) Immature Myeloid Cells ..................................................................................................... 8
1.2 Ontogeny of Immature Myeloid Cells ..................................................................................... 9
1.2a) Myelopoiesis ...................................................................................................................... 9
1.2b) MDSC Expansion .............................................................................................................. 13
1.2c) MDSC Activation ............................................................................................................... 15
1.3 MDSC Effector Functions ....................................................................................................... 17
1.3a) L-Arginine Metabolism ..................................................................................................... 17
1.3b) Generation of Reactive Oxygen Species .......................................................................... 20
1.3c) Induction of Regulatory T Lymphocytes ........................................................................... 22
1.4 MDSCs and the Current State of Transplant Research ......................................................... 25
1.5 Conclusions ............................................................................................................................. 27
Chapter 2: Myeloid-Derived Suppressor Cells Alter Phenotypic Expression Pattern and Induce the Development of T Regulatory Cells In Vitro
2.1 Abstract .................................................................................................................................. 29
2.2 Introduction ............................................................................................................................ 30
2.3 Results..................................................................................................................................... 31
2.3a) Enrichment of Monocytic Myeloid-Derived Suppressor Cells ......................................... 31
Figure 2.1 ................................................................................................................................... 34
2.3b) Phenotypic Analysis of Cultured Monocytic Myeloid-Derived Suppressor Cells ............ 35
Figure 2.2 ................................................................................................................................... 38

v
2.3c) Effect of Monocytic Myeloid-Derived Suppressor cells on the Induction of T Regulatory
Cells .......................................................................................................................................... 40
Figure 2.3 ................................................................................................................................... 42
2.3d) Accumulation of F4/80+ and Ly6C+ CD11b+ Cells in Renal Allografts ............................... 43
Figure 2.4 ................................................................................................................................... 44
2.4 Discussion ............................................................................................................................... 45
2.5 Methods and Materials .......................................................................................................... 48
Chapter 3: Accepted Allografts Across Mismatched Mammals are Characterized by Increased Nitrosylation
3.1 Abstract .................................................................................................................................. 53
3.2 Introduction ............................................................................................................................ 54
3.3 Results..................................................................................................................................... 55
3.3a) Nitrosylation Patterns of Accepted and Rejected Allografts ........................................... 55
Figure 3.1 ................................................................................................................................... 57
3.3b) iNOS+ Cells Accumulate in Accepted Renal Allografts ..................................................... 58
Figure 3.2 ................................................................................................................................... 59
3.4 Discussion ............................................................................................................................... 60
3.5 Methods and Materials .......................................................................................................... 62
Chapter 4: Conclusion
4.1 Final Remarks ......................................................................................................................... 64
Figure 4.1 ................................................................................................................................... 70
References .................................................................................................................................... 71

vi
List of Figures with Captions
Figure 2.1 Enrichment of CD11b+ Ly6Chi Monocytic Myeloid-Derived Suppressor Cells. Transplants were conducted between MHC-disparate mice (DBAB6), and allografts were harvested after 42 days. Histological slides were fixed in formalin and embedded in paraffin. Immunohistochemical analysis of renal allograft was conducted using A) anti-Gr-1 and B) anti-Ly6C antibodies. C) Bone marrow cells were obtained from B6 mice, and a positive selection protocol was enacted to isolate Ly6G and Ly6C myeloid cells. This was done using antigen specific biotin antibodies and streptavidin beads to Gr-1. The first positive fraction contained G-MDSCs, while the second positive fraction contained MO-MDSCs. D) Ly6Chi monocytes were enriched using a negative selection protocol via the addition of biotinylated and tetrameric magnetic antibodies directed against non-monocytes. Gr-1 and Ly6C fluorescently labeled antibodies were used for flow cytometric analysis. Quadrant boundaries were set by isotype controls. Figure 2.2 Phenotypic Analysis of Cultured CD11b+ Ly6Chi Monocytic Myeloid-Derived Suppressor Cells. MO-MDSCs were enriched using the protocol described in Figure 2.1, and were plated at 5x10⁴ cells per well. These monocytes were supplemented with 10ng/mL of IL-4 and M-CSF. After 48 hours 100ng/mL of LPS was added to respective groups. Surface and intracellular markers were then analyzed using flow cytometry. The fluorescently labeled antibodies there were used, include: A) anti-CD86 B) anti-CD80 C) anti-PD-L1 D) anti-DC-SIGN E) anti-Ly6C F) anti-F4/80 G) anti-podoplanin H) anti-iNOS. Quadrant boundaries were set by isotype controls.
Figure 2.3 Cultured CD11b+ Ly6Chi Monocytic Myeloid-Derived Suppressor Cells Induce T Regulatory Cells in an Allogeneic Fashion. MO-MDSCs were enriched and cultured using the protocol described in Figure 2.1 and Figure 2.2 respectively. MO-MDSCs were transferred to new 96 well plates and 1.5x10⁵ CD25- CD4+ naïve B6 T cells were added per well (1 MO-MDSC: 3 Naïve T cell). The wells were supplemented with or without 10ng/mL of IL-2 and TGF-β (cytokines). After 96 hours, the cells were fixed and analyzed using flow cytometry. A) B6 MO-MDSCs effect on B6 Treg induction. B) DBA MO-MDSC effect on B6 Treg induction. Quadrant boundaries were set by isotype controls.
Figure 2.4 Accumulation of F4/80+ and Ly6Clo CD11b+ Myeloid Cells within Renal Allografts. A) Harvested DBAB6 renal allograft was harvested after 6 weeks and a frozen histological section was produced, which displays the result of anti-F4/80 staining. B) 6 week post-transplant renal allograft was digested using collagenase. The cells were fixed in paraformaldehyde and stained with anti-Ly6C and anti-CD11b fluorescently conjugated antibodies. C) Following the same graft isolation protocol, the lymphocytes were removed from the cell suspension and the obtained fraction was stained with anti-F4/80 and anti-CD11b fluorescently labeled antibodies. Quadrant boundaries were set by isotype controls.
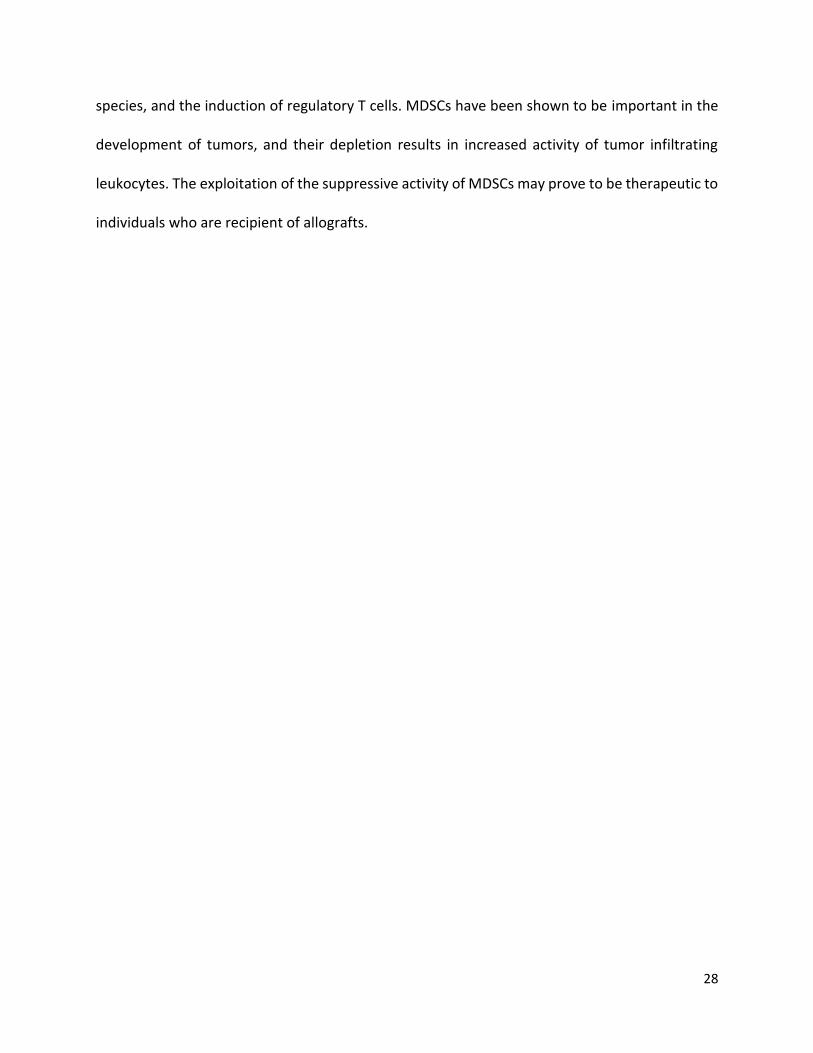
Figure 3.1 Anti-Nitrotyrosine Staining of Accepted Murine Renal Allografts and Rejecting NHP Cardiac Allografts. A) DBA donor kidneys were transplanted into B6 recipient mice. The same strain combination was used in the rejecting model, except the recipient was a B6.FoxP3-DTR

vii
mouse, and diphtheria toxin was administered before and after transplantation at a constant dosage. Naïve, rejected, and accepted murine renal allografts were fixed in paraffin embedded sections and stained with anti-nitrotyrosine antibodies. B) Cardiac tissue was obtained from NHP heart allograft models and also stained using anti-nitrotyrosine. The clinical score of transplant rejection was assessed by physician tending to the animal.
Figure 3.2 Accumulation of CD11b+ iNOS+ Cells in Accepted Renal Allografts. Transplants were conducted between MHC-mismatched strain combinations (DBAB6). A) Histological sections of the kidney were obtained from naïve and 1, 3, and 6 week post-operation recipients. Samples were fixed, and stained with anti-iNOS antibodies. B) The same allograft was digested, after histological samples were obtained, and digested with type II collagenase. Cells were stained with either isotype controls or anti-CD11b and anti-iNOS. Quadrant boundaries were set by isotype controls.
Figure 4.1 Model of MO-MDSCs Function in Renal Allografts. CD11b+ Ly6Chi MO-MDSCs circulate in the blood and localize to renal allografts. Mediators in the allograft, such as M-CSF, IL-4, and HMGB1 promote the differentiation of naïve MO-MDSCs into M2-like macrophages. Here, these cells promote tolerance through the inhibition of T cells by secreting RNS and depleting L-arginine. Additionally, these terminally differentiated cells promote regulatory tolerance through the induction of Tregs via the presentation of allopeptide. *Adopted from: Ochando et al. doi:10.1016/j.immuni.2015.05.009

viii
Acknowledgments
Throughout the course of two years I was able to complete my dissertation, as partial
fulfillment for the MMSc degree in Immunology, at the Center for Transplantation Sciences at
Massachusetts General Hospital. This was possible with the help, guidance, and support of many.
My time at Harvard Medical School has sparked my interest in medically related research, with
efforts to provide a long-standing impact on patient care. My achievements would not have been
possible without the mentorship of many individuals.
First, I would like to thank Dr. Shiv Pillai and Dr. Michael Carroll, directors of the Master
of Medical Science in Immunology Program at Harvard Medical School. Their development of an
outstanding curriculum has highlighted to me the importance of immunological research and the
influence good science can have on the medical community. Dr. Pillai and Dr. Carroll have
supported my efforts throughout this program, and inspired me to make significant strides
toward a career in research.
My work in the laboratory is a result of the collaboration between myself, Dorothy
Ndishabandi, Chao Yang, and Bo Jiang. Without their help, my efforts to produce meaningful
results in the laboratory would have been much more challenging. I would like to thank my
mentors: Dr. Alessandro Alessandrini, Dr. Robert Colvin, Dr. Paul Russell, and Dr. Joren Madsen.
Their collective efforts have contributed greatly to my development as a researcher. Finally, I am
honored to have been a member of the Center for Transplantation Sciences, where the combined
efforts of many individuals continue to contribute to our understanding of transplant tolerance
and improve the lives of organ recipients.

1
Chapter 1: Biology and Regulatory Functions of Myeloid-Derived Suppressor Cells
1.1 Introduction
1.1a) Historical Perspectives
In the past half century we have made significant strides in the field of transplantation. In
order to appreciate these developments, it is important to discuss the work of individuals who
have brought transplantation from a primitive therapeutic measure to an accepted means of
clinical practice. In 1954, Dr. Joseph Murray and his team conducted the first kidney transplant
between identical twins1. The physicians had to overcome two major roadblocks before
attempting the procedure, which were the development of an appropriate surgical protocol and
a means to determine genetic compatibility. Surgical aptitude was achieved by renal autograft
experiments in domestic dogs. The selected site for graft implantation was the retroperitoneal
space in the pelvis, which allowed for successful ureteroureterostomy and optimal thermal
environment for the organ1. To limit cellular or humoral mediated immune rejection, it was
crucial to make certain that the twins were genetically identical. This was assessed through the
acceptance of skin allografts. The effective surgical model and knowledge that the twins were
monozygotic gave the surgeons confidence to move forward with the procedure. The
transplantation was ultimately realized, and the subjects survived. Although the efficacy of this
procedure was confirmed, it has become practice to prescribe immunosuppressive drugs to the

2
recipient. This is because even in HLA-matched individuals minor histocompatibility antigens
(miHA) may still contribute to immune mediated rejection2.
The induction of long-term graft tolerance remains to be a significant challenge puzzling
transplant immunologists. Dr. Peter Brian Medawar and his team have made tremendous
contributions to understanding the graft rejection process and immune tolerance. Before Murray
and his team conducted the first transplant, little was known about why grafts were rejected. In
a landmark paper, Medawar and colleagues showed that the immune system contributed to graft
rejection between MHC-disparate humans3. The subject of this study was a burn victim who
received 52 autografts from her own thigh, and 50 allografts from her brother. At day 8 post-
transplantation, the skin allografts were completely inflamed and started to deteriorate, while
the autografts showed no sign of rejection. Histological analysis showed that the allografts
contained abundant amounts of lymphocytic infiltrate when compared to the autografts. These
experiments indicated that there are intrinsic factors in allografts that stimulate the infiltration
of immune cells and promote graft destruction. A few years later, Medawar also demonstrated
a method to induce allograft tolerance4. He showed that when donor embryonic cells were
transplanted into the embryos of the recipient, the offspring were tolerant of donor antigens.
This was validated by means of skin transplantation. Moreover, tolerance was ablated after the
adoptive transfer of lymphocytes, which were developed from the same recipient strain
vaccinated against donor skin antigens. This was the first achieved account of actively acquired
tolerance, and indicated that immunological plasticity can be exploited to induce long-term
transplant tolerance.

3
We have made significant advances in post-operative care and transplant immunology
since the first successful transplant by Joseph Murray’s team at Brigham and Women’s Hospital.
However, major challenges remain which result in less than optimal outcomes after
transplantation. Currently, organ procurement networks across the United States indicate that
there are thousands of patients in need for a lifesaving organ transplant. Unfortunately, the
demand for vital organs exceeds the supply of suitable donors. The organ shortage is
compounded by the loss of organs due to rejection or chronic graft dysfunction. In particular, the
10 year survival after heart transplantation is in the order of 50%. After successful graft
implantation, cell-mediated and humoral immunity are major contributors to eventual organ
attrition in HLA-mismatched individuals. While these are controlled with a good degree of
efficacy in the short term, under chronic immunosuppression patients are prone to developing
diabetes mellitus, kidney disease, hypertension, and obesity5. Additionally,
immunocompromised patients have a higher likelihood of infection and malignancy6. In the long
term, immunosuppression has largely failed to control chronic allograft dysfunction or rejection.
Prolongation of allograft survival through the induction of mixed chimerism is a possible solution
to these challenges. There is evidence that mixed chimerism results in allograft tolerance.
However, the molecular events by which this takes place remains elusive. Understanding this will
help to tailor more effective therapies for transplant patients. It is for this reason that it is
important to further dissect what hematopoietic populations determine the mechanisms of
tolerance induction.

4
1.1b) Allograft Rejection
A major barrier to a successful transplantation is immune-mediated rejection. The
initiation of the innate immune system and subsequent amplification of the adaptive axis results
in the activation of molecular pathways that facilitate graft destruction. The manipulation of
tissue during the surgical procedure of organ engraftment produces an inflammatory response
that identifies the allograft as a site for leukocyte infiltration7. Through invariant pattern
recognition receptors (PRRs), innate immune cells can sense damage associated molecular
patterns (DAMPs) that are released from injured cells. The recognition of nucleic acids and
chromatin associated proteins active intracellular NOD-like receptors (NLRs), which promote the
formation of inflammasomes that upregulate pro-inflammatory mediators8,9. The secretion of IL-
1, IL-6, and TNF-α ultimately cause an increase in hydrostatic pressure and permeability of post-
capillary venules, facilitating the infiltration of professional antigen presenting cells (APCs) and
other leukocytes into the allograft 10,11. After the uptake of antigen, conventional dendritic cells
(cDCs) travel to secondary lymphoid organs and active alloreactive T cells through three distinct
pathways12. Initially, donor derived APCs interact with recipient naïve T cells in the lymph nodes
and spleen through recognition of alloantigen presented on major histocompatibility molecules
(MHC). This is the direct-allorecognition pathway, and is the main mechanism promoting T cell
expansion early post-transplantation. As donor derived APCs reduce in number, the indirect
pathway takes on more of an effect. Here, recipient APCs engulf donor cellular debris and present
donor derived MHC peptide or miHA to recipient T lymphocytes. Moreover, the most uncommon
mechanism of alloreactive T cell activation is conducted through the semi-direct pathway, were

5
recipient APCs capture donor MHC-peptide complexes via the exchange of fragments of the cell
membrane. Upon APC stimulation, activated T and B lymphocytes are then able to promote graft
destruction through a variety of innate and adaptive mediated pathways. Cytotoxic CD8 T cells
recognize their targets through allogeneic MHC:peptide complexes and induces apoptosis
through the upregulation of granzyme B, perforin, and FAS-L13. Additionally, the secretion of
alloantibodies by B cells aid in innate mediate graft damage through activation of the classical
complement pathway and NK cell cytotoxicity14,15. Many molecular pathways trigger tissue injury.
Understanding these pathways have helped in the identification of novel therapeutic measures
that promote graft survival.
1.1c) Mixed Chimerism
Advances in clinical immunology and organ preservation techniques have established
transplantation as a standard medical practice. However, chronic immunosuppression and poor
long-term survival of the graft have contributed to drug induced toxicity and eventual rejection.
A solution to both of these issues is the induction of long-term tolerance of donor antigens.
Theoretically, extended tolerance can be achieved by three strategies: T-cell depletion, co-
stimulatory blockade, and chimerism16. Interestingly, animals that lack T cells are unable to reject
allografts17. So, the depletion of this lymphocyte through total body irradiation or α-CD4 and α-
CD8 antibodies is one method to reduce an immune response to alloantigens. Although these
studies were confirmed in mice, using this protocol in non-human primate (NHP) models proved
to be very difficult due to the lack of T cell depleting strategies 18. Furthermore, the

6
administration of antibodies that block CD28, CD80, and CD86 or CTLA-4 agonists have aided in
the prolongation of graft survival by means of immunosuppression, but not tolerance19,20.
Currently, mixed chimerism is a successful method to induce the tolerance and survival of
allografts.
Mixed chimerism is the transplantation of donor hematopoietic system in irradiated
recipients, which leads to a coexistence of both donor and recipient leukocytes21. In this model,
deletional tolerance is achieved by the localization of both donor and recipient hematopoietic
cells in the thymus to delete alloreactive T cells. Mixed chimerism is preferable to full chimerism
because immunocompetence is maintained by not ablating the hosts T cells22. The establishment
of mixed-chimerism in murine models has been done; however, translating these procedures to
larger mammals has been difficult. Mixed-chimerism protocols in NHPs and humans have shown
to be transient in nature. Fortunately, the survival of even a small percentage of donor bone
marrow is sufficient enough to allow tolerance of donor antigens23. Currently, the acceptance of
renal allografts across HLA-disparate individuals has been achieved with a short mixed chimerism
protocol24. As the level of mixed chimerism is reduced in recipients, regulatory mechanism
become important in promoting graft acceptance. It is for this reason that is may be important
to elucidate what hematopoietic populations are responsible for the induction of regulatory
tolerance in allografts.

7
1.1d) Spontaneous Renal Allograft Acceptance
Pioneering studies conducted by Dr. Paul Russell and his team lead to the discovery that
fully mismatched kidney transplantation between certain mouse strains led to spontaneous
acceptance without the need for preconditioning or immunosuppression25. Moreover, long-term
acceptance resulted despite the development of alloreactive lymphocytes26. This striking
observation resulted in significant study of this phenomenon, particularly between DBA/2J and
C57BL/6 mice, to further define what mechanisms drive immunological tolerance of allografts.
In 2008, Dr. Charles Orosz et al. showed that spontaneous renal allograft acceptance was
associated with TGF-β production and possibly Tregs27. Here the researchers showed that relative
FoxP3+ mRNA peaked in renal allografts 30 days post-transplantation and was reduced, but
persisted, to 150 days after acceptance. As the transcription of FoxP3 was slightly downregulated
in the long-term, relative expression of the tryptophan depleting enzyme called indoleamine 2,3-
dioxygenase (IDO) increased. This enzyme has been shown to modulate the immune response by
suppressing T cell function. The mammalian target of rapamycin (mTOR pathway), which couples
amino acid sensing to ribosomal translation, detects the depletion of tryptophan and results in
reduced protein production and accumulation of uncharged tRNA molecules. Also, the
downstream metabolites of tryptophan may also lead to apoptosis and arrest of proliferation28.
These results were further validated by Colvin et al. who showed that the depletion of Tregs in
B6 recipients of DBA allografts promoted CD8 interstitial mononuclear inflammation, endarteritis
and eventual graft rejection29. Together these results show that spontaneous renal allograft
acceptance is promoted by the induction of regulatory mechanisms.

8
In the clinic, tolerance of kidney allografts has been achieved in both nonhuman primates
and in humans. However, these same protocols are unable to induce the acceptance of cardiac
allografts in the same models. Remarkably, the co-transplantation of both heart and kidney
allografts results in cardiac allograft acceptance5. In these studies the kidney shows the ability to
confer systemic tolerance to donor derived antigens. Although, the formation of Treg structures
in kidneys seem to be important in the induction of organ tolerance, data from other groups
propose that Tregs alone are unable to explain this regulation30. A greater understanding of the
immunological mechanisms, which result in spontaneous renal allograft acceptance, are
important to reveal new ways to induce immune tolerance.
1.1e) Immature Myeloid Cells
Immature myeloid cells (IMCs) can differentiate into granulocytes, dendritic cells, and
macrophages. Under pathological conditions, such as transplantation, the maturation process is
partially blocked and results in the expansion of immunoregulatory cells (chapter 1.2)
characterized by the upregulation of the inducible isoform of nitric oxide synthase (iNOS),
arginase-1, transforming growth factor- β (TGF-β), and reactive oxygen species (ROS)31. These
leukocytes can modulate the immune response through the manipulation of amino acid
metabolism. Recent findings indicate that the depletion of L-arginine and release of nitric oxide
(NO) into the microenvironment suppresses the immune system by impairing T-cell function31.
Myeloid-derived suppressor cells (MDSCs) have been studied predominantly in the context of
tumor progression; however, their potential to induce transplant tolerance remains to be

9
defined. Ochando et al. recently showed that mononuclear MDSCs accumulate into cardiac
allografts 5 days after transplantation, where they differentiate into DC-SIGN+ macrophages
and induce Treg expansion32. The immunomodulatory role of MDSCs is evident in
transplantation. Myeloid-derived suppressor cells function through direct cell-to-cell contact
and are responsible for the release of biological mediators that alter the metabolism of other
leukocytes31. These cells have possible therapeutic potential to promote extended graft survival
in patients, and should be further studied in the context of solid organ transplantation.
1.2 Ontogeny of Immature Myeloid Cells
1.2a) Myelopoiesis
Phagocytic cells play a paramount role in host defense mechanisms. These mediators of
the innate immune system are grouped into two categories: polymorphonuclear (granulocytic)
and mononuclear phagocytes33. Collectively, these progenitors are referred to as myeloid cells,
and make up most of the cellular population in the bone marrow34. Mononuclear phagocytes
constitute mature macrophages, monocytes, and subsets of immature progenitor cells. In the
late 19th century, Metchnikoff was the first to classify these phagocytic cells as macrophages, and
demonstrated that they were not only involved in engulfing, but facilitated the destruction of
microorganisms35,36. Today, researchers have identified a variety of activating stimuli that
promote macrophage function. Macrophage activation is divided into two general categories:
classical and alternative. The former is mediated by interferon-ɣ (IFN-ɣ), while interleukin-4 (IL-

10
4) and IL-13 signaling are responsible for the alternative pathway. Classically activated
macrophages (M1) promote a pro-inflammatory immune response, and alternatively activated
macrophages (M2) account for anti-parasitic immunity and tissue repair37. Moreover, other
exogenous and endogenous ligands also promote the maturation of macrophages. During an
innate immune response, microbial peptide binding to PRRs on macrophages and stimulate the
production of pro-inflammatory cytokines, ROS, and NO38,37. Macrophages effector functions
may also be activated through humoral mechanisms, such as the binding of antibodies to Fc or
complement receptors. The activation of these receptors promote increased actin
polymerization and particle uptake via intricate phosphorylation events37,39,40,. In order to
elucidate how macrophages are activated and distributed throughout the various physiological
compartments it is important to discuss their origin.
The mononuclear phagocyte system that Metchnikoff postulated has helped guide
research for many years. This paradigm established the concept of a “layered” immune system,
which suggests that there are several types of pluripotent hematopoietic stem cells (HSCs) that
give rise to immune cells during different developmental stages. The layered myeloid system
consists of tissue-resident macrophages that arise from progenitor cells in the yolk sac, while
passenger myeloid cells are produced and maintained from bone marrow HSCs41. Tissue-resident
macrophages have the capability to self-renew within their localized area, and may differentiate
into osteoclasts, microglia, Langerhan cells, and Kupffer cells37. Moreover, recruited
macrophages have also been known to reside in the skin, heart, liver, and other areas of the
body. The development of macrophages depends on cytokine signals and cell interactions with
stroma in the bone marrow. Key regulatory cytokines and molecules include: macrophage

11
colony-stimulating factor (M-CSF) and granulocyte macrophage colony stimulating factor (GM-
CSF), IL-2 and KIT 37. Studies of these mononuclear cells indicated that pluripotent HSCs give rise
to multipotent intermediates called common myeloid progenitors (CMPs). Additionally, within
the bone marrow CMPs differentiate into monobalsts, which required G-CSF signaling. Following
G-CSFR activity, monobalsts develop into promonocytes and ultimately to monocytes36. The
identification of these cells was accomplished by van Furth et al. using the metabolic
incorporation of 3H-thymidine to monitor cell proliferation42.
Interestingly, there is no single “master” transcription factor that is expressed exclusively
during myeloid differentiation, but a combination of several transcription factors34. PU.1, a
member of the ets transcription factor family, binds to the promoters of M-CSFR and GM-CSFR.
Moreover, C/EBPα, β, and δ isoforms are upregulated in early myeloid cells, and also regulate M-
CSFR and GM-CSFR levels43. As described above, signaling through these receptors is crucial for
CMPs to differentiate into monocytes that are released from the bone marrow44. In the blood
stream the monocytes use adhesion receptors to localize to many tissue compartments where
various cytokines and growth factors contribute to further cell differentiation37. Stimulatory
cytokines such as M-CSF and the upregulation of PU.1 and C/EBP are required for normal myeloid
development.
Under pathological conditions, such as chronic microbial infection, cancer, or
transplantation the myelopoiesis process is affected. Here, the maturation of antigen presenting
macrophages is inhibited and a subset of immature myeloid cells begins to develop45. MDSCs are
a heterogeneous group of myeloid progenitor cells that have the ability to suppress T cell function
and, in mice, are characterized by the expression of both Gr-1 and CD11b. Antibodies that target

12
Gr-1 bind to two different epitopes, Ly6G and L6yC. About 30% of cells in the bone marrow are
Gr-1+ CD11b+. Furthermore, there are two subsets of MDSCs: CD11b+ Ly6G+ Ly6C- granulocytes
(G-MDSCs) and CD11b+ Ly6G- Ly6C+ monocytes (MO-MDSCs)46. They differ not only in phenotype
and morphology, but effector mechanisms. MDSCs were first identified in tumor models, and
where show to make up almost 40% of leukocytes within the spleens of transgenic mice
overexpressing oncogenes47. Additionally, they have been detected in the blood of human cancer
patients. In these models, G-MDSCs were shown to preferentially expand when compared to MO-
MDSCs48. The expansion of MDSCs is directly caused by the secretion of growth factors and
cytokines by cells in these pathological conditions. For example, in bacterial infections, T cells
producing IFN-ɣ stimulated the proliferation of MDSCs49. Moreover, the number of these cells
have also been shown to increase in autoimmune diseases such as experimental autoimmune
encephalomyelitis and autoimmune uveoretinitis50,51. Investigation of MDSCs in different disease
models has pointed toward an immunomodulatory and suppressive role for MDSCs.

13
1.2b) MDSC Expansion
During an inflammatory response, the stromal milieu secretes soluble mediators that
induce the expansion of MDSCs. These cytokines and growth-factors promote myelopoiesis and
prevent the maturation of myeloid cells. Some factors that induce the expansion of suppressive
immature myeloid cells include: stem-cell factor (SCF), prostaglandin E2 (PGE2), M-CSF, and many
other molecules31. MDSCs that infiltrate into cancer tissue may stimulate the development of
intratumoral T regulatory cells and promote T cell anergy. These mechanisms are used by various
cancers to avoid immunosurveillance. Chen et al. have identified various factors that are
upregulated during tumor growth, and one was SCF. The receptor for this cytokine is CD117 (c-
KIT). Using tumor-bearing mice, SCF siRNA knockdown, and CD117 antagonizing antibodies the
group was able to demonstrate a substantial decrease in MDSC expansion and restored
proliferative capability of tumor infiltrating T cells52. Therefore, outlining the importance of the
SCF cKIT interaction in promoting MDSC expansion during inflammation. Moreover, the Ostrand-
Rosenberg group generated data that implicates pro-inflammatory lipid-mediators in MDSC
expansion. In vitro work using PGE2 agonists showed the expansion of Gr-1+ CD11b+ MDSCs in
vitro. Additionally, the importance of PGE2 in MDSC expansion was validated using in vivo models
where MDSC proliferation was reduced in BALB/c PGE2 receptor knockout transgenic mice and
mice treated with COX-2 inhibitor that were subject to 4T1 mammary carcinoma cell
transplantation53. Finally, using a heterotopic heart transplantation model Ochando et al.
realized that the interference with M-CSF receptor signaling prevented the induction of MDSCs

14
mediated regulatory tolerance32. Together this data demonstrates that soluble factors that are
secreted during the inflammatory are implicated in promoting MDSC expansion.
The cytokines described above mediate their activity through Janus kinase (JAK) protein
family members and signal transducer and activator of transcription 3 (STAT3). Upon
engagement, JAK2/STAT3 promote cell survival and differentiation signals through signal
transduction events54. Gabrilovich et al. showed that using a STAT3 inhibitor, JSI-124, the MDSC
infiltrate levels in a mouse CT26 colon carcinoma model decreased, and promoted the
accumulation of mature macrophages55. These results were confirmed by the Yu group, which
showed that inhibiting STAT3 signaling in Cre-STAT3loxp/loxp transgenic mice, which were
inoculated with MB49 or B16 tumor cells, enhanced immunosurveillance and the function of
effector leukocytes56. Together, these results associate STAT3 as a main transcription factor
needed for MDSC expansion and function.
One mechanism that JAK2/STAT3 system utilizes to expand MDSCs is through the
upregulation of S100 calcium-binding proteins A8 and A9 (S100A8 and S100A9). The presence of
these proteins prevent myeloid progenitor cell differentiation and aid in the homing of MDSCs
into tumor sites31. The Gabrilovich group showed that the overexpression of S100A9 in stem cells
or transgenic mice promoted the differentiation of MDSCs, and inhibited development of mature
macrophages and dendritic cells. Additionally, the STAT3 dependent upregulation of S100A9 was
correlated with enhanced MDSC accumulation in tumor-bearing mice57. Elevated levels of
S100A8 and S100A9 are common in pro-inflammatory conditions such as cell damage or
infection. These proteins bind to receptors for advanced glycation end-products (RAGE), such as
carboxylated N-glycans that are expressed on the surface of MDSCs. Srikrishna et al. showed that

15
blocking S100A8 and S100A9 binding to RAGE using anti-carboxylated glycan antibodies reduced
the levels of circulating MDSCs in the blood of mice with metastatic disease58. S100A8/A9
mediated autocrine signaling promotes the induction of MDSCs from immature myeloid cells. In
conclusion, molecules such as IL-6, M-CSF, and PGE2 that are secreted during an inflammatory
response bind to JAK2/STAT3 receptors on IMCs. This event promotes MDSC development
through the upregulation of survival genes, such as cyclin D1, B-cell lymphoma XL (Bcl-XL), and
MYC31. Additionally, STAT3 dependent upregulation of S100A8/A9 further enhance MDSC
development and accumulation in sites of inflammation59.
1.2c) MDSC Activation
Signaling through JAK2/STAT3 promotes the expansion of MDSCs, but does not
upregulate genes that mediate suppressive activity. Molecules that are secreted by inflamed
stromal cells, stimulated T cells, and pathogens alter the gene expression of MDSCs, and induce
iNOS, arginase-1, and TGF-β activity. The signal transduction pathway is mediated through STAT1,
STAT6, and MyD8831. Both MO-MDSCs and G-MDSCs have the capability to suppress T cell
function and contribute to immune evasion mechanisms utilized by a variety of cancer. However,
monocytic and granulocytic MDSCs use different effector mechanisms to do this. Binding of IFN-
ɣ to its cognate receptor promotes the docking of STAT1 to the intracellular domain of the
receptor. A cascade of phosphorylation events mediated by STAT1 promotes the production of
iNOS mRNA, which is expressed in MO-MDSCs60. Thus, blocking IFN-ɣ signaling disrupts only MO-
MDSC function and promotes expansion of CD8+ intratumoral T cells. Moreover, this was

16
confirmed by showing iNOS transcript was unable to be detected by quantitative reverse
transcription PCR (q-rt-PCR) from STAT1-/- MDSCs61. Collectively, this data shows that iNOS
function in MO-MDSCs is STAT1 dependent, and nitrosylation events facilitated by this enzyme
abrogate T cell function (this will be discussed in the following section).
Monocytic and granulocytic MDSCs share a common mechanism to suppress lymphocyte
function and that is through the expression of arginase-1. This enzyme is regulated by STAT6,
which binds to the intracellular domain of a type I heterodimeric cytokine receptor. T helper 2
(Th2) cytokines, IL-4 and IL-13, bind to this receptor and are required for STAT6-dependent
arginase-1 activity62. In line with these observations, the blockade of STAT6 via STAT6+/-
transgenic mice, inhibits arginine metabolism by activated MDSCs63. Interestingly, MDSCs use the
STAT6 pathway to also secret TGF- β, which promotes regulatory tolerance and reduced
immunosurvilance64. The depletion of essential amino acids has a negative effect on T cell
function, and is one mechanisms used by suppressive myeloid cells collectively.
PRRs play an essential role in detecting microbial derived pathogen associated molecular
patterns (PAMPs) and DAMPs. The engagement of either surface or intracellular PRRs initiates an
innate immune response characterized by inflammation and an anti-viral response. Under septic
conditions, antigen presenting cells and T lymphocytes are dysfunctional65. This observation has
put tremendous focus on identifying what leads to the loss of immunocompetence. In chronic
inflammation models the population of immature myeloid cells tends to increase in secondary
lymphoid organs66. The Moldawer group not only showed that MDSCs are the primary cell type
contributing to T cell suppression in septic mice, but also adaptor proteins of PRRs are necessary
for the activation of these MDSCs31,67. MyD88 and TIR domain-containing adaptor-inducing IFN-

17
β (TIRF) adaptor proteins bind to the domains of PRRs and recruit other proteins that activate the
nuclear factor kappa-light-chain-enhancer of activated B cells (NF-κB). This transcription factor is
responsible for upregulating both arginase and iNOS enzyme in MDSCs31. Altogether, this work
indicates that the activation of MDSCs is a direct outcome of the innate immune response and
cytokines secreted by both stromal and immune cells.
1.3 MDSC Effector Functions
1.3a) L-Arginine Metabolism
Amino acids are essential subunits that make up proteins, which are important in a myriad
of biological functions. Amino acids, such as L-arginine, are the precursors for other organic
molecules that play a crucial role in the normal physiology of mammals, such as nitric oxide, urea,
and proline68. The importance of this amino acid in the diet of humans has made it a subject of
extensive investigation. Recently, the metabolism of this amino acid has been shown to play a
role in abrogating the immune response69. However, before exploring the mechanism of amino
acid metabolism, it is crucial to define how L-arginine is synthesized and metabolized under
normal physiological conditions. L-glutamine and L-proline are the main precursor amino acids
for the synthesis of L-arginine, which is catalyzed by phosphate-dependent glutaminase,
ornithine aminotransferase (OAT), argininosuccinate synthase (ASS), argininosuccinate lyase
(ASL), aspartate aminotransferase, carbomoyl-phosphate synthase I (CPS I), ornithine
carbamoyltransferase (OCT), and N-acetylglutamate70. The distribution of these enzymes varies

18
in different cell types throughout mammals, and the complete pathway for net arginine in adult
mammals occurs through the intestinal-renal axis. The intestinal mucosa synthesizes L-citrulline,
which is then secreted in to the blood where the conversion to L-arginine occurs in the kidney71.
L-arginine can be metabolized through multiple pathways, and the two enzymes that compete
for L-arginine as a substrate are arginase and nitric oxide synthase69.
Mammals encode two isoforms of the arginase enzyme, which are under the control of
the ARG1 and ARG2 genes69. Although these enzyme share homology in their genetic sequence,
they are localized to different organs in mammals. Arginase-1 is found in the cytosol of
hepatocytes, while arginase-2 is constitutively expressed and located in the mitochondria of
various cells68. Moreover, under STAT6 signaling, arginase-1 is upregulated in myeloid cells when
exposed to cytokines, such as IL-4, IL-13, GM-CSF, and TGF-β72,73,74. Another group of enzymes
that bind to L-arginine are the 3 isoforms of NOS, which include: neuronal NOS (nNOS or NOS1),
inducible NOS (iNOS or NOS2), and endothelial NOS (eNOS). These dimeric enzymes required
calmodulin and numerous co-factors for their full activation. NOS2 has been shown to be
upregulated in many leukocytes, and just like arginase-1, requires signaling through STAT6 or
STAT168.
Signal transduction through STAT6 upregulates the mouse cationic amino-acid
transporters CAT2A, CAT2B, CAT3 and CAT4, which transport various amino acids including L-
arginine75. Under normal conditions, when L-arginine is transported inside cells, arginase-1 binds
the amino acid and catalyzes the production of L-ornithine and a by-product, urea. Downstream
reactions mediated by ornithine decarboxylase (ODC) and OAT, induce cell division and collagen
synthesis69. However, when L-arginine is scarce an alternative pathway for catabolism is

19
activated. Here, NOS enzymes bind L-arginine to produce the L-arginine precursor L-citrulline and
NO. This reaction generates superoxides as a by-product, which reacts with NO to produce
reactive nitrogen species (RNS) that cause oxidative damage to macromolecules76,77. The
depletion of L-arginine and generation of oxidative molecules have been implicated in the
immunoregulatory functions of MDSCs.
NOS2 and arginase-1 expression in MO-MDSCs are regulated by T helper 1 (TH1) and TH2
cytokines. The TH1 cytokine IFN-ɣ promotes the production of NO by NOS2, while TH2 cytokines
like IL-4 and IL-13 inhibit NOS2 and induces arginase-1 activity69. This is a simplified scheme, as
studies have also shown both STAT1 and STAT6 pathways activate NOS2 and argainse-1
expression78. Ochoa et al. showed that tumor infiltrating myeloid cells, CD11b+ ARG1+ CAT2B+,
impaired T cell function by reducing the expression of the T cell receptor component CD3 ζ. The
injection of arginase inhibitors reversed this effect in 3LL lung carcinoma model79. Additionally,
the depletion of L-arginine and the production of urea have been shown to negatively impact the
translation of proteins. Amino acid starvation results in the activation of general control non-
depressible 2 (GCN2) and catalyzes the removal of a phosphate group on eukaryotic translation
initiation factor 2 (EIF2α), which effectively stops translation80. Moreover, the activity of
arginase-1 effects the mTOR pathway, which regulates metabolic function through the sensing
of nutrients. Aberrations in the MTOR pathway and the suppression of protein synthesis caused
by arginase-1 activity is another mechanism that reduced T cell proliferation and function81. NO
effects T cell function through the regulation of downstream T cell receptor (TCR) intracellular
singling. This is accomplished through the nitrosylation of tyrosine or cysteine residues or by the
activation of other kinases, which mediate the blockade of JAK/STAT signaling of TCRs82. MDSCs

20
expression of arginase-1 and NOS2 mediate T cell dysfunction and promote a state of
immunosuppression.
1.3b) Generation of Reactive Oxygen Species
Reactive oxygen species (ROS), such as superoxide anion (O2-), hydrogen peroxide
(H2O2), and hydroxyl (OH•) are by-products of aerobic respiration83. These molecules are
involved in initiating oxidative stress, which leads to pathology, and serve as signaling molecule
that regulate normal biological processes84,85. Superoxides are produced by redox reactions in
the electron transport chain of mitochondria during normal respiration, and by the membrane-
bound enzyme called NADPH oxidase. Superoxide dismutases 1 and 2 (SOD1/2), located in the
cytosol and the mitochondrial membrane, convert superoxides into hydrogen peroxide83,86.
Finally, hydrogen peroxide is produced from the reaction between hydrogen peroxide and
ferrous ions. At normal physiological levels ROS function as signaling molecules, while the
excessive accumulation of these molecules in the environment result in the oxidation of lipids,
proteins, and DNA, leading to cellular and DNA damage87.
Growth factors, such as epidermal growth factor (EGF) and platelet-derived growth factor
(PDGF), promote cell proliferation. This event is facilitated by autophosphorylation events
downstream of receptor tyrosine kinase (RTK) activation88. During this process, the RTK pathway
is regulated by phosphatases including: protein tyrosine phosphatases (PTPs) and PTEN89,90.
Interestingly, growth factors mediate the production of ROS through the activation of NADPH
oxidases. The secretion of hydrogen peroxide promotes cell proliferation by oxidizing and

21
effectively disabling phosphatases that reduce mitogenic signaling. Under normal conditions, cell
proliferation by growth factors require ROS secondary messengers91. In addition to cell
expansion, ROS are essential redox messengers for the activation of immune cells. Innate
immune cells respond to pathological conditions through sensing PAMPs and DAMPs. When
danger signals bind to their respective PRR, ROS production is increased and activate
inflammasomes, which promote the production of pro-inflammatory cytokines83. Moreover, ROS
production from the cell surface and mitochondria have been shown to promote T and B
lymphocyte proliferation92,93. Prolonged production of ROS, however, can promote
tumorigenesis and autoimmunity through sustained cellular growth and chronic inflammation83.
Additionally, in the absence of antioxidants, the dysregulation of NADPH oxidase enzymes
promotes apoptosis by inducing mitochondrial stress and the release of pro-apoptotic
mediators94.
During a normal immune response, mature phagocytes utilize ROS to reduce infection,
enhance PRR signaling, and promote adaptive immune function95. Granulocytic MDSCs produce
ROS through STAT3 signaling, and the upregulation of S100A8 and S100A9 proteins. Additionally,
growth factors and pro-inflammatory cytokines have been shown to induce ROS production by
G-MDSCs96. Superoxide anions produced by G-MDSCs react with NO to produce peroxynitrite,
which is one of the most powerful oxidants produced in mammals31. This reaction augments the
immunosuppressive effect of T cell nitration caused by NO discussed earlier.
1.3c) Induction of T Regulatory Cells

22
Thymic generation of T cells from common lymphoid progenitor cells is accomplished
through a wide-array of elaborate cellular reactions. The random rearrangement of variable (V),
joining (J), and diversity (D) segments in the formation of immunoglobulins (Ig) and TCRs is
possibly the most important event in the generation of B and T cells respectively97. This method
of producing a highly variable TCR repertoire often times may result in the production of
autoreactive T lymphocytes. Fortunately, most are deleted during negative selection event in the
thymus; however, some do escape into the periphery80. The expansion of these self-reactive cells
may result in the development of diseases, such as type I diabetes, asthma, and inflammatory
bowel disease98. In order to maintain homeostasis many regulatory mechanism are in place to
prevent these ailments. Principal among these mechanisms is the generation of Tregs through
deletional and regulatory tolerance.
Tregs utilize four main mechanisms to suppress aberrant immune cells function through
the production of inhibitory cytokines, cytolysis, metabolic disruption, and targeting stimulatory
molecules on APCs. The three main inhibitory molecules produced by Tregs are IL-10 and TGF-
β98. Upon secretion, IL-10 binds to the IL-10 receptor and signals through a JAK/STAT signaling
pathway, where STAT3 is the required downstream transcription factor for IL-10 mediated
suppression99. The dimerization of this transcription factor induces the expression of genes in
apoptotic, cell migration, cell cycle, and cytokine pathways. In particular STAT3 activates the
upregulation of Bcl-XL, IL-10, TGF-β, PD-1, and the downregulation of genes required for antigen
presentation100. TGF-beta binding to its respective receptor induces apoptosis through the SMAD
pathway, reduced cell proliferation by downregulating the gene MYC, and blocks the activation
of leukocytes101. Moreover, Tregs secret granzyme-b, serine protease, and perforin to induce

23
programmed cell death of target cell. This is done through destabilizing genomic material and
organelles, which in turn promote the upregulation of pro-apoptotic genes102. Tregs are
characterized by high expressions of CD25, which is the receptor of IL-2, and rapidly consume IL-
2 in the microenvironment effectively starving activated T cells from this essential cytokine
necessary for T cell proliferation103. Finally, Tregs induce suppression of target cells by direct
cellular contact. Tregs express cytotoxic T-lymphocyte antigen 4 (CTLA-4), which competes for
CD80 and CD86 co-stimulatory molecules with CD28. CTLA-4 prevents T cell activation by
preventing co-stimulatory signals and singling through the TCR104. Treg function and
development are dependent on the expression of the key transcription factor, forkhead box P3
(FoxP3)98.
Tregs are generated by mechanisms of deletional and peripheral tolerance, which occur
in the thymus (tTregs) and periphery (iTregs) respectively. After naive thymocytes pass through
the selection process in the cortex of the thymus and upregulated the CD4 co-receptor they
interact with medullary thymic epithelial cells (mTECs), DCs, macrophages, and other antigen
presenting cells in the medulla. In this instance, naive thymocytes undergo another round of
selection dependent on the TCR signal strength via interaction with cognate peptide-MHC. A
strong signal through the TCR promotes deletion; a low signal supports the formation of
conventional T cells, while a moderate TCR signal strength stimulates FoxP3 induction and the
development of Tregs105. Additionally, cytokine signaling through the common gamma chain (γc)
with cytokines such as IL-2, IL-7, and IL-15 are also important for FoxP3 induction106. Signal
transduction through this receptor activates STAT5, which binds to a nuclear region of the FoxP3
gene and encourages expression of this transcription factor107. Moreover, the induction of iTregs

24
from peripheral CD4+ T cells is dependent on the binding of high-affinity antigen to the T cell
receptor, along with reduced co-stimulation brought about by increased CTLA-4 expression and
reduced CD28 activation108,109. As in tTreg induction IL-2 is crucial; however, in iTreg
development, TGF-β is also important. This cytokine promotes SMAD3 and nuclear factor of
activated T-cells (NFAT) binding to FoxP3, survival factors, and antagonizing the recruitment of
maintenance DNA methyltransferase I (Dnmt1)105. Deletional and regulatory tolerance
mechanisms are important in maintaining immune homeostasis.
Recent studies have demonstrated the ability of MDSCs to promote suppression through
the induction of Tregs in tumors110. MDSC mediation of iTreg development was found to require
CTLA-4 expression, and was independent of TGF-β secretion by MDSCs111,112. Conversely, another
group found that MDSCs were not involved in the expansion of Tregs60. In this study we showed
that MDSCs promoted the induction of Tregs (Figure 2.3). The role that MDSCs play in the
induction of peripheral tolerance is not clear. However, it seems possible that these cells can
induce Tregs through the processing of alloantigen and direct cell-to-cell contact.

25
1.4 MDSCs and the Current State of Transplant Research
Currently, many groups are studying MDSCs and exploring their role in preventing
allograft rejection. Dr. Zhiqiang Pan and colleagues are investigating the potential of sepsis
induced MDSCs in prolonging allograft survival, particularly in corneal and skin transplant models.
In this model, female B6 mice were donors and female B6 mice were recipients. Sepsis induced
MDSCs were isolated from cohorts of B6 mice, which underwent a cecal ligation and puncture
procedure. Here, the cecum is punctured, promoting the release of fecal material into the
peritoneal cavity. This event stimulates an exacerbated immune response. MDSCs were isolated
from the bone marrow and stained with anti-CD11b and anti-Gr-1 monoclonal labeled
antibodies. MDSCs were then enriched using fluorescence activated cell sorting. These sepses
induced MDSCs were adoptively transferred into either corneal or skin transplant recipients.
Graft survival was scored, and results show that group which received MDSCs significantly
prolonged graft survival. This data suggests that MDSCs may be used as a novel cellular based
therapeutic method to promote graft acceptance113.
Moreover, clinical studies have shown that patients who show an increase in the
expression of S100A8/A9 proteins have a better clinical outcome after transplantation114. As we
have discussed earlier in chapter 1, these proteins are essential components for MDSCs
activation. In fact, Dr. Eikmans’ group who published this recent study showed that these
proteins also correlated with MDSCs. Here, peripheral blood mononuclear cells (PBMCs) were
isolated from healthy donors, and MDSCs were enriched and cultured with M-CSF, IL-4, and LPS.

26
Functional assays showed that increased production of ROS by these cells reduced the activity of
DCs, and prevented DC mediated alloactivation of T cells. The effect of MDSCs on antigen
presentation as well as T cell activation proves that MDSCs are of significant importance to
transplantation outcome.
Finally, MDSCs have also been implicated in the efficacy of new drugs used for
transplantation. Hematopoietic cell transplantation has become a common curative practice for
patients with hematological malignancies. Graft-versus-host disease (GvHD) is a common
concern after bone marrow transplantation and can be avoided through the administration of
drugs, such as cyclophosphamide. However, it has recently been shown that this drug is
associated with increased relapse. For this reason the feasibility of other drugs were investigated.
Dr. Katsanis and colleagues have recently shown that bendamustine significantly reduces GvHD
and improves survival rates when compared to cyclophosphamide. Here they show that
bendamustine is less myelosuppressive than other medication, and promotes the development
of CD11b+ Gr-1+ MDSCs. In culture these suppressive MDSCs impair T and B cell proliferation,
which may contribute to GvHD. Together this data shows that the efficacy of bendamustine is
associated with the expansion of MDSCs. MDSCs have been studied mostly in the context of
cancer immunology; however, recently data suggest that these cells play a paramount role in
allograft acceptance. Further studies of these cells are necessary to develop new novel
therapeutics to improve clinical outcomes of transplant recipients.

27
1.5 Conclusion
We have made significant advances in transplant immunology over the past few decades.
Dr. Medawar group was the first to identify cell-mediated rejection of allografts, and
demonstrated adaptive tolerance through the first chimerism experiments. Using this
information and developing new surgical techniques Dr. Murrays team was able to conduct the
first successful transplant. However, despite our increased knowledge of the immune system and
the pathology of organ rejection transplant recipients continue to face major complications,
which can be attributed to chronic immunosuppression and the lack of tolerance toward donor
antigens. A promising solution that can solve both of these problems is the induction of mixed
chimerism. In this model, the donor and recipient immune systems live in harmony and donor
APCs aid in the deletion of alloreactive T cells in the thymus. The efficacy of this model has been
demonstrated in the clinic, but chimerism is transient. This implies that the long-term acceptance
of allografts in mixed chimerism patients is attributed to regulatory rather than deletional
tolerance. For this reason it is important to dissect what components of the hematopoietic
system influence regulatory tolerance. Possible candidates are a group of heterogeneous cells of
myeloid origin called MDSCs.
MDSCs arise from normal CMPs produced during myelopoiesis, however under
pathological conditions such as chronic microbial infection, cancer, or transplantation stromal
cells release pro-inflammatory cytokines which mediate the suppression of myeloid maturation
and the development of MDSCs. These cells promote suppression through a variety of
mechanisms, such as the depletion of essential amino acids, production of reactive oxygen
28
species, and the induction of regulatory T cells. MDSCs have been shown to be important in the
development of tumors, and their depletion results in increased activity of tumor infiltrating
leukocytes. The exploitation of the suppressive activity of MDSCs may prove to be therapeutic to
individuals who are recipient of allografts.

29
Chapter 2: Myeloid-Derived Suppressor Cells Alter Phenotypic Expression Pattern and Induce the Development of T Regulatory Cells In Vitro
2.1 Abstract
Myeloid-Derived Suppressor Cells are a heterogeneous population of immature myeloid
cells. The two major subsets are granulocytic and monocytic MDSCs, which differ in morphology
and effector functions. CD11b+ Ly6G+ Ly6C- G-MDSCs are expanded in tumor-bearing mice, and
suppress immune function through the secretion of ROS and depletion of L-arginine from the
microenvironment. CD11b+ Ly6G- Ly6C+ MO-MDSCs also mediate the suppression of
lymphocytes, but do so by the production of RNS such as peroxynitrite. Although these cells have
been implicated in the production of IL-10 and the induction of T regulatory cells, it is unclear if
MO-MDSCs can do the same through direct cell-to-cell interaction. The aim of this study is to
develop an in vitro culture technique to produce suppressive MO-MDSCs, and elucidate their role
in promoting regulatory tolerance. MO-MDSCs were enriched using a negative selection
protocol, and cultured with stimulating cytokines such as IL-4 and M-CSF. To engage the MyD88
pathway, the myeloid cells were also cultured with the TLR4 ligand, LPS. Flow cytometry and
naïve T cell cultures were used to determine suppressive MO-MDSC phenotype and the capability
to induce Tregs. After stimulation with IL-4, M-CSF, and LPS, MO-MDSCs dramatically altered
their gene expression profile. Ly6C, podoplanin, CD80, and CD86 markers were reduced, while
PD-L1 and F4/80 gene expression increased. These MDSCs were also able to induce T regulatory
cells in an allogeneic fashion. Moreover, histological analysis showed that CD11b+ Ly6Clo and

30
F4/80+ myeloid cells accumulate in accepted renal allografts. Together, these results indicate that
stimulation with IL-4, M-CSF, and LPS cause the differentiation of these immature myeloid cells
to macrophage like cells. The induction of T regulatory cells was dependent on MyD88 activity,
and we hypothesize that it is achieved through direct alloantigen presentation to naïve T cells.
The localization of CD11b+ Ly6Clo cells and the functional characteristics of cultured MO-MDSCs
provide initial evidence that these cells may play a role in the induction of regulatory tolerance
to promote graft survival.
2.2 Introduction
A significant challenge in transplant immunology is the establishment of a protocol, which
promotes tolerance to donor antigens without the continued use of immunosuppressive drugs.
A successful technique, such as this, would reduce immune mediated graft destruction and the
prescription of immunosuppressant medication. To date, one method has been quite successful
in the clinic, mixed chimerism115. However, there are a few issues with this approach, which
prevent it from becoming standard practice. One such problem is the harsh conditioning required
before bone marrow engraftment21. Accordingly, it is important to identify what hematopoietic
cells are necessary to prevent rejection, so updated methods of intervention can be developed.
Gabrilovich and colleagues have made substantial contributions to our understanding of myeloid-
derived suppressor cells. These immature progenitors have been mostly studied within the
context of cancer immunology, and have been shown to contribute to tumor metastasis48.

31
Recently, their role in transplantation has been described by Ochando et al., where they provide
evidence showing mechanisms MO-MDSCs utilize to promote regulatory tolerance32. MDSCs
suppress the immune system through the secretion of cytokines and reactive species; moreover,
their potential to promote tolerance through cell-to-cell contact is unclear. The goal of our study
was two-fold, which was to design an MO-MDSC induction protocol, and to elucidate their
capacity to induce T regulatory cells through direct TCR interaction.
2.3 Results
2.3a) Enrichment of Monocytic Myeloid-Derived Suppressor Cells
Hypothesis: Labeling unwanted cells with biotinylated antibodies directed against non-monocytes
will provide a higher yield of MO-MDSCs compared to enrichment protocols that target the non-
specific Gr-1 marker.
Myeloid-derived suppressor cells are a heterogeneous group of immature cells. As
described earlier, they are characterized by the expression of CD11b and lymphocyte antigen 6
(Ly6)116. The former makes up a subunit of the heterodimeric integrin αMβ2, also known as
macrophage-1 antigen (Mac-1)117. Ly6 can be subdivided into groups, Ly6G and Ly6C. MDSCs with
granulocytic morphology express high levels of Ly6G, while Ly6C is a common surface marker for
the monocytic subtypes31. These progenitor cells are created from the normal myelopoiesis

32
process in the bone marrow, and differentiate into suppressive cells within pro-inflammatory
environments34. MO-MDSCs have been shown to play an important role in transplant tolerance
and the induction of T regulatory cells118. In order to develop an in vitro culture technique, we
first needed to appropriately enrich CD11b+ Ly6C+ cells from the bone marrow.
Immunohistochemical analysis showed that Gr-1+ cells (anti-Gr-1 monoclonal antibody is reactive
to both Ly6G and Ly6C epitopes) accumulate in renal allografts that were harvested six weeks
after transplantation (Figure 2.1 A). The Gr-1 cells organized themselves within the lymphocytic
infiltrate of TOLS. Interestingly, cells expressing Ly6C were not found in the TOLS, but in the
vasculature that TOLS surround (Figure 2.1 B). The validation that our cells of interest can be
found in renal allografts, prompted us to isolate MDSCs based on the Gr-1 marker. MDSCs were
collected in two fractions. Using flow cytometry, the mean fluorescence intensity (MFI), with
respect to the Gr-1 surface marker, indicated that two separate populations were isolated (Figure
2.1 C). Due to the cross-reactivity of the Gr-1 antibody to both Ly6 antigens, it was necessary to
employ a different technique that would allow for the enrichment of a more pure population of
Ly6C monocytes. This was achieved using a negative selection protocol, where the unlabeled
fraction collected was almost all positive for Ly6Chi monocytes, and the labeled fraction was
completely void (Figure 2.1 D). Here we were able to successfully enrich a population of CD11b+
Ly6Chi monocytes from the bone marrow of non-pathogenic mice using a negative selection
protocol.

33

34
Figure 2.1 Enrichment of CD11b+ Ly6Chi Monocytic Myeloid-Derived Suppressor Cells. Transplants were conducted between MHC-disparate mice (DBAB6), and allografts were harvested after 42 days. Histological slides were fixed in formalin and embedded in paraffin. Immunohistochemical analysis of renal allograft was conducted using A) anti-Gr-1 and B) anti-Ly6C antibodies. C) Bone marrow cells were obtained from B6 mice, and a positive selection protocol was enacted to isolate Ly6G and Ly6C myeloid cells. This was done using antigen specific biotin antibodies and streptavidin beads to Gr-1. The first positive fraction contained G-MDSCs, while the second positive fraction contained MO-MDSCs. D) Ly6Chi monocytes were enriched using a negative selection protocol via the addition of biotinylated and tetrameric magnetic antibodies directed against non-monocytes. Gr-1 and Ly6C fluorescently labeled antibodies were used for flow cytometric analysis. Quadrant boundaries were set by isotype controls.

35
2.3b) Phenotypic Analysis of Cultured Monocytic Myeloid-Derived Suppressor Cells
Hypothesis: Culturing MO-MDSCs with the MyD88 stimulant, LPS, will result in the increased
expression of co-inhibitory markers.
The successful enrichment of CD11b+ Ly6Chi monocytes allowed us to develop proper in
vitro culture, which would allow the differentiation of suppressive MO-MDSCs. As described in
chapter 1, adequate myelopoiesis events required growth factors, such as M-CSF and GM-CSF.
These cytokines stimulate pathways that lead to the expression of PU.1 as well as C/EBPα, β, and
δ isoforms, which are important myeloid lineage transcription factors34. Moreover, MDSC
development requires additional signals to promote expansion and activation. M-CSF and IL-4
mediated signal transduction events results in the expression of survival genes (MYC, BCL-XL, and
cyclin D1) and the expression of arginine metabolizing enzymes (iNOS and arginase-1)
respectively31. Interestingly, in addition to the cytokines mentioned, pro-inflammatory pathways
governed by the adaptor protein MyD88 also need to be activated so that the full suppressive
capacity of MDSCs can be realized67. Taking this information into account an in vitro culture
technique was developed. Here, CD11b+ Ly6Chi monocytes were enriched from the bone marrow
of mice, and cultured with IL-4, M-CSF, and LPS. Co-stimulatory, co-inhibitory, morphological, and
intracellular markers were analyzed using flow cytometry.
Phenotypic analysis of respective markers were conducted in three separate groups:
naïve MO-MDSCs, MO-MDSCs cultured with growth factors, and MO-MDSCs cultured with
growth factors and LPS. Two co-stimulatory molecules that were of great interest were CD86

36
(B7.2) and CD80 (B7.1). The interaction between these co-stimulatory molecules and CD28 on T
cells lowers the threshold of activation required for T lymphocyte stimulation119. CD80 and CD86
are expressed on professional antigen presenting cells, and we wanted to analyze the relative
expression patterns of these molecules across our indicated three groups. Naïve CD11b+ Ly6Chi
cells isolated from naive mice did not express either of these molecules. However, upon culture
with M-CSF and IL-4 both CD80 and CD86 expression increased, with CD86 upregulation nearly
twice as abundant when compared to CD80. Furthermore, addition of LPS to the culture
promoted cells to dramatically reduce expression of these co-stimulatory molecules to levels
comparable with the naïve compartment (Figure 2.2 A and B). Interestingly, PD-L1 expression
increased with the addition of M-CSF and IL-4. The same result was seen with the LPS group, but
the induction was not as intense (Figure 2.2 C). Ochando and colleagues, using microarray,
showed that monocytes infiltrating the myocardium increased the expression of a PRR, DC-SIGN,
which was explained to be necessary in the secretion of IL-10 and induction of regulatory
tolerance32. Our culture failed to show any increase in DC-SIGN expression across all groups,
suggesting that other mediators that are present within the graft are needed for expression
(Figure 2.2 D).
In addition to innate stimulatory and inhibitory molecules, we examined the expression
of macrophage markers. Interestingly, we found that Ly6C expression is reduced after culture
with cytokines, with and without LPS (Figure 2.2 E). Additionally, enriched MDSCs prior to culture
did not express F4/80, a mature macrophage marker; however, they seemed to upregulate this
surface protein in the presence of cytokines regardless LPS addition (Figure 2.2 F). Some studies
have shown that CD11b+ inflammation induced macrophages promote lymphangiogenesis, and

37
we wanted to examine if MO-MDSCs express the lymphatic endothelium marker podoplanin120.
We saw that prior to culture our cells of interest did not express this maker, but after stimulation
with the respective growth factors, about 25% of CD11b+ cells upregulate podoplanin. Levels
were reduced after LPS addition, but were still greater than naïve MO-MDSCs (Figure 2.2 G).
Finally, one mechanism in which monocytic MDSCs suppress T cell activity is through regulation
of L-arginine metabolism. So, we examined intracellular iNOS levels, which were not substantially
increased after culture (Figure 2.2 H). Our results indicate that after stimulation with M-CSF, IL-
4, and LPS there is alteration in the expression of both surface and intracellular genes. Groups
stimulated with LPS, which are theoretically suppressive, increased their expression of CD86 and
podoplanin when compared to the group not cultured with the MyD88 stimulant.

38

39
Figure 2.2 Phenotypic Analysis of Cultured CD11b+ Ly6Chi Monocytic Myeloid-Derived Suppressor Cells. MO-MDSCs were enriched using the protocol described in Figure 2.1, and were plated at 5x10⁴ cells per well. These monocytes were supplemented with 10ng/mL of IL-4 and M-CSF. After 48 hours 100ng/mL of LPS was added to respective groups. Surface and intracellular markers were then analyzed using flow cytometry. The fluorescently labeled antibodies there were used, include: A) anti-CD86 B) anti-CD80 C) anti-PD-L1 D) anti-DC-SIGN E) anti-Ly6C F) anti-F4/80 G) anti-podoplanin H) anti-iNOS. Quadrant boundaries were set by isotype controls.

40
2.3c) Effect of Monocytic Myeloid-Derived Suppressor Cells on the Induction of Tregs
Hypothesis: MO-MDSCs cultured with IL-4, M-CSF, and LPS have the potential to promote
regulatory tolerance through the induction of Tregs.
T Regulatory cells play an important role in modulating the immune response. These cells
function through the expression of inhibitory molecules, secretion of cytotoxic mediators, release
of anti-inflammatory cytokines, and the depletion of local IL-2105. MDSCs have recently been
shown to induce Tregs in tumor models, but other studies suggest that these immature myeloid
cells are not involved in Treg induction31,112. Previously we have shown that allograft tolerance
requires the development and maintenance of FoxP3+ Tregs6. We hypothesize that MO-MDSCs
contribute to allograft tolerance through the promotion of regulatory tolerance mechanisms. To
study this, using our culturing technique, we examined the effect of MO-MDSCs on the induction
of Tregs.
CD11b+ Ly6Chi monocytes were enriched from the bone marrow of both DBA and B6
background mice. The cells were cultured according to the protocol described in Figure 2.2, and
were then cultured with B6 CD25- CD4+ Naïve T cells. The purpose of isolating MO-MDSCs from
two genetically distinct mice was to model syngeneic and allogenic Treg induction. T regulatory
cells require IL-2 and CD28 engagement for their proper development. Non-suppressive (-LPS)
and suppressive (+LPS) MO-MDSCs were cultured with or without IL-2 and TGF-β in conjunction
with naïve B6 T cells. Across all combinations of cytokines and LPS, B6 MO-MDSCs were unable
to adequately induce B6 Tregs (Figure 2.3 A). Interestingly, un-suppressive DBA MO-MDSCs that

41
were supplemented with IL-2 and TGF-β were able to induce a minute amount of Tregs. However,
even more surprising, suppressive DBA MO-MDSCs were able to induce Tregs with and without
the addition of IL-2 and TGF-β. FoxP3 induction was lower in the cohorts that were not
supplemented with Treg stimulating cytokines (Figure 2.3 B). These results indicate that the MO-
MDSCs produced in culture are able to induce Tregs in an allogenic manner. This is most likely
due to the presentation of allopeptide and activation of the TCR.

42
Figure 2.3 Cultured CD11b+ Ly6Chi Monocytic Myeloid-Derived Suppressor Cells Induce T Regulatory Cells in an Allogeneic Fashion. MO-MDSCs were enriched and cultured using the protocol described in Figure 2.1 and Figure 2.2 respectively. MO-MDSCs were transferred to new 96 well plates and 1.5x10⁵ CD25- CD4+ naïve B6 T cells were added per well (1 MO-MDSC: 3 Naïve T cell). The wells were supplemented with or without 10ng/mL of IL-2 and TGF-β (cytokines). After 96 hours, the cells were fixed and analyzed using flow cytometry. A) B6 MO-MDSCs effect on B6 Treg induction. B) DBA MO-MDSC effect on B6 Treg induction. Quadrant boundaries were set by isotype controls.

43
2.3d) Accumulation of F4/80+ and Ly6Clo CD11b+Cells in Renal Allografts
Hypothesis: MO-MDSCs accumulate in the TOLS of accepted renal allografts.
Establishing a new protocol for the induction of MO-MDSCs helped us reveal that these
cells alter their expression pattern of certain genes and have the capability to induce Tregs in an
allogeneic manner. We next wanted to determine if we can isolate these cells from renal
allografts that were harvested after 42 days. Histochemical analysis showed that F4/80
expressing cells localize to periphery of TOLS (Figure 2.4 A). Moreover, CD11b+ Ly6Clo cells were
found to infiltrate to renal allografts, but not the native kidney of the graft recipient. Moreover,
CD11b+ Ly6Clo myeloid cells were not identified in in naïve controls (Figure 2.4 B). Next, to we
wanted to know if any F4/80+ cells could be found in the graft. Here, the renal allograft was
digested and all lymphocytes were extracted out of the fraction. Gating on only CD11b+ cells we
found that about a fifth of all CD11b+ cells were F4/80+ (Figure 2.4 C). These results indicate that
myeloid cells consistent with our phenotypic analysis of suppressive MO-MDSCs are located
within the allograft environment. However, more techniques need to be employed to definitively
state if our cells of interest in fact accumulate in renal allografts.

44
Figure 2.4 Accumulation of F4/80+ and Ly6Clo CD11b+ Myeloid Cells within Renal Allografts. A) Harvested DBAB6 renal allograft was harvested after 6 weeks and a frozen histological section was produced, which displays the result of anti-F4/80 staining. B) 6 week post-transplant renal allograft was digested using collagenase. The cells were fixed in paraformaldehyde and stained with anti-Ly6C and anti-CD11b fluorescently conjugated antibodies. C) Following the same graft isolation protocol, the lymphocytes were removed from the cell suspension and the obtained fraction was stained with anti-F4/80 and anti-CD11b fluorescently labeled antibodies. Quadrant boundaries were set by isotype controls.

45
2.4 Discussion
Here we demonstrated that MO-MDSCs that are cultured with IL-4, M-CSF, and LPS alter
their gene expression patterns and cells that are supplemented with the MyD88 stimulant are
capable of inducing T regulatory cells. Very few Gr-1+ cells were identified to accumulate in renal
allografts, however, Ly6C+ cells were detected in the vasculature that TOLS surround. This is quite
interesting, because this tells us that Ly6C+ cells are possible localizing to the graft. Moreover,
because little Ly6C+ cell can be found in the graft, we hypothesize that our cells of interest may
infiltrate the graft, but dramatically reduce expression of the Ly6C surface antigen. To further
elucidate the function of MO-MDSCs, an in vitro culture technique was developed.
As described above, IL-4 and M-CSF stimulating cytokines were given as growth factors,
which, according to literature, promote the upregulation of survival genes as well as iNOS and
argianase-131. Additionally, a MyD88 stimulant was also needed to fully activate MO-MDSCs67. We chose
to use LPS because of cost and availability, however, the nuclear protein high mobility group box 1
(HMGB1) is most likely the TLR4 agonist in in vivo models. Cells that were supplemented with or without
LPS during the 72 hour culture dramatically changed their phenotypic expression. Most notably,
consistent with our hypothesis, MO-MDSCs reduced Ly6C expression. Interestingly, F4/80, a marker for
macrophages, was significantly upregulated. This data points toward the possibility that, in culture, MO-
MDSCs are maturing and differentiating into macrophages. The promotion of F4/80 expression on the
surface of cells seemed to be independent of LPS and dependent on IL-4 and M-CSF. We hypothesize that
the terminally differentiated cells are M2 like macrophages, principally on the observation that IL-4 has
been known to promote the M2 axis37. The next steps would be to identify the cytokine secretion profile

46
of our cells and definitively identify what an M1 or M2 pattern. This would be done by culturing the cells
in vitro and for the last hours add a protein transport inhibitor, such as brefeldin A. We would then stain
using antibodies to pro or anti-inflammatory cytokines.
Recently, we have demonstrated that TOLS contain FoxP3+, CD4+, CD8+, B220+, CD11c+, and
CD11b+ cells. These structures have been identified in the kidneys across species, and lack high endothelial
venules as well as distinct T and B cell zones. So, these structures do not share the same characteristics of
tertiary lymphoid structures. Interestingly, these TOLS are also podoplanin+. CD11b+ macrophages have
been shown to express podoplanin and promote lymphangiogenesis120. We hypothesize that MO-MDSCs
may be promoting TOLS formation. Cells that were cultured with stimulating cytokines upregulated
podoplanin on their surface, but quickly reduced them when LPS was added. Furthermore, a prominent
feature of MDSC activity is iNOS activity. MO-MDSCs cultured with all combinations of factors failed to
upregulated iNOS. This is most likely do to the observation that iNOS regulation is linked to STAT1
signaling, which is governed by IFN-ɣ. In the future we would like to deplete MO-MDSCs using anti-CD169
monoclonal antibodies in transplant recipients and examine whether or not TOLS are broken. Additionally,
we would like to supplement our cultured with interferon and examine iNOS expression, as this cytokine
is most likely present within the microenvironment of transplant recipients.
Co-stimulatory and co-inhibitory cytokines regulate T cell responses through the stabilization of
TCR mediated signaling. We choose to look at CD80, CD86, and PD-L1 expression of our MO-MDSCs after
culture. Cells cultured without LPS were different than cells cultured with LPS with respect to CD86
expression. B7.2 was upregulated with the addition of only growth factors, but reduced when LPS was
added. This is most likely because suppressive MDSCs do not want to co-stimulate and activate T cells,
rather their physiological role is to reduce T cell function. CD80 expression was similar between the two
groups. Interestingly, PD-L1 expression was also upregulated in LPS stimulated cells. This is consistent with
the downregulation of B7 molecules to inhibit T cell activation. Moreover, Ochando and colleagues

47
showed that MO-MDSCs upregulate the PRR DC-SIGN, which is explained to be of importance during the
induction of regulatory tolerance. After culture, we did not see the increase expression of this PRR. This
may be due to the fact that protein mediators other than M-CSF and IL-4 are necessary for the regulation
of this gene. After phenotypic analysis, we conducted functional assays to determine the ability of these
cells to promote Treg induction.
A syngeneic and allogenic model were used to examine Treg induction. Cells across the same
strain combination were not able to induce the differentiation of FoxP3+ Tregs from naïve T cells. However,
DBA MO-MDSCs cultured with B6 naïve T cells were able to induce Tregs. Presumable this was mediated
by direct presentation of allopeptide and engagement of the TCR. During the Treg induction, cells
supplemented with or without TGF-β and IL-2 were able to induce regulatory cells. However, when these
cytokines were added to culture, a greater abundance of FoxP3 was recorded. To identify if this is
occurring through an MHC TCR interaction new experiments are being developed where B6 MO-MDSCs
are cultured through our normal protocol, and for 24 hours after this, cells are pulsed with DBA lysate.
Also we are going to use flow cytometry to examine the expression of MHC I and II genes after culture.
Finally, we digested a kidney that was grafted into a MHC dissimilar mouse, and after 42 days it was
harvested and digested. We were able to clearly identify the presence of Ly6Clo and F4/80+ CD11b+ cells.
To clearly identify if our cells of interest are localizing to the graft we will label suppressive MO-MDSCs in
vitro with CFSE and adoptively transfer them to a recipient. Where after an appropriate amount of time
the graft will be harvested and digested to look for the accumulation of these cells within the graft.
In conclusion, we developed a culturing technique, which stimulated the differentiation of MO-
MDSCs with the ability to induce T regulatory cells. To date, the induction of Tregs through direct cell-to-
cell contact is unclear. Here, we provide a potential new mechanism for the induction of regulatory
tolerance. The data provides a framework for developing new therapeutic measures for transplant
recipients involving the administration of matured MO-MDSCs.

48
2.5 Materials and Methods
Mice
C57BL/6 (H2Db) and DBA/2J (H2Dd) strains were purchased from Jackson Laboratories
(Bar Harbor, ME). All mice were maintained under pathogen-free conditions in filter-top cages
throughout the experiments with an automatic water system and were cared for in accordance
with the methods approved by the American Association for Accreditation of Laboratory Animal
Care. All animal experiments were approved by the Center for Comparative Medicine’s at
Massachusetts General Hospital.
Surgical Protocol
Bilateral nephrectomy accompanied with left kidney transplantation were performed on
recipient B6 mice with a donor DBA/2 (H-2d) kidney. This procedure was performed as previously
described6. Blood urea nitrogen (BUN) and urea output was monitored daily (score).
Buffer Preparation
Three different buffers were used throughout the experiments. MACS buffer was used
for isolation of MDSCs using the Miltenyi protocols, and to make this 2.5 grams of bovine serum

49
albumin (BSA) and .29 grams ethylenediaminetetraacetic acid (EDTA) were added to 500mL of
1x PBS and mixed thoroughly. EasySep Buffer was used for the STEMCELL protocols, and was
prepared by adding 0.2922g EDTA and 20mL of 2% fetal bovine serum (FBS) to 980mL of 1x PBS.
Moreover, FACS staining buffer was prepared by the addition of 50ml 10x PBS, 5g BSA, and 0.5 g
sodium azide (NaN3) to 450mL of de-ionized water. This buffer was used during flow cytometry.
Histological and Immunopathological Assessment
Transplanted kidney grafts were removed upon mouse euthanasia and cross-sectioned.
One section was fixed in 10% formalin and embedded in paraffin. The other section was
embedded and frozen in OCT compound (Sakura Finetek USA Inc., Torrance, CA) and stored at -
20°C. Paraffin sections were further processed for staining of CD11b, Gr-1, and Ly6C at 10%
formalin fixation; 3% H2O2 to block endogenous peroxidases; citrate buffer pH 6.0 for 1 min at
100°C as antigen retrieval treatment.
Hematopoietic Blood Cell and Splenocyte Isolation
Mouse femurs and tibias were extracted and stored in 1mL of RPMI (Sigma-Aldrich, St.
Louis, MO). Using 19-gauge needles, the bone marrow was flushed out into a sterile petri dish
containing 8mL of RPMI. Isolated bone marrow cells in the petri dish were then transferred to a

50
15mL Falcon tube (Fisher Scientific, Waltham, MA). Suspension was then centrifuged at 1300
RPM for 8 minutes. Supernatant was discarded and 1mL of Red Blood Cell Lysis Buffer (Sigma-
Aldrich, St. Louis, MO) was added. After 2 minutes, 9mL of RPMI was used to re-suspend the cell
mixture. Spleens were isolated from sacrificed animals and placed in 1mL of RPMI in a 15mL
conical tube on ice. Under the hood, a sterile plunger was used to smash the spleen. The
suspension of splenocytes was collected and passed through a sterile cotton filter into a 15mL
Falcon tube. The cells were centrifuged at 1300 RPM and lysed similarly to the bone marrow cells.
Myeloid-Derived Suppressor Cell Enrichment
MDSCs were isolated using two methods. First, Gr-1hi Ly6G+ and Gr-1lo Ly6G- MDSCs were
obtained following Miltenyi Biotec’s Myeloid-Derived Suppressor Cell Isolation Kit, mouse
(Cambridge, MA). Briefly, bone marrow cells were isolated using the protocol above, and the
resulting cell suspension was incubated with anti-Ly6G Biotin antibody and anti-Biotin
microbeads. The cells are then passed through a MACS column (Miltenyi Biotec, Cambridge, MA),
which attracts the magnetically labeled Ly6G+ cells, while the Ly6G- cells are collected in the flow
through. The Ly6G+ cells are eluted from the column, and the Ly6G- cells are purified through the
addition of an anti-Gr-1 Biotin antibody and Streptavidin Microbeads. The labeled population are
then passed through another MACS column, and are magnetically retained and subsequently
eluted. CD11b+ Ly6Chi cells were isolated from the bone marrow using StemCell Technologies’
EasySep Mouse Monocyte Enrichment Kit (Vancouver, CA). This negative selection protocol,
labels unwanted cells using biotinylated antibodies against tetrameric antibody complexes

51
recognizing biotin and dextran-coated magnetic particles. The cells are fractionated using an
EasySep magnet.
Myeloid-Derived Suppressor Cell Culture
MDSCs were isolated from the bone marrow using the previously described enrichment
protocol of Ly6C cells. The cells were platted at 5x10⁴ cells per well in a round bottom 96-well
polystyrene plate. The cells were suspended in 200µL of complete medium and supplemented
with 10ng/mL of IL-4 and M-CSF for 72 hours. To obtain suppressive MDSCs, 100ng/mL of LPS
was added to respective wells for the last 24 hours.
Myeloid-Derived Suppressor Cell Induction of T Regulatory Cells
To isolate naïve CD4+ CD25- T cells were isolated from the spleen of a B6 mice. T cells were
then purified from this cell suspension using StemCell’s Mouse Naïve CD4+ T cell Isolation Kit.
Here, biotinylated antibodies and streptavidin-coated magnetic particles were directed against a
multitude of markers to remove unwanted cells. Isolated MDSCs were added to round bottom
96 well plates at 5x10⁴ cells per well. Also, 1.5x10⁵ naïve T cells were added to each respective
well. The cells were supplemented with IL-2 and TGF-β at a concentration of 10ng/mL. As a
control, naïve T cells were plated alone with cytokines and CD3 and CD28 beads. The cells were
cultured for a total of 96 hours before analysis.

52
Flow Cytometric Analysis of Myeloid-Derived Suppressor and T Regulatory Cells
Cells were stained with FITC-conjugated anti-mouse CD11b, PerCP-Cyanine5.5-
conjugated anti-mouse Ly-6C, FITC-conjugated Ly-6G (Gr-1), PE-eFluor 610 conjugated anti-
mouse Ly-6G (Gr-1), FITC-conjugated anti-mouse F4/80, PE-conjugated anti-mouse podoplanin,
PerCP-conjugated anti-mouse DC-SIGN, FITC-conjugated anti-mouse NOS2, PE-conjugated anti-
mouse CD80, PE-conjugated anti-mouse CD86, and PerCP-conjugated anti-mouse PD-L1, PE-
conjugated anti-mouse CD3ε, and PerCP-conjugated anti-mouse FoxP3 mAbs to identify
myeloid-derived suppressor cell population. All cells were analyzed on the BD Accuri C6
Cytometer (BD Biosciences) with FlowJo software (Tree Star Data Analysis Software, Ashland,
OR).

53
Chapter 3: Accepted Allografts Across Mismatched Mammals are Characterized by Increased Nitrosylation
3.1 Abstract
Leukocytes can modulate the immune response through manipulation of amino acid
metabolism. Recent findings indicate that the depletion of L-arginine and release of nitric oxide
(NO) into the microenvironment suppresses the immune system by impairing T-cell function.
iNOS expressing cells, such as CD11b+ subsets, have been studied in the context of tumor
progression and infectious disease; however, their potential to induce transplant tolerance
remains unclear. The aim of this study is to examine nitrosylation levels and iNOS expressing
cells across murine renal allografts. DBA donor kidneys were transplanted into B6 recipients
and were euthanized after 1, 3, and 6 weeks. Additionally, cardiac tissue from NHP MHC-
mismatched grafts were harvested and analyzed. Nitrosylation was assessed by
immunohistochemistry (IHC) using anti-nitrotyrosine and anti iNOS unconjugated antibodies.
CD11b+ cells were isolated from 6 week kidney allografts, and analyzed with IHC and flow
cytometry. IHC confirmed that the tyrosine residues of accepted allografts were heavily
nitrosylated, while rejected cohorts from the same strain combination following Treg depletion
were not. Histological analysis showed that iNOS positive cells were present in lymphocytic
infiltrate as early as 1 week and persisted at 6 weeks. Moreover, IHC and flow cytometry
indicated that CD11b+ cell localize to Treg-rich organized lymphoid structures (TOLS), which are
signature formations of kidney acceptance, and express iNOS. Accepted renal allografts are

54
distinct from rejected allografts with respect to nitrosylation. The presence of iNOS+ cells
shows that NO production occurs within the kidney microenvironment. CD11b+ cells within the
TOLS of the graft are one source of NO production. Our results show the possibility of NO
playing a role in graft acceptance and implicate myeloid progenitors in this process.
3.2 Introduction
Nitric oxide synthase is commonly associated with the innate axis of the immune system,
and is responsible for antimicrobial and tumoricidal activity. However, the development of new
technologies, such as NOS directed antibodies and knock-out mice, reveal a broader function of
this enzyme in regulating lymphocyte function121. This is due to NO strong reaction with thiol
groups of amino acid residues, superoxide anions, soluble cations, and nucleic acids122,123,124. The
different isoforms of nitric oxide synthase all produce NO using L-arginine as a substrate, but
differ in their regulation at the transcriptional level. Both eNOS and nNOS are expressed
constitutively in endothelial cells and neurons respectively; however, iNOS is upregulated in
leukocytes during pro-inflammatory settings68. Although the role of eNOS has been established,
the specific function of iNOS in immune cells is unclear and is currently the subject of extensive
research. Today, emerging studies are implicating iNOS in transplant tolerance.
The majority of renal allograft infiltrating leukocytes that express iNOS are of myeloid
origin, but recent studies have shown that iNOS is constitutively expressed in renal tubular cells,
glomeruli, and segments of both the interlobular and arcuate arteries125. The expression of this

55
enzyme in macrophages requires the intervention of pro-inflammatory cytokines and microbial
stimulants, such as IL-1β, TNF-α, and LPS126. Moreover, the production of NO by iNOS in myeloid
cells have been shown to prevent intratumoral infiltration of antigen-specific T cells through the
nitration of amino acids on chemokines and the inhibition of adhesion receptors127,128.
Additionally, iNOS deficiency has been shown to promote graft rejection in a syngeneic model of
transplantation129. Collectively, this data points towards iNOS as a regulator of T cell infiltration
and possibly cytotoxic function. The aim of our study is to examine the role of nitrosylation in
allograft acceptance, and the potential contribution of MDSCs in this process.
3.3 Results
3.3a) Nitrosylation Patterns of Accepted and Rejected Allografts
Hypothesis: Accepted renal allografts will show more tissue nitrosylation than rejecting allografts.
Using our spontaneous acceptance model, we wanted to assess the levels of nitrosylation
in renal allografts. We stained naïve, rejecting, and accepted renal allografts. In the past, we have
shown that graft acceptance requires Tregs. We simulated graft rejection by transplanting a
kidney from a DBA/2J into a B6.Foxp3-DTR mouse. After the operation was completed, a
sequential dose of DTR was administered to deplete Tregs. In naïve and rejecting models we saw
no nitrosylation of graft tissue. Interestingly, allografts that were accepted were characterized by

56
increased nitrosylation (Figure 3.1 A). Next, we wanted to examine if this phenomenon was
conserved in samples obtained from NHP cardiac rejecting models. Here, we observed that as
the time course of rejection proceeds, nitrosylation decreases (Figure 3.1 B). Our results show
that NO is deposited on the tyrosine residues of renal allograft tissue, and that this phenomenon
is reduced in NHP hearts as rejection proceeds.
57
Figure 3.1 Anti-Nitrotyrosine Staining of Accepted Murine Renal Allografts and Rejecting NHP Cardiac Allografts. A) DBA donor kidneys were transplanted into B6 recipient mice. The same strain combination was used in the rejecting model, except the recipient was a B6.FoxP3-DTR mouse, and diphtheria toxin was administered before and after transplantation at a constant dosage. Naïve, rejected, and accepted murine renal allografts were fixed in paraffin embedded sections and stained with anti-nitrotyrosine antibodies. B) Cardiac tissue was obtained from NHP heart allograft models and also stained using anti-nitrotyrosine. The clinical score of transplant rejection was assessed by physician tending to the animal.

58
3.3b) iNOS+ Cells Accumulate in Accepted Renal Allografts
Hypothesis: Increased graft nitrosylation is associated with the accumulation of iNOS+ cells within
the TOLS.
We next wanted to look at what cells in the allograft are producing nitric oxide. To do
this, we stained histological samples with anti-iNOS antibodies. Naïve renal samples only
showed moderate staining within tubular cells; however, after the transplant procedure iNOS+
cells accumulated within the TOLS. These cells peaked in number at 3 weeks post-operation,
and persisted to 6 weeks (Figure 3.2 A). Since myeloid cells are the major type of white blood
cells that express this enzyme, we digest the allograft with type II collagenase and stained total
cells for CD11b and iNOS. Using out isotype control, we gated on cells that were CD11b+, and
found that more than 10% of CD11b+ cells expressed iNOS. Accepted renal allografts are distinct
from rejected allografts with respect to nitrosylation. The presence of iNOS+ cells shows that
NO production is occurring within the kidney microenvironment. CD11b+ cells within the TOLS
of the graft are one source of NO production. Our results show the possibility of NO playing a
role in graft acceptance and implicate myeloid progenitors in this process.

59
Figure 3.2 Accumulation of CD11b+ iNOS+ Cells in Accepted Renal Allografts. Transplants were conducted between MHC-mismatched strain combinations (DBAB6). A) Histological sections of the kidney were obtained from naïve and 1, 3, and 6 week post-operation recipients. Samples were fixed, and stained with anti-iNOS antibodies. B) The same allograft was digested, after histological samples were obtained, and digested with type II collagenase. Cells were stained with either isotype controls or anti-CD11b and anti-iNOS. Quadrant boundaries were set by isotype controls.

60
3.4 Discussion
The role of metabolism in modulating the immune system is currently of great interest.
Specifically, the metabolism of L-arginine has been shown to be essential in lymphocyte
function69. Two enzyme of interest that use L-arginine as a substrate are arginase-1 and iNOS.
Nitric oxide is a by-product of the reactions carried out by these enzymes. Interestingly, NO and
other reactive species have been shown to regulate cellular function, and under great
concentration cause tissue damage77. Here, we show that nitric oxide is deposited on tyrosine
residues of tissue in accepted allografts, and that myeloid cells that accumulate in grafts
contribute to NO production.
Histological analysis of an accepted renal allograft tissue showed excessive nitrosylation,
while rejected cohorts showed none. Moreover, we show that as the rejection process proceeds
in NHP hearts nitrosylation levels decrease. Taken together, these observations shows a
correlation between graft acceptance and nitrosylation. Studies in cancer models have shown
that nitrosylation of tumors contributes to intratumoral T cell dysfunction through inhibition of
chemokine, integrin, and TCR function128,127. Our hypothesis is that the diffuse production of NO
contribute to graft tolerance through similar mechanisms.
Nitric oxide is produced in a gaseous form and may diffuse through different
compartments of the body. We wanted to look at where NO is being secreted. Histological
analysis using anti-iNOS antibodies show that both infiltrating mononuclear and renal tubular
cells express this enzyme. This shows that NO production is occurring within the kidney
microenvironment. Furthermore, characterization of these cells showed that a portion of

61
accumulating immune cells are of myeloid origins. We hypothesize that our cells of interests are
matured MDSCs, which have also been implicated in nitrosylation of tumor tissue128. To further
support his hypothesis new experiments will be conducted. In particular we plan on experimental
models where NOS2 deficient kidneys from DBA mice will be transplanted into wild-type B6 mice.
Studies from this experiment will show if donor, recipient, or both combinations are contributing
to graft nitrosylation. These results will be analyzed in conjunction with control transplants
among the same strain combinations. Our hypothesis is that the graft will be rejected, and
tolerance is dependent on iNOS+ infiltrating leukocytes. The recapitulation of tolerance will be
assessed through the adoptive transfer of suppressive MO-MDSCs. Moreover, the transfer of
MO-MDSCs deficient in L-arginine transport into recipients will further evaluate the importance
of MO-MDSCs in tolerance induction.
Today, recipients of allografts are often prescribed immunosuppressive drugs to prevent
immune mediated graft rejection. Nitrosylation of graft tissue could serve as a maker for
transplant tolerance, and could be used to asses when patients should be taken off
immunosuppression. Also, nitrosylation of graft tissue through localized administration could
possibly be used as a new immunosuppressant. In theory, this intervention would prevent T cell
infiltration, which are the major mediators of rejection. Chronic immunosuppression using
common mediation is associated with the development of malignancies, diabetes, and other
disease. The production of new therapeutics is necessary to improve the lives of allograft
recipients. Studying MDSCs is the first step in this process.

62
3.5 Materials and Methods
Mice
C57BL/6 (H2Db) and DBA/2J (H2Dd) strains were purchased from Jackson Laboratories
(Bar Harbor, ME). All mice were maintained under pathogen-free conditions in filter-top cages
throughout the experiments with an automatic water system and were cared for in accordance
with the methods approved by the American Association for Accreditation of Laboratory Animal
Care. All animal experiments were approved by the Center for Comparative Medicine’s at
Massachusetts General Hospital.
Surgical Protocol
Bilateral nephrectomy accompanied with left kidney transplantation were performed on
recipient B6 mice with a donor DBA/2 (H-2d) kidney. This procedure was performed as previously
described6. Blood urea nitrogen (BUN) and urea output was monitored daily (score).
Buffer Preparation
Three different buffers were used throughout the experiments. MACS buffer was used
for isolation of MDSCs using the Miltenyi protocols, and to make this 2.5 grams of bovine serum
albumin (BSA) and .29 grams ethylenediaminetetraacetic acid (EDTA) were added to 500mL of

63
1x PBS and mixed thoroughly. EasySep Buffer was used for the STEMCELL protocols, and was
prepared by adding 0.2922g EDTA and 20mL of 2% fetal bovine serum (FBS) to 980mL of 1x PBS.
Moreover, FACS staining buffer was prepared by the addition of 50ml 10x PBS, 5g BSA, and 0.5 g
sodium azide (NaN3) to 450mL of de-ionized water. This buffer was used during flow cytometry.
Histological and Immunopathological Assessment
Transplanted kidney grafts were removed upon mouse euthanasia and cross-sectioned.
One section was fixed in 10% formalin and embedded in paraffin. The other section was
embedded and frozen in OCT compound (Sakura Finetek USA Inc., Torrance, CA) and stored at -
20°C. Paraffin sections were further processed for staining of iNOS and nitrosylated tyrosine
residues at 10% formalin fixation; 3% H2O2 to block endogenous peroxidases; citrate buffer pH
6.0 for 1 min at 100°C as antigen retrieval treatment.
Flow Cytometric Analysis of iNOS+ Cells
Cells were stained with FITC-conjugated anti-iNOS and APC-conjugated anti-CD11b
monoclonal antibodies. All cells were analyzed on the BD Accuri C6 Cytometer (BD Biosciences)
with FlowJo software (Tree Star Data Analysis Software, Ashland, OR).

64
Chapter 4: Myeloid-Derived Suppressor Cells and the Current State of Transplant Research
4.1 Concluding Remarks
In the past years we have made significant strides in advancing the fields of
transplantation and immunology. Together, a greater understanding of these subjects has led to
improved patient care through the development of better organ transportation systems,
immunosuppressive medication, and noninvasive clinical diagnosis. However, despite our
progresses, we continue to face many challenges, such as poor long-term graft survival and
increased morbidity due to chronic immunosuppression16. Both of these problems can be
attributed to immune-mediated graft destruction. This event is facilitated by allorecognition of
donor antigen by the adaptive axis and heightened recruitment of leukocytes to the graft. More
specifically, cytotoxic lymphocytes, alloantibody production, and the deposition of complement
proteins all enhance an immune response against a newly implanted graft12. A solution to
preventing graft destruction is to develop techniques that limit alloantibody recognition. Today,
this can be achieved through T cell depletion, co-stimulatory blockade, and chimerism.
Successful tolerance protocols enacted in the clinic, such as mixed chimerism, require
harsh preconditioning regimens to partially ablate the hematopoietic compartment and deplete
lymphocytes, which may react against donor bone marrow engraftment. Moreover, initial studies
in mice have shown that the elimination of T cells alone contribute to prolonged graft acceptance;
however, the translation of this protocol in the clinic has proven to be disappointing18.
65
Furthermore, the treatment of patients with other lymphocyte antagonizing drugs suggest that
the reduction of T cell activity may not be sufficient in inducing transplant tolerance alone24. For
this reason, it is important to examine the potential of other cells, such as those in the innate
arm of the immune system, to induce regulatory or deletional tolerance130.
Myeloid-derived suppressor cells are a very heterogeneous population, and the lack of
consensus concerning their identifiable markers and naming make studying these cells quite
difficult. Taking this into consideration, MDSCs have been examined in the context bacterial
infection, malignancy, and transplantation. These cells can be divided into two populations,
granulocytic and monocytic MDSCs. They differ not only in morphology, but suppressive function.
The latter through the production of ROS, and the former in manipulating the metabolism of L-
arginine. G-MDSCs have been shown to expand in the context of uncontrolled cell division
(cancer), and protect tumors by mediating the prevention of immunosurveillance127. While, M-
MDSCs have been implicated in promoting regulatory tolerance in transplantation through the
production of anti-inflammatory cytokines32. The recent studies on M-MDSCs suggest that they
may be relevant in facilitating allograft acceptance. Here, we show that M-MDSCs are able to
induce T regulatory cells in an allogenic background, and that they may be contributing
dysfunction of T cell function and/or recruitment.
During the normal myelopoiesis process, M-CSF and GM-CSF are important in promoting
normal myeloid development. However, under pathogenic conditions monocytes stop their
differentiation into mature macrophages or DCs and gain suppressive function. These cells are
called MDSCs. The monocytic cohort are defined by their expression of CD11b and Ly6C. The
expansion of these cells in pathogenic environments, mostly due to the engagement of the

66
MyD88 pathway, prompted us to examine the expression of genes of interest. We wanted to
phenotypically characterize M-MDSCs that have been cultured with and without the MyD88
agonist, LPS. We observed that cells cultured without LPS had a marked increase in CD86 and PD-
L1 expression when compared to LPS treated groups. These cells, which we believe to be naïve
M-MDSCs because of a lack of exposure to activating stimulants, most likely upregulate CD86 due
to the culture with LPS. PD-L1 could be providing signals to T cells promoting reduced function
via immunoreceptor tyrosine-based inhibitory motif (ITIM) signaling, which could potentially
override signals from CD86 engaging the immunoreceptor tyrosine-based activation motif
(ITAM). Groups supplemented with or without LPS, however, are similar with the reduced
expression of Ly6C and increase the F4/80 surface protein. The significant difference between
these two groups is that cells cultured with LPS are the only ones that are able to induce T
regulatory cells. Moreover, this phenomenon is only observed when M-MDSCs are cultured with
naïve T cells of different genetic origin. It is for this reason, we suspect that induction may be
prompted through direct TCR interaction with MHC and allopeptide. In vitro studies aside, we
also showed that CD11b+ Ly6C+ and F4/80+ cells accumulate in accepted renal allografts. This data
shows that M-MDSCs that are exposed to inflammatory stimuli can promote Tregs in culture
across varying MHC backgrounds.
Past studies have shown that the production and deposition of NO on proteins have a
modulatory effect on components of the immune system. Groups have shown that NO produced
by MDSCs bind to chemokines and integrins, inhibiting their normal function in recruiting T
cells127,128. In a separate series of experiments we have noticed a trend that accepted allograft
tissue is nitrosylated, while rejecting grafts lose NO deposition as the score of rejection increases.

67
The major subtype of leukocytes that produce NO are of myeloid origin, and MDSCs which have
been studied in cancer have been shown to produce NO and prevent cytotoxic T cell function127.
We wanted to further examine this observation in our spontaneous renal allograft acceptance
model. Since tubular cells also express iNOS, we prepared histological slides to analyze if cell
infiltrate also expressed iNOS. Our data shows that after 1 week iNOS+ cells other than tubular
cells are present, and persist to 6 weeks after transplant. This data shows that along with tubular
cells, other components, possible leukocytes, are locally producing NO and leading to graft
nitrosylation. Interestingly, we found that CD11b+ cells enriched from 6 week accepted allografts
expressed iNOS. Together, this data shows that iNOS producing myeloid cells may be important
in the nitrosylation process and subsequent graft acceptance. This data, along with the evidence
of Treg induction point toward the potential of M-MDSCs as playing a role in transplantation. We
hypothesize that blood CD11b+ Ly6Chi monocytes localize to the allograft site, and once inside
mature into CD11b+ F4/80+ Ly6Clo MDSCs via signals mediated through M-CSFR, IL-4R, and PRRs.
After their differentiation, M-MDSCs promote tolerance through two mechanisms: Treg
development and the inhibition of T cell function and accumulation. Here, we believe that direct
cell-to-cell contact and cytokine secretion promote Treg development. Moreover, nitrosylation
of chemokines, adhesion receptors, and components of the TCR reduce T cell mediated graft
destruction. In rejecting models, increased infiltration of T cells and other leukocytes may
overwhelm M-MDSC mediated regulation and promote loss of the allograft. More studies will
need to be conducted to validate these hypotheses (comprehensive model Figure 4.1).
In the future we would like to conduct microarray analysis and specifically analyze
adhesion receptors, cytokines, and enzyme mRNA levels to form a clear distinction between M-

68
MDSCs stimulated with HMGB-1 and other PRR ligands. Researchers have yet to fully characterize
these cells and identification of new markers will be novel. Additionally, it will be important to
cytokines and other molecules that are present in the graft microenvironment that may
contribute to M-MDSC expansion and activation. Identifying if these factors are secreted within
the graft will help us elucidate if the M-MDSCs are differentiating in the graft or prior to
infiltration. Next, we need to validate that our cells of interest are actually accumulating within
grafts. This can be assessed with bioluminescence imaging, adoptive transfer of CFSE labeled M-
MDSCs, and histological analysis. Developing a model where we are able to deplete M-MDSCs
will also be important to assess the contribution of these cells in graft acceptance. In the M-MDSC
knockout model we can assess the amount of FoxP3+ cells in the graft as well nitrosylation
patterns. Moreover, contribution of NO secretion to graft acceptance can be further looked at
using NOS2 KO mice, where the recipient is void of iNOS+ cells. Finally, we need to look at what
proteins are being nitrosylated and that can be achieved through enrichment of our cells of
interest from the graft and co-immunoprecipitation experiments to examine NO deposition.
Here, we have laid out preliminary work showing that M-MDSCs may be major contributors to
transplant tolerance, and in the future more experiments will be conducted to validate this claim.
Myeloid-derived suppressor cells have been studied mostly in the context of cancer
immunology; however, recently these immunomodulatory cells have been under intense
investigation in transplant immunology. In particular, MDSCs have been shown to suppress T cell
function through a variety of mechanisms, such as the depletion of essential amino acids,
secretion of anti-inflammatory cytokines, and the inhibition of TCR mediated signal
transduction31. The discovery of these functions has made MDSCs a prime candidate for cellular

69
therapy in the induction of allograft tolerance and autoimmunity. Our new insights into the
function of MO-MDSCs further add to the potential validity of these cells as therapeutic agents
to improve the lives of patients.

70
Figure 4.1 Model of MO-MDSCs Function in Renal Allografts. CD11b+ Ly6Chi MO-MDSCs circulate in the blood and localize to renal allografts. Mediators in the allograft, such as M-CSF, IL-4, and HMGB1 promote the differentiation of naïve MO-MDSCs into M2-like macrophages. Here, these cells promote tolerance through the inhibition of T cells by secreting RNS and depleting L-arginine. Additionally, these terminally differentiated cells promote regulatory tolerance through the induction of Tregs via the presentation of allopeptide. *Adopted from: Ochando et al. doi:10.1016/j.immuni.2015.05.009

71
References
1. Murray, J., Merrill, J. & Harrison, J. Renal homotransplantation in identical twins. Surg. Forum 6, 432–436 (1955).
2. Pabón, M. A. et al. Minor histocompatibility antigens as risk factor for poor prognosis in kidney transplantation. in Transplantation Proceedings 43, 3319–3323 (2011).
3. Gibson, T. & Medawar, P. B. The fate of skin homografts in man. J. Anat. 77, 299–310.4 (1943).
4. Tolar, J., Tolarova, S. & Mcgrath, J. A. On Medawar’s ‘Actively acquired tolerance of foreign cells’. Experimental Dermatology 23, 97–98 (2014).
5. Tonsho, M., Michel, S., Ahmed, Z., Alessandrini, A. & Madsen, J. C. Heart transplantation: Challenges facing the field. Cold Spring Harb. Perspect. Med. 4, (2014).
6. Shinoda, K. et al. Depletion of Foxp3+ T cells abrogates tolerance of skin and heart allografts in murine mixed chimeras without the loss of mixed chimerism. Am. J. Transplant. 14, 2263–2274 (2014).
7. Kim, I. K., Bedi, D. S., Denecke, C., Ge, X. & Tullius, S. G. Impact of innate and adaptive immunity on rejection and tolerance. Transplantation 86, 889–94 (2008).
8. Takeuchi, O. & Akira, S. Pattern Recognition Receptors and Inflammation. Cell 140, 805–820 (2010).
9. Ogura, Y., Sutterwala, F. S. & Flavell, R. A. The Inflammasome: First Line of the Immune Response to Cell Stress. Cell 126, 659–662 (2006).
10. Lo, D. J. et al. Chemokines and their receptors in human renal allotransplantation. Transplantation 91, 70–77 (2011).
11. Larsen, C. P., Morris, P. J. & Austyn, J. M. Migration of dendritic leukocytes from cardiac allografts into host spleens. A novel pathway for initiation of rejection. J. Exp. Med. 171, 307–14 (1990).
12. Wood, K. J. & Goto, R. Mechanisms of Rejection: Current Perspectives. Transplantation 93, 1–10 (2012).
13. Anglicheau, D. & Suthanthiran, M. Noninvasive prediction of organ graft rejection and outcome using gene expression patterns. Transplantation 86, 192–9 (2008).
14. Asgari, E., Zhou, W. & Sacks, S. Complement in organ transplantation. Curr. Opin. Organ Transplant. 15, 486–91 (2010).
15. Lanier, L. L. Up on the tightrope: natural killer cell activation and inhibition. Nat. Immunol. 9, 495–502 (2008).
16. Turka, L. A. & Lechler, R. I. Towards the identification of biomarkers of transplantation tolerance. Nat. Rev. Immunol. 9, 521–526 (2009).

72
17. Hara, M. et al. IL-10 is required for regulatory T cells to mediate tolerance to alloantigens in vivo. J Immunol 166, 3789–3796 (2001).
18. Armstrong, N. et al. Analysis of primate renal allografts after T-cell depletion with anti-CD3-CRM9. Transplantation 66, 5–13 (1998).
19. Larsen, C. P. et al. Long-term acceptance of skin and cardiac allografts after blocking CD40 and CD28 pathways. Cell. Mol. Immunol. 381, 434–438 (1996).
20. Lenschow, D. J. et al. Long-term survival of xenogeneic pancreatic islet grafts induced by CTLA4lg. Science 257, 789–792 (1992).
21. Hock, K., Mahr, B., Schwarz, C. & Wekerle, T. Deletional and regulatory mechanisms coalesce to drive transplantation tolerance through mixed chimerism. European Journal of Immunology 45, 2470–2479 (2015).
22. Wekerle, T. & Sykes, M. Mixed chimerism and transplantation tolerance. Annu Rev Med 52, 353–370 (2001).
23. Sachs, D. H., Kawai, T. & Sykes, M. Induction of tolerance through mixed chimerism. Cold Spring Harb. Perspect. Med. 4, (2014).
24. Millan, M. T. et al. Mixed chimerism and immunosuppressive drug withdrawal after HLA-mismatched kidney and hematopoietic progenitor transplantation. Transplantation 73, 1386–91 (2002).
25. Russell, B. Y. P. S., Chase, C. M. & Colvin, R. B. INDUCED IMMUNE DESTRUCTION OF LONG-SURVIVING , IN MICE * INCOMPATIBLE KIDNEY TRANSPLANTS We have reported in an accompanying paper that kidney transplants to mice regularly produce an immune alteration toward donor antigens without any other treatment ( 1. Public Health 1469–1486 (1976).
26. Bickerstaff, A. A., Wang, J. J., Pelletier, R. P. & Orosz, C. G. Murine renal allografts: spontaneous acceptance is associated with regulated T cell-mediated immunity. J. Immunol. 167, 4821–7 (2001).
27. Cook, C. H. et al. Spontaneous renal allograft acceptance associated with ‘regulatory’ dendritic cells and IDO. J. Immunol. 180, 3103–3112 (2008).
28. Mellor, A. L. & Munn, D. H. IDO expression by dendritic cells: tolerance and tryptophan catabolism. Nat. Rev. Immunol. 4, 762–774 (2004).
29. Miyajima, M. et al. Early acceptance of renal allografts in mice is dependent on Foxp3 + cells. Am. J. Pathol. 178, 1635–1645 (2011).
30. Bickerstaff, A. & Orosz, C. Evidence for a limited contribution of immune regulation to cardiac allograft acceptance. Hum. Immunol. 63, 935–947 (2002).
31. Gabrilovich, D. I. & Nagaraj, S. Myeloid-derived suppressor cells as regulators of the immune system. Nat. Rev. Immunol. 9, 162–74 (2009).

73
32. Patricia Conde, A. et al. DC-SIGN+ Macrophages Control the Induction of Transplantation Tolerance. Immunity 42, 1143–1158 (2015).
33. van Furth, R. et al. The mononuclear phagocyte system: a new classification of macrophages, monocytes, and their precursor cells. Bull. World Health Organ. 46, 845–852 (1972).
34. Rosmarin, A. G., Yang, Z. & Resendes, K. K. Transcriptional regulation in myelopoiesis: Hematopoietic fate choice, myeloid differentiation, and leukemogenesis. Exp. Hematol. 33, 131–143 (2005).
35. Yona, S. & Gordon, S. From the reticuloendothelial to mononuclear phagocyte system - The unaccounted years. Frontiers in Immunology 6, (2015).
36. van Furth, R. & Cohn, Z. A. The origin and kinetics of mononuclear phagocytes. J. Exp. Med. 128, 415–35 (1968).
37. Gordon, S. Alternative activation of macrophages. Nat. Rev. Immunol. 3, 23–35 (2003).
38. Nau, G. J. et al. Human macrophage activation programs induced by bacterial pathogens. Proc. Natl. Acad. Sci. U. S. A. 99, 1503–8 (2002).
39. Ravetch, J. V & Bolland, S. IgG Fc receptors. Annu. Rev. Immunol. 19, 275–90 (2001).
40. Fitzer-Attas, C. J. et al. Fcgamma receptor-mediated phagocytosis in macrophages lacking the Src family tyrosine kinases Hck, Fgr, and Lyn. J. Exp. Med. 191, 669–682 (2000).
41. Perdiguero, E. G. & Geissmann, F. The development and maintenance of resident macrophages. Nat. Immunol. 17, 2–8 (2015).
42. Goud, T. J. & van Furth, R. Proliferative characteristics of monoblasts grown in vitro. J. Exp. Med. 142, 1200–1217 (1975).
43. Smith, L. T., Hohaus, S., Gonzalez, D. a, Dziennis, S. E. & Tenen, D. G. PU.1 (Spi-1) and C/EBP alpha regulate the granulocyte colony-stimulating factor receptor promoter in myeloid cells. Blood 88, 1234–1247 (1996).
44. Chen, H. et al. PU.1 (Spi-1) autoregulates its expression in myeloid cells. Oncogene 11, 1549–1560 (1995).
45. Kusmartsev, S. & Gabrilovich, D. I. Role of immature myeloid cells in mechanisms of immune evasion in cancer. Cancer Immunology, Immunotherapy 55, 237–245 (2006).
46. Condamine, T. & Gabrilovich, D. I. Molecular mechanisms regulating myeloid-derived suppressor cell differentiation and function. Trends in Immunology 32, 19–25 (2011).
47. Kusmartsev, S. & Gabrilovich, D. I. Immature myeloid cells and cancer-associated immune suppression. Cancer Immunology, Immunotherapy 51, 293–298 (2002).
48. Almand, B. et al. Increased production of immature myeloid cells in cancer patients: a mechanism of immunosuppression in cancer. J. Immunol. 166, 678–89 (2001).

74
49. Goñi, O., Alcaide, P. & Fresno, M. Immunosuppression during acute Trypanosoma cruzi infection: involvement of Ly6G (Gr1(+))CD11b(+ )immature myeloid suppressor cells. Int. Immunol. 14, 1125–1134 (2002).
50. Zhu, B. et al. CD11b+Ly-6C(hi) suppressive monocytes in experimental autoimmune encephalomyelitis. J. Immunol. 179, 5228–5237 (2007).
51. Kerr, E. C., Raveney, B. J. E., Copland, D. A., Dick, A. D. & Nicholson, L. B. Analysis of retinal cellular infiltrate in experimental autoimmune uveoretinitis reveals multiple regulatory cell populations. J. Autoimmun. 31, 354–361 (2008).
52. Pan, P. Y. et al. Reversion of immune tolerance in advanced malignancy: modulation of myeloid derived suppressor cell development by blockade of SCF function. Blood (2007). doi:10.1182/blood-2007-04-086835
53. Sinha, P., Clements, V. K., Fulton, A. M. & Ostrand-Rosenberg, S. Prostaglandin E2 promotes tumor progression by inducing myeloid-derived suppressor cells. Cancer Res. 67, 4507–4513 (2007).
54. Bromberg, J. Stat proteins and oncogenesis. Journal of Clinical Investigation 109, 1139–1142 (2002).
55. Nefedova, Y. et al. Regulation of dendritic cell differentiation and antitumor immune response in cancer by pharmacologic-selective inhibition of the Janus-activated kinase 2/signal transducers and activators of transcription 3 pathway. Cancer Res. 65, 9525–9535 (2005).
56. Kortylewski, M. et al. Inhibiting Stat3 signaling in the hematopoietic system elicits multicomponent antitumor immunity. Nat. Med. 11, 1314–1321 (2005).
57. Cheng, P. et al. Inhibition of dendritic cell differentiation and accumulation of myeloid-derived suppressor cells in cancer is regulated by S100A9 protein. J. Exp. Med. 205, 2235–2249 (2008).
58. Sinha, P. et al. Proinflammatory S100 proteins regulate the accumulation of myeloid-derived suppressor cells. J. Immunol. 181, 4666–4675 (2008).
59. Turovskaya, O. et al. RAGE, carboxylated glycans and S100A8/A9 play essential roles in colitis-associated carcinogenesis. Carcinogenesis 29, 2035–2043 (2008).
60. Movahedi, K. et al. Identification of discrete tumor-induced myeloid-derived suppressor cell subpopulations with distinct T cell suppressive activity. Blood 111, 4233–4244 (2008).
61. Kusmartsev, S. & Gabrilovich, D. I. STAT1 signaling regulates tumor-associated macrophage-mediated T cell deletion. J. Immunol. 174, 4880–91 (2005).
62. Bronte, V. et al. IL-4-induced arginase 1 suppresses alloreactive T cells in tumor-bearing mice. J. Immunol. 170, 270–278 (2003).
63. Rutschman, R. et al. Cutting edge: Stat6-dependent substrate depletion regulates nitric

75
oxide production. J. Immunol. 166, 2173–2177 (2001).
64. Terabe, M. et al. Transforming growth factor-beta production and myeloid cells are an effector mechanism through which CD1d-restricted T cells block cytotoxic T lymphocyte-mediated tumor immunosurveillance: abrogation prevents tumor recurrence. J. Exp. Med. 198, 1741–52 (2003).
65. Hotchkiss, R. S. et al. Sepsis-induced apoptosis causes progressive profound depletion of B and CD4+ T lymphocytes in humans. J. Immunol. 166, 6952–63 (2001).
66. Ezernitchi, A. V et al. TCR zeta down-regulation under chronic inflammation is mediated by myeloid suppressor cells differentially distributed between various lymphatic organs. J. Immunol. 177, 4763–4772 (2006).
67. Delano, M. J. et al. MyD88-dependent expansion of an immature GR-1(+)CD11b(+) population induces T cell suppression and Th2 polarization in sepsis. J. Exp. Med. 204, 1463–1474 (2007).
68. Wu, G. & Morris, S. M. Arginine metabolism : nitric oxide and beyond. Biochem. J. 336, 1–17 (1998).
69. Bronte, V. & Zanovello, P. Regulation of immune responses by L-arginine metabolism. Nat. Rev. Immunol. 5, 641–654 (2005).
70. Wu, G., Davis, P. K., Flynn, N. E., Knabe, D. a & Davidson, J. T. Endogenous synthesis of arginine plays an important role in maintaining arginine homeostasis in postweaning growing pigs. J. Nutr. 127, 2342–2349 (1997).
71. Dhanakoti, S. N., Brosnan, J. T., Herzberg, G. R. & Brosnan, M. E. Renal arginine synthesis: studies in vitro and in vivo. Am. J. Physiol. 259, E437–42 (1990).
72. Munder, M. et al. Th1/Th2-regulated expression of arginase isoforms in murine macrophages and dendritic cells. J. Immunol. 163, 3771–7 (1999).
73. Boutard, V. et al. Transforming growth factor-beta stimulates arginase activity in macrophages. Implications for the regulation of macrophage cytotoxicity. J. Immunol. 155, 2077–84 (1995).
74. Morrison, A. C. & Correll, P. H. Activation of the stem cell-derived tyrosine kinase/RON receptor tyrosine kinase by macrophage-stimulating protein results in the induction of arginase activity in murine peritoneal macrophages. J. Immunol. 168, 853–860 (2002).
75. Kim, J. W., Closs, E. I., Albritton, L. M. & Cunningham, J. M. Transport of cationic amino acids by the mouse ecotropic retrovirus receptor. Nature 352, 725–728 (1991).
76. Xia, Y. & Zweier, J. L. Superoxide and peroxynitrite generation from inducible nitric oxide synthase in macrophages. Proc. Natl. Acad. Sci. U. S. A. 94, 6954–6958 (1997).
77. Xia, Y., Roman, L. J., Masters, B. S. S. & Zweier, J. L. Inducible nitric-oxide synthase generates superoxide from the reductase domain. J. Biol. Chem. 273, 22635–22639

76
(1998).
78. Bronte, V., Serafini, P., Mazzoni, A., Segal, D. M. & Zanovello, P. L-arginine metabolism in myeloid cells controls T-lymphocyte functions. Trends in Immunology 24, 301–305 (2003).
79. Ochoa, A. C., Zea, A. H., Hernandez, C. & Rodriguez, P. C. Arginase, prostaglandins, and myeloid-derived suppressor cells in renal cell carcinoma. Clin. Cancer Res. 13, 721s–726s (2007).
80. Zhang, P. et al. The GCN2 eIF2alpha kinase is required for adaptation to amino acid deprivation in mice. Mol. Cell. Biol. 22, 6681–8 (2002).
81. Rohde, J., Heitman, J. & Cardenas, M. E. The TOR Kinases Link Nutrient Sensing to Cell Growth. Journal of Biological Chemistry 276, 9583–9586 (2001).
82. Bingisser, R. M., Tilbrook, P. a, Holt, P. G. & Kees, U. R. Macrophage-derived nitric oxide regulates T cell activation via reversible disruption of the Jak3/STAT5 signaling pathway. J. Immunol. 160, 5729–5734 (1998).
83. Schieber, M. & Chandel, N. S. ROS function in redox signaling and oxidative stress. Current Biology 24, (2014).
84. Cross, C. E. et al. Oxygen radicals and human disease. Ann. Intern. Med. 107, 526–45 (1987).
85. Finkel, T. Signal transduction by reactive oxygen species. J. Cell Biol. 194, 7–15 (2011).
86. Fridovich, I. Superoxide anion radical, superoxide dismutases, and related matters. J. Biol. Chem. 272, 18515–18517 (1997).
87. Dizdaroglu, M. & Jaruga, P. Mechanisms of free radical-induced damage to DNA. Free Radic. Res. 46, 382–419 (2012).
88. Lemmon, M. A. & Schlessinger, J. Cell signaling by receptor tyrosine kinases. Cell 141, 1117–1134 (2010).
89. Tonks, N. K. Protein tyrosine phosphatases: from genes, to function, to disease. Nat. Rev. Mol. Cell Biol. 7, 833–46 (2006).
90. Wishart, M. J. & Dixon, J. E. PTEN and myotubularin phosphatases: From 3-phosphoinositide dephosphorylation to disease. Trends in Cell Biology 12, 579–585 (2002).
91. Connor, K. M. et al. Mitochondrial H2O2 regulates the angiogenic phenotype via PTEN oxidation. J. Biol. Chem. 280, 16916–16924 (2005).
92. Chaudhri, G., Clark, I. a., Hunt, N. H., Cowden, W. B. & Ceredig, R. Effect of antioxidants on primary alloantigen-induced T cell activation and proliferation. J. Immunol. 137, 2646–2652 (1986).

77
93. Wheeler, M. L. & Defranco, A. L. Prolonged production of reactive oxygen species in response to B cell receptor stimulation promotes B cell activation and proliferation. J. Immunol. 189, 4405–16 (2012).
94. Circu, M. L. & Aw, T. Y. Reactive oxygen species, cellular redox systems, and apoptosis. Free Radic. Biol. Med. 48, 749–62 (2010).
95. Paiva, C. N. & Bozza, M. T. Are reactive oxygen species always detrimental to pathogens? Antioxid. Redox Signal. 20, 1000–37 (2014).
96. Sauer, H., Wartenberg, M. & Hescheler, J. Reactive oxygen species as intracellular messengers during cell growth and differentiation. Cell. Physiol. Biochem. 11, 173–86 (2001).
97. de Villartay, J.-P., Fischer, A. & Durandy, A. The mechanisms of immune diversification and their disorders. Nat. Rev. Immunol. 3, 962–72 (2003).
98. Vignali, D. a a, Collison, L. W. & Workman, C. J. How regulatory T cells work. Nat. Rev. Immunol. 8, 523–32 (2008).
99. Ouyang, W., Rutz, S., Crellin, N. K., Valdez, P. A. & Hymowitz, S. G. IY29CH04-Ouyang Regulation and Functions of the IL-10 Family of Cytokines in Inflammation and Disease. Annu. Rev. Immunol 29, 71–109 (2011).
100. Ferguson, S. D., Srinivasan, V. M. & Heimberger, A. B. The role of STAT3 in tumor-mediated immune suppression. Journal of Neuro-Oncology (2015). doi:10.1007/s11060-015-1731-3
101. Massagué, J. TGFβ signalling in context. Nat. Rev. Mol. Cell Biol. 13, 616–30 (2012).
102. Lieberman, J. The ABCs of granule-mediated cytotoxicity: new weapons in the arsenal. Nat. Rev. Immunol. 3, 361–370 (2003).
103. Thornton, A. M. & Shevach, E. M. CD4+CD25+ immunoregulatory T cells suppress polyclonal T cell activation in vitro by inhibiting interleukin 2 production. J Exp Med 188, 287–296 (1998).
104. Takahashi, T. et al. Immunologic self-tolerance maintained by CD25+CD4+ naturally anergic and suppressive T cells: induction of autoimmune disease by breaking their anergic/suppressive state. Int. Immunol. 10, 1969–1980 (1998).
105. Josefowicz, S. Z., Lu, L.-F. & Rudensky, A. Y. Regulatory T Cells: Mechanisms of Differentiation and Function. Annu. Rev. Immunol. 30, 531–564 (2012).
106. Vang, K. B. et al. IL-2, -7, and -15, but Not Thymic Stromal Lymphopoeitin, Redundantly Govern CD4+Foxp3+ Regulatory T Cell Development. J. Immunol. 181, 3285–3290 (2008).
107. Burchill, M. a, Yang, J., Vogtenhuber, C., Blazar, B. R. & Farrar, M. A. IL-2 receptor beta-dependent STAT5 activation is required for the development of Foxp3+ regulatory T cells. J. Immunol. 178, 280–90 (2007).

78
108. Gottschalk, R. A., Corse, E. & Allison, J. P. TCR ligand density and affinity determine peripheral induction of Foxp3 in vivo. J. Exp. Med. 207, 1701–11 (2010).
109. Kim, J. M. & Rudensky, A. The role of the transcription factor Foxp3 in the development of regulatory T cells. Immunological Reviews 212, 86–98 (2006).
110. Huang, B. et al. Gr-1+CD115+ immature myeloid suppressor cells mediate the development of tumor-induced T regulatory cells and T-cell anergy in tumor-bearing host. Cancer Res. 66, 1123–1131 (2006).
111. Yang, R. et al. CD80 in immune suppression by mouse ovarian carcinoma-associated Gr-1 +CD11b + myeloid cells. Cancer Res. 66, 6807–6815 (2006).
112. Serafini, P., Mgebroff, S., Noonan, K. & Borrello, I. Myeloid-derived suppressor cells promote cross-tolerance in B-cell lymphoma by expanding regulatory T cells. Cancer Res. 68, 5439–5449 (2008).
113. He, Y., Bei, J., Zeng, H. & Pan, Z. The roles of sepsis-induced myeloid derived suppressor cells in mice corneal , skin and combined transplantation. 34, 8–13 (2016).
114. Rekers, N. V. et al. Beneficial immune effects of myeloid-related proteins in kidney transplant rejection. Am. J. Transplant. n/a–n/a (2015). doi:10.1111/ajt.13634
115. J., S. S. et al. Inducing immune tolerance in clinical kidney transplantation. Am. J. Transplant. 10, 139 (2010).
116. Talmadge, J. E. & Gabrilovich, D. I. History of myeloid-derived suppressor cells. Nat. Rev. Cancer 13, 739–752 (2013).
117. Rose, S., Misharin, A. & Perlman, H. A novel Ly6C/Ly6G-based strategy to analyze the mouse splenic myeloid compartment. Cytom. Part A 81 A, 343–350 (2012).
118. Ochando, J. et al. The mononuclear phagocyte system in organ transplantation. Am. J. Transplant (2015). doi:10.1111/ajt.13627
119. Schwartz, R. H. Costimulation of T lymphocytes: the role of CD28, CTLA-4, and B7/BB1 in interleukin-2 production and immunotherapy. Cell 71, 1065–1068 (1992).
120. Maruyama, K. et al. Inflammation-induced lymphangiogenesis in the cornea arises from CD11b-positive macrophages. J. Clin. Invest. 115, 2363–2372 (2005).
121. Bogdan, C. Nitric oxide synthase in innate and adaptive immunity: An update. Trends in Immunology 36, 161–178 (2015).
122. Anand, P. & Stamler, J. S. Enzymatic mechanisms regulating protein s-nitrosylation: Implications in health and disease. Journal of Molecular Medicine 90, 233–244 (2012).
123. Radi, R. Peroxynitrite, a stealthy biological oxidant. Journal of Biological Chemistry 288, 26464–26472 (2013).
124. Vanin, A. F. Dinitrosyl iron complexes with thiolate ligands: Physico-chemistry,

79
biochemistry and physiology. Nitric Oxide - Biology and Chemistry 21, 1–13 (2009).
125. Mattson, D. L. & Wu, F. Nitric oxide synthase activity and isoforms in rat renal vasculature. Hypertension 35, 337–41 (2000).
126. Eberhardt, W., Plüss, C., Hummel, R. & Pfeilschifter, J. Molecular mechanisms of inducible nitric oxide synthase gene expression by IL-1beta and cAMP in rat mesangial cells. J. Immunol. 160, 4961–4969 (1998).
127. Molon, B. et al. Chemokine nitration prevents intratumoral infiltration of antigen-specific T cells. J. Exp. Med. 208, 1949–62 (2011).
128. Gehad, A. E. et al. Nitric oxide-producing myeloid-derived suppressor cells inhibit vascular E-selectin expression in human squamous cell carcinomas. J. Invest. Dermatol. 132, 2642–51 (2012).
129. Du, C. et al. NOS2 (iNOS) deficiency in kidney donor accelerates allograft loss in a murine model. Am. J. Transplant. 7, 17–26 (2007).
130. Kirk, A. D. et al. Results from a human renal allograft tolerance trial evaluating the humanized CD52-specific monoclonal antibody alemtuzumab (CAMPATH-1H). Transplantation 76, 120–129 (2003).