Embed Size (px)
Citation preview

Analysis of Multi core Performance Degradation of Scientific Applications
Tyler A. Simon, Computer Sciences CorporationJames McGalliard, FEDSIM
Abstract
With the proliferation of large multi-core high performance computing (HPC) systems, application performance is often negatively impacted. This paper provides benchmark results for a representative workload from the Department of Defense (DoD) High Performance Computing Modernization Program. The tests were run on a Cray XT-3 and XT-4 which use dual- and quad-core AMD Opteron microprocessors. We use a combination of synthetic kernel and application benchmarks to examine cache performance, MPI task placement strategies, and compiler optimizations. Our benchmarks show performance behavior similar to that reported in other studies and sites. Dual- and quad- core tests show a run-time performance penalty compared to single-core runs on the same systems. We attribute this performance degradation to a combination of L1 to main memory contention and task placement within the application. Key Words: multicore, benchmark, high performance computing, memory contention, MPI
Concurrency and Computation: Practice and Experience Page 1

1. INTRODUCTION
Generally speaking, core for core application runtimes on large high performance computing (HPC) systems with dual- or quad- core chips are slower than single core chip performance. This paper provides a multi level approach to analyzing application performance on multi-core architectures. The authors present an analysis of the results of a variety of currently used defense applications by examining latencies within the processor, compiler optimizations and the MPI communication layer. We contrast the results with similar studies and synthetic test results. Furthermore, the authors suggest alternatives for addressing the performance loss the “multi-core era” has introduced to the scientific computing community.
The synthetic kernel and application benchmark tests were run at the U.S Army Engineer Research and Development Center, DoD Supercomputer Resource Center (ERDC DSRC) in Vicksburg, Mississippi. The ERDC DSRC is part of the Department of Defense (DoD) High Performance Computing Modernization Program (HPCMP). These tests show performance behavior and challenges similar to those reported in other studies and at other sites, e.g., that contention for memory degrades the performance of multi-core processors – in this case Cray cluster systems using dual- and quad-core AMD processors. Low level memory read/write time measurements using synthetic kernels are consistent with wall-clock run times measured using application software representative of HPCMP science and engineering workloads.
This paper is organized as follows: Section 2 describes the Sapphire and Jade benchmark systems that the authors used. Section 3 reviews a sample of prior studies of multi-core processor performance. Section 4 presents our analysis of Sapphire and Jade test results and some contrasting
results from other sites. Section 5 presents our conclusions.
2. BENCHMARK SYSTEMS
For this study, there were two systems that were upgraded with multi-core AMD processors, a Cray XT3 which went from single-core to dual-core and a Cray XT-4 that went from dual-core to quad-core, both of which are located at the U.S Army ERDC in Vicksburg and as of November 2008 are ranked internationally at 75th and 45th respectively [1]. An overview of each system is provided below.
2.1 Sapphire
The Sapphire system includes the following and is rated at 42.6 Tflops peak performance.● 4,096 2.6-GHz 64-bit Dual-Core AMD-Opteron (8,192 computation cores)● 2GB memory per core● Total Disk Storage 374 TB, Fiber Channel Raid● 3-D torus using a HyperTransport link to a dedicated Cray SeaStar.
Concurrency and Computation: Practice and Experience Page 2
2.2 Jade
The Jade system includes the following and is rated at 72.3 Tflops peak performance.● 2,152 2.1-GHz 64-bit Quad-Core AMD-Opteron (8,608 computation cores)● 2GB memory per core● Total Disk Storage 379 TB, Fiber Channel Raid● 3-D torus using a HyperTransport link to a dedicated Cray SeaStar.
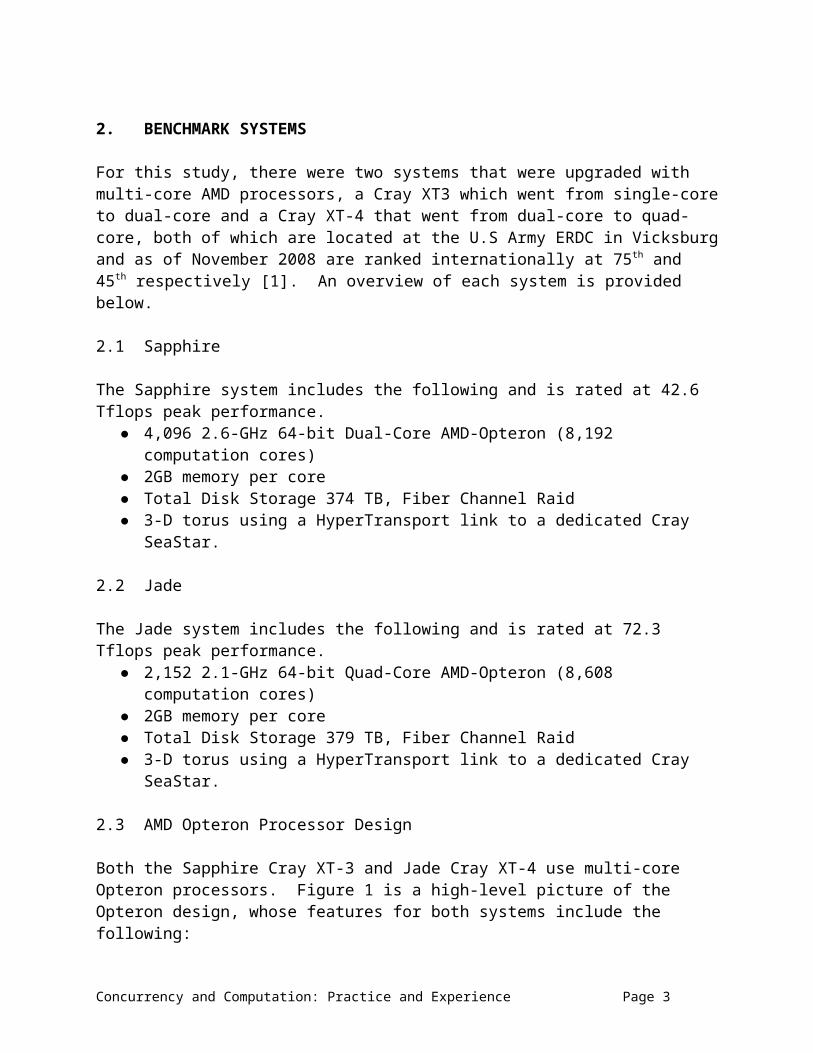
2.3 AMD Opteron Processor Design
Both the Sapphire Cray XT-3 and Jade Cray XT-4 use multi-core Opteron processors. Figure 1 is a high-level picture of the Opteron design, whose features for both systems include the following:
Multiple cores – two for the XT-3 and four for the XT-4 Independent 64KB level 1 (L1) instruction, 64KB L1 data and 1MB L2 caches Shared access paths to main memory off the chip
The benchmark results reported later in the paper demonstrate some of the impacts of these design features.
It is worth noting the following in regards to the AMD Opteron processors. Both the L1 and L2 caches are private to each core, and access to main memory, which may be local to the node or on a remote node in the cluster, is shared by all cores. Further, with the Opteron the L2 cache is treated as an eviction cache, or “victim” cache which means it receives least recently used (LRU) data from L1 and is probed by L1 when there is a local miss. When the data cannot be found in either L1 and then L2, it is copied from main memory into L1. Thus managing main memory to L1 cache bandwidth is important on the Opteron, especially when considering that each core must access main memory independently, i.e., without the help of a shared cache.
Concurrency and Computation: Practice and Experience Page 3

Figure 1. Opteron Design [2]
3. BACKGROUND
The problem of multi-core memory contention has received considerable attention in the literature. In general, our results are consistent with others’. Following are some points from prior studies.
Alam et. al. [3] point out that on the XT3 at Oak Ridge National Laboratory, the contention for the memory link shared by multiple cores limits performance and that communications within a core vs. across multiple cores showed an 8% to 12% benefit. Additionally, they find that appropriate MPI task and memory placement can yield a 25% performance benefit.
Regarding MPI performance on multi-core systems Chai et. al. found that around 50% of messages are intra-node vice inter-node, so performance gains can be seen by focusing on intra-node optimization [4]. Also, Chai suggests that multi-core aware applications and message passing algorithms optimized for data locality can improve performance by up to 70%.
Finally, John Levesque at Cray Inc. reports in [5] that for the NAS benchmarks, the average dual-core degradation was 27%. We compare our NAS kernel results to Levesque’s specific results in Figure 5.
Additional noteworthy information from his paper is that the GAMESS (General Atomic and Molecular Electronic Structure System) code showed a 2% to 3% degradation when running in dual-core mode vs. single-core – one of the application codes that we also tested. Further results show that dual-core performance degradation is directly proportional to degradation in memory bandwidth and that dual core results have observed memory bandwidth almost exactly one-half of single core results for the same tests.
Concurrency and Computation: Practice and Experience Page 4

4. PERFORMANCE ANALYSIS
Prior to our discussion of application runtimes, we will examine the difference between memory latencies as we multiply cores on nodes.
4.1 Opteron Memory Performance
We ran a synthetic kernel that executes a series of memory reads and writes while summing the elapsed time, and iterating over progressively increasing memory stride sizes [6]. The results in Figure 2 show measured performance plateaus corresponding to the size of the Opteron caches.
Figure 2. HPCMP XT3 Memory Stride Benchmark Results
The benchmark reads and writes will occasionally miss in the cache, and memory bandwidth will impact performance when it does so. The results show that running the benchmark on two cores causes an approximate doubling of memory R+W time for strides between 28 and 213 bytes, and less significant but consistent degradation for larger stride sizes.
In Figure 2 the horizontal axis is the memory stride size as a power of 2 and the vertical axis is the memory latency – memory read and write time in nanoseconds.
The red line represents performance of a single copy of the program running on one core of the dual-core Opteron, the green line represents performance when both cores on the same chip are running individual copies of the same memory stride kernel. As stride size increases from 215 (64K, the same size as the L1 cache) to 220 (1 M, the same size as the L2 cache), memory latency
Concurrency and Computation: Practice and Experience Page 5

reflects gradual filling of the L2 cache, followed by a steep jump (latency degradation) when the L2 cache is full. There is significant performance degradation, on the order of doubling latency between 28 and 214 byte strides, comparing the dual- to the single-core data.
The low latency when the code is running in the L1 cache and significant degradation when running dual-core over the same memory stride shows that it is worth focusing on the performance of the L1 cache. Note that the AMD cache hierarchy differs from dual-core Intel chips because its L2 cache is a victim cache. The least recently used (LRU) data is evicted from L1 into L2, then L1 copies from main memory if the data is not found in L2. This underscores the fact that L1 to main memory bandwidth is worth managing for large multi core Opteron installations.
Note: It is an artifact of the benchmark code that access appears to fall off dramatically above about 222 bytes. Actually, the test stops after the code consistently accesses main storage.
Figure 3. Intel Xeon Memory Stride Benchmark ResultsWe compared the XT3 using Opteron processors to a cluster that uses the Intel Xeon chip, which has dual cores that share the L2 cache, as shown in Figure 3. The results are from the JVN Linux Networx cluster at the Army Research Laboratory (ARL) with 2048, 3.6 Ghz dual socket, single core Xeon EM64Ts chips.
In Figure 3 the axes are the same as Figure 2, except that the peak latency is slightly lower (120 nanoseconds vs. 140). As with the Opteron results in Figure 2, two cores have increased latency in comparison to single core when running the synthetic memory stride code. The degraded Xeon two core performance is more pronounced at the stride length that corresponds to the L2
Concurrency and Computation: Practice and Experience Page 6

cache size. There is contention for access to main memory when both cores are running the memory stride kernel.
4.2 Compiler Optimization Memory Performance
We were curious about the impact of compiler optimizations on multi-core performance. In addition to the standard compiler optimization levels, the –O3 optimization automatically blocks and unrolls loops and prefetches data into the cache. Figure 4 shows these results for the PGI compiler on the Sapphire system. The test is the same as in Figures 2 and 3, but block size rather than stride length varies.
In Figure 4 the horizontal and vertical axes are logarithmic scales. The vertical axis is memory latency measured in seconds; the horizontal axis is the size of the blocks written to and read from memory. The green line in the figure shows memory access performance with optimization suppressed (-O0). The red line shows memory access with the aggressive compiler optimization, -O3. –O3 results are significantly faster than –O0, by a factor on average of about 3:1. This is due to managing the L1 cache.
Figure 4. Sapphire XT3 Memory Access Time
Notice that there are performance shifts near the 65K and 1MB block sizes that correspond to the L1 and L2 cache sizes. Once each level of cache fills up and the job starts to access the next level of cache or main storage, performance degrades. Note also that performance improves between the smallest block sizes and about 50,000 bytes. This suggests that as use of the cache increases to a certain point, latency improves. More data is reused from the cache, so average latency drops.
4.3 NAS Kernel Results
Concurrency and Computation: Practice and Experience Page 7

CodeTime Increase for
Dual Core (Levesque)
Time Increase for Dual
Core (Jade)
Delta Jade vs.
Levesque Large
Large Pages
Small Pages
BT 109% 112% 142% 1.266SP 130% 139% 159% 1.141LU 138% 138% 131% 0.952CG 110% 110% 106% 0.966MG 146% 145% 139% 0.956
Figure 5: Comparison of Levesque and Jade NAS Kernel Benchmark Results – Single vs. Dual-Core Performance Degradation
We ran the NAS kernel benchmarks on the XT3 and XT4 - the same tests, Opteron processors and Cray clusters as Levesque et. al. ran (Section 3, [5]). Figure 5 compares Levesque’s results with ours, which were quite close.
Figure 6. Ratios of Single-Core Vs. Dual-Core Performance Metrics
Levesque’s paper proposed a simple model for predicting the performance impact of multi-core performance based on the insight that virtually all degradation is due to contention for memory bandwidth. “[P]redicted dual-core performance across a wide range of memory access patterns is correctly accounted for using the simplest possible model for memory performance – namely, that the effective latency of the memory subsystem and bandwidth+latency for the L2 cache remains the same regardless of how many cores are used, but the main memory bandwidth is cut in half.” Our results, using the same NAS kernels shown in Figure 5 but decomposing
Concurrency and Computation: Practice and Experience Page 8
Ratios of Single-core vs. Dual-core Performance Metrics
0%
10%
20%
30%
40%
50%
60%
70%
BT CG FT LU MG SP
Computational Kernel
Sin
gle
Cor
e Im
prov
emen
t
L1 D Cache to L2 BW
L1 D Cache to Main Memory BW
L2 to Main Memory BW
Mops per Process per core
Runtime

performance into L1/L2, L1/MM, L2/MM, and wall clock run time, support this insight – all elements are strongly correlated with main memory bandwidth. Figure 6 shows this.
4.4 MPI Performance
Prior analysis indicates that two key drivers of multi-core performance are memory bandwidth and message passing – “We observed from the AMD architectural discussion that when excluding messaging performance, the primary source of contention when moving from single core to dual core is memory bandwidth” [5]. We also tested message passing performance, as this section discusses. Our results are consistent with Levesque’s.
We are interested in what effect multi-core chips have on MPI performance. MPI is an open-system standard and various MPI implementations are available, so portability across platforms is simplified. (Contrast MPI with Cray shmem, a proprietary interface that allows for logically shared distributed memory access. Although the hardware specificity of Cray shmem can improve performance compared to the more general MPI interface, the cost can be a more difficult migration to the next generation platform.)
The next series of graphics compare the performance of the Sapphire system and Midnight, a Opteron based Sun Linux cluster at the Arctic Region Supercomputer Center (another DoD HPCMP site). The test shows an average bandwidth from sending a 500MB buffer between ranks in a point to point fashion using mpi_send and mpi_recv.
In all of the following graphs that depict results in three dimensions, the apparent vertical axis represents memory throughput measured in Megabytes per second. There are two apparent horizontal axes, pitched towards the upper left and upper right. These axes represent the MPI rank of the source and destination of an MPI message. (System administrators can rank or label their nodes for use by MPI in any arbitrary fashion. The important point to grasp is that in cells where the source and destination ranks are the same [along the diagonal of the apparent horizontal plane], the MPI message is passed between cores on the same node. As pointed out by [4], intra-node communication is much faster than inter-node communication.)
Throughput is indicated in the graphs both by color (yellow is highest, blue is lowest) and by apparent topographic peaks and valleys. The range of throughputs in each graph is different, but can be interpreted from the legends on either side of the graph. The range of ranks in each graph is also different, but can be interpreted from the labels along the two apparent horizontal axes. In each case, the range of ranks is the number of cores in that test.
Concurrency and Computation: Practice and Experience Page 9

Figure 7: Sapphire MPI Message Throughput by MPI Rank, 8 Cores on 4 Nodes
Figure 7 shows MPI throughput on HPCMP’s Sapphire system using 8 cores on 16 nodes (dual-core processors). Overall, the performance is fairly even and high. There is less than a 10% difference between minimum and maximum throughput. There is some fall-off in throughput where there is off-node communication, e.g., Rank 0 communicating with Rank 7. Throughput is somewhat higher where MPI communication is on the node, i.e., along the diagonal – Rank 0 communicating with Rank 0, Rank 1 communicating with Rank 1, and so on.
Figure 8: Sapphire MPI Message Throughput by MPI Rank, 16 Cores on 8 Nodes
Concurrency and Computation: Practice and Experience Page 10

The Figure 8 results are similar to Figure 7, except that the number of cores and nodes has doubled. This 16 core test has even more consistent message passing performance than the 8 core test. This test was run on Sapphire for 32, 64 and 128 cores, and the results were consistent – high bandwidth across all pairs of MPI ranks, i.e., both intra-node and inter-node performance. We attribute the consistent performance of the Sapphire system to Cray’s design – the Cray SeaStar network mesh and its MPI implementation [7].
Figure 9: Midnight MPI Message Throughput by MPI Rank, 16 Cores on 4 Nodes
Figure 10: Midnight MPI Message Throughput by MPI Rank, 32 Cores on 8 Nodes
Concurrency and Computation: Practice and Experience Page 11

Figure 11: Midnight MPI Message Throughput by MPI Rank, 64 Cores on 16 Nodes
Figure 12: Midnight MPI Message Throughput by MPI Rank, 128 Cores on 32 Nodes
Concurrency and Computation: Practice and Experience Page 12

For contrast, Figures 9 through 12 show results from Midnight, a Linux cluster at the Arctic Region Supercomputer Center. Using more generic, less highly optimized components (compared to Cray) but the same Opteron chips yielded significantly lower and more variable performance. The format of the Midnight graphs is the same as for Sapphire.
Midnight is a Linux cluster system consisting of dual core 2.6 GHz Opteron processors (1432 cores total) (the same processors as the Cray XT3), 4x Infiniband Network Cards on PCI-Express Bus, and the Voltaire Infiniband Interconnect. As the number of cores and nodes increases (Figures 9 - 10 - 11 - 12), overall performance degrades quickly [7].
MidnightCores
MidnightNodes
Min MPI Throughput
Max MPI Throughput
16 4 1000 MB/s 140032 8 500 100064 16 500 850128 32 480 680
There is an immediate, consistent and rapid degradation of MPI throughput as more cores are added to the test. 128-core MPI throughput performance is one half of 16 core performance.There is a pronounced ridge along the diagonal - on node and off node bandwidth can differ by 1/3. One can get 30% better performance by putting the MPI rank on the same node. The difference between intra-node communication and inter-node communication increases as we increase the number of cores. This is common with large multi core-cluster installations.
Midnight is a traditional Linux cluster – not as optimized as the Cray Sapphire. Recalling the Sapphire performance, there was much higher performance and much more consistent performance across the range in number of cores in the test and across pairs of MPI ranks, compared to the much more variable and slower performance of Midnight.
4.5 MPI Rank Reordering
In view of the impact of MPI rank ordering shown in the preceding tests, we also ran tests to change the MPI rank assignments. The default Round Robin assignment of MPI processes to ranks has the effect of spreading processes across multiple nodes, which can dilute spatial reference locality and degrade performance. The SMP MPI option increases reference locality, increases the proportion of intra-core vice inter-core message traffic and so improves performance. Figures 13 and 14 illustrate our results.
Note that the performance improvement is larger for larger numbers of cores. This is consistent with the performance differences between Sapphire and Midnight as the number of cores increased.
Concurrency and Computation: Practice and Experience Page 13
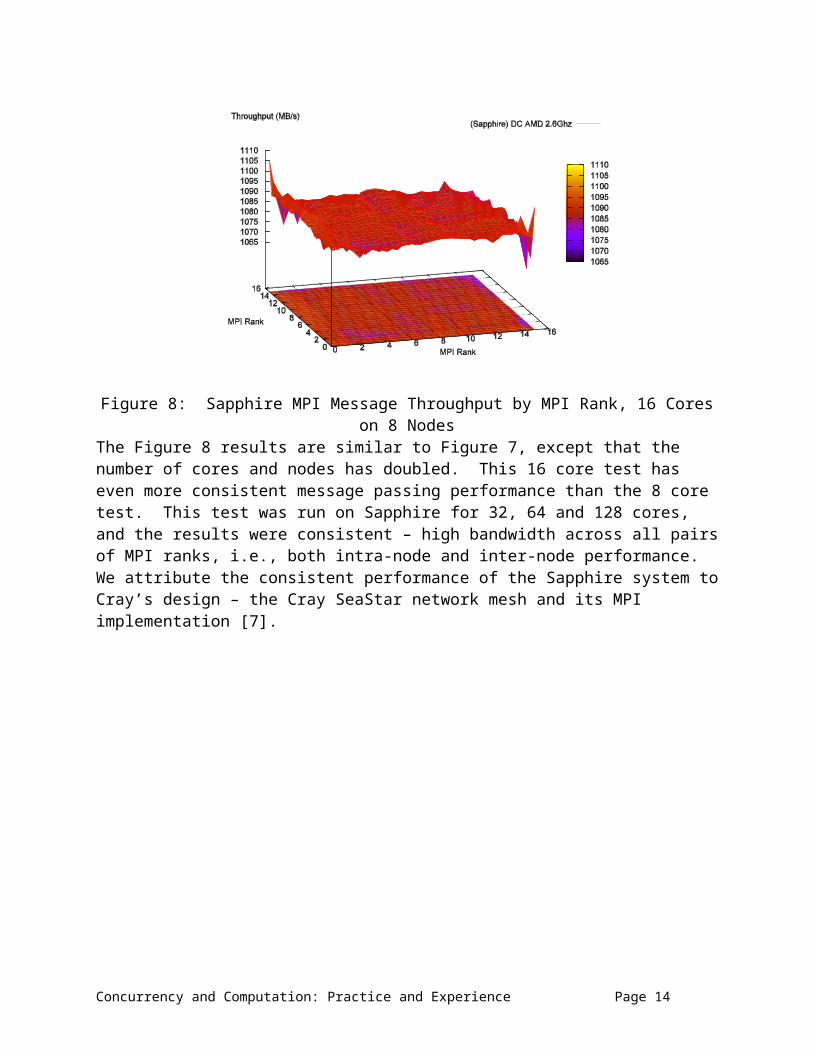
Figure 13. MPI Rank Reorder Method Results
Figure 14. MPI Round Robin Vs. SMP Runtime Ratio
The next section shows benchmark results for complex application software packages. The results of the memory stride kernel (Section 4.1), NAS Kernel (Section 4.3), and MPI (Section 4.4) low level benchmarks predict that memory and message passing will cause dual-core performance degradation for such complex applications, and our results bear out this prediction.
4.6 HPCMP TI Application Benchmark Results
Each year the Department of Defense assesses its computational workload and develops a benchmark suite it uses for acquisitions. The HPCMP releases this package to vendors for benchmarking purposes [8]. Figure 15 provides a short description and references for the codes included in the study.
Concurrency and Computation: Practice and Experience Page 14
XT3 MPICH_RANK_REORDER_METHOD with GAMESS "7 SEP 2006 (R6)"
100
1000
10000
10 100 1000
Cores
Wal
ltim
e (s
econ
ds)
Round Robin (default)
SMP
folded
GAMESS RR vs. SMP Runtime Ratio
10%
12%
14%
16%
18%
32 64 128 256
Cores
Ra
tio
of
Ru
nti
me
R
ed
uc
tio
n
SMP vs RR

Code Acronym Comments & ReferencesAdaptive Mesh
RefinementAMR * Solves 3D Navier-Stokes Equation
Air Vehicles Unstructured
SolverAVUS
* From Air Force Research Laboratory * Finite Volume Unstructured Grid Euler/Navier-Stokes Solver * www.erdc.hpc.mil/hardSoft/Software/avus
Shock Physics CTH* From Sandia National Laboratories * Large deformation, strong shock-wave, solid mechanics code * www.erdc.hpc.mil/hardSoft/Software/cth
General Atomic and Molecular
Electronic Structure System
GAMESS
* Quantum Chemistry, Restricted Hartree-Fock * Communication and Memory Intensive * www.msg.ameslab.gov/gamess/gamess.html *www.erdc.hpc.mil/hardSoft/Software/gamess * Uses dual processes well suited for dual-core processors
Hybrid Coordinate Ocean Model
HYCOM* Ocean General Circulation Model * oceanmodeling.rsmas.miami.edu/hycom/
Improved Concurrent
Electromagnetic Particle-in-Cell
ICEPIC* From Air Force Research Laboratory * Simulates collisionless plasma physics on a Cartesion grid
Out of Core Matrix Solver
OOCORE * Dense Linear Solver * Memory and I/O Intensive
Overflow2 O’FLOW * Computational Fluid Dynamics
Weather Research and Forecast
ModelWRF
* An Advanced Mesoscale Forecast and Data Assimilation System * Scalable across a range of problems and many computer platforms * www.docstoc.com/docs/4903066/THE-WEATHER-RESEARCH-AND-FORECAST-MODEL-(WRF)
Figure 15. HPCMP Benchmark Application Codes
Figure 16. Single Vs. Dual Core Ratios, “Small” XT3 Cores
Concurrency and Computation: Practice and Experience Page 15
XT3 SC/DC Runtime Ratios "small"
0.00
0.50
1.00
1.50
2.00
2.50
32 64 128 256
Cores
Ru
nti
me
Ra
tio
AMR
AVUS
CTH
GAMESS
HYCOM
ICEPIC
OOCORE
O'FlOW
WRF

Figure 17. Single Vs. Dual Core Ratios, “Larger” XT3 Cores
This section shows Sapphire (XT3) and Jade (XT4) results using this HPCMP TI benchmark suite. For figures 16 through 19, the horizontal axis reflects the number of cores running in the test. Each test was run in single- and dual-core modes for Figures 16 and 17. In dual-core mode, both cores on a single chip ran the same benchmark code.
In Figures 18 and 19, each test was run in dual- and quad-core mode. In quad core mode, all four cores on the same processor ran the benchmark code. The vertical axis is the ratio between the dual-core and single core run times (Figures 16 and 17) or quad-core and dual-core run times (Figures 18 and 19).
In Figures 16 and 17 the vertical axis is the ratio between the run times in dual and single core mode. Figure 16 shows results for 32 to 256 cores and Figure 17 shows 256 to 768 cores. For all codes except GAMESS, dual-core mode run times were slower than single-core mode. The GAMESS outlier results were based on a test using the Cray shmem interface between cores, all the other tests used MPI. Cray shmem takes advantage of specific low-level hardware features to achieve better performance. MPI is an open standard that would lose its generality and portability if it used low-level hardware calls. In addition, GAMESS has two types of processing – data server processing and compute processing. These two processes can work in concert on the same node and give better performance than the other codes.
Figures 18 and 19 show results on the XT4 for dual- and quad-core runs.
Concurrency and Computation: Practice and Experience Page 16
XT3 SC/DC Runtime Ratios "larger"
0.00
0.50
1.00
1.50
2.00
256 384 512 768
Cores
Ru
nti
me
Ra
tio
AMR
AVUS
CTH
GAMESS
ICEPIC
OOCORE
O'FLOW
WRF

Figure 18. Single Vs. Dual Core Ratios, “Small” XT4 Cores
Figure 19. Single Vs. Dual Core Ratios, “Larger” XT4 Cores
The consistent performance degradation in multiple single-core vs. dual-core comparisons is not displayed in our dual- vs. quad-core results for these applications. The most important reason is that the dual- and quad- core tests were run one year apart, with upgrades to the XT4 hardware and system software in between the two tests, with significant performance improvements attributable to these upgrades.
Moreover, it’s not unusual to see runtime performance increase as the number of cores increases – a fixed-size problem that can run in parallel on multiple cores will complete faster. Increasing core counts for a fixed-size problem can also improve cache hit rates. As the problem is divided among more and more processors, the working set shrinks and will run more inside the cache(s) and faster.
Concurrency and Computation: Practice and Experience Page 17
XT4 DC/QC Runtime Ratio "Small"
0.60
0.70
0.80
0.90
1.00
1.10
1.20
1.30
1.40
64 128 256 384
Cores
Ru
nti
me R
ati
o AMR
AVUS
CTH
GAMESS
ICEPIC
LAMMPS
XT4 DC/QC Runtime Ratio "Larger"
0.60
0.70
0.80
0.90
1.00
1.10
1.20
1.30
1.40
256 512 1024 1280
Cores
Ru
nti
me R
ati
o AMR
AVUS
CTH
ICEPIC
LAMMPS

In addition, the specific characteristics of the application program impacts performance and can dominate multi-core performance degradation. Closer examination of these codes should reveal the specific reasons for their multi-core performance patterns.
5. CONCLUSIONS
Managing cache bandwidth will lead to increased performance. Task assignment to nodes should take into account spatial data locality. Quad-core+ multi-socket nodes will likely exacerbate the bandwidth contention issue
both to main memory and on-chip. It’s not sufficient to simply run an application on more cores to achieve better
performance. Users should examine their codes and consider restructuring them to increase locality, increase intra-node communications, assign MPI ranks to promote spatial locality, use compiler optimizations and make other multi-core aware changes.
Insight into multi-core specifically and processor and cluster design generally can help application performance. Microprocessor designs such as Intel’s and AMD’s have different application performance implications; cluster designs such as Cray’s and Sun’s also have diverse performance impacts.
New technologies, such as hybrid disruptive heterogeneous multiprocessor environments may help the scientific computing community. Perhaps a combination of a traditional Linux cluster combined with cell processors will provide a more cost-effective solution than systems built solely on commodity microprocessors.
Some of the practical implications of this study are summarized in the following table.
Study Result Practical ImplicationsThe memory stride kernel shows degraded dual-core run times compared to single core. Single vs. dual-core impacts on cache and main memory communications are dominated by memory bandwidth problems.
Where run times are the critical constraint and processor utilization is less critical, running single-core can help performance. The scheduler can support single-core runs.
Compilers can affect multi-core performance differently than single core performance.
Revisit your compiler optimizations or look to upgrade to compilers designed for multi-core environments.
MPI placement can impact performance. It does not automatically take advantage of any local resources, as OpenMP can.
Tuning MPI placement, such as by rank reordering, can help performance of one's application.
Think about using OpenMP because it helps manage resources locally. Local resource management was not necessary when every task was equivalent but it is now.
MPI doesn’t manage tasks, but Open MP can manage user level tasks for you.
Concurrency and Computation: Practice and Experience Page 18

6. REFERENCES
[1] http://www.top500.org/ [6 April 2009]
[2] http://www.amd.com [6 April 2009]
[3] Alam, S.R., Barrett, R.F., Kuehn, J.A., Roth, P.C., and Vetter, J.S. Characterization of Scientific Workloads on Systems with Multi-Core Processors. IEEE International Symposium on Workload Characterization. Oct. 2006, San Jose, CA; 225-236. 1
[4] Chai, L., Gao, Q., and Panda, D.K. Understanding the Impact of Multi-Core Architecture in Cluster Computing: A Case Study with Intel Dual-Core System. International Symposium on Cluster Computing and the Grid, 2007, Rio de Janeiro, Brazil, 2007.
[5] Levesque, J., Larkin, J., Foster, M., Glenski, J., Geissler, G., Whalen, S., Waldecker, B., Carter, J., Skinner, D., He, H., Wasserman, H., Shalf, J., Shan, H., and Strohmaier, E. Understanding and Mitigating Multicore Performance Issues on the AMD Opteron Architecture (March 7, 2007) Lawrence Berkeley National Laboratory. Paper LBNL-62500.
[6] Hennessy, J. and Patterson, D. Computer Architecture: A Quantitative Approach, 2nd Edition. Morgan Kauffmann, San Mateo, California.
[7] Brightwell, Ron, and others. Initial Performance Evaluation of the Cray SeaStar Interconnect, Proceedings of the 13th Symposium on High Performance Interconnects (HOTI’05). IEEE.
[8] http://www.hpcmo.hpc.mil/bizopps/TI/ [6 April 2009]
[9] Chandra, D., Guo, F., Kim, S., and Solihin, Y. Predicting Inter-Thread Cache Contention on a Chip Multi-Processor Architecture, Proc. of International Symposium on High Performance Computer Architecture (HCPA), Feb 2005.
[10] Saulsbury, A., Pong, F., and Nowatzyk, A. Missing the Memory Wall: The Case for Processor/ Memory Integration, 23rd annual International Symposium on Computer Architecture (ISCA’96). ACM, 1996, p. 90.
Concurrency and Computation: Practice and Experience Page 19