Embed Size (px)
Citation preview

Current Issues in Emerging eLearning
Volume 4 | Issue 1 Article 9
7-2-2018
Analysis of Instructional Design JobAnnouncements (2016)Marina RaynisUniversity of Massachusetts Boston
Follow this and additional works at: https://scholarworks.umb.edu/ciee
Part of the Curriculum and Instruction Commons, Higher Education Administration Commons,and the Instructional Media Design Commons
This Article is brought to you for free and open access by ScholarWorks at UMass Boston. It has been accepted for inclusion in Current Issues inEmerging eLearning by an authorized editor of ScholarWorks at UMass Boston. For more information, please contact [email protected].
Recommended CitationRaynis, Marina (2018) "Analysis of Instructional Design Job Announcements (2016)," Current Issues in Emerging eLearning: Vol. 4 : Iss.1 , Article 9.Available at: https://scholarworks.umb.edu/ciee/vol4/iss1/9

166
ANALYSIS OF INSTRUCTIONAL DESIGN
JOB ANNOUNCEMENTS (2016)
Marina Raynis, University of Massachusetts Boston
EXECUTIVE SUMMARY
This study reports on the results of a job announcement analysis of ninety-three
(93) instructional design jobs. Job announcements were collected five (5) times:
three times in September 2016, and twice in October 2016. The job analysis
focused on identifying key responsibilities and qualifications for instructional
designers across the following industries: Corporate, Government / Military,
Health, Higher Education, and Non-Profit. The results are discussed, and also
supported and contrasted with a literature review that includes reports on
surveyed instructional design professionals to compare and contrast with the job
announcements.
The findings of this study are similar to the findings of previous studies:
The preponderance of job postings were from work sites in higher education,
corporate and health sectors. However, prior studies do not categorize health as a
formal industry. I do so in this study, believing that postings within the health
sector may be worth studying as distinct category, due to emerging trends specific
only to the healthcare industry, such as use of particular technology and
requirements for specific certifications. The corporate sector seems to have more
variation in responsibilities and qualifications, while the higher education and
health industries seem to require more specific expertise.
Aside from the main and well-known skills of instructional design
associated with “Design and Development” and “Assessment and Evaluation,”
other categories have emerged that are equally critical for success. These skills
include project management skills, communication and collaboration skills, and
technical skills. Furthermore, some studies strongly suggest the need to
incorporate authentic, real-world design experiences and development projects
into educational programs for instructional designers. Indeed, one major
instructional design principle is to simulate the performance context as
authentically as possible in the learning environment (Dick and Carey, 2014).
PERSONAL SUMMARY
Marina Raynis is a graduate of UMass Boston’s Graduate Program of
Instructional Design, for which program she conducted this study.

167
Marina worked in childhood education before returning to school to focus
on adult education and instructional design. She has 13 years of experience
designing and developing a variety of curricula that span the industries of K-12,
higher education, non-profit, and corporate/technology. Currently, Marina designs
and develops interactive and discovery-based eLearning with a focus on video
production and motion graphic animation.

168
ANALYSIS OF INSTRUCTIONAL DESIGN
JOB ANNOUNCEMENTS (2016)
Marina Raynis, University of Massachusetts Boston
EXECUTIVE SUMMARY ....................................................................................... 166
PERSONAL SUMMARY ......................................................................................... 166
INTRODUCTION ................................................................................................... 168
METHOD ............................................................................................................. 169
LIMITATIONS ...................................................................................................... 173
RESULTS ............................................................................................................. 174
JOB TITLES ..................................................................................................... 174
SKILLS ACROSS ALL INDUSTRIES IDENTIFIED IN JOB ANALYSIS ................. 177
SKILLS BY INDUSTRY: CORPORATE, GOVERNMENT / MILITARY, HEALTH,
HIGHER ED, NON-PROFIT .............................................................................. 184
DISCUSSION ......................................................................................................... 187
CONCLUSIONS AND IMPLICATIONS .................................................................... 189
APPENDIX ............................................................................................................ 193
INTRODUCTION
As the instructional design field continues to grow and branch out in a variety of
directions, the need for clarity on industry-specific instructional design
responsibilities and qualifications continues to grow. Larson and Lockee (2007)
strongly support the need for contextualized education in instructional design.
Sugar, Brown, Daniels, & Hoard (2011) also endorse focusing on specific
industries when they write, “the organizational culture within a corporation is
radically different than that which is found within a college or university setting”
(p. 30).

169
Collection Dates
Monster: 9/09/2016
ATD: 9/15/2016
EDUCAUSE: 9/20/2016
Indeed: 10/02/2016
Indeed (health): 10/25/2016
Furthermore, according to Irlbeck (2011), “IDT is changing as a
profession … one that is embracing a level of technology proficiency, an
awareness of design, and an ability to communicate” (p. 19). Irlbeck (2011) also
believes that developing strong problem solving skills is critical in the education
of ID professionals. ATD Research (2015) also supports the notion that being
able to “think analytically” is an important skill for instructional designers.
Furthermore, ATD Research has reported that strong communication and
collaboration skills are important. Schwier and Wilson (2010) even establish
“professional relationship roles” as a main category in their research. They write:
“One of the first issues to become evident was the importance of being able to build
productive professional relationships with a variety of individuals and in diverse
contexts” (p. 137).
METHOD
For this study, I collected ninety-three (93) job announcements from Monster,
Indeed, ATD, and EDUCAUSE and preserved these postings in their original
format in a Microsoft Word document before analyzing the postings in Microsoft
Excel. I collected job announcements five (5) times: three times in September
2016, and twice in October 2016. By contrast, the research conducted by Sugar,
Brown, Daniels, and Hoard (2011) took seven (7) months to complete and
analyzed 615 job announcements. Kang & Ritzhaupt (2015) took five months to
analyze 400 job announcements.
14.08.6
14.02.2
2.21.13.2
32.3
11.8
4.3
1.1 4.3
1.1
0.0
10.0
20.0
30.0
40.0
50.0
EduCause Monster ATD Indeed
Figure 1: Job Announcement
Source (% of Total Jobs)
Corporate Government / Military
Health Higher Ed
Non-Profit

170
To shed light on the results of this study, I conducted a literature review that
comprised both other studies of instructional design job postings and reports that
analyzed instructional design professionals’ insights regarding current and
necessary skills and responsibilities.
I found the greatest number of jobs posted on Indeed (53.9%), with Indeed
also posting for the widest variety of industries (as shown in Figure 1 in the left
column)1.
Higher Education job postings accounted for 16.1% of total jobs (as shown in
Table 3, below)2. 11.8% of Higher Education job postings came from
EDUCAUSE. Monster and ATD accounted for
16.2% and 18.3% of job postings respectively. Although this study does not
include job postings found in LinkedIn, it is worth noting that I found 162 jobs
listed there, surpassing the number of postings found on Indeed by a factor of
three.
Sugar, Hoard, Brown, &
Daniels (2012) found slightly
different rates in job postings among
industries. Higher rates of job
announcements occurred in the
corporate (64.4%) and higher
education (29.3%) industries, and
lower rates of non-profit (0.8%) and
government (0.1%) jobs. Health was
not a measured industry in the study
conducted by Sugar et al. Ritzhaupt,
Martin, & Daniels (2010) reported
results similar to those of Sugar et al,
with 61% of postings from the
corporate sector, 31.7% from higher
education, 3.9% from government,
and 3.4% from K–12 education. This
study conducted by Ritzhaupt et al did not include “health” and “non-profit” as
measured industries.
1 For ease of reference, Figure 1 above also appears as Appendix C: Figure 1. 2 For ease of reference, Table 3 below also appears as Appendix C: Table 3.
Table 3: Number of Jobs
by Industry
Industry
Total
Number of
Jobs
% of
Total
Jobs
Government
/ Military 4 4.3
Non-Profit 6 6.5
Higher Ed 15 16.1
Corporate 34 36.6
Health 34 36.6

171
For my own study under discussion in this article, I analyzed the jobs
posted under the search terms “instructional designer,” “trainer” and “learning
design.” I also identified job posting through automatic job board
recommendations based on previous searches. In contrast, Sugar, Hoard, Brown,
& Daniels (2012) used additional search terms such as “Curriculum
Designer/Developer,” “eLearning designer /design specialist,” “Human
Performance,” and “Training Developer.” After choosing the ninety-three (93)
job announcements included in this current study, I logged the postings in Excel
before analyzing each. The job log contained information about each job
including the job title, job ID, company, location, geographical region, industry,
salary, and job source (as shown in Appendix A: Table 1).
After logging the job announcements, I analyzed the postings in a separate
Microsoft Excel worksheet using an emergent theme analysis (a process
documented in Appendix B: Table 2). I pasted job announcements into a column
labeled “Skill” (Column D) and analyzed one sentence at a time. As a general
rule, each cell in Column D contained one sentence of the job announcement. I
tagged each item/sentence in each cell with a general, Level 1 category (Column
E), and with a more focused, Level 2 sub-category (Column F). When applicable,
I also applied a Level 3 or 4 category to an item. When one skill had multiple,
applicable categories, I copied and pasted the row, and assigned additional tags to
the skill. I also tagged each item (n = 4,277 items) as a responsibility or
qualification as originally defined by the job announcement. If the item was a
qualification, I also tagged the item as preferred or required.
In order to complete the analysis, I filtered the raw data and sorted
according to its Level 1 and Level 2 categories. After sorting, I identified and
removed duplicates to ensure each job announcement did not count more than
once for any specific category and/or industry. At this point, before counting the
items for each category, I reviewed Level 1 and Level 2 categories and revised
these categories to ensure accuracy and to avoid redundancy before taking final
counts. Subsequently, I counted and separated the data by industry. Finally, I
generated charts and tables based on these counts.
Prior to adopting the analysis methods described above, I attempted to
organize and analyze the data using Google Forms before settling on Microsoft
Excel. These efforts attempted to mimic the Ritzhaupt, Martin, & Daniels (2010)
analysis that used forms developed in Microsoft Access. I developed a google
form to analyze the job announcement, basing my analysis on knowledge, skills,
and abilities identified in Kang & Ritzhaupt (2015). Ultimately, I determined that
this method was insufficient because the very strategy of using a pre-established
form contained two weaknesses: First, a pre-established form did not preserve
verbiage of the original job announcements in a meaningful way. There was no

172
simple way to make the analysis transparent by linking the coding to the original
content. Secondly, a pre-established form did not allow me to identify emerging
trends. Anytime I determined the need to include a new category in the form, I
would have to redesign the form, and I would have to re-enter all previous job
descriptions to make sure the analysis was updated according to the current form.
I repeated this process of revising the form and restarting the coding process three
times before I determined that Microsoft Excel was the best application for my
analysis. For these reasons, I found Microsoft Excel to be the most appropriate
application for my analysis.
Due to the number and variety of charts generated from the data, I have
separated the findings into two separate documents: this report and an appendix.
The report contains some of the most important charts from the appendix, charts
that are central to the discussion, but this report also often refers to charts and
tables included only in the appendix.
Lastly, since one of the purposes of this study was to investigate
instructional design skills across industries as well as across the entire field, I
present most data in two ways. The two subsequent charts (Figure 5a and Figure
5b.1) demonstrate this method: While the details of these charts are not important,
their overall structure represents the dual analyses I provide throughout this study.
One chart (ex. Figure 5a below) finds percentages by dividing counts by the total
number of jobs (93 total jobs). Thus, all items have the same denominator across
all categories.
Figure 5a

173
The other chart (ex. Figure 5b.1 below) divides counts by the total number of jobs
per industry (34 – Corporate, 34 – Health, 15 – Higher Ed, 6 – Non-Profit, 4 –
Government / Military). The denominators in these charts vary across industry.
Therefore, charts that represent skills across the entire field of instructional design
(and include all industries) look like the chart above, Figure 5a, with bars
extending horizontally. Charts that focus on skills by industry look like the chart
on the below, Figure 5b.1, with bars extending vertically and organized by
industry (highlighted in yellow).
LIMITATIONS
This study exhibits a number of limitations. First, the job announcements
analyzed in this study are confined to approximately a 1-month period. Second,
the sample size of the job announcements is relatively small (n = 93).
Furthermore, the time available for the processes of logging, entering, and coding
the job postings limited the number of postings I analyzed.
Other studies with similar goals, such as Sugar, Brown, Daniels, & Hoard
(2011) collected job descriptions for a longer period of time (ex. 7 months) and
also had a panel of instructional design professionals help review and revise the
categories that the researchers identified.
Figure 5b. 1

174
Another limitation of this study arose in the composition of the job
postings. Postings ranged from brief summations to long and detailed
compositions. While most postings contained information about responsibilities
and qualifications, some had either one or the other, but not both. It is also
possible that the number of times a particular qualification or responsibility is
mentioned in a job description is related to a skill emphasis for that particular job.
However, in this study, I counted each job posting only once for each Level 1 and
Level 2 category discussed above. For example, in Figure 5b. 1above,
“Research,”, “Other Skills”, “Learning format or environment,” and “Education,”
“Assessment and Evaluation” are all Level 1 categories. Level 2 categories are
found within each Level 1 category, in table and charts such as Appendix L, M,
and so forth.
Additionally, as noted by Sugar, Hoard, Brown, & Daniels (2012), job
postings reflect idealized descriptions, whereas there is no guarantee that
employers will be able to hire candidates who fit these ideals.
RESULTS
JOB TITLES
The following word cloud (Appendix D: Figure 2a) depicts the frequency of
words occurring in the ninety-three (93) job titles. The words, “Instructional” and
“Designer” occurred in 78.5% and 83.9% of job titles, respectively. Words such
as “Learning,” “Development,” “Specialist,” and “Trainer” occurred in job titles
much less frequently, ranging from frequencies of 9.7% to 12.9%, though the use
of these words in titles remains noteworthy due to the possibility that the presence
of these terms may signify emerging trends.
The term, “Epic” – as used in reference to a proprietary medical records
software -- occurred in 20.6% of thirty-four (34) healthcare jobs examined for this
study. Training on Epic applications has become increasingly important due to
federal mandates in healthcare passed within the American Recovery and
Reinvestment Act of 2009 (111th United States Congress, 2009) focusing on
digital record keeping requirements for private and public healthcare providers.
As Glaze (2015) reports, “[h]ealth care groups using Epic electronic health
records serve 54 percent of patients in the U.S. and 2.5 percent of patients
worldwide, as noted by CEO Judy Faulkner at Epic’s users group meeting in
September (2016).”

175
39.8% of job titles contained only the words “Instructional Designer,” and
an additional 51.6% of jobs contained the words “instructional”, “designer”,
and/or “design”. (For details, see Figure 2b, directly below, also reprinted as
Appendix D: Figure 2b).
Figure 2a: Word Cloud of Job Titles
2.2
1.1
5.4
3.2
7.5
1.1
7.5
21.5
19.4
1.1
3.2
1.1
1.1
2.2
8.6
4.3
9.7
5.4
8.6
11.8
7.5
20.4
1.1
2.2
1.1
3.2
6.5
7.5
2.2
2.2
1.1
1.1
3.2
0.0 10.0 20.0 30.0 40.0 50.0 60.0
Manager, Supervisor, or Director
Online or eLearning
Epic
Senior
Development or Developer
Learning
Specialist or Strategist
Training, Trainer, Instructor, or Educator
Only - Instructional Designer
Instructional, Designer, and/or Design
Figure 2b: Job Title Key Words by Industry (% of Total
Jobs)
Corporate Government / Military Health Higher Ed Non-Profit
176
ATD Research (2015) did its own analysis of instructional design job titles
and found that 21.3% of titles were “Instructional Designer,” but the leading
category of job titles fell under the title of “Other” (36.9%). “Director of
Training, Talent Development, HR” came in third at 11.6%. ATD Research sums
up the varying titles of an instructional designer as follows:
The role of an instructional designer is continuously evolving to meet
industry demands, and may vary further from organization to organization
or by geographic location. The role of an instructional designer may
include designer, facilitator, trainer, writer, innovator, evaluator,
multimedia developer, editor, and most often, project manager. As a
result of these varying duties, instructional designers’ titles may be
different and therefore often not understood or recognized by those
individuals outside the field (p. 6).
Though the term “instructional design” is currently the most popular and
has a long standing history, a popular eLearning blogs such as the eLearning
Coach (Malamed, 2015) and the eLearning Industry (Da Silva, 2016) suggest that
perhaps there is an emergent shift from the term “Instructional Design” to the
term “Learning Experience Design,” often shortened to the term “LX design.”
Whitney Kilgore, PhD, the Chief Academic Officer at iDesign, (Kilgore, 2016),
also supports this notion when she writes on EdSurge:
Instructional designers, like web developers in the ‘90s, historically had
expertise in conveying content through a limited set of tools and
platforms, such as a learning management system (LMS). LX designers, in
contrast, merge design-thinking principles with curriculum development
and the application of emerging technologies to help faculty tailor content
to student behaviors and preferences. It cuts across disciplines and moves
beyond the LMS: LX designers embrace graphic design, multimedia
production, research-based standards and social media. They are partners
to faculty throughout the program and course development process.
Kilgore (2016) points out that the term “Learning Experience Design”
may be more appropriate because it better describes and encompasses current
trends in instructional design. One Higher Ed instructional designer respondent to
an Intentional Futures Report (2016) observed that faculty in his organization do
not have a strong grasp of what instructional design is and think of him (the
instructional designer) as “LMS help” (Report, p. 15). The Intentional Futures
Report identified a lack of faculty buy-in as the #1 barrier to success for
instructional designers working in educational settings. This barrier arises partly
through a “lack of understanding about the instructional designer’s role and
possible contribution” (p. 15). Perhaps abandoning the term “Instructional

177
Design” can help clarify the role of the instructional designer. That said, it is still
challenging to find peer-reviewed, scholarly support for a change in terminology.
Furthermore, when one searches using the term “Learning Experience Designer”
in job boards, more often than not, the search yields jobs labeled “Instructional
Designer.” Within all 93 job titles logged for this study, and among all 200
browsed jobs I reviewed in this study, terms similar or identical to “Learning
Experience Designer” account for only about 10% of job titles on a high-end
estimate. That said, this frequency of occurrence does support the premise that
use of the term “Learning Experience (LX) Design” is an emerging trend.
Irlbeck (2011) writes that there is a learning paradigm shift “from what is
done with the content toward greater awareness of context and process of
learning” (p. 19). She supports this notion by citing Kim, Lee, Merrill, Spector, &
van Merriëbboer (2008) who state that, “[teaching and learning are moving] from
a content-centric perspective to a user-centric perspective” (p. 19). Certainly, it is
empirically evident that the terms “instruction” and “instructional” are content-
focused, whereas the term “learning experience” focuses on the involvement of
the learner/user. While the differences between the concepts of “instructional
design” and “learning experience design” involve more than mere semantics, it
remains to be seen whether a term with the longstanding tradition and history of
“Instructional Design” will itself require redesign.
SKILLS ACROSS ALL INDUSTRIES IDENTIFIED IN JOB ANALYSIS
In this section, I address the general trends across all the industries
identified in the job analysis. When the trends diverged based on industry,
additional information is provided. The section that follows contains in depth
discussion of ID trends within each industry.” At first glance, what strikes the eye
immediately is the similar pattern and proportions of industries within each Level
1 category (Design and Development, Experience, etc...). This suggests to me
that my choice of categories was appropriate since I was able to apply these
categories to my analysis of most of the job descriptions across all industries.
The Level 1 categories are itemized in left hand column of Chart 5a
(below). Each of these Level 1 categories comprises the sub-categories that I
have termed “Level 2 categories”. Therefore, for each Level 1 category, I have
provided a more detailed table enumerating the associated Level 2 categories I
identified through my analysis of job postings. These tables of Level 2 sub-
categories are presented as appendices. For example, the Level 1 category,
“Design and Development,” contains Level 2 sub categories I have itemized in
Appendix R.

178
An analysis of the Level 1 categories of the data showed that across all
industries, 90% or more of job postings identified as necessary responsibilities
and/or qualifications “Design and Development” (98.9%), “Experience” (96.8%),
“Communication and Collaboration” (93.5%), and “Assessment and Evaluation”
(90.3%). Figure 5a, below (and also reprinted as Appendix H: Figure 5a),
provides a graphical representation of the data on this high frequency of reference
these Level 1 categories of responsibility/qualification.
This study also examines the frequency of occurrence of these categories across
one industry at a time. Figure 5b.1, directly below, provides a visualization of
data on the relative valuation of skills by industry. (This figure also appears on
Report, p. 23 as Appendix H: Figure 5b.1). For most industries, the frequency of
reference to these categories averaged 97.2%. However, in the case of postings in
the Government/Military industry, the frequency of reference to the need for
“Experience” was lower (at only 75%), than was the case for all other industries.
while in posting for jobs in the Non-Profit industry requirements for
skills/experience in “Assessment and Evaluation” was lower (at 66.7%) than was
the case among postings for all other industries. Due to the low rates of job
postings from these categories (Government/Military, n = 4; Non-Profit, n = 6),
7.5
12.9
19.4
28.0
28.0
30.1
24.7
31.2
33.3
32.3
34.4
35.5
2.2
3.2
4.3
4.3
4.3
4.3
3.2
4.3
4.3
3.2
4.3
9.7
22.6
21.5
21.5
26.9
31.2
35.5
31.2
33.3
34.4
36.6
36.6
5.4
12.9
9.7
11.8
12.9
12.9
15.1
16.1
15.1
16.1
16.1
16.1
3.2
4.3
4.3
5.4
6.5
5.4
6.5
5.4
4.3
6.5
6.5
6.5
0.0 10.0 20.0 30.0 40.0 50.0 60.0 70.0 80.0 90.0100.0
Research
Teaching / Training / Coaching /…
Other Skills
Knowledge
Learning Format or Environment
Project Management
Education
Technical Skills
Assessment and Evaluation
Communication and Collaboration
Experience
Design and Development
Figure 5a: Industry by Skill (% of Total Jobs)
Corporate Government / Military Health Higher Ed Non-Profit

179
conclusions drawn regarding trends in these industries should be taken with a
grain of salt: However, this provisional finding does suggest the need for further
research in this specific area.
As shown on Figure 5a, the frequency of occurrence for
“Teaching/training” came up low at 52.7% for all industries combined;
nevertheless, Figure 5b.1 shows there is a relatively high standard deviation (𝑥 =
48.8%, = 28.4%) across industries. The percentage of job postings that
mentioned “Teaching/Training /Coaching / Mentoring / Facilitation” as a job
responsibility ranged from 35.3% to 80% across industries. The highest value,
80%, corresponds to the Higher Education industry, a fact which suggests that
these areas of skill/experience constitute primary responsibilities in the Higher Ed
industry. This notion is supported by the Intentional Futures Report (2016) which
states that “training faculty to leverage technology and implement pedagogy
effectively” (p. 3) and “supporting faculty when they run into technical or
instructional challenges” (p. 3) are two of four main categories of responsibility
identified for instructional designers working in higher education. However, in
this UMB report, I have coded these two areas of responsibility differently, using
Level 1 categories such as “Teaching/Training…,” “Technical Skills,” and
20
.6
50
.0
26
.5 33
.3
50
.0
35
.3
61
.8
80
.0
66
.7
52
.9
75
.0
58
.8
60
.0 66
.776
.5
10
0.0
58
.8
73
.3 83
.3
76
.5
10
0.0
73
.5 80
.0
10
0.0
82
.4
10
0.0
85
.3
80
.0
83
.3
67
.6
10
0.0
97
.1
93
.3 10
0.0
85
.3
75
.0 85
.3
10
0.0
83
.391
.2 10
0.0
91
.2
93
.3
66
.7
88
.2
10
0.0
94
.1 10
0.0
10
0.0
94
.1
75
.0
10
0.0
10
0.0
10
0.0
97
.1
10
0.0
10
0.0
10
0.0
10
0.0
0.0
50.0
100.0
Corporate Government /
Military
Health Higher Ed Non-Profit
Figure 5b.1: Skills by Industry (% of Total Industry Category)
Research
Teaching / Training / Coaching / Mentoring / Facilitation
Other Skills
Knowledge
Learning Format or Environment

180
“Knowledge” as well coding these two areas in more detailed, Level 2 categories,
where applicable. Furthermore, the frequency of occurrence of references to
Technical Skills” ranged from 75% (Government/Military) to 100% (Higher Ed)
across industries (𝑥 = 85.8%, = 8.1%).
Intentional Futures (2016) identified two other main categories of
responsibility for instructional designers working in higher education: “Design”
and “Manage” responsibilities (p. 3). These findings align with my own analysis
regarding the main categories of areas of responsibility listed in job postings; I
found that 98.9% of job postings identified “Design and Development” as a main
responsibility or qualification. I also found that 83.9% of postings identified
“Project Management” as a responsibility of the job.
It is worth noting that, within the “Design and Development” category
(represented visually in Appendix R: Figure 14a), “Content Development” was
strongly emphasized among the job postings (89.2%), while “Content Design”
(53.8%), “Maintain, Update, Revise Content” (47.3%), and “Develop Successful
Learning Strategy” (46.2%) each received only moderate emphasis.3 The
Intentional Futures report (2016) parallels my own findings regarding the degree
to which mention of various aspects of strategic planning appear within job
postings. Intention Futures reports that 56.19% of instructional designers find this
skill “very important” (as documented in Appendix, p. 9). However, ATD
Research (2015) values this proficiency slightly higher and ranks abilities to
“[i]dentify appropriate learning approach” (p. 11) as one of the top three key
activities of instructional design. Differences between findings from ADT
Research and Intentional Futures research may reflect differences in the range of
industries each organization serves. ATD Research reports on instructional
design professionals across all industries, whereas Intentional Futures focuses
specifically on instructional design within higher education.
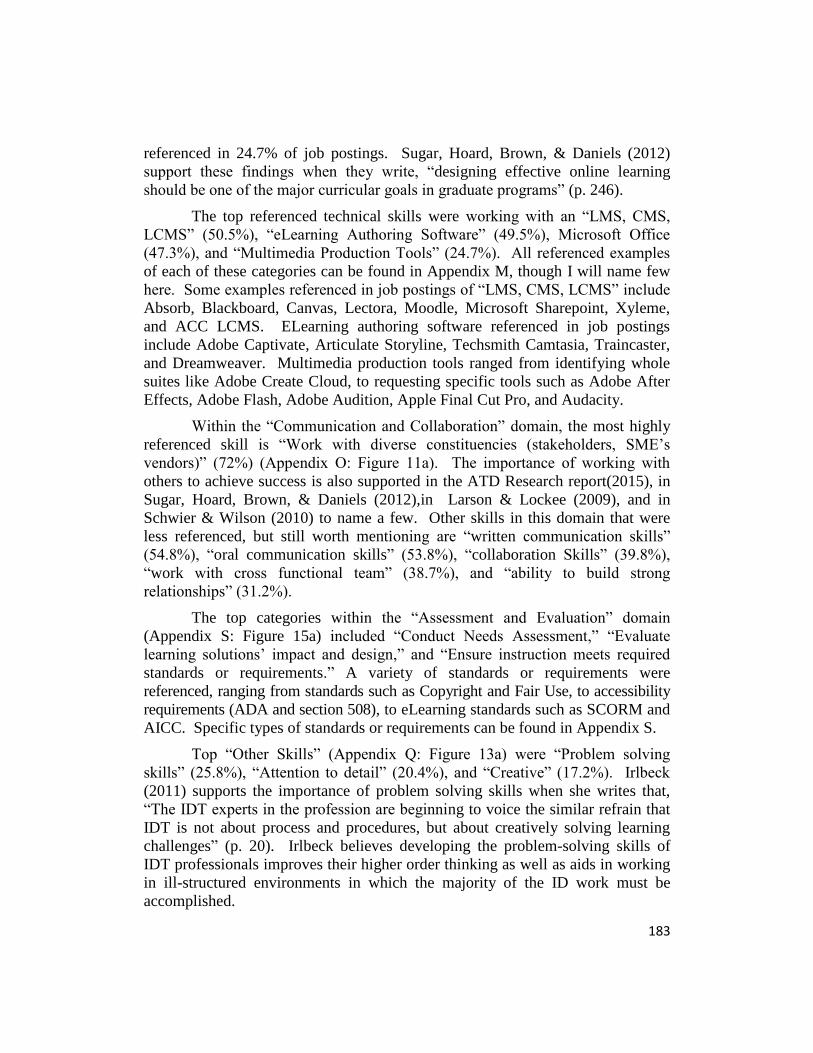
Within the “Project Management” category (tracked in Appendix T:
Figure 16a), top responsibilities and skills include “Lead development of
processes and initiatives” (41.9%), “Project Management Skills” (35.5%),
“Ability to work on multiple projects” (29%), and “Time Management Skills”
(28%).
3 As I interpret my own Level 2 category, “develop successful learning strategy,” I find that this
category describes the same abilities and skills that ADT categorizes as “strategic planning.”
Therefore I assume these terms are synonymous and provide a common denominator for
comparing data sets.

181
52
.9
10
0.0
85
.3
60
.0 66
.7
5.9
5.9
16
.7
11
.8 25
.0
5.9
33
.3
16
.723
.5
50
.0
32
.4
33
.3
33
.3
8.8
0.02.9
2.9 6.7
20
.0
8.8
5.9
5.9
25
.0
23
.5
16
.7
0.0
20.0
40.0
60.0
80.0
100.0
Corporate Government /
Military
Health Higher Ed Non -Profit
Figure 6b: Education by Industry
R: Bachelors Degree P: Bachelors Degree R: Masters Degree P: Masters Degree
R: Licensure P: Licensure R: High School Diploma P: High School Diploma
R: Doctorate (PhD, EDD) P: Doctorate (PhD, EDD) R: Certification P: Certification
R: Associates Degree P: Associates Degree
Additionally, all industries but one had a high percentage of job postings
that required a formal education (91.6%, = 12.25%). The corporate sector was
the outlier (67.6%, as shown on Figure 5b.1). Postings from across all industries
tended to require that applicants hold a Bachelor’s degree, with the occurrence of
this requirement in postings being relatively high compared to most other job
requirements (𝑥 = 73%, = 17.3%). (See Figure 6b below, reprinted also as
Appendix J.) Job postings across all industries also revealed a moderate hiring
preference for holders of Master’s degrees (𝑥 = 27.9%, = 8.6%). That said,
Intentional Futures (2016) reported that 87% of instructional design professionals
surveyed in the higher education industry (n = 853) hold a Master’s degree, while
32% have earned a PhD. Likely this reflects the fact that instructional design
typically is not taught as a discrete discipline / subject matter / college major at
the undergraduate level.
The most commonly referenced knowledge areas were “Instructional
Design Models and Principles” (40.9%) and “Adult Learning Theory” (39.8%).
Knowledge of “Epic applications” (7.5%) were only referenced in postings for
positions in the health industry (Appendix P: Figure 12a).

182
96.8% of job postings referenced the requirement or desire for experience.
Requirements for years of experience ranged somewhat evenly across the first
three categories (Appendix L: Figure 8a). 38.7% of job postings requested 1 – 2
years of experience, 32.4% of job postings required 3-4 years; 32.3% required 5 –
7 years of experience. Health was the only industry that requested 8 – 10 years of
experience. Intentional Futures (2016) reported that “87% of respondents had 3 –
11+ years of experience in instructional design, 57% had 3 – 11+ years of
experience teaching in higher education, and 53% have 3 – 11+ years in
technology development” (p. 3).
These findings from Intentional Futures (2016) support my findings
shown in Figure 8b (Appendix L) that the top requested types of experience were
in “Instructional Design” (67.7%), and a particular “Working Environment”
(60.2%). The top requested working environments ranged by industry, but
provided general information such as “experience in healthcare,” “experience in
finance,” or “experience working in associations.”
Experience in “Instructional Technology and/or technical skills” (35.5%)
received fewer references in the job postings. Similarly, experience in “Teaching
or training” and “Learning format or environment” both received references in
32.3% of job postings. That said, outside the domain of “Experience,” technical
skills and teaching/training were cited most often.
(As documented in Appendix N: Figure 10a) Top Learning environments
referenced were “eLearning or online” and “web-based or virtual” with a
combined 91.7%. “Instructor-led” and “classroom-based” were referenced for a
combined 46.2%. The desire for skills creating “Interactive” content was referenced
9.7 11.8 14.01.1
2.2
17.2 14.0 11.8
4.3
9.72.2
2.2
1.1
2.2 4.3
0.0
5.0
10.0
15.0
20.0
25.0
30.0
35.0
40.0
1 - 2 years 3 - 4 years 5 - 7 years 8 - 10 years
Figure 8a: Years of Experience (% of Total Jobs)
Corporate Government / Military Health Higher Ed Non-Profit
183
referenced in 24.7% of job postings. Sugar, Hoard, Brown, & Daniels (2012)
support these findings when they write, “designing effective online learning
should be one of the major curricular goals in graduate programs” (p. 246).
The top referenced technical skills were working with an “LMS, CMS,
LCMS” (50.5%), “eLearning Authoring Software” (49.5%), Microsoft Office
(47.3%), and “Multimedia Production Tools” (24.7%). All referenced examples
of each of these categories can be found in Appendix M, though I will name few
here. Some examples referenced in job postings of “LMS, CMS, LCMS” include
Absorb, Blackboard, Canvas, Lectora, Moodle, Microsoft Sharepoint, Xyleme,
and ACC LCMS. ELearning authoring software referenced in job postings
include Adobe Captivate, Articulate Storyline, Techsmith Camtasia, Traincaster,
and Dreamweaver. Multimedia production tools ranged from identifying whole
suites like Adobe Create Cloud, to requesting specific tools such as Adobe After
Effects, Adobe Flash, Adobe Audition, Apple Final Cut Pro, and Audacity.
Within the “Communication and Collaboration” domain, the most highly
referenced skill is “Work with diverse constituencies (stakeholders, SME’s
vendors)” (72%) (Appendix O: Figure 11a). The importance of working with
others to achieve success is also supported in the ATD Research report(2015), in
Sugar, Hoard, Brown, & Daniels (2012),in Larson & Lockee (2009), and in
Schwier & Wilson (2010) to name a few. Other skills in this domain that were
less referenced, but still worth mentioning are “written communication skills”
(54.8%), “oral communication skills” (53.8%), “collaboration Skills” (39.8%),
“work with cross functional team” (38.7%), and “ability to build strong
relationships” (31.2%).
The top categories within the “Assessment and Evaluation” domain
(Appendix S: Figure 15a) included “Conduct Needs Assessment,” “Evaluate
learning solutions’ impact and design,” and “Ensure instruction meets required
standards or requirements.” A variety of standards or requirements were
referenced, ranging from standards such as Copyright and Fair Use, to accessibility
requirements (ADA and section 508), to eLearning standards such as SCORM and
AICC. Specific types of standards or requirements can be found in Appendix S.
Top “Other Skills” (Appendix Q: Figure 13a) were “Problem solving
skills” (25.8%), “Attention to detail” (20.4%), and “Creative” (17.2%). Irlbeck
(2011) supports the importance of problem solving skills when she writes that,
“The IDT experts in the profession are beginning to voice the similar refrain that
IDT is not about process and procedures, but about creatively solving learning
challenges” (p. 20). Irlbeck believes developing the problem-solving skills of
IDT professionals improves their higher order thinking as well as aids in working
in ill-structured environments in which the majority of the ID work must be
accomplished.

184
SKILLS BY INDUSTRY: CORPORATE, GOVERNMENT / MILITARY, HEALTH,
HIGHER ED, NON-PROFIT
Corporate (34 total jobs). The corporate industry placed the most
emphasis on “Design and Development” (97.1%), “Experience” (94.1%), and
“Assessment and Evaluation” (91.2%) (Appendix H: Figure 5b.1).
The corporate industry also strongly emphasized, though to a slightly
lesser degree, “Communication and Collaboration” (88.2%), “Technical Skills”
(85.3%), and “Project Management” (82.4%) as necessary competencies for work
(Appendix H: Figure 5b.1).
Furthermore, it is worth noting that 76.5% of corporate jobs mentioned a
desired type of “Learning Format or Environment.” (Specific types can be found
in Appendix N: Figures 10a and 10b.) Additionally, though 76.5% of corporate
job postings identified certain “Knowledge” as valuable in an instructional design
candidate, slightly fewer job postings mentioned a formal “Education” (67.6%)
requirement or preference. Larson and Lockee (2010) found that the largest
variation in instructional design practice and competency requirements occurs in
the corporate environment. This is supported by the findings of my study; I found
20
.6
50
.0
26
.5 33
.3
50
.0
35
.3
61
.8
80
.0
66
.7
52
.9
75
.0
58
.8
60
.0 66
.776
.5
10
0.0
58
.8
73
.3 83
.3
76
.5
10
0.0
73
.5 80
.0
10
0.0
82
.4
10
0.0
85
.3
80
.0
83
.3
67
.6
10
0.0
97
.1
93
.3 10
0.0
85
.3
75
.0 85
.3
10
0.0
83
.391
.2 10
0.0
91
.2
93
.3
66
.7
88
.2 10
0.0
94
.1 10
0.0
10
0.0
94
.1
75
.0
10
0.0
10
0.0
10
0.0
97
.1
10
0.0
10
0.0
10
0.0
10
0.0
0.0
50.0
100.0
Corporate Government / Military Health Higher Ed Non-Profit
Figure 5b.1: Skills by Industry (% of Total Industry Category)
Research Teaching / Training / Coaching / Mentoring / Facilitation
Other Skills Knowledge
Learning Format or Environment Project Management
Education Technical Skills
Assessment and Evaluation Communication and Collaboration
Experience Design and Development

185
that “Education” requirements in the corporate setting (67.6%) are the lowest
across all industries. Furthermore, the corporate sector is the only sector in which
“Knowledge” (76.5%) was emphasized more than “Education” (67.6%) indicating
that corporate industries are more likely to accept alternatives for formal
education/degrees if the candidate has developed and demonstrated skills,
expertise, or experience.
Among all sectors studied, corporate industries placed the least emphasis
on “Other Skills” (52.9%), “Teaching/Training/Coaching/Mentoring/Facilitation”
(35.3%), and “Research” (20.6%).
Higher Education (15 total jobs). The Higher Education industry also
placed strong emphasis on “Design and Development” (100%), “Experience”
(100%), and “Assessment and Evaluation” (93.3%) (Appendix H: Figure 5b.1).
In slight contrast to the corporate industry, a higher percentage of higher
education job postings included requirements related to “Education” (93.3%),
“Technical Skills” (100%), and “Communication and Collaboration” (100%).
Within the category of “Education,” Higher Education was the only
industry that required (6.7%) or preferred (20%) a doctorate degree (PhD, EdD)
(Appendix J: Figure 6b).
In line with the corporate industry, higher education job postings also
moderately emphasized “Knowledge” (73.3%), “Learning Format or
Environment” (80%), and “Project Management” (80%).
Additionally, 80% of higher education job postings stated the need for
“Teaching/Training…” as a competency as opposed to the 35.3% of job postings
from the corporate industry which listed “Teaching/Training” as a primary
responsibility. This is in line with findings from the Intentional Futures (2016)
report that mentioned teaching/training as one of the main responsibilities of ID’s
in the higher education field.
The higher education industry placed the least emphasis on “Other Skills”
(60%) and on “Research” (33.3%). These results are similar to my findings
regarding postings from the corporate industry on these categories.
Health (34 total jobs). Overall, requirements listed in the health industry
job postings have a great deal of congruence with the requirements listed in
higher education job postings. In line with corporate and higher education job
postings, the health industry also placed strong emphasis on “Design and
Development” (100%), “Experience” (100%), and “Assessment and Evaluation”
(91.2%) (Appendix H: Figure 5b.1).

186
Furthermore, a high percentage of Health Industry job postings also
valued “Communication and Collaboration” (94.1%) and “Education” (97.1 %),
mirroring trends within postings for ID jobs in the higher education industry.
Despite the high percentage of postings requiring “Education,” only 58.8% of job
postings in the health industry identified “Knowledge” as a necessary competency
(Appendix H: Figure 5b.1). Upon close inspection of the “Knowledge” and
“Education” domains (Appendix P: Figure 12b; Appendix J: Figure 6b
respectively), one sees that health job postings referenced instructional design
models and adult learning theory less because they required more certifications
than other industries (Appendix J: Figure 6b), particularly, health-related
certifications.
Compared to the Health industry, a higher percentage of job postings from
the Government/Military sector (25%) referenced a preference for certifications;
however, the small sample size of the Government/Military industry (n = 4)
precludes generalizing findings. In contrast, the Health and Corporate industries
(n = 34 each) both had required certification listings (5.9% and 8.8%,
respectively) and preferred certification listings (23.5% and 5.9%, respectively).
Examples of the types of certifications can be found in Appendix J (p. 18). In
general, the Corporate and Health industries requested the most and widest variety
in certifications. These certifications ranged from training certifications such as
the CPLP and SHRM, to industry-specific certifications such as Epic (within the
health industry).
85.3% of job postings within the health industry required “Technical
Skills,” a rate less than higher education (100%), but similar to the rate of
occurrence in postings for the corporate sector. Similar to the higher education
and corporate industries, the health industry also placed moderate emphasis on
certain kinds of “Learning Format or Environment” (73.5%) as well as on
“Project Management” (85.3%).
Among all industries, the health industry placed the least emphasis on
“Teaching/Training” (61.8%), “Knowledge” (58.8%), “Other Skills” (58.8%), and
“Research” (26.5%). Similarly, the corporate and higher education industries
placed relatively little emphasis on these categories.
Government/Military (4 total jobs). Due to the low number of job
postings in this category, it is difficult to analyze this industry properly. That
said, all four jobs in this industry required “Design and Development,”
“Communication and Collaboration,” and “Assessment and Evaluation,”
reflecting findings similar to postings from the other industries. Similar to all
industries except corporate, 100% of government/military jobs also identified
“Education” requirements. Higher than all industries (with some exceptions in

187
non-profit), 100% of government/military job postings listed “Project
Management,” “Knowledge,” and “Learning Format or Environment” to be of
importance as well.
The government/military industry placed moderate emphasis (75%) on
“Other Skills”, “Technical Skills,” and “Experience.”
The government/military industry placed the least emphasis of all
industries on “Research” (50%), and “Teaching/Training” (0%).
Non-Profit (6 total jobs). Due to the low number of job postings in this
category, it is difficult to analyze this industry properly. That said, the non-profit
industry had the most congruence with the higher education industry across
categories except in “Learning Format or Environment” (100%) where it scored
higher. The non-profit industry also differed from the higher education industry
in the categories of “Assessment and Evaluation” (66.7%) and “Technical Skills”
(83.3%) where it scored lower.
DISCUSSION
In line with the previous studies cited above, I will discuss job posting trends in
the corporate and higher education industries, but I will also discuss the emerging
needs in the health industry, a sector not addressed in the previous studies I have
cited.
Sugar, Brown, Daniels, & Hoard (2011) observed that differences between
the higher education and corporate industries can be distinguished readily. The
researchers write that “instructional designers at higher education settings focus
on identifying alternative solutions for a particular course whereas instructional
designers within a corporate training setting are more customer-oriented” (p. 30).
The researchers also write that differences between the higher education
and corporate sectors extend further into technical skills involving the use of
authoring tools such as Captivate and Articulate are more prevalent in the
corporate industry, whereas managing a LCMS is more prevalent in higher
education. This current study supports these findings with 58.8% of job postings
in the corporate industry requiring proficiency in eLearning authoring software in
comparison to the 33.3% of posting in higher education listing such a
requirement. Furthermore, this study also confirms trends in LMS/LCMS/CMS
competencies, requested by 73.3% of jobs in higher education, but only 41.2% in
corporate. Lastly, my study finds that the health industry has a need for both
LMS expertise (41.2%) and eLearning authoring software skills (47.1%).

188
ATD Research (2015) notes that “the challenges faced by instructional
designers are less about technology and more about serving the multitude of
varied learners, as well as maintaining momentum and a relationship with the
subject matter expert” (p. 5). Yet, consider findings from a question posed by
Intentional Futures (2016) to instructional design professionals in higher
education inquiring regarding the importance of certain skills/expertise in their
current role: The Intentional Futures study reports that 82.29% of respondents
indicated that “learning new technologies” is “very important” (Appendix, p. 9).
Kim, et al. (2008) suggests that “[a]t the master’s level, the emphasis should shift
from training students to be users of instructional technology to preparing them to
manage, supervise, and inspire those who use instructional technology,” as cited
by Irlbeck (2011, p. 21).
Schwier and Wilson (2010) also investigated roles undertaken by
instructional designers in higher education. These roles focused on four main
areas: (1) Professional Relationship Roles, (2) Project Roles, (3) Institutional
Roles, and (4) Teaching and Learning Roles. While the title of the study was
Unconventional Roles and Activities Identified by Instructional Designers, the
researchers found that many of the responsibilities reported were still generally
considered to be within the greater realm of instructional design. Though the
researchers concluded that “instructional designers are expected to have a wider
range of skills and abilities than are typically taught in instructional design
programs,” (p. 145) the researchers also stated that, “an interesting speculation we
drew from this investigation was that practitioners of instructional design might
be carrying unrealistically narrow definitions of their roles into their careers” (p.
145).
While it is no surprise that “Design and Development” or “Assessment
and Evaluation” are part of instructional designers’ responsibilities, categories
that have shown themselves to be equally important are “Communication and
Collaboration,” “Project Management,” and “Technical Skills.” Intentional
Futures (2016) also reported that 75.37% of respondents reported that “project
management” is “very important” (Appendix, p. 9) and 73.03% of respondents
“manage projects” at least once a day (Appendix, p. 8). Sugar, Brown, Daniels, &
Hoard (2011) support the notion of the importance of communication and
collaboration skills, noting several other studies that drew this conclusion as well.
They write, “It is essential that instructional designers and technologists
successfully work closely with others on a team and collaborate with clients and
subject-matter experts” (p. 245). The researchers believe that identifying ways to
“encourage and cultivate” (p. 245) collaboration among instructional design
students is “something further to explore” (p. 245)

189
Experience was also highly valued by all industries. Types of experience
ranged from general instructional design and technology foundational knowledge
to particular industry experience. Larson and Lockee (2009) offered a variety of
educational solutions to provide this type of qualification to students to
contextualize their education for different career environments. Julian (2001)
writes, “because the field of ID has become so rich and varied in terms of settings
in which it is practiced, we can no longer discuss the profession without
considerations of the environment of practice” (as cited in Larson and Lockee,
2009, p. 2). The researchers emphasize the importance of incorporating authentic,
relevant, real-world experiences.
While “Teaching and Training” seems to be a responsibility more
important in the higher education and health industries than in the corporate
sector, it still seems to be particularly important overall because some
instructional designers believe that “their position is neither understood nor
respected” (Schwier and Wilson, 2010, p. 141). Schwier and Wilson further state
that, “In order to promote or raise the profile of instructional design, practitioners
are required to educate colleagues about the practices and contributions of
instructional design” (p. 141).
CONCLUSIONS AND IMPLICATIONS
Schwier and Wilson (2010) write that “[w]hile there is little likelihood that
instructional design programs will be able to directly address everything that a
new practitioner needs, we suspect that programs that emphasize experiential
learning will be successful in introducing instructional designers to authentic
problems and contexts and help new practitioners begin to understand the rich and
complex careers they are entering” (p. 145). Irlbeck (2011) further supports this
point by referencing Jonassen (as cited by Ertmer and Stepich (2005)) when
stating that, “ID is a complex, ill-defined skill that is largely (perhaps entirely)
dependent on the context in which it is done” (p. 19). Though focusing
educational programs on specific industries can educate students on the practices
of particular industries, it is also important for students to experience working in
different industries. Instructional design students may not know which sector
they prefer at the start of their education, but they may be able to choose one once
they have some working experience in each.
Sugar, Brown, Daniels, & Hoard (2011) concluded (from a study that
investigated multimedia production knowledge and skills required of instructional
design professionals in higher education) that it is important for professionals to
be educated about overall multimedia production skills and how these skills
interrelate to their set of instructional design skills. The researchers further

190
suggest that case studies that investigate how instructional designers could
effectively balance multimedia production and instructional design skills should
be developed and used as “instructional tools to teach novice instructional
designers best practices in integrating multimedia production skills within an
overall instructional design project” (p. 41).
This idea of experiential learning is further supported by Larson and
Lockee (2009) who discuss methods for preparing instructional designers for
different career environments. They support the need for contextualized
instruction such as case studies, professional development workshops, and on-
and off- campus opportunities for assistantships and internships, as well as
“participation in research communities of practice throughout the student’s
program of study” (p. 9) and “a tradition of mentoring faculty-to-faculty and
faculty-to-student” (p. 9).
Lastly, instructional design portfolios can replace some experience
requirements to demonstrate work ability. Portfolios were barely mentioned in
job descriptions or in the research literature. Nevertheless, it appears to me that it
is important for instructional design students to develop portfolios that
demonstrate their work product and ability, although this need has gone largely
unnoticed. My own job searches suggest that portfolios are required widely by
employers although employer do not often put this requirement into their job
postings. Some employers have said (to their applicants) that they won’t even
look at applications without review of a portfolio. Students may find it helpful to
be provided with formal professional development workshops that help students
set up their own websites or online portfolios.

191
REFERENCES
111th United States Congress. (2009, February 17). U.S. Government Publishing
Office. Retrieved November 15, 2016, from American Recovery and
Reinvestment Act of 2009: https://www.gpo.gov/fdsys/pkg/BILLS-
111hr1enr/pdf/BILLS-111hr1enr.pdf
ATD Research, IACET, and Rothwell and Associates. (2015). Skills, Challenges,
and Trends in Instructional Design. Alexandria, VA: ASTD DBA
Association for Talent Development. Retrieved October 31, 2016, from
https://www.td.org/Publications/Research-Reports/2015/Skills-
Challenges-and-Trends-in-Instructional-Design
Carey, J., Carey, L., & Dick, W. (2014). The Systematic Design of Instruction (8th
ed.). Upper Saddle River, N.J.: Pearson.
Da Silva, C. (2016, September 14). Transforming From Instructional Design To
Learning Experience Design. Retrieved November 21, 2016, from
https://elearningindustry.com: https://elearningindustry.com/instructional-
design-learning-experience-design
Ertmer, P., & Stephich, D. (2005). Instructional design expertise: How will we
know it when we see it? Educational Technology, 45(6), 36-43.
Glaze, J. (2015, January 6). Epic Systems draws on literature greats for its next
expansion. Retrieved November 21, 2016, from Wisconsin State Journal:
http://host.madison.com/news/local/govt-and-politics/epic-systems-draws-
on-literature-greats-for-its-next-expansion/article_4d1cf67c-2abf-5cfd-
8ce1-2da60ed84194.html
IBSTIPI. (2012). Instructional design Competencies. International Board of
Standards for Training, Performance, and Instruction. Retrieved
November 28, 2016, from
https://www.scribd.com/document/240565112/IBSTPI-Competencies-
2012
Intentional Futures. (2016). Instructional Design in Higher Education. Seattle,
WA: Intentional Futures. Retrieved November 1, 2016, from
http://intentionalfutures.com/reports/instructional_design/#
Irlbeck, S. (2011). Educating for an Instructional Design and Technology Future.
The Journal of Applied Instructional Design, 1(2), 19-23.

192
Julian, M. (2001). Learning in action: The professional preparation of
instructional designers. Dissertation Abstracts International, 62, 136.
Kang, Y., & Ritzhaupt, A. D. (2015). A Job Announcement Analysis of
Educational Technology Professional Positions: Knowledge, Skills, and
Abilities. Journal of Educational Technology Systems, 43(3), 231-256.
doi:10.1177/0047239515570572
Kilgore, W. (2016, June 20). UX to LX: The Rise of Learner Experience Design.
Retrieved November 21, 2016, from EdSurge News:
https://www.edsurge.com/news/2016-06-20-ux-to-lx-the-rise-of-learner-
experience-design
Kim, C., Lee, J., Merril, M., Spector, J., & Van Merrienboer, J. (2008).
Foundations for the Future. In J. Spector, M. Merrill, J. Van Merrienboer,
& M. Driscoll, Handbook of Research on Educational Communications
and Technology (3rd ed., pp. 807-815). New York, NY: Taylor & Francis.
Larson, M. B., & Lockee, B. B. (2009). Preparing Instructional Designers for
Different Career Environments: A Case Study. Educational Technology
Research Development, 57, 1-24. doi:10.1007/s11423-006-9031-4
Malamed, C. (2015, May 31). Instructional Design Needs A New Name!
Retrieved November 21, 2016, from The eLearning Coach:
http://theelearningcoach.com/elearning_design/isd/new-name-for-id/
Ritzhaupt, A., Martin, F., & Daniels, K. (2010). Multimedia Competencies for an
Educational Technologist: A Survey of Professionals and Job
Announcement Analysis. Journal of Educational Multimedia and
Hypermedia, 19(4), 421-449.
Schwier, R. A., & Wilson, J. R. (2010). Unconventional Roles and Activities
Identified by Instructional Designers. Contemporary Educational
Technology, 1(2), 134-147.
Sugar, W., Brown, A., Daniels, L., & Hoard, B. (2011). Instructional Design and
Technology professionals in higher education: Multimedia production
knowledge and skills identified from a Delphi Study. The Journal of
Applied Instructional Design, 1(2), 30-46.
Sugar, W., Hoard, B., Brown, A., & Daniels, L. (2012). Identifying Multimedia
Production Competencies and Skills of Instructional Design and
Technology Professionals: An Analysis of Recent Job Postings. Journal of
Educational Technology Systems, 40(3), 227-249.
doi:http://dx.doi.org/10.2190/ET.40.3.b

193
Appendix
Section Tables and Figures Page #
A Job Log Table 1: Job Log 195
B Job Analysis – Raw Data Table 2: Example of raw data 196
C Announcement Sources Figure 1: Announcement Sources 197
Table 3: Number of Jobs by Industry 197
D Job Titles Overview Figure 2a: Word Cloud of Job Titles 198
Figure 2b: Job Title Key Words by Industry 198
E Job Titles by Region by Industry Figure 3a: Job Title Key Words by Region by Industry (Part 1) 199
Figure 3b: Job Title Key Words by Region by Industry (Part 2) 200
F Job Industry by Region Figure 4a: Job Industry by Region 201
G Job Region by Industry Figure 4b: Job Region by Industry 202
H Job Analysis – Level 1 Figure 5a: Industry by Skill 203
Figure 5b.1: Skill by Industry 204
Figure 5b.2: Skill by Industry (Upper Quartile) 205
I Job Analysis – Level 2 Figure 5c.1: Industry by Skill 206
Figure 5c.2: Industry by Skill (Cont’d) 207
Figure 5c.3: Industry by Skill (Cont’d) 208
J Preferred and Required Education Figure 6a: Industry by Required and Preferred Degrees 209
Figure 6b: Education by Industry 210
K Top Preferred and Required Skills Figure 7: Required and Preferred Qualifications 211
L Experience Figure 8a: Years of Experience 212
Figure 8b: Experience in… 212
Figure 8c: Experience in…. by Industry 213
M Top Technical Skills Figure 9a: Industry by Technical Skills 214
Figure 9b: Technical skills by Industry 215
Figure 9c: Examples of Software Supporting Technical Skills 216

194
N Learning Format or Environment Figure 10a: Learning Format or Environment 217
Figure 10b: Learning Format or Environment by Industry 217
O Communication and Collaboration (Level 2) Figure 11a: Communication and Collaboration 218
Figure 11b: Communication and Collaboration by Industry 218
P Knowledge (Level 2) Figure 12a: Knowledge 219
Figure 12b: Knowledge by Industry 219
Q Other Skills (Level 2) Figure 13a: Other Skills 220
Figure 13b: Other Skills by Industry 220
R Design and Development (Level 2) Figure 14a: Design and Development 221
Figure 14b: Design and Development by Industry 221
S Assessment and Evaluation (Level 2) Figure 15a: Assessment and Evaluation 222
Figure 15b: Assessment and Evaluation by Industry 222
T Project Management (Level 2) Figure 16a: Project Management 223
Figure 16b: Project Management by Industry 223

195
Table 1: Job Log
Table 1: Ninety-three (93) job announcements were collected from Monster, Indeed, ATD,
and EDUCAUSE and preserved in their original format in a Microsoft Word document. The
jobs were discovered using the search term “instructional designer”. Afterwards, the ninety-
three (93) chosen announcements were logged in Excel before they were analyzed. The job
log contains information about the job such as the job title, job ID, company, location,
geographical region, industry, salary, and job source.
APPENDIX A

196
Table 2: After the job announcements were logged, they were analyzed in a separate
Excel worksheet. Each job announcement was pasted into a column labeled “Skill”
(Column D) and analyzed one sentence at a time. As a general rule, each cell in Column
D contains one sentence of the job announcement. Each item/sentence in each cell was
tagged with a general, Level 1 category (Column E), and with a more focused, Level 2
sub-category (Column F). When applicable, a Level 3 or 4 category was also applied to
an item. When one skill had multiple, applicable categories, the row was copied and
pasted, and given additional tags. Each item was also tagged as a responsibility or
qualification as originally defined by the job announcement. If the item was a
qualification, it was also tagged as preferred or required.
Table 2: Job Analysis – Example of Raw Data
APPENDIX B

197
Industry Total Number of Jobs % of Total Jobs
Government / Military 4 4.3
Non-Profit 6 6.5
Higher Ed 15 16.1
Corporate 34 36.6
Health 34 36.6
14.0
8.6
14.0
2.2
2.21.13.2
32.3
11.8
4.3
1.1 4.3
1.1
0.0
10.0
20.0
30.0
40.0
50.0
EduCause Monster ATD Indeed
Figure 1: Job Announcement Source (% of Total Jobs)
Corporate Government / Military Health Higher Ed Non-Profit
Figure 1: This chart compares numbers of jobs
by their industries and the job board that they
were sourced from.
Indeed sourced the most jobs by a considerable
margin.
Table 3: Number of Jobs by Industry
Table 3: This chart illustrates the number of jobs announced by
industry. The Health and Corporate sectors announced the most
jobs (36.6% each), while the Higher Education industry announced
fewer jobs (16.1%). The Non-Profit and Government/Military
sectors announced the least.
APPENDIX C

198
Figure 2a: Word Cloud of Job Titles
Figure 2a: The word cloud above depicts frequency of words occurring in the
ninety-three (93) job titles. “Instructional” and “Designer” occurred the most
often representing 78.5% and 83.9% respectively. Words such as “Learning”,
“Development”, “Specialist”, and “Trainer” occurred much less frequently
ranging from 9.7% to 12.9%, though still worth noting. The word “Epic”
occurred in 20.6% of thirty-four (34) healthcare jobs.
2.2
1.1
5.4
3.2
7.5
1.1
7.5
21.5
19.4
1.1
3.2
1.1
1.1
2.2
8.6
4.3
9.7
5.4
8.6
11.8
7.5
20.4
1.1
2.2
1.1
3.2
6.5
7.5
2.2
2.2
1.1
1.1
3.2
0.0 10.0 20.0 30.0 40.0 50.0 60.0
Manager, Supervisor, or Director
Online or eLearning
Epic
Senior
Development or Developer
Learning
Specialist or Strategist
Training, Trainer, Instructor, or Educator
Only - Instructional Designer
Instructional, Designer, and/or Design
Figure 2b: Job Title Key Words by Industry (% of Total
Jobs)
Corporate Government / Military Health Higher Ed Non-Profit
Figure 2b: This
chart compares
key words in job
titles by industry.
39.8% of job
titles contained
only the words
“Instructional
Designer”, and
an additional
51.6% of jobs
contained the
words
instructional,
designer, and/or
design.
APPENDIX D

199
2
2
1
3
3
5
1
2
1
1
1
1
4
3
2
4
1
1
1
1
2
2
5
1 1
0 2 4 6 8 10 12 14
Epic
Online or eLearning
Learning
Senior
Manager, Supervisor, or Director
Development or Developer
Specialist or Strategist
Only - Instructional Designer
Training, Trainer, Instructor, or Educator
Instructional, Designer, and/or Design
Development or Developer
Epic
Instructional, Designer, and/or Design
Learning
Manager, Supervisor, or Director
Online or eLearning
Specialist or Strategist
Training, Trainer, Instructor, or Educator
Senior
Only - Instructional Designer
Wes
tV
irtu
al
Figure 3a: Job Title Key Words by Region by Industry (% of
Total Jobs by Region)
Corporate Government / Military Health Higher Ed Non-Profit
Figure 3a: This chart spans the next two (2) pages and depicts the most frequent
words occurring in job titles across geographic locations categorized by the US
regions: West, South, Northeast, and Midwest. Jobs that permitted telecommuting
as the main form of commute were categorized as ‘Virtual’.
The numbers in the bar chart represent the number of jobs identified for each title.
The Corporate, Health, and Higher Education industries dominated job titles in the
West, while the Corporate, Non-Profit, and Higher Education industries announced
several virtual, telecommuting jobs.
APPENDIX E

200
1
2
2
5
7
1
1
1
2
4
4
1
1
2
4
4
1
1
2
1
1
1
4
3
2
2
2
2
3
3
6
9
1
2
3
5
2
5
1
2
1
1
1
1
2
2
1
2
3
0 2 4 6 8 10 12 14
Development or Developer
Manager, Supervisor, or Director
Online or eLearning
Specialist or Strategist
Epic
Learning
Senior
Training, Trainer, Instructor, or Educator
Instructional, Designer, and/or Design
Only - Instructional Designer
Manager, Supervisor, or Director
Senior
Training, Trainer, Instructor, or Educator
Online or eLearning
Specialist or Strategist
Development or Developer
Learning
Epic
Only - Instructional Designer
Instructional, Designer, and/or Design
Epic
Learning
Senior
Manager, Supervisor, or Director
Development or Developer
Online or eLearning
Specialist or Strategist
Training, Trainer, Instructor, or Educator
Only - Instructional Designer
Instructional, Designer, and/or Design
Mid
wes
tN
ort
hea
stS
ou
thFigure 3b: Job Title Key Words by Region by Industry (% of
Total Jobs by Region)
Corporate Government / Military Health Higher Ed Non-Profit
Figure 3b: The South announced jobs from all five (5) industries, while the
Northeast was dominated by jobs in the Corporate and Health sectors. The
Midwest was also dominated by the Corporate and Health sectors, though this
region contained slightly more variety in industry.

201
Figure 4a: The four (4) region divisions were determined using the US Census Bureau
categorizations.
Each of the four census Regions is divided into two or more census Divisions:
Northeast Region
New England Division: Connecticut, Maine, Massachusetts, New Hampshire, Rhode
Island and Vermont
Middle Atlantic Division: New Jersey, New York and Pennsylvania
Midwest Region
East North Central Division: Illinois, Indiana, Michigan, Ohio and Wisconsin
West North Central Division: Iowa, Kansas, Minnesota, Missouri, Nebraska, North
Dakota and South Dakota
South Region
South Atlantic Division: Delaware, District of Columbia, Florida, Georgia, Maryland,
North Carolina, South Carolina, Virginia and West Virginia
East South Central Division: Alabama, Kentucky, Mississippi and Tennessee
West South Central Division: Arkansas, Louisiana, Oklahoma and Texas
West Region
Mountain Division: Arizona, Colorado, Idaho, Montana, Nevada, New Mexico, Utah
and Wyoming
Pacific Division: Alaska, California, Hawaii, Oregon and Washington
Retrieved from: US Census Bureau
http://www.census.gov/econ/census/help/geography/regions_and_divisions.html
8.6 9.7 8.66.5
3.2
3.2
1.1
8.6
7.5
14.0
6.5
3.2 8.6
2.2
1.1
1.1
5.4
1.1
0.0
5.0
10.0
15.0
20.0
25.0
30.0
South West Northeast Midwest Virtual
Figure 4a: Job Industry by Region (% of Total Jobs)
Corporate Government / Military Health Higher Ed Non-Profit
Figure 4a: The South announced
29% of all jobs, while the West, and
Northeast announced 25.8% and
24.7% respectively.
APPENDIX F

202
8.6 8.6
3.25.4
3.2
9.77.5
8.6
8.6 14.0
2.2
6.5
6.5
1.1
1.1
3.2
1.1
1.1
0.0
5.0
10.0
15.0
20.0
25.0
30.0
35.0
40.0
Corporate Health Higher Ed Non-Profit Government / Military
Figure 4b: Job Region by Industry (% of Total Jobs)
South West Northeast Midwest Virtual
Figure 4b: The Corporate, Health, and Higher Education industries
announced jobs from all US regions, while the Non-Profit and
Government/Military sectors were announced mostly in the South.
APPENDIX G

203
Figure 5a: This chart depicts industries by skill (Level 1 categories). The numbers in each
bar section depict the percentage of total jobs (93 total jobs across all industries).
7.5
12.9
19.4
28.0
28.0
30.1
24.7
31.2
33.3
32.3
34.4
35.5
2.2
3.2
4.3
4.3
4.3
4.3
3.2
4.3
4.3
3.2
4.3
9.7
22.6
21.5
21.5
26.9
31.2
35.5
31.2
33.3
34.4
36.6
36.6
5.4
12.9
9.7
11.8
12.9
12.9
15.1
16.1
15.1
16.1
16.1
16.1
3.2
4.3
4.3
5.4
6.5
5.4
6.5
5.4
4.3
6.5
6.5
6.5
0.0 10.0 20.0 30.0 40.0 50.0 60.0 70.0 80.0 90.0 100.0
Research
Teaching / Training / Coaching /…
Other Skills
Knowledge
Learning Format or Environment
Project Management
Education
Technical Skills
Assessment and Evaluation
Communication and Collaboration
Experience
Design and Development
Figure 5a: Industry by Skill (% of Total Jobs)
Corporate Government / Military Health Higher Ed Non-Profit
APPENDIX H

204
Figure 5b.1: This chart represents skills (Level 1) by industry. This chart depicts the significance
of each skill in each of the five (5) industries analyzed.
20
.6
50
.0
26
.5 33
.3
50
.0
35
.3
61
.8
80
.0
66
.7
52
.9
75
.0
58
.8
60
.0 66
.7
76
.5
10
0.0
58
.8
73
.3
83
.3
76
.5
10
0.0
73
.5 80
.0
10
0.0
82
.4
10
0.0
85
.3
80
.0 83
.3
67
.6
10
0.0
97
.1
93
.3 10
0.0
85
.3
75
.0
85
.3
10
0.0
83
.391
.2
10
0.0
91
.2
93
.3
66
.7
88
.2
10
0.0
94
.1 10
0.0
10
0.0
94
.1
75
.0
10
0.0
10
0.0
10
0.0
97
.1 10
0.0
10
0.0
10
0.0
10
0.0
0.0
20.0
40.0
60.0
80.0
100.0
Corporate Government / Military Health Higher Ed Non-Profit
Figure 5b.1: Skills by Industry (% of Total Industry Category)
Research
Teaching / Training / Coaching / Mentoring / Facilitation
Other Skills
Knowledge
Learning Format or Environment
Project Management
Education

205
Figure 5b.2: This chart zooms in on the upper quartile of Figure 5b.1 (75 – 100%). “Teaching and
Training” showed to be the most important in the Higher Education industry. Overall, all
industries identified “Design and Development” to be an important skill, along with “Experience”
as well as “Communication and Collaboration”.
80
.0
75
.076
.5
10
0.0
83
.3
76
.5
10
0.0
80
.0
10
0.0
82
.4
10
0.0
85
.3
80
.0
83
.3
10
0.0
97
.1
93
.3
10
0.0
85
.3
75
.0
85
.3
10
0.0
83
.3
91
.2
10
0.0
91
.2 93
.3
88
.2
10
0.0
94
.1
10
0.0
10
0.0
94
.1
75
.0
10
0.0
10
0.0
10
0.0
97
.1
10
0.0
10
0.0
10
0.0
10
0.0
75.0
80.0
85.0
90.0
95.0
100.0
Corporate Government / Military Health Higher Ed Non-Profit
Figure 5b.2: Top 75%: Skills by Industry (% of Total Industry
Category
Research
Teaching / Training / Coaching / Mentoring / Facilitation
Other Skills
Knowledge
Learning Format or Environment
Project Management

206
16.1
16.1
16.1
21.5
20.4
15.1
12.9
16.1
16.1
19.4
21.5
23.7
35.5
2.2
4.3
2.2
2.2
1.1
3.2
3.2
2.2
2.2
3.2
3.2
4.3
21.5
17.2
20.4
17.2
18.3
15.1
22.6
24.7
21.5
19.4
22.6
25.8
31.2
4.3
3.2
6.5
5.4
7.5
11.8
12.9
7.5
9.7
9.7
6.5
12.9
14.0
2.2
6.5
2.2
3.2
3.2
5.4
4.3
2.2
4.3
4.3
2.2
6.5
4.3
0.0 10.0 20.0 30.0 40.0 50.0 60.0 70.0 80.0 90.0
DD: Develop Successful
Learning Strategy
DD: Maintain, Update, Revise
Content
TS: Microsoft Office
TS: eLearning Authoring Software
AE: Evaluate learning solutions'
impact and design
TS: LMS, CMS, LCMS
Teaching / Training / Coaching /
Mentoring / Facilitation
DD: Content Design
CC: Oral Communication
skills
CC: Written Communication
skills
AE: Conduct Needs Assessment
CC: Work with diverse
contintuencies
(stakeholders, SME's, vendors)
DD: Content Development
Figure 5c.1: Industry by Skills (Level 2)
Corporate Government / Military Health Higher Ed Non-Profit
Key
AE Assessment and
Evaluation
CC Communication and
Collaboration
DD Design and Development
K Knowledge
OS Other Skills
PM Project Management
TS Technical Skills
Figure 5c.1: This
chart compares all
Level 2 skills
across all Level 1
categories.
This chart was
created after
analyzing the Level
2 skills for each
Level 1 category,
then combining
them all together in
one chart.
APPENDIX I

207
12.9
8.6
14.0
11.8
14.0
17.2
12.9
19.4
14.0
18.3
2.2
2.2
1.1
3.2
2.2
2.2
9.7
12.9
9.7
14.0
10.8
14.0
12.9
12.9
12.9
15.1
3.2
7.5
6.5
6.5
8.6
4.3
11.8
4.3
9.7
5.4
3.2
2.2
5.4
3.2
3.2
3.2
2.2
1.1
3.2
2.2
0.0 10.0 20.0 30.0 40.0 50.0
PM: Ability to work on
multiple projects
CC: Ability to build strong
relationships
PM: Project Management Skills
DD: Implement
CC: Work with cross
functional team
K: Adult Learning Theory
CC: Collaboration skills
K: Instructional Design Models
and Principles
PM: Lead development of
processes and initiatives
AE: Ensure instruction meets
required standards or requirements
Figure 5c.2: Industry by Skills (Level 2) Cont'd
Corporate Government / Military Health Higher Ed Non-Profit
Key
AE Assessment and
Evaluation
CC Communication and
Collaboration
DD Design and Development
K Knowledge
OS Other Skills
PM Project Management
TS Technical Skills
Figure 5c.2:
This is the
continuation
of the
previous
chart.

208
9.7
15.1
8.6
8.6
6.5
8.6
9.7
10.8
5.4
2.2
15.1
1.1
1.1
2.2
1.1
1.1
1.1
1.1
1.1
1.1
5.4
2.2
7.5
10.8
7.5
9.7
7.5
11.8
9.7
15.1
9.7
2.2
1.1
1.1
1.1
5.4
2.2
6.5
1.1
8.6
6.5
2.2
1.1
1.1
1.1
1.1
1.1
1.1
1.1
0.0 5.0 10.0 15.0 20.0 25.0 30.0
AE: Data analysis
(Measure and report on metrics)
AE: Establish metrics
for measurement
OS: Attention to detail
PM: Track and report progress
PM: Organization skills
PM: Plan project and develop
production schedule
TS: Multimedia Production Tools
AE: Ensure objectives are met
OS: Problem solving skills
CC: Interpersonal skills
PM: Time Management Skills
Figure 5c.3: Industry by Skills (Level 2)
Corporate Government / Military Health Higher Ed Non-Profit
Key
AE Assessment and
Evaluation
CC Communication and
Collaboration
DD Design and
Development
K Knowledge
OS Other Skills
PM Project Management
TS Technical Skills
Figure 5c.3: This is the continuation of the previous chart.

209
19.4
2.2
4.3
8.6
1.1
1.1
2.2
4.3
1.1
2.2
1.1
31.2
2.2
2.2
11.8
1.1
8.6
9.7
5.4
5.4
3.2
1.1
3.2
4.3
1.1
1.1
2.2
1.1
0.0 10.0 20.0 30.0 40.0 50.0 60.0 70.0
Required
Preferred
Required
Preferred
Required
Preferred
Required
Preferred
Required
Preferred
Required
Preferred
Required
Preferred
Bac
hel
ors
Deg
ree
Mas
ters
Deg
ree
Lic
ensu
re
Hig
h S
cho
ol
Dip
lom
a
Do
ctora
te
(PhD
, E
DD
)C
erti
fica
tio
n
Ass
oci
ates
Deg
ree
Figure 6a: Industry by Required and Preferred Degrees (% of
Total Jobs)
Corporate Government / Military Health Higher Ed Non -Profit
Figure 6a: This chart depicts the required and preferred degrees identified across industries.
Bachelor’s Degrees were required by a large margin over other degrees, but many employers
preferred applicants with a Master’s Degree in a related field.
Additionally, the Healthcare industry preferred certifications in Epic applications or
participants that would be willing to get certified upon hiring. Examples of certifications are
provided on the following page.
APPENDIX J

210
52
.9
10
0.0
85
.3
60
.0 66
.7
5.9
5.9
16
.7
11
.8
25
.0
5.9
33
.3
16
.723
.5
50
.0
32
.4
33
.3
33
.3
8.8
0.02.9
2.9 6
.72
0.0
8.8
5.9
5.9
25
.0
23
.5
16
.7
0.0
10.0
20.0
30.0
40.0
50.0
60.0
70.0
80.0
90.0
100.0
Corporate Government /
Military
Health Higher Ed Non -Profit
Figure 6b: Education by Industry
R: Bachelors Degree P: Bachelors Degree R: Masters Degree
P: Masters Degree R: Licensure P: Licensure
R: High School Diploma P: High School Diploma R: Doctorate (PhD, EDD)
P: Doctorate (PhD, EDD) R: Certification P: Certification
R: Associates Degree P: Associates Degree
Key
R Required
P Preferred
Figure 6b: This chart depicts the required and preferred degrees identified by each industry.
Corporate
ATD (Association of
Talent Development,
formerly ASTD)
CPLP (from ATD)
NBCC (National Board
for Certified
Counselors)
Security certifications:
CISSP, SSCP, CISA,
CISM
SHRM (Society for
Human Resource
Management)
Technical certifications:
MCSA, MCSE,
CCNA, CCNP
Health
ATD training certification (Association of Talent
Development, formerly ASTD)
ASAP
ASTD or comparable alternative in needs analysis
and/or instructional design
SHRM (Society for Human Resource Management)
ATD - Presentation skills
ATD - training
ATD Master Trainer
CPLP (from ATD)
CPT
Epic applications such as Epic Willow
Healthcare IS system certification (Cerner, Lawson,
SAP, Microsoft)
Improvement technologies
In accordance with departmental and organizational
standards
Lean black belt from PeaceHealth
Professional designation
TED (Training and Enterprise Development)
Training certifications (general)
Government / Military
State level teaching
certification
Non-Profit
Completion of NTC
Mentor Academies or
School Leadership
Specific Certifications Referenced: *Note: Most jobs did not reference specific
certifications. This data exemplifies jobs that did.

211
1.1
3.2
7.5
7.5
5.4
15.1
14.0
12.9
30.1
46.2
53.8
7.5
21.5
22.6
33.3
39.8
47.3
49.5
52.7
62.4
69.9
82.8
90.3
0.0 10.0 20.0 30.0 40.0 50.0 60.0 70.0 80.0 90.0 100.0
Research
Learning Format or Environment
Teaching / Training / Coaching /
Mentoring / Facilitation
Assessment and Evaluation
Design and Development
Other Skills
Project Management
Knowledge
Communication and Collaboration
Technical Skills
Education
Experience
Figure 7: Required and Preferred Qualifications (% of Total
Jobs)
Required Preferred
Figure 7: This chart depicts the required and preferred qualifications identified by
each industry. This data was generated by sorting only items tagged as a
“Qualification” as opposed to “Responsibility”. Most employers saw Experience,
Education, Technical skills, and Communication and Collaboration to be the top
qualifications of an instructional designer.
APPENDIX K

212
2.2
3.2
5.4
7.5
7.5
9.7
4.3
15.1
24.7
3.2
1.1
3.2
1.1
2.2
1.1
2.2
4.3
7.5
6.5
14.0
11.8
20.4
25.8
28.0
3.2
2.2
3.2
3.2
2.2
6.5
6.5
7.5
12.9
7.5
1.1
1.1
1.1
3.2
5.4
5.4
0.0 10.0 20.0 30.0 40.0 50.0 60.0 70.0
Universal Design
Assessment and Evaluation
Communication and Collaboration
Management or Leadership
Application of Knowledge
or Methodologies
Learning Format, Environment,
or Product
Teaching or Training
Instructional Technology
and/or Technical Skills
Working Environment
Instructional Design
Figure 8b: Experience in... (% of Total Jobs)
Corporate Government / Military Health Higher Ed Non-Profit
Figure 8b: This chart depicts the
type of experience requested in
each job announcement. The
most requested experience was in
Instructional Design as well as a
particular work environment.
9.7 11.8 14.0
1.12.2
17.214.0 11.8
4.3
9.7
2.22.2
1.1
2.2 4.3
0.0
5.0
10.0
15.0
20.0
25.0
30.0
35.0
40.0
1 - 2 years 3 - 4 years 5 - 7 years 8 - 10 years
Figure 8a: Years of Experience (% of Total Jobs)
Corporate Government / Military Health Higher Ed Non-Profit
Figure 8a: This chart depicts
the years of experience
requested in each job
announcement.
Approximately 30% of job
announcements required 1 – 2
years, 3 – 4 years, and 5 – 7
years of experience.
APPENDIX L

213
2.9
20
.0
5.9
5.9
13
.3 16
.7
8.8 1
1.8
20
.0
14
.7
20
.6
20
.0
20
.6
17
.6
13
.3 16
.720
.6
75
.0
38
.2
40
.0
16
.7
26
.5
25
.0
32
.4
40
.0
50
.0
11
.8
75
.0
55
.9
46
.7
41
.2
25
.0
70
.6
80
.0 83
.3
67
.6
50
.0
76
.5
46
.7
83
.3
0.0
10.0
20.0
30.0
40.0
50.0
60.0
70.0
80.0
90.0
Corporate Government / Military Health Higher Ed Non-Profit
Figure 8c: Experience in... (% of Total Industry)
Universal Design Assessment and Evaluation
Communication and Collaboration Management or Leadership
Application of Knowledge
or Methodologies
Learning Format, Environment,
or Product
Teaching or Training Instructional Technology
and/or Technical Skills
Figure 8c: This chart depicts the type of experience most requested by industry.

214
2.22.2
3.2
2.22.2
5.41.1
8.69.7
16.121.5
15.1
1.1
2.22.2
3.2
1.11.1
6.54.34.3
2.24.3
1.17.5
20.417.2
15.1
2.22.21.1
3.23.2
1.11.1
3.27.5
4.36.5
6.55.4
11.8
1.1
1.11.1
2.23.25.4
0.0 10.0 20.0 30.0 40.0 50.0 60.0
Accessibility SoftwareWeb Authoring Tools
Video Conference TechnologyResearch and evaluate emerging technology
Operating SystemsHealthcare Record Applications
Ability to learn company technologyProject Management ToolsProgramming KnowledgeInstructional TechnologyGraphic Design Software
Multimedia Production ToolsMicrosoft Office
eLearning Authoring SoftwareLMS, CMS, LCMS
Figure 9a: Industry by Technical Skills (% of Total Jobs)
Corporate Government / Military Health Higher Ed Non-Profit
Figure 9a: This chart depicts the top technical skills identified across all ninety-three (93)
jobs.
LMS, eLearning Authoring Software, and Microsoft Office skills were the most
frequently requested.
APPENDIX M

215
13
.3
5.9
13
.3
5.9
2.9
6.7
2.9
20
.0
8.8
20
.0
17
.6
5.9
11
.8
6.7
5.9
11
.8
6.7
16
.7
14
.7
5.9
20
.0
2.9
25
.0
11
.8
46
.7
23
.5
2.9
26
.7
16
.7
26
.5
20
.6
40
.0
16
.7
44
.1
50
.0
55
.9
40
.0
33
.3
58
.8
50
.0
47
.1
33
.3
50
.0
41
.2
75
.0
41
.2
73
.3
83
.3
0.0
10.0
20.0
30.0
40.0
50.0
60.0
70.0
80.0
90.0
Corporate Government / Military Health Higher Ed Non-Profit
Figure 9b: Technical Skills by Industry (% of Total Industry
Category)
Accessibility Software
Web Authoring Tools
Video Conference Technology
Research and evaluate emerging technology
Operating Systems
Healthcare Record Applications
Ability to learn company technology
Project Management Tools
Programming Knowledge
Figure 9b: This chart depicts top technical skills by industry.

216
Multimedia
Production Tools
Adobe Acrobat
Adobe After Effects
Adobe Audition
Adobe Creative Cloud
Adobe Dreamweaver
Adobe Flash
Adobe Flash Designer
Adobe Illustrator
Adobe InDesign
Adobe Media Encoder
Adobe Photoshop
Adobe Premiere Pro
Apple Final Cut Pro
Apple Soundtrack Pro
Audacity
Jing
Keynote
Macromedia Flash
Maxon Cinema 4D
Screenflow
Snagit
eLearning
Authoring
Software
Adobe Captivate
Adobe Creative
Cloud
Adobe Design
Suite
Adobe eLearning
Suite and Master
Collection
Adobe Frame
Maker
Adobe Presenter
Articulate Presenter
Articulate Storyline
Articulate Studio
Composica/DART
Open edX
TechSmith
Camtasia
Traincaster
Adobe RoboHelp
Web Authoring
LMS
Absorb
Blackboard
Canvas
Cornerstone
Desire2Learn
HCM Cloud Talen
Management
KMx
Lectora
Moodle
Open edX
Oracle PeopleSoft
Software
Oracle Talent
Management Cloud
Plateau
SABA
SumTotal
Telehealth
Topyx
Zoom
Programming
Knowledge
CSS
HTML
HTML5
JavaScript
PHP
SEO
SQL
Project
Management
Tools
Call
Management
System
Microsoft Project
Microsoft Visio Video Conference
Technology
Adobe Connect
WebEx
Zoom
Microsoft Office
Microsoft Access
Microsoft Excel
Microsoft Outlook
Microsoft PowerPoint
Microsoft Project
Microsoft Publisher
Microsoft Visio
Microsoft Word
Healthcare Record
Applications
Epic applications
Graphic Design
Software
Adobe Creative Suite
Adobe Illustrator
Adobe Photoshop
CMS
Digital Ignite
Microsoft Sharepoint
Xyleme
LCMS
ACC
Ability to use
various
operating
systems
iOS
Mac OS X
tvOS
watchOS
Windows
Figure 9c: Examples of Software Supporting Technical Skills
The following are examples of software and applications that support the technical
skills identified in Figures 9a and 9b.

217
1.1
2.2
2.2
7.5
6.5
9.7
6.5
10.8
8.6
18.3
1.1
1.1
1.1
2.2
2.2
2.2
2.2
3.2
1.1
2.2
3.2
1.1
5.4
7.5
14.0
7.5
9.7
15.1
2.2
2.2
2.2
1.1
2.2
1.1
7.5
2.2
4.3
12.9
1.1
1.1
2.2
3.2
2.2
2.2
2.2
1.1
6.5
0.0 10.0 20.0 30.0 40.0 50.0 60.0
MOOC
Traditional
Distance Learning
Print-based
F2F
mLearning
Self-directed, self-study, or self-paced
Blended or hybrid
Classroom-based
Instructor-led
Interactive
Web-based or Virtual
eLearning or Online
Figure 10a: Learning Format or Environment (% of Total Jobs)
Corporate Government / Military Health Higher Ed Non-Profit
13
.31
3.3
2.9
25
.0
13
.3
25
.0
2.9 6
.7
16
.7
5.9
5.9
13
.3 16
.7
5.9 8
.8
6.7
33
.3
20
.6
2.9
50
.0
17
.6 25
.0
14
.7
46
.7
26
.5
50
.0
20
.6
33
.3
17
.6
50
.0
38
.2
33
.3
29
.4
50
.0
20
.6
13
.3
33
.3
23
.5
50
.0
26
.5
26
.7
16
.7
50
.0
75
.0
41
.2
80
.0
10
0.0
0.0
50.0
100.0
Corporate Government / Military Health Higher Ed Non-Profit
Figure 10b: Learning Format or Environment by Industry (% of
Total Industry Cateogry)
MOOC Traditional Distance Learning
Print-based F2F mLearning
Self-directed, self-study, or self-paced Blended or hybrid Classroom-based
Instructor-led Interactive Web-based or Virtual
eLearning or Online
Figure 10b: This chart depicts top learning formats or environments by industry.
Figure 10a: This chart
depicts top learning
formats or environments
mentioned by the job
announcements.
eLearning / Online was
mentioned the most
frequently by a large
margin.
APPENDIX N

218
8.6
3.2
2.2
2.2
8.6
14.0
12.9
16.1
19.4
23.7
1.1
1.1
1.1
2.2
2.2
2.2
3.2
5.4
10.8
8.6
15.1
12.9
10.8
12.9
21.5
19.4
25.8
1.1
3.2
5.4
6.5
7.5
8.6
11.8
9.7
9.7
12.9
1.1
1.1
1.1
2.2
3.2
2.2
4.3
4.3
6.5
0.0 10.0 20.0 30.0 40.0 50.0 60.0 70.0 80.0
Adaptability
Presentation skills
Consulting skills
Interpersonal skills
Ability to build strong…
Work with cross…
Collaboration skills
Oral Communication…
Written Communication…
Work with diverse…
Figure 11a: Communication and Collaboration (% of Total
Jobs)
Corporate Government / Military Health Higher Ed Non-Profit
23
.5
25
.0
14
.7
6.7
16
.7
8.8
29
.4
20
.0
5.9
25
.0
23
.5 33
.3
16
.7
5.9
25
.0
41
.2
40
.0
16
.723
.5 35
.3 46
.7
33
.338
.2 50
.0
29
.4
53
.3
50
.0
35
.3
35
.3
73
.3
33
.344
.1 50
.0 58
.8
60
.0 66
.7
52
.9
50
.0
52
.9 60
.0 66
.7
64
.7 75
.0
70
.6 80
.0
10
0.0
0.0
100.0
Corporate Government /
Military
Health Higher Ed Non-Profit
Figure 11b: Communication and Collaboration by Industry
Adaptability Presentation skills Consulting skills
Interpersonal skills Ability to build strong
relationships
Work with cross
functional team
Collaboration skills Oral Communication
skills
Written Communication
skills
Figure 11b: This chart depicts top “Communication and Collaboration” skills by industry.
Figure 11a: This chart
depicts top
“Communication and
Collaboration” skills
mentioned by the job
announcements.
APPENDIX O

219
1.1
1.1
4.3
17.2
19.4
1.1
1.1
3.2
2.2
1.1
7.5
3.2
14.0
12.9
1.1
4.3
1.1
4.3
4.3
3.2
1.1
0.0 5.0 10.0 15.0 20.0 25.0 30.0 35.0 40.0 45.0
Software Architecture
Universal Design
EPIC Applications
Best Practices
Adult Learning Theory
Instructional Design
Models and Principles
Figure 12a: Knowledge
Corporate Government / Military Health Higher Ed Non-Profit
2.9
25
.0
5.9 6.7
2.9
2.9
26
.7
20
.6
11
.8
8.8
6.7
47
.1
25
.0
38
.2
26
.7
50
.052
.9
75
.0
35
.3
26
.7
16
.7
0.0
10.0
20.0
30.0
40.0
50.0
60.0
70.0
80.0
Corporate Government /
Military
Health Higher Ed Non-Profit
Figure 12b: Knowledge by Industry
Software Architecture Universal Design
EPIC Applications Best Practices
Adult Learning Theory Instructional Design Models and Principles
Figure 12b: This
chart depicts top
requested expertise
by industry.
Figure 12a: This chart depicts top knowledge/theoretical expertise categories mentioned by the job announcements.
Specific Knowledge Referenced:
*Note: Many jobs did not reference specific knowledge.
Agile (software architecture)
ISD
ADDIE (mentioned most often)
SAM
Rapid deployment model
Wiggins and McTighe Backwards Design
Bloom's Taxonomy
Gagne's Conditions of Learning
Keller's ARCS Model of Motivation
Cognitive Learning Theory
Mayer's Multimedia Principles
Kirkpatrick's Levels of Evaluation
Accessibility 508
Performance improvement
APPENDIX P

220
5.9
2.9 5
.9 6.7
25
.0
11
.8
6.7
11
.8
8.81
1.8
13
.3 16
.7
11
.8
25
.0
2.9 6
.7
16
.7
26
.5
25
.0
11
.8
33
.3
23
.5
50
.0
20
.6
6.7
16
.7
14
.7
25
.0
26
.5
53
.3
16
.7
0.0
10.0
20.0
30.0
40.0
50.0
60.0
Corporate Government / Military Health Higher Ed Non-Profit
Figure 13b: Other Skills by Industry
Ability to work under pressure Ability to exercise sound judgement Self-directed
Analytical skills Flexible Editing and proofreading skills
Creative Attention to detail Problem solving skills
1.1
4.3
4.3
4.3
9.7
8.6
5.4
1.1
1.1
1.1
2.2
1.1
2.2
2.2
4.3
3.2
1.1
4.3
7.5
9.7
1.1
1.1
2.2
1.1
0.0
1.1
8.6
1.1
1.1
2.2
1.1
1.1
0.0 5.0 10.0 15.0 20.0 25.0 30.0
Ability to work under pressure
Ability to exercise sound judgement
Self-directed
Analytical skills
Flexible
Editing and proofreading skills
Creative
Attention to detail
Problem solving skills
Figure 13a: Other Skills
Corporate Government / Military Health Higher Ed Non-Profit
Figure 13b: This chart depicts top “Other Skills” by industry.
Figure 13a: This chart
depicts top “Other
Skills” mentioned by
the job announcements.
APPENDIX Q

221
1.12.23.2
5.411.8
16.116.116.1
35.5
1.1
2.22.2
4.33.2
4.3
1.11.1
4.31.1
14.021.517.2
24.731.2
1.12.2
6.54.3
3.27.5
14.0
2.2
1.13.2
2.26.5
2.24.3
0.0 10.0 20.0 30.0 40.0 50.0 60.0 70.0 80.0 90.0
Resource or Content management
Ownership
Implement
Maintain, Update, Revise Content
Content Development
Figure 14a: Design and Development
Corporate Government / Military Health Higher Ed Non-Profit
2.9
2.9 6.7
33
.3
5.9
25
.0
2.9
13
.3
8.8 11
.8
14
.7
2.9
16
.7
32
.4
50
.0
38
.2
40
.0 50
.0
44
.1 50
.0 58
.8
26
.7 33
.344
.1
10
0.0
47
.1
20
.0
10
0.0
44
.1
75
.0
67
.6
46
.7
33
.3
97
.1
10
0.0
85
.3
86
.7
66
.7
0.0
20.0
40.0
60.0
80.0
100.0
Corporate Government / Military Health Higher Ed Non-Profit
Figure 14b: Design and Development by Industry
Resource or Content management Prototyping Ownership
Scale learning solutions Implement Develop Successful Learning Strategy
Maintain, Update, Revise Content Content Design Content Development
Figure 14b: The chart below depicts top “Design and Development” skills by industry.
Figure 14a: This chart depicts top “Design and Development” skills mentioned by the job
announcements.
APPENDIX R

222
4.3
9.7
15.1
10.8
18.3
20.4
21.5
1.1
1.1
1.1
1.1
2.2
1.1
3.2
8.6
5.4
2.2
11.8
15.1
18.3
22.6
1.1
2.2
1.1
1.1
5.4
7.5
6.5
1.1
1.1
1.1
1.1
2.2
3.2
2.2
0.0 10.0 20.0 30.0 40.0 50.0 60.0
Quality assurance
Data analysis (Measure and report on metrics)
Establish metrics for measurement
Ensure objectives are met
Ensure instruction meets required standards or requirements
Evaluate learning solutions' impact and design
Conduct Needs Assessment
Figure 15a: Assessment and Evaluation
Corporate Government / Military Health Higher Ed Non-Profit
11
.8
25
.0
23
.5
6.7
16
.726
.5
25
.0
14
.7
13
.3
16
.7
41
.2
25
.0
5.9 6.7
16
.729
.4
25
.0 32
.4
6.7
16
.7
50
.0
50
.0
41
.2
33
.3
33
.3
55
.9
25
.0
50
.0
46
.7
50
.058
.8
75
.0
61
.8
40
.0
33
.3
0.0
100.0
Corporate Government / Military Health Higher Ed Non-Profit
Figure 15b: Assessment and Evaluation skills by Industry
Quality assuranceData analysis (Measure and report on metrics)Establish metrics for measurementEnsure objectives are metEnsure instruction meets required standards or requirements
Figure 15a: This
chart depicts top
“Assessment and
Evaluation” skills.
Examples of “Ensure instruction meets required
standards or requirements” referenced:
*Note: Many jobs did not reference specific examples.
Accessibility requirements
ACCME / ANCC
ADA (Section 508) compliance requirements
Assessment standards
Campus security policy
College and Career Ready Standards (CCRS)
College and faculty standards
Continuing medical education (CME) credit
Copyright, Fair Use, and intellectual property standards
FDA and ISO regulatory requirements
FERPA
Examples cont’d:
Departmental and organizational standards
MBA Education Standards
Pedagogical design
Professional teaching and administrative
standards
Project management standards
SCORM / AICC
Security requirements
Social and Emotional Learning (SEL)
State and national standards
Strict brand/editorial requirements
Student content standards
TEACH Act
Web design
Figure 15b: This chart depicts top “Assessment and Evaluation” skills by industry.
APPENDIX S
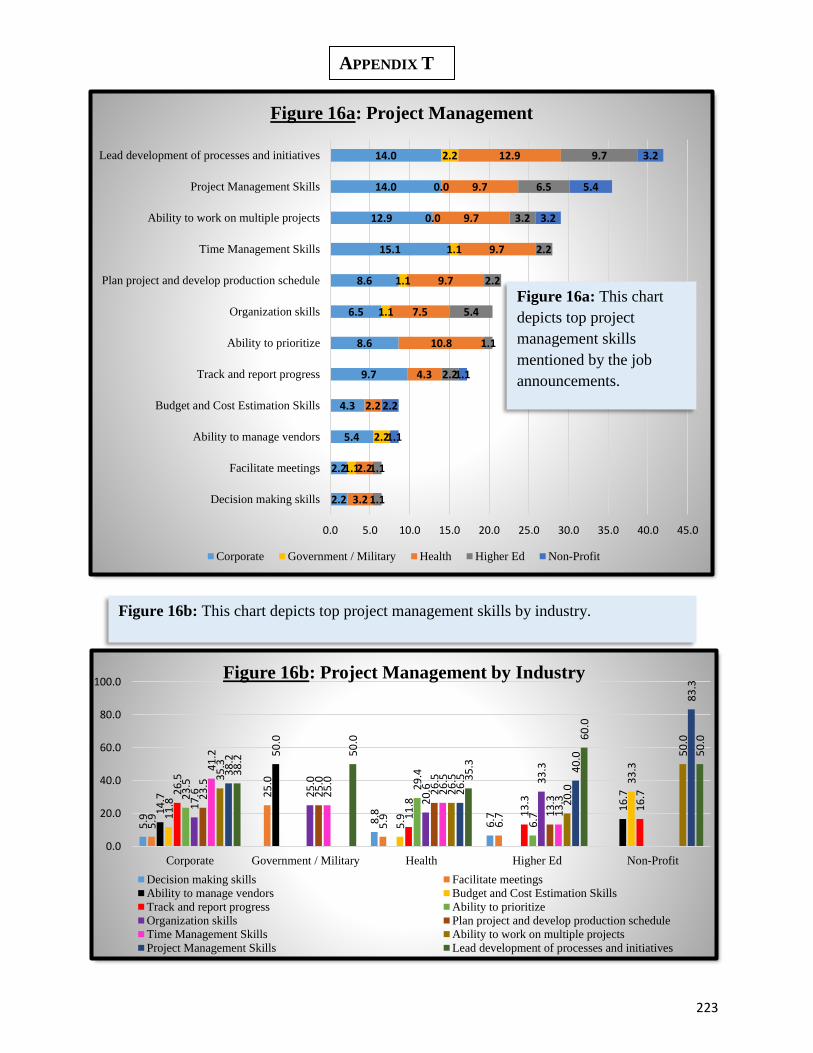
223
2.2
2.2
5.4
4.3
9.7
8.6
6.5
8.6
15.1
12.9
14.0
14.0
1.1
2.2
1.1
1.1
1.1
0.0
0.0
2.2
3.2
2.2
2.2
4.3
10.8
7.5
9.7
9.7
9.7
9.7
12.9
1.1
1.1
2.2
1.1
5.4
2.2
2.2
3.2
6.5
9.7
1.1
2.2
1.1
3.2
5.4
3.2
0.0 5.0 10.0 15.0 20.0 25.0 30.0 35.0 40.0 45.0
Decision making skills
Facilitate meetings
Ability to manage vendors
Budget and Cost Estimation Skills
Track and report progress
Ability to prioritize
Organization skills
Plan project and develop production schedule
Time Management Skills
Ability to work on multiple projects
Project Management Skills
Lead development of processes and initiatives
Figure 16a: Project Management
Corporate Government / Military Health Higher Ed Non-Profit
5.9 8.8
6.7
5.9
25
.0
5.9 6.7
14
.7
50
.0
16
.7
11
.8
5.9
33
.3
26
.5
11
.8
13
.3
16
.723
.5 29
.4
6.7
17
.6 25
.0
20
.6
33
.3
23
.5
25
.0
26
.5
13
.3
41
.2
25
.0
26
.5
13
.3
35
.3
26
.5
20
.0
50
.0
38
.2
26
.5
40
.0
83
.3
38
.2
50
.0
35
.3
60
.0
50
.0
0.0
20.0
40.0
60.0
80.0
100.0
Corporate Government / Military Health Higher Ed Non-Profit
Figure 16b: Project Management by Industry
Decision making skills Facilitate meetings
Ability to manage vendors Budget and Cost Estimation Skills
Track and report progress Ability to prioritize
Organization skills Plan project and develop production schedule
Time Management Skills Ability to work on multiple projects
Project Management Skills Lead development of processes and initiatives
Figure 16b: This chart depicts top project management skills by industry.
Figure 16a: This chart
depicts top project
management skills
mentioned by the job
announcements.
APPENDIX T