Embed Size (px)
Citation preview

1
Analysis of inflows to the Chelas WWTP facing rain events
Vasco Soares de Oliveira Penha Garcia
October, 2015
Department of Civil Engineering, Instituto Superior Técnico, Lisbon Technical University, Avenida Rovisco Pais, Lisbon 1049-001, Portugal
Abstract
More and more studies emphasize the growing weight of climate change in the design and planning of engineering structures, namely in urban drainage systems. The predicted increase of extreme rainfall events and heavier rainfall intensities during wet weather periods in Europe in general, and
Portugal in particular as stated in reports by the IPCC, signals the urgent establishment of measures and programs in strategic planning that allow WWTPs to adjust and adequately respond to wet weather treatment requests.
It is necessary to define point source measures for the collection and analysis of water quality data, and implement volume and pollution control tools in drainage systems for wet weather flows, in order to identify the first flush phenomenon and the variation in water quality during rainfall events.
Current methods resort to softwares based on the mathematical modelling of hydraulic and environmental behavior of infra-structures to predict their performance and then correlate it to real-life scenarios. Out of these models comes an array of solutions to be tested in all stages of the WWTP – from preventive design to corrective modifications.
The present work applies these methods to the Chelas sub-system, in Lisbon, Portugal. Data was collected and analysed by the inlet of the Chelas WWTP. The software Bentley SewerGEMS was used to test the outcome of planned alterarions to the WWTP’s infrastructure, allowing for the optimization of the system’s performance in extreme rainfall events. These measures are continuously supported by parameters such as the mass-balance of pollutants in outflows, with or without treatment at the Chelas WWTP.
Keywords: Climate change; extreme rainfall events; first flush; water quality parameters; unitary sewer systems; Bentley SewerGEMS; mass-balance

2
1. Introduction
Historically sanitation systems in urban areas discharge wastewaters in receiving waters. More recently, since the nineteenth century, receiving water lines were channeled, forming combined sewers, which convey domestic sewage, industrial wastewater and stormwater runoff in the same pipe to a centralized treatment facility.
The increase in population density since the industrial revolution, especially in urban areas, has resulted in more impervious areas, which combined with significant climate changes, namely the increased occurrence of extreme rainfall events, shows the need for adaptation of existing conditions for better sanitation practices in urban areas.
This work aims to develop a methodology for analyzing generated volumes and evolving water quality facing rain events, and contribute to the improvement of treatment strategies, management and operation of the WWTP during wet weather.
2. Climate changes according to IPCC
IPCC, Intergovernmental Panel on the Climate Change, is a scientific organization specialized in the assessment of climate change on the scope of UNEP, United Nations Environment Program and the WMO, World Meteorological Organization, created in 1988.
Producing updated reports about climate changes is IPCC’s main role, developed by several working groups responsible for rigorously evaluating the latest and more advanced scientific studies, counting on the support of many scientists and investigators, voluntarily associated to the organization, specialized in this field. These reports are intended not only to update climate status, but also to propose mitigation and adaptation measures to face future challenges. The current paper focuses on the fourth report published in 2007.
Based on several scenarios of global GHG (greenhouse gases) emissions defined in the special report emissions scenarios (SRES, 2000) and using several global climate models, IPCC predicts a strong tendency for the increase on global warming, the rising off the sea level, the extension off dry conditions mainly in the Mediterranean, more frequent occurrence of flooding, particularly in Northern Europe and more frequent occurrence of extreme weather events, such as heat waves and heavy precipitation events.
FIGURE 1 – Relative changes in precipitation (in percent) for the period 2090-2099, relative to 1980-1999. Values are
multi-model averages based on a SRES scenario for December to February (left) and June to August (right). White
areas are where less than 66% of the models agree in the sign of the change and stippled areas are where more than
90% of the models agree in the sign of the change (IPCC, 2007).
3. Climate and Rain Regime in Portugal
The climate in Portugal the climate is regulated essentially by the North Atlantic Oscillation (NAO), responsible for the variability of the sea pressure level in the North Atlantic Ocean (IPMA - Portuguese Climate and Sea Institute). Results from the fluctuations in the difference of atmospheric pressure at sea level between the
Icelandic low and the Azores high. A positive NAO phase (stronger Azores high) results in dry and cold winters in Southern Europe (Santos e Miranda, 2006; Camuffo et al., 2011; Durão et al., 2009; Santos et
al., 2001; Pereira et al., 2010; Costa et al., 2012; Trigo et al., 2002). A negative NAO phase occurs before both weak Icelandic low and Azores high and results in milder and rainy winters in Southern Europe.
3
The average annual precipitation in Portugal is about 900 mm, is characterized by high interanual variability and, overall, the average annual rainfall for the region tends to decrease from north to south and from west to the east.
4. WWTP operation facing rain events – strategic methodology
Monitoring climate changes represents an important matter for planning the design of WWTP using climate models, preferably local, merged with mathematical models, to perform simulation of hydraulic and environmental performance of the infrastructures. It allows to validate changes in project implementation or, in the initial conception phase, aiming to sustainability principles and main goals to achieve with the construction of the infrastructures, in accordance with local economic and environmental context.
Data analysis of the wastewater quality standards, namely COD, BOD and TSS, assume particular relevance considering the local variability associated with these parameters, in particular considering the intensity of precipitation observed during the rain event. It is also important to evaluate the inflow volume to the WWTP, according to its maximum operating capacity and the efficiency levels observed in the treatment, during and after such events and evaluation of the first flush phenomenon.
The implementation and monitoring of WWTP management solutions during wet weather, which may represent solutions that favor a sustainable approach globally but focuses more on economics, in particular on optimization strategies and minimizing treatment of the influent volume, or solutions which favours an equally sustainable approach globally, but more focused on environmental aspects. These last may consist in the design of additional infrastructure to the more common drainage system, which become responsible to deal directly with the additional volumes generated, in order to reach high efficiency levels in wastewater treatment such as WWTF (Wet Weather Treatment Facilities, Szabo et. al, 2005) or natural retention basins (solution highly appreciated in countries like Germany, where "were built in the last 15 years in unitary systems, about 10,000 ponds or reservoirs for retention and regulation,.." Monteiro, 2012).
Studies developed by Semadeni-Davies and colleagues (2008), in Helsinborg, Sweden; Langeveld and colleagues (2013) Eindhoven, Netherlands; Mines and colleagues (2007), Georgia, USA; Szabo and colleagues (2005), Ohio, USA supports the guidelines aforementioned.
5. Chelas drainage system
a. General description
Located in Chelas, Lisbon, the drainage system serves up to 125000 inhabitants. It includes the WWTP, 4 pumping stations and the interceptor system with about 5 km long, connected to the WWTP. The company responsible for the management of the drainage system is Simtejo, S.A..
The drainage system is divided into high area, where the transport of waste and rain water is processed by gravity and low area, where the transport of waste and rain water is processed mainly resorting to pumping stations and pressurized pipes
FIGURE 2 – Chelas drainage system – high área (brown), low area (blue) and interceptor system (red).

4
b. Interceptor system – Estrada de Chelas
The interceptor system – Estrada de Chelas, is responsible for ensuring the service of the high area of Chelas drainage system and is the case study of this paper. It has a length of approximately 2 km. It consists of six weirs with the following description, from upstream to downstream respectively: Broma, Quartel, Picheleira, CVD2, CVD1 and Emissário 1. The function of the weirs Broma, Quartel, Picheleira and Emissário 1 is to divert domestic flow, dry time, ensuring that the flow is treated and the function of CVD1 and CVD2 weirs is to serve as a bypass system, discharging the excess flow present in the domestic system directly to the river
FIGURE 3 – Weirs location in the interceptor system.
The recommended interventions (Engidro, 2009) in the interceptor system are the following: constructive improvements in all weirs except CVD 1 and CVD 2; construction of a new weir, responsible for drainage basin 5; insertion of vortex valves in weirs Broma, Quartel, Picheleira, Emissário 1, to allow the treatment of residential wastewater to be maximized during rain events.
Figure 4 represents the drainage basins composing the upper area served by the interceptor system.
FIGURE 4 – Drainage basins composing the upper area served by the interceptor system.
5
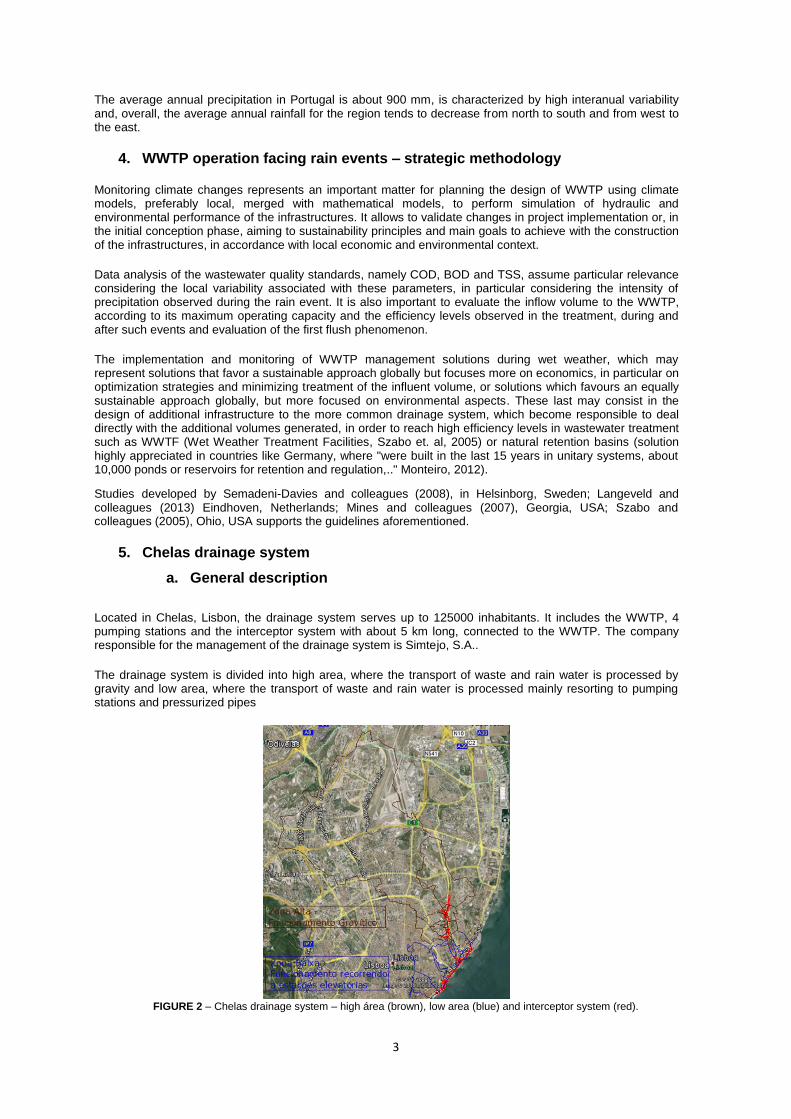
TABLE 1 – Connection between basins and weirs – Main features
c. Inflow data analysis to Chelas WWTP
Water quality parameters, inflow and rain data were acquired from Simtejo S.A., for the 2012/2013 and 2013/2014 hydrological years. The collected data are daily and the data collection relating to the inflow quality parameters is typically achieved through biweekly collections, in accordance with Portuguese law, trough composite samples (mixture of samples collected from 2 to 2 hours during the 24h period of the day).
Total annual rainfall verified for both hydrological years is close to the average referred to Portugal average of approximately 900 mm - 853 mm in the year 2012/2013 and 834 mm in the year 2013/2014, and the quite extensive dry period is also shown. Another important related with rainfall data are the number of days of heavy precipitation considering three categories – plus than 10 mm/day; between 5 and 10 mm/day; between 1 and 5 mm/day. The first category occurred 29 days in the hydrological year and 26 days in the 2013/2014 hydrological year; the second category occurred 50 days and 47 days respectively in the 2012/2013 and 2013/2014 hydrological years; the third category occurred 89 days and 86 days respectively in the 2012/2013 and 2013/2014 hydrological years. The fact that about 70 to 90% of the precipitation have occurred in accordance with the conditions laid down in the first and second category, in both hydrological years, is demonstrative of the concentration of the rainy season in a short period of time.
Data shows the influence of rain events in the dilution degree of the inflow to the WWTP. Considering COD, BOD and TSS mid values it also shows a tendency of data above these values in the dry period and data below these values in the wet period. Faecal coliforms are inconclusive.
The inflow/rainfall data also shows a strong correlation between between these two parameters, until the WWTP full capacity functioning. If the WWTP capacity is exceeded, in heavy and intense rainy days, this correlation no longer applies.
Figure 5 contains the data, considers the data collected in 2013/2014 hydrological year.
ID Area (ha)Pop
(inhab)
Basin 1 - Broma 198,5 13009
Basin 2 - Quartel 1454,5 77040
Basin 3 - Picheleira 19,4 4414
Basin 4 - Largo de Chelas 13,2 207
Basin 5 - R. de Cima a Chelas 9,6 1119
Basin 6 - R. Sol a Chelas 17,8 1228
Basin 7 - Emissário 1 32,1 2664

6
FIGURE 5 – a) Rainfall and inflow daily volumes to the WWTP Chelas in 2013/2014. b) Daily volumes and concentration of BOD5, TSS and COD, dry weather. c) Daily volumes and concentration of
BOD, TSS and COD, wet weather. d) Daily rainfall and concentration of faecal coliform.

7
d. Data collection campaigns
The need of obtaining real time data, for a proper study of the inflows to the WWTP, led to the planning and carry out of two data field campaigns, in order to monitor inflow quality. They took place at the WWTP entrance on 12-13 February and 27-28 March 2014. Figure 6 and 7 illustrates the results obtained.
The collected samples were target of analysis in Simtejo, S.A. and Instituto Superior Técnico labs according the current legislation.
FIGURE 6 – Field campaign held on 12 and 13th March 2014. a) Results for COD. b) Results for SST. c) Results for CF.
d) Flow rate registered at the entrance of the treatment plant.
The main aspect, in the first field campaign, to enhance are the low levels of COD, below the minimum legal values acquired, registered between 2 and 8 a.m.. Such results may be due to the fact that combined sewer flows are located in ancient water courses and during the night period, when residential wastewaters contribution is less significant, infiltration flow share is bigger and more relevant. However it is necessary to confirm such fact establishing a bigger set of campaigns to better define water quality parameters behavior facing rain events.
Other important aspect is the insignificant influence of rain event on the faecal coliform dilution levels.

8
FIGURE 7 – Field campaign held on 27 and 28th March 2014. a) Results for COD. b) Results for SST. c) Results for CF.
d) Flow rate registered at the entrance of the treatment plant.

9
In the second field campaign the main aspects to enhance are the malfunctioning of the WWTP, due to the high rain intensity observed in the event and maybe the malfunctioning of the flow meters and the occurrence of first flush clearly identified in the Figures.
To better comprehend the water quality behavior and first flush phenomenon is essential to plan several seasons of field campaigns in order to define the best treatment strategies according to the context which is part of the local urban drainage system. Also another important measures to be taken in a strategical and planning approach is the installation of flow meters in several origin locations in the interceptor system, allowing to understand what are the main areas responsible for the pollution loads and why.
6. Dynamic modeling of the hydraulic performance of Chelas interceptor
system using the SewerGEMS software
Dynamic modeling of the Chelas interception system was undertaken using SewerGEMS, from Bentley Systems, involving the interaction of networks made up of gravity and pumped sections (pipes under pressure). The main advantage of SewerGEMS is that it allows the set of different modeling scenarios, taking into account structural aspects of the network and operating different rain events with a single model. The main goals were to evaluate the hydraulic performance before and after the structural changes planned for the interceptor system and the study of the flow/waste water efficiency levels with the two referred scenarios, facing several rain events. Figure 8 presents the Chelas interception model using SewerGEMS.
FIGURE 8 – Chelas interceptor system modeled in SewerGEMS.
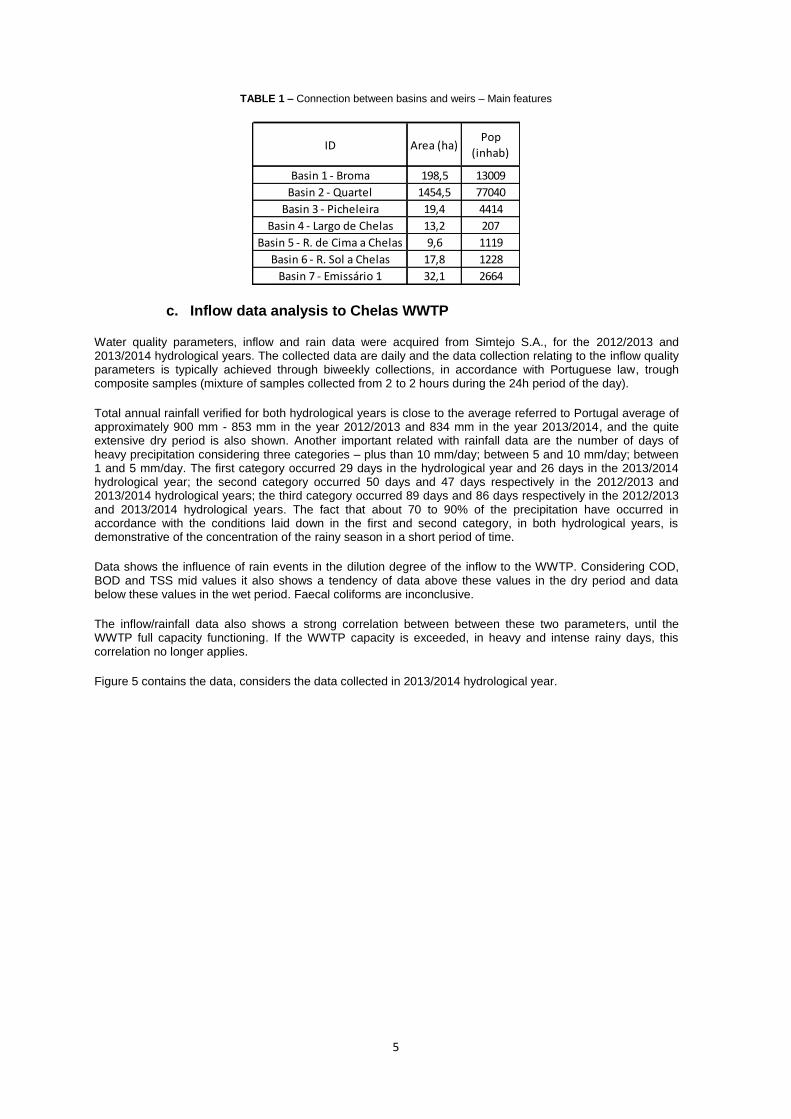
The main hydraulic profile can be observed in Figure 9.
10
FIGURE 9 – Main hydraulic profile of Chelas interceptor system
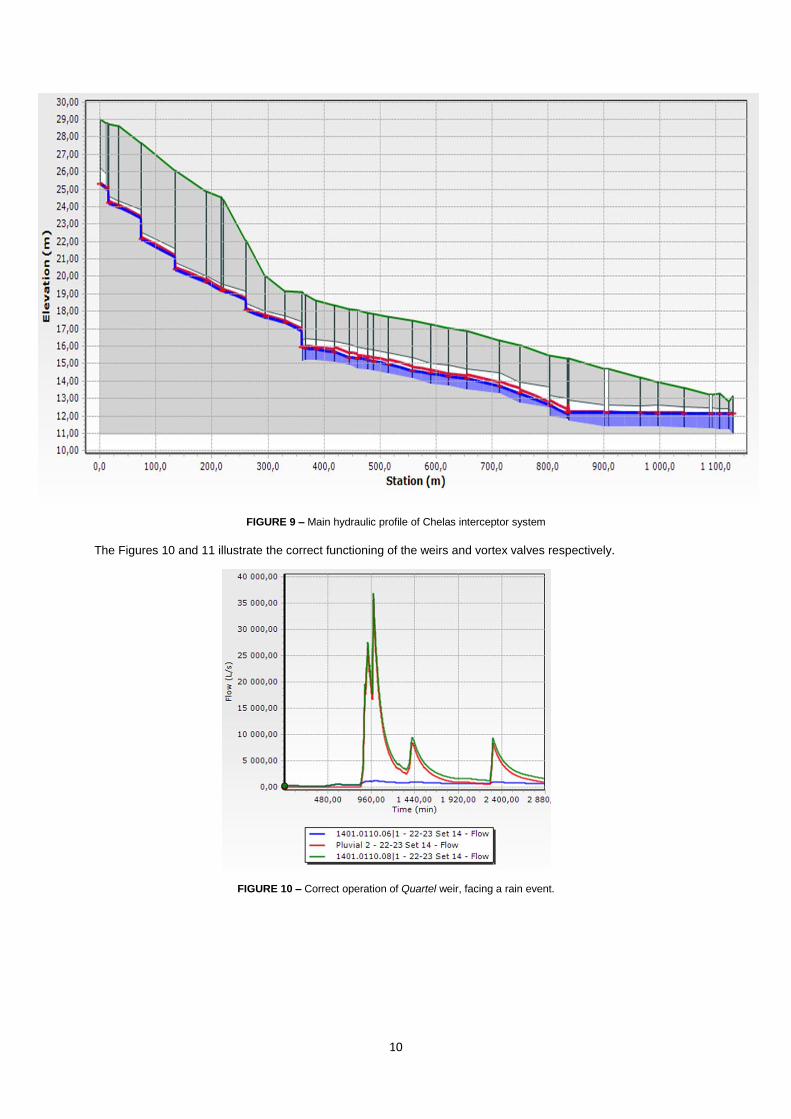
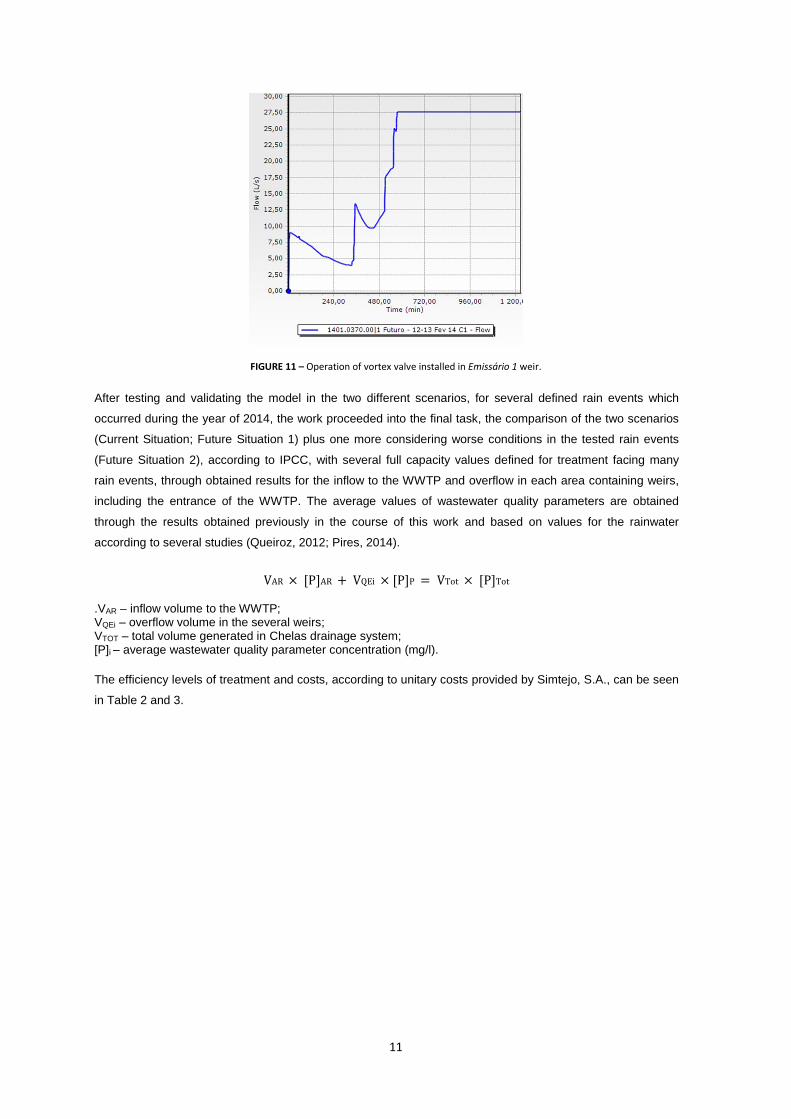
The Figures 10 and 11 illustrate the correct functioning of the weirs and vortex valves respectively.
FIGURE 10 – Correct operation of Quartel weir, facing a rain event.
11
FIGURE 11 – Operation of vortex valve installed in Emissário 1 weir.
After testing and validating the model in the two different scenarios, for several defined rain events which
occurred during the year of 2014, the work proceeded into the final task, the comparison of the two scenarios
(Current Situation; Future Situation 1) plus one more considering worse conditions in the tested rain events
(Future Situation 2), according to IPCC, with several full capacity values defined for treatment facing many
rain events, through obtained results for the inflow to the WWTP and overflow in each area containing weirs,
including the entrance of the WWTP. The average values of wastewater quality parameters are obtained
through the results obtained previously in the course of this work and based on values for the rainwater
according to several studies (Queiroz, 2012; Pires, 2014).
VAR × [P]AR + VQEi × [P]P = VTot × [P]Tot
.VAR – inflow volume to the WWTP; VQEi – overflow volume in the several weirs; VTOT – total volume generated in Chelas drainage system; [P]i – average wastewater quality parameter concentration (mg/l).
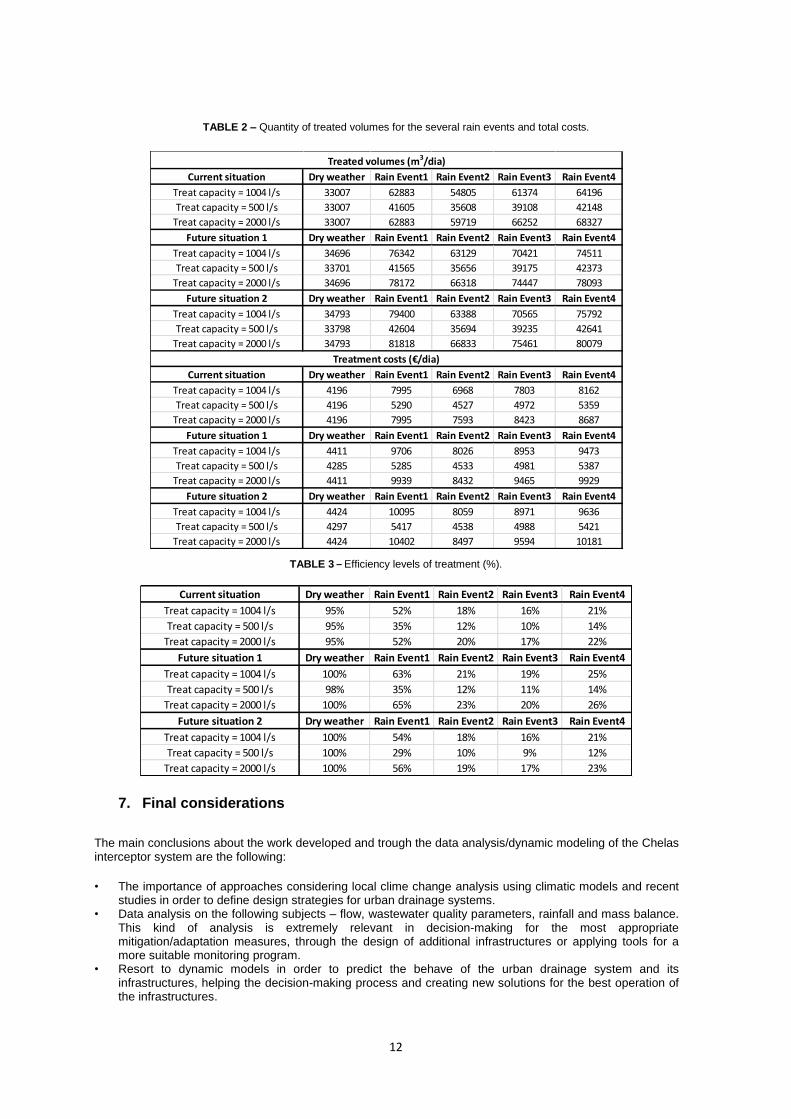
The efficiency levels of treatment and costs, according to unitary costs provided by Simtejo, S.A., can be seen
in Table 2 and 3.
12
TABLE 2 – Quantity of treated volumes for the several rain events and total costs.
TABLE 3 – Efficiency levels of treatment (%).
7. Final considerations
The main conclusions about the work developed and trough the data analysis/dynamic modeling of the Chelas interceptor system are the following:
• The importance of approaches considering local clime change analysis using climatic models and recent studies in order to define design strategies for urban drainage systems.
• Data analysis on the following subjects – flow, wastewater quality parameters, rainfall and mass balance. This kind of analysis is extremely relevant in decision-making for the most appropriate mitigation/adaptation measures, through the design of additional infrastructures or applying tools for a more suitable monitoring program.
• Resort to dynamic models in order to predict the behave of the urban drainage system and its infrastructures, helping the decision-making process and creating new solutions for the best operation of the infrastructures.
Current situation Dry weather Rain Event1 Rain Event2 Rain Event3 Rain Event4
Treat capacity = 1004 l/s 33007 62883 54805 61374 64196
Treat capacity = 500 l/s 33007 41605 35608 39108 42148
Treat capacity = 2000 l/s 33007 62883 59719 66252 68327
Future situation 1 Dry weather Rain Event1 Rain Event2 Rain Event3 Rain Event4
Treat capacity = 1004 l/s 34696 76342 63129 70421 74511
Treat capacity = 500 l/s 33701 41565 35656 39175 42373
Treat capacity = 2000 l/s 34696 78172 66318 74447 78093
Future situation 2 Dry weather Rain Event1 Rain Event2 Rain Event3 Rain Event4
Treat capacity = 1004 l/s 34793 79400 63388 70565 75792
Treat capacity = 500 l/s 33798 42604 35694 39235 42641
Treat capacity = 2000 l/s 34793 81818 66833 75461 80079
Current situation Dry weather Rain Event1 Rain Event2 Rain Event3 Rain Event4
Treat capacity = 1004 l/s 4196 7995 6968 7803 8162
Treat capacity = 500 l/s 4196 5290 4527 4972 5359
Treat capacity = 2000 l/s 4196 7995 7593 8423 8687
Future situation 1 Dry weather Rain Event1 Rain Event2 Rain Event3 Rain Event4
Treat capacity = 1004 l/s 4411 9706 8026 8953 9473
Treat capacity = 500 l/s 4285 5285 4533 4981 5387
Treat capacity = 2000 l/s 4411 9939 8432 9465 9929
Future situation 2 Dry weather Rain Event1 Rain Event2 Rain Event3 Rain Event4
Treat capacity = 1004 l/s 4424 10095 8059 8971 9636
Treat capacity = 500 l/s 4297 5417 4538 4988 5421
Treat capacity = 2000 l/s 4424 10402 8497 9594 10181
Treated volumes (m3/dia)
Treatment costs (€/dia)
Current situation Dry weather Rain Event1 Rain Event2 Rain Event3 Rain Event4
Treat capacity = 1004 l/s 95% 52% 18% 16% 21%
Treat capacity = 500 l/s 95% 35% 12% 10% 14%
Treat capacity = 2000 l/s 95% 52% 20% 17% 22%
Future situation 1 Dry weather Rain Event1 Rain Event2 Rain Event3 Rain Event4
Treat capacity = 1004 l/s 100% 63% 21% 19% 25%
Treat capacity = 500 l/s 98% 35% 12% 11% 14%
Treat capacity = 2000 l/s 100% 65% 23% 20% 26%
Future situation 2 Dry weather Rain Event1 Rain Event2 Rain Event3 Rain Event4
Treat capacity = 1004 l/s 100% 54% 18% 16% 21%
Treat capacity = 500 l/s 100% 29% 10% 9% 12%
Treat capacity = 2000 l/s 100% 56% 19% 17% 23%

13
References
Costa, A. C.; Santos, J. A.; & Pinto, J. G. (2012). Climate change scenarios for precipitation extremes in Portugal. Lisboa, Portugal. 217–234. http://doi.org/10.1007/s00704-011-0528-3 Duarte Santos, Filipe; Forbes, Keith; Moita, R. (2001). Mudança Climática em Portugal Cenários, impactes e medidas de adaptação SIAM. Lisboa, Portugal. Fundação Calouste Gulbenkian.
Durão, R., Pereira, M. J., Costa, A. C., & Real, J. M. (2009). Indices of precipitation extremes in Southern Portugal – a geostatistical approach. Lisbon, Portugal. Copernicus Publications: 241–250.
Ferreira, F. (2006). Modelação e gestão integrada de sistemas de águas residuais. Dissertação de doutoramento, Instituto Superior Técnico. Universidade Técnica de Lisboa.
Fonseca, T., Rosa, P., & Paulino, L. (2009). Subsistema de Chelas - Interceptores e emissários – Adaptação aos Sistemas Unitários. Lisboa. Simtejo - Saneamento Integrado dos Municípios do Tejo e Trancão, S.A.
Fragoso, M., & Gomes, P. T. (2008). Classification of daily abundant rainfall patterns and associated large-scale atmospheric circulation types in. International Journal of Climatology, July 2007, 544: 537–544. http://doi.org/10.1002/joc
Langeveld, J G; Schilperoort, R P S; Weijers, S. R. (2013). Climate change and urban wastewater infrastructure: There is more to explore. Journal of Hydrology, 476: 112–119. http://doi.org/10.1016/j.jhydrol.2012.10.021
Marques, R., & Marmelo, V. (2007). Subsistema de Chelas - Interceptores e emissários – Adaptação aos Sistemas Unitários. Lisboa. Saneamento Integrado dos Municípios do Tejo e Trancão, S.A.
Mines, Richard O; Lackey, Laura W; Behrend, G. R. (2007). The impact of rainfall on flows and loadings at Georgia’s wastewater treatment plants. GeorgiaWater Resources Conference, March 27–29, 2007. University of Georgia.
Monteiro, A. J. (2012). Documentos de apoio à disciplina de Drenagem Urbana e Controlo de Poluição, 1o semestre 2012/2013. Instituto Superior Técnico. https://fenix.tecnico.ulisboa.pt/disciplinas/DUCP-2/2012-2013/1-semestre
Nakicenovic, Nebojsa; Swart, R. (2000). IPCC Special Report Emissions Scenarios. Geneva, Switzerland. Intergovernmental Panel on Climate Change Working Group III.
Pachauri, R. K., & Reisinger, A. (2007). Climate Change 2007 Synthesis Report. Geneva, Switzerland. Intergovernmental Panel on Climate Change Working Group I, II, III.
Pereira, M. J., Costa, A. C., Delgado, J., & Soares, A. (2010). Spatial – temporal dynamics of precipitation extremes in southern Portugal: a geostatistical assessment study. International Journal of Climatology, 1537(August 2009), 1526–1537. http://doi.org/10.1002/joc.1999
Pires, C. R. (2014). Avaliação da qualidade de escorrências pluviais em meio urbano através de Análise de Componentes Principais. Dissertação de mestrado, Instituto Superior Técnico. Universidade Técnica de Lisboa.
Queiroz, G. (2012). Characterization of Stormwater Runoff in Lisbon Based on Microbial Source Tracking Methods. Dissertação de mestrado, Instituto Superior Técnico. Universidade Técnica de Lisboa.

14
Santos, F. D.; Miranda, P. (2006). Alterações Climáticas em Portugal Cenários, Impactos e Medidas de Adaptação PROJECTO SIAM II. Lisboa. Gradiva.
Santos, J. A., & Leite, S. M. (2005). Weather Regimes and their connection to the winter rainfall in Portugal. International Journal of Climatology, 50: 33–50. http://doi.org/10.1002/joc.1101
Semadeni-Davies, Annette; Hernebring, Claes; Svensson, Gilbert; Gustafsson, L.-G. (2008). The impacts of climate change and urbanisation on drainage in Helsingborg, Sweden: Combined sewer system. Journal of Hydrology, 350: 100–113. http://doi.org/10.1016/j.jhydrol.2007.05.028
Szabo, Jeffrey G; Buchberger, Steven G; Bishop, P. L. (2005). Performance of Wet Weather Treatment Facility for Control of Combined Sewer Overflows: Case Study in Cincinnati , Ohio. Journal of Environmental Engineering, March 2005: 375–387.
Trigo, R; J. Osborn, T; Côrte-Real, J. (2002). Influência da Oscilação do Atlântico Norte no Clima do Continente Europeu e no caudal dos rios Ibéricos Atlânticos. Lisboa. Finisterra, XXXVII, 73: 5-31.


![Theorist helps develop first single molecule CHELAS AND ...€¦ · CHELAS AND LAY CHELAS [The Theosophist, Vol. IV, Supplement to No. 10, July, 1883, pp. 10-11] As the word Chela](https://img.dokumen.tips/doc/110x75/5f92b9ec90238c18ca335e8c/theorist-helps-develop-first-single-molecule-chelas-and-chelas-and-lay-chelas.jpg)