Embed Size (px)
Citation preview
1
Florian Markowetzmarkowetzlab.org
Analysis ofglobally coherent datasets
From enrichment and clustersto networks and mechanisms
“A SNP in FGFR2promotes cancer
susceptibility”
“Silencing a single genedeforms morphology”
“HER2 positivebreast cancers arevery aggressive”
Boutros and Ahringer, Nat Rev 2008
FGFR2 gene
homozygous odds ratio: 1.63heterozygous odds ratio: 1.22
Meyer et al, 2008; Easton et al 2007
perturbationperturbation
copy number alterationamplification
deletion SNP
RNA interferenceKnock-out
genome-wide
pathway-specific

2
phenotypephenotype
cancer subtypes
different risk groups
morphologyviability
differential gene expression
phenotypephenotype
perturbationperturbation
networksnetworks
Natural perturbationsPerturbation• copy-number alterationsNetwork• Pathways and regulatory
networks in the cellPhenotype• disease subtypes, survival, etcGoal• find regulatory hotspots to
explain heterogeneity ofdisease
Our lab
Experimental perturbationsPerturbations• RNA interferenceNetwork• Signal transduction pathwaysPhenotype• differential gene expression
downstream of pathwayGoal• Reconstruct pathway
3
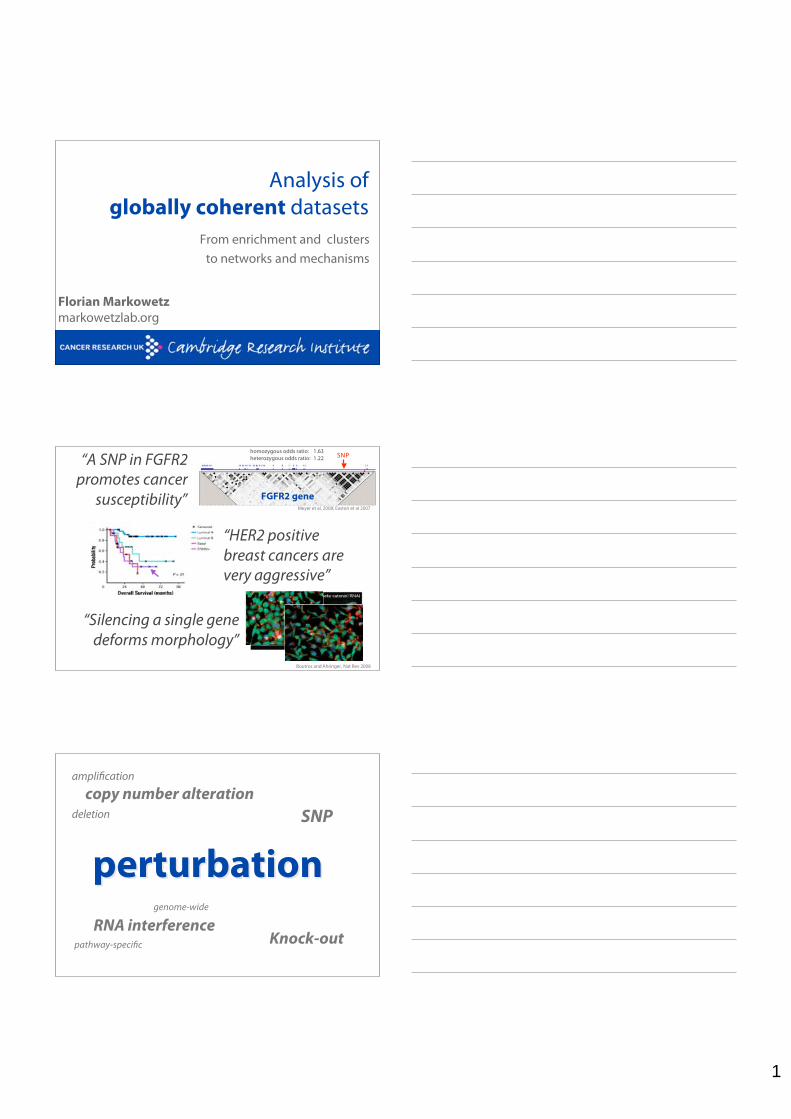
What is globally coherent data?Phenotype
DNA Intermediate phenotype
SNPs
Copy-numberalterations mRNAproteins
metabolites
e.g. Q
TLs
e.g. marker genes
e.g. eQTLs
survival
cancer subtypesobesity
Examples of Globally Coherent Data
METABRIC @ CRI2000 breast tumours
Challenges of Globally Coherent Data
linking/integrating/comparing different data types– find homogeneous sub-types of heterogeneous disease
with impact on outcome– Mechanistic explanation of observed changes (“causal
models”)– not single marker, but complete story
• methods applicable in many other integrative tasks(eg microRNA + expression)

4
Keith Haring, Untitled, 1986
Urs Wehrli, Tidying Up Art, 2003
This course is about tools
DataPre-
processing Analysis Follow-up Result
Raw clay
Quality co
ntrol
sanity
check
s
Statistic
s
Machine le
arning
et al Sto
ry
Yeah!
We are here!
Programme
Todaymorning• lectures on statistical and
machine learning conceptsto analyse GCDs (FM)
afternoon• practical session to try
them out on real data (YY,MC)
Tomorrowmorning• Discussion of tools from
day 1, merits and pitfalls,how best to use them foryour projects (FM)
afternoon• practical session continues
(YY, MC)

5
Overview
Clustering• Hierarchical clustering, Mixture models, Dirichlet process,
Bayesian hierarchical clustering, integrative clusteringEnrichment• hypergeometric test, Gene set enrichment analysis, rich
subnetworks, HTSanalyzeRNetworks• Schadt’s ‘causal’ networks, Bayesian networks, conditional
independence• DANCE: Differential regulation in different disease sub-
types, NEMs: Nested Effects Models
Genes -> networks -> disease
clustering + enrichment = story
6
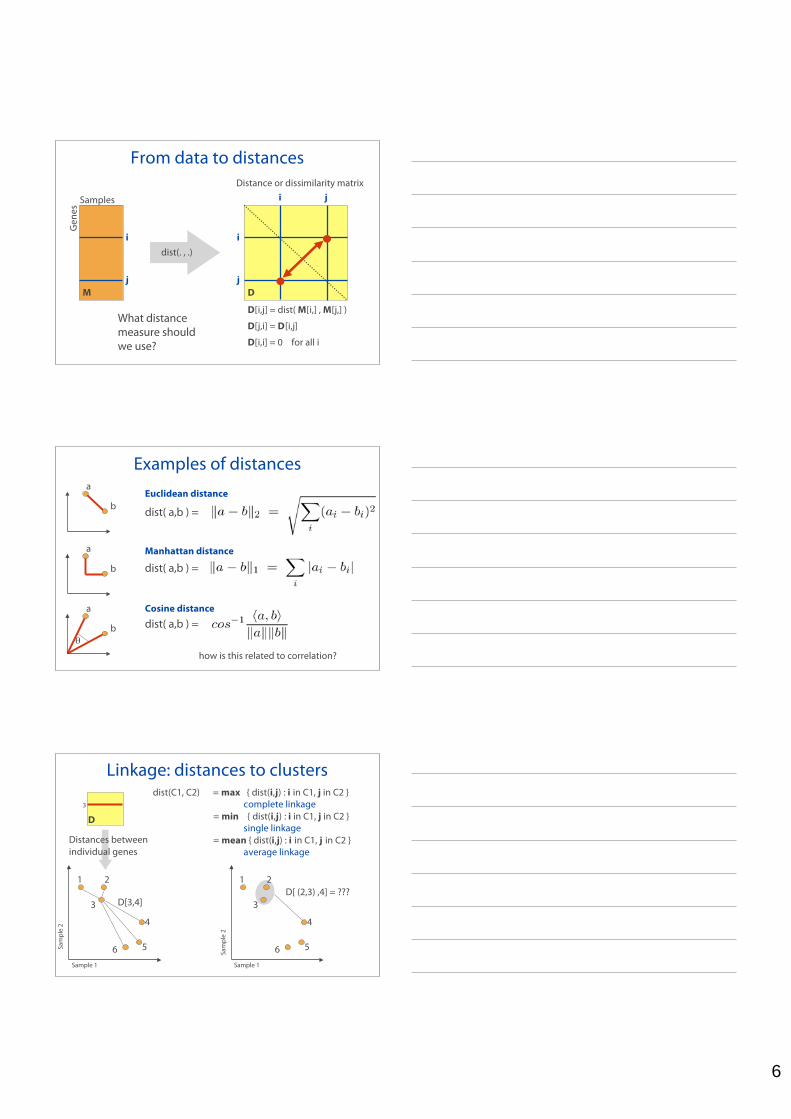
From data to distances
Samples
Gen
es
i
j
i
j
j
i
D[i,j] = dist( M[i,] , M[j,] )
M D
D[j,i] = D[i,j]
D[i,i] = 0 for all i
dist(. , .)
What distancemeasure shouldwe use?
Distance or dissimilarity matrix
a
bEuclidean distance
dist( a,b ) =
Examples of distances
a
b dist( a,b ) =Manhattan distance
a
b dist( a,b ) =Cosine distance
how is this related to correlation?
Linkage: distances to clusters
D
Sam
ple
2
Sample 1
1 2
3
6 5
4
D[3,4]
1 2
3
6 5
4
Sam
ple
2
Sample 1
D[ (2,3) ,4] = ???
dist(C1, C2) = max { dist(i,j) : i in C1, j in C2 }complete linkage
= min { dist(i,j) : i in C1, j in C2 }single linkage
= mean { dist(i,j) : i in C1, j in C2 }average linkage
Distances between individual genes
3
7
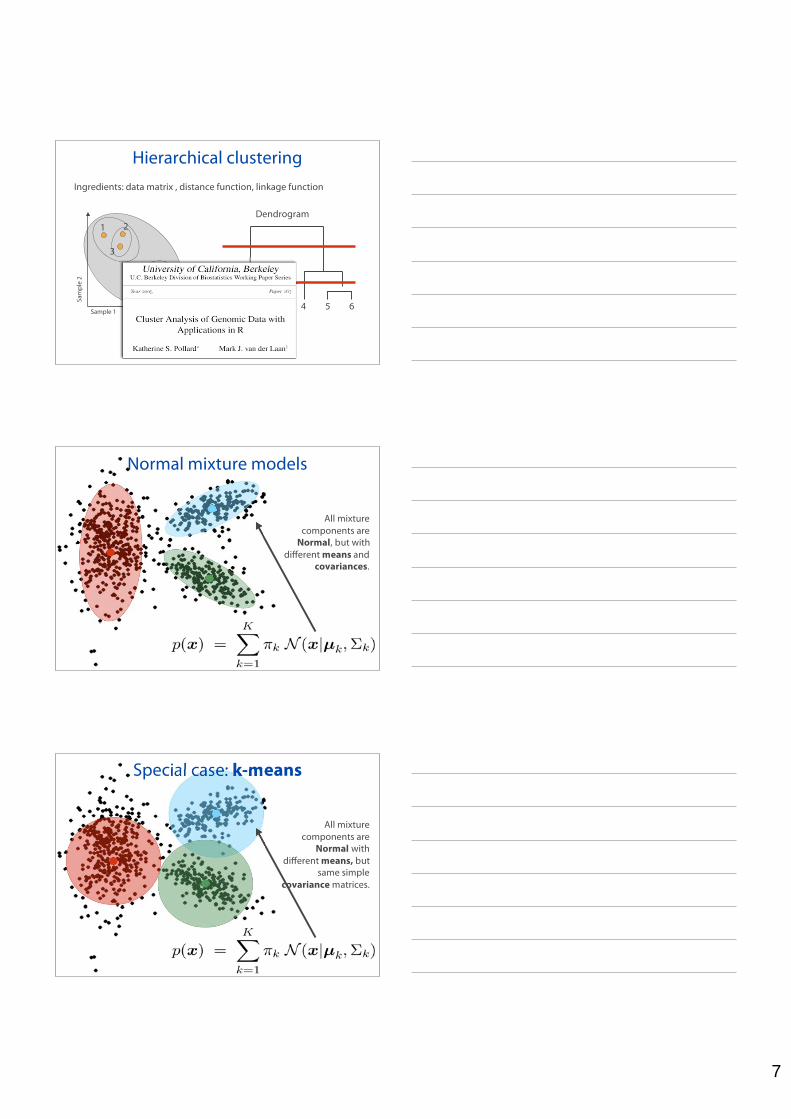
Hierarchical clusteringIngredients: data matrix , distance function, linkage function
Sam
ple
2
Sample 1
1 2
3
6 5
4
1 2 3 654
Dendrogram
Normal mixture models
All mixturecomponents are
Normal, but withdifferent means and
covariances.
Special case: k-means
All mixturecomponents are
Normal withdifferent means, but
same simplecovariance matrices.
8
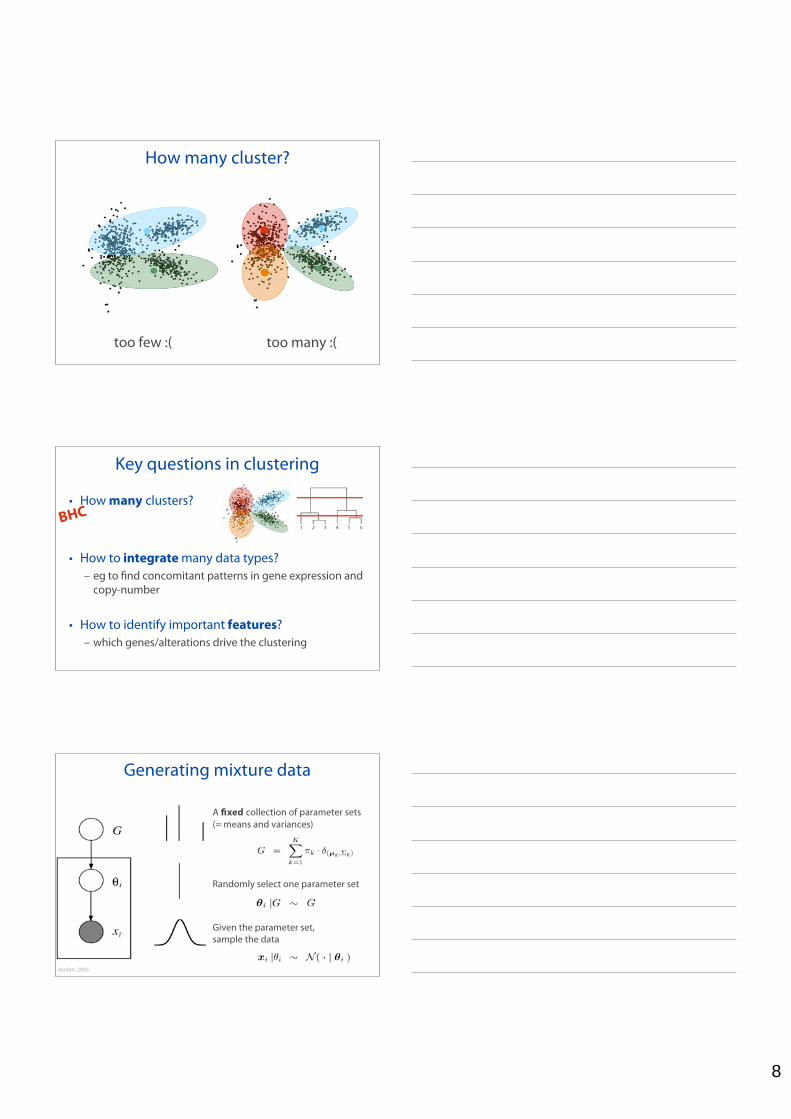
How many cluster?
too few :( too many :(
Key questions in clustering
• How many clusters?
• How to integrate many data types?– eg to find concomitant patterns in gene expression and
copy-number
• How to identify important features?– which genes/alterations drive the clustering
BHC
Generating mixture data
A fixed collection of parameter sets(= means and variances)
Randomly select one parameter set
Given the parameter set, sample the data
Jordan, 2005
9
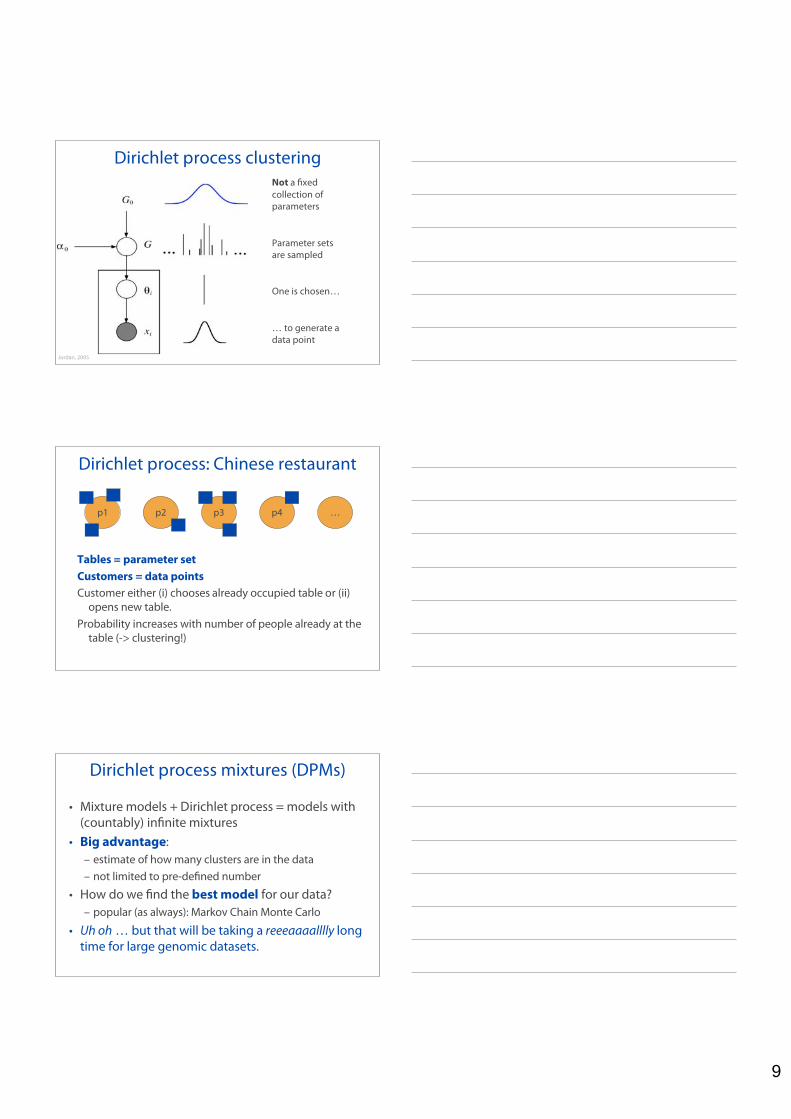
Dirichlet process clusteringNot a fixedcollection ofparameters
Parameter setsare sampled
One is chosen…
… to generate adata point
Jordan, 2005
Dirichlet process: Chinese restaurant
p1 p2 p4p3 …
Tables = parameter setCustomers = data pointsCustomer either (i) chooses already occupied table or (ii)
opens new table.Probability increases with number of people already at the
table (-> clustering!)
Dirichlet process mixtures (DPMs)
• Mixture models + Dirichlet process = models with(countably) infinite mixtures
• Big advantage:– estimate of how many clusters are in the data– not limited to pre-defined number
• How do we find the best model for our data?– popular (as always): Markov Chain Monte Carlo
• Uh oh … but that will be taking a reeeaaaalllly longtime for large genomic datasets.
10
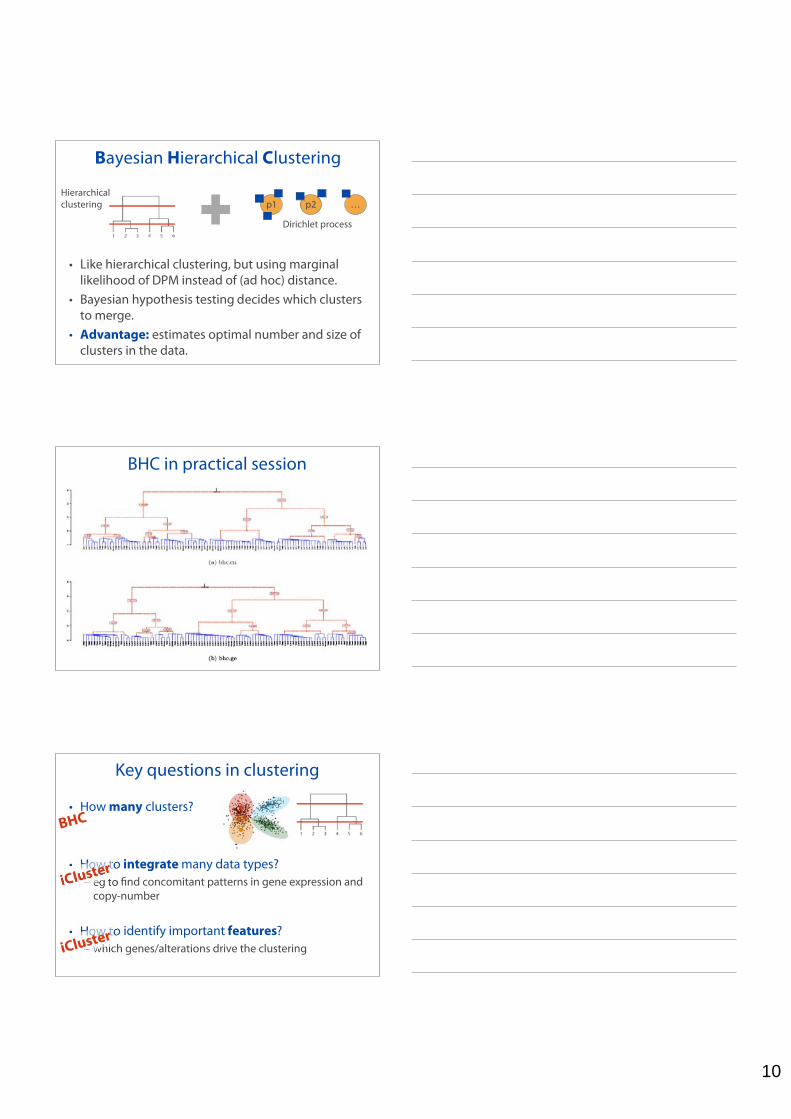
Bayesian Hierarchical Clustering
• Like hierarchical clustering, but using marginallikelihood of DPM instead of (ad hoc) distance.
• Bayesian hypothesis testing decides which clustersto merge.
• Advantage: estimates optimal number and size ofclusters in the data.
p1 p2 …
Dirichlet process
Hierarchical clustering
BHC in practical session
Key questions in clustering
• How many clusters?
• How to integrate many data types?– eg to find concomitant patterns in gene expression and
copy-number
• How to identify important features?– which genes/alterations drive the clustering
iCluster
iCluster
BHC
11
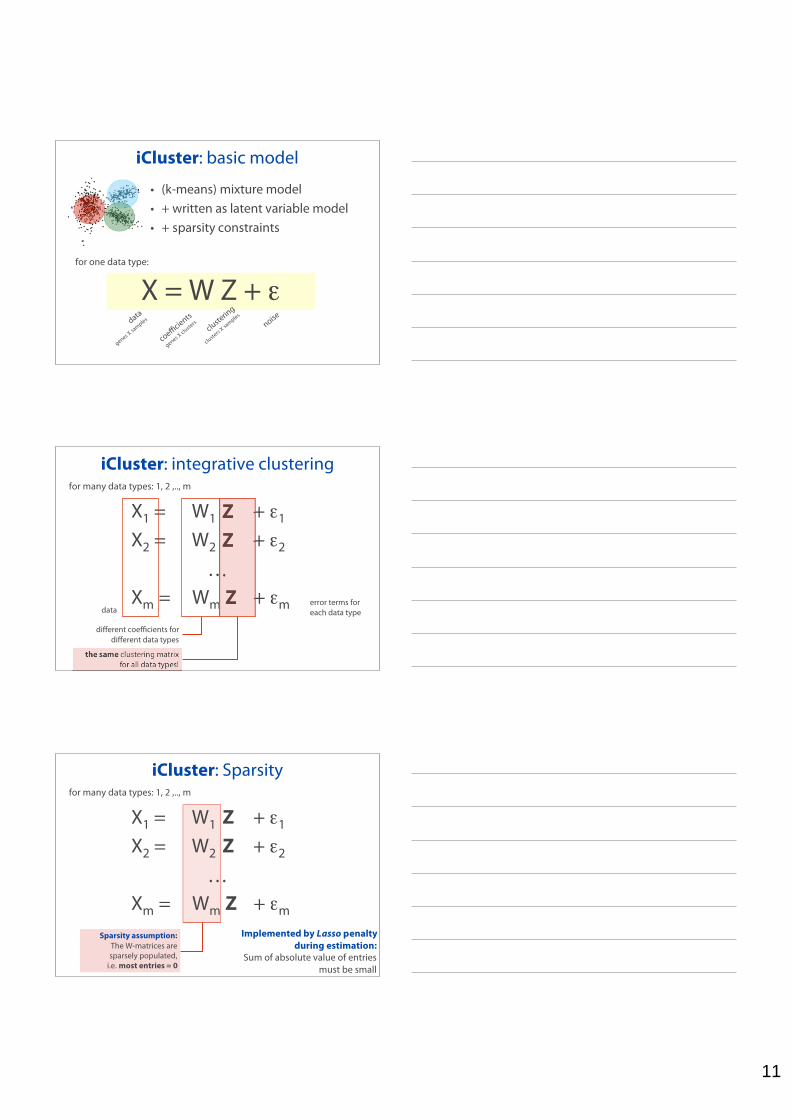
iCluster: basic model
• (k-means) mixture model• + written as latent variable model• + sparsity constraints
X = W Z + data
genes X sa
mples
coefficients
genes X cluste
rscluste
ring
clusters
X samples
noise
for one data type:
iCluster: integrative clustering
X1 = W1 Z + 1
X2 = W2 Z + 2
…Xm = Wm Z + m
for many data types: 1, 2 ,.., m
dataerror terms foreach data type
different coefficients fordifferent data types
the same clustering matrixfor all data types!
iCluster: Sparsityfor many data types: 1, 2 ,.., m
Sparsity assumption:The W-matrices aresparsely populated,
i.e. most entries = 0
X1 = W1 Z + 1
X2 = W2 Z + 2
…Xm = Wm Z + m
Implemented by Lasso penaltyduring estimation:
Sum of absolute value of entriesmust be small
12
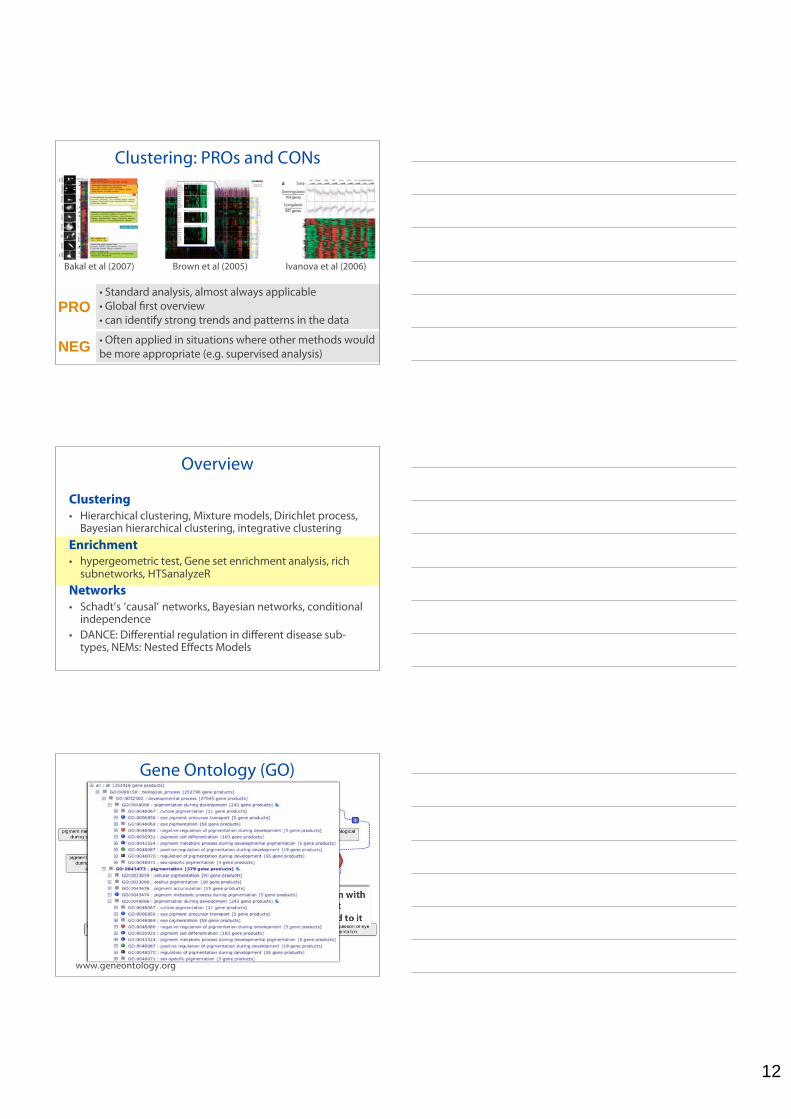
Clustering: PROs and CONs
Brown et al (2005) Ivanova et al (2006)Bakal et al (2007)
• Standard analysis, almost always applicable• Global first overview• can identify strong trends and patterns in the data
PRO
NEG• Often applied in situations where other methods wouldbe more appropriate (e.g. supervised analysis)
Overview
Clustering• Hierarchical clustering, Mixture models, Dirichlet process,
Bayesian hierarchical clustering, integrative clusteringEnrichment• hypergeometric test, Gene set enrichment analysis, rich
subnetworks, HTSanalyzeRNetworks• Schadt’s ‘causal’ networks, Bayesian networks, conditional
independence• DANCE: Differential regulation in different disease sub-
types, NEMs: Nested Effects Models
Gene Ontology (GO)
www.geneontology.org
A GO Term with a gene set annotated to it
13
Over-representation analysis
Weak Stronggenes ranked bystrength of phenotype
All genes
All HitsHits in GO term
Genes in GO term
Hyper-geometric test
Collection of gene sets
Hyper-geometric distribution
N genes altogether
n hitsk hits in GO term
m genes in GO term
Probability to observek hits in GO term
Number of possibilities to choose n hits out of N genes
k hits fall intothe GO term ofsize m
The other n-k hitsare all genes outside
the GO term
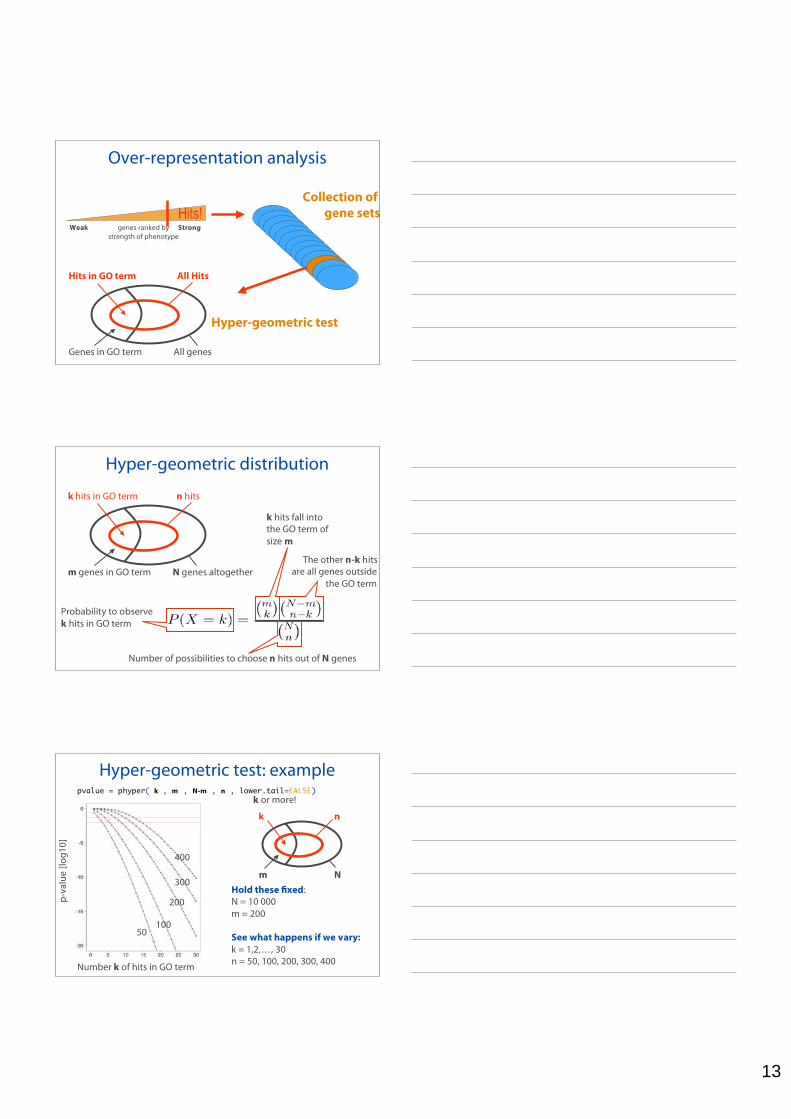
Hyper-geometric test: example
N
nk
m
pvalue = phyper( k , m , N-m , n , lower.tail=FALSE)
Hold these fixed:N = 10 000m = 200
See what happens if we vary:k = 1,2,…, 30n = 50, 100, 200, 300, 400Number k of hits in GO term
p-va
lue
[log1
0]
50100
200
300
400
k or more!
14
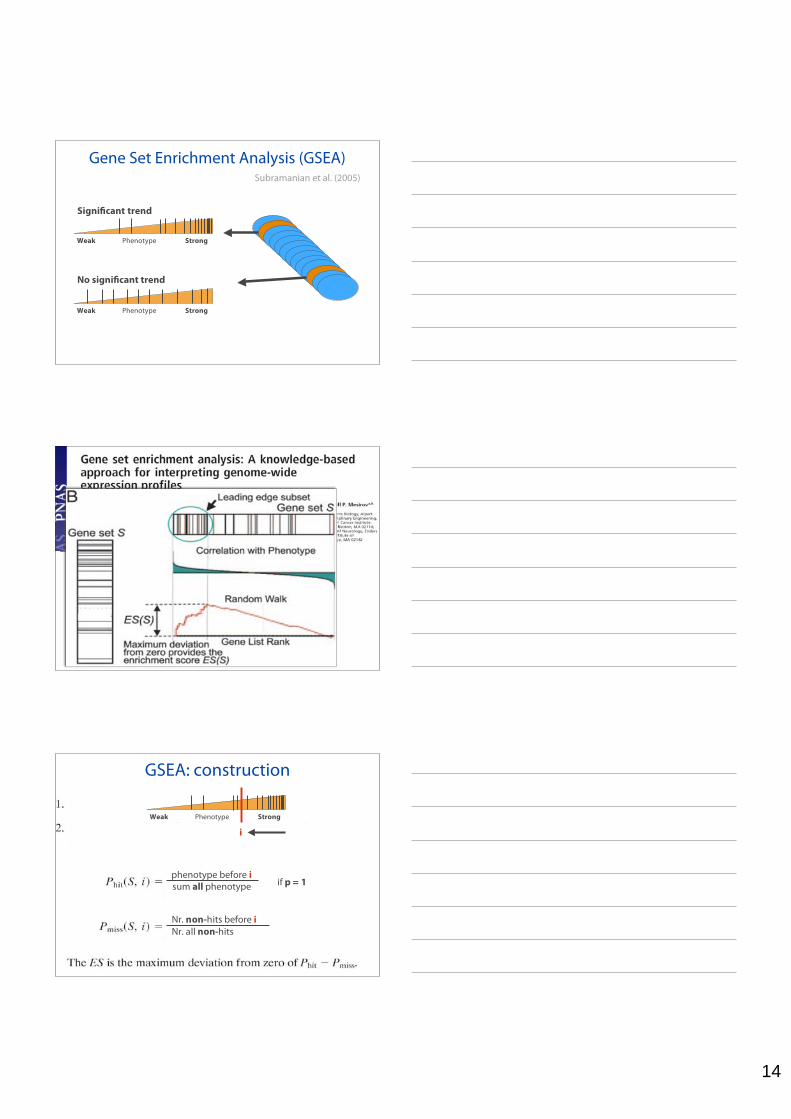
Gene Set Enrichment Analysis (GSEA)
Weak StrongPhenotype
Weak StrongPhenotype
No significant trend
Significant trend
Subramanian et al. (2005)
GSEA: construction
Weak StrongPhenotype
Nr. non-hits before iNr. all non-hits
i
Nr. hits before iNr. all hits if p = 0phenotype before i sum all phenotype if p = 1

15
GSEA: examples
Differential GSEA
Weak StrongPhenotype
Weak StrongPhenotype
Phenotype 1
Phenotype 2
PROs and CONs
Gene set 1Gene set 2Gene set 3Gene set 4
…
e.g. Wnt pathway
DNA repairChromosome 1
Expressed in liver
p-values (hyper-geometric or GSEA)
Advantages:• standard analysis• comprehensive first overview• “unbiased” and “hypothesis-free”
Disadvantages:• “unbiased” and “hypothesis-free”• relies on known gene sets• can not uncover new pathways• pathway = “unconnected” gene set• soon: more gene sets than genes!
Result:

16
Sub-networks rich in hits
Sub-networkswith highly correlated phenotypes
Which networks?
Networks from large-scale experiments
Networks from analyzing theexperimental literature
Networks fromprobabilistic dataintegration
17
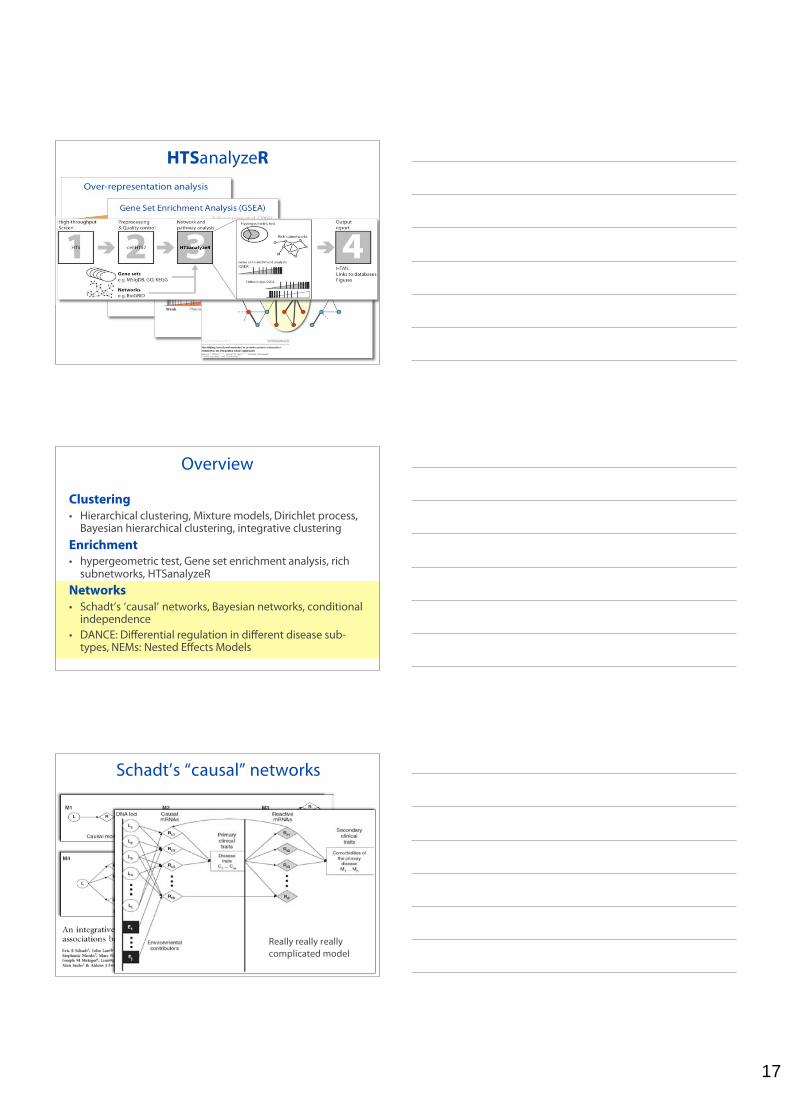
HTSanalyzeR
Overview
Clustering• Hierarchical clustering, Mixture models, Dirichlet process,
Bayesian hierarchical clustering, integrative clusteringEnrichment• hypergeometric test, Gene set enrichment analysis, rich
subnetworks, HTSanalyzeRNetworks• Schadt’s ‘causal’ networks, Bayesian networks, conditional
independence• DANCE: Differential regulation in different disease sub-
types, NEMs: Nested Effects Models
Schadt’s “causal” networks
Nature Genetics 2005
Really really reallycomplicated model
18
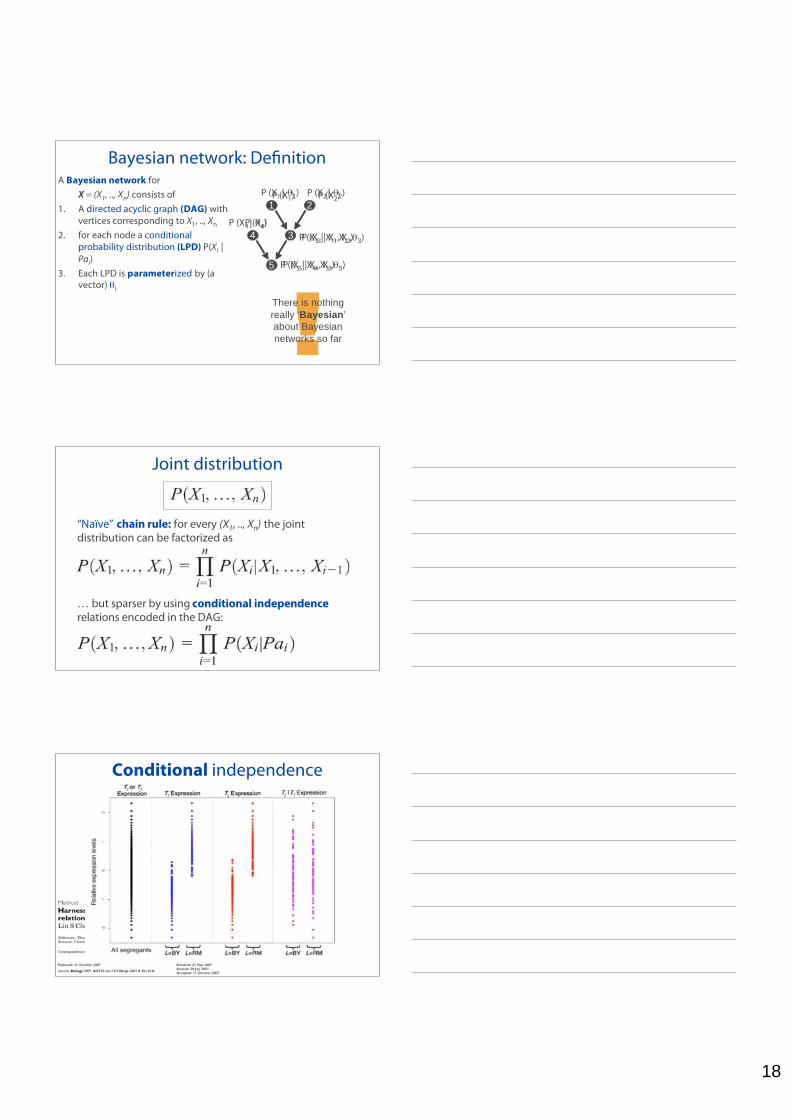
Bayesian network: DefinitionA Bayesian network for
X = (X1, .., Xn) consists of1. A directed acyclic graph (DAG) with
vertices corresponding to X1, .., Xn
2. for each node a conditionalprobability distribution (LPD) P(Xi |Pai)
3. Each LPD is parameterized by (avector) i
1 2
34
5
P (X3 | X1, X2)
P (X5 | X4, X3)
P (X1) P (X2)
P (X4)P (X3 | X1, X2 , 3)
P (X5 | X4, X3 , 5)
P (X1 | 1) P (X2 | 2)
P (X4 | 4)
There is nothing
really ‘Bayesian’
about Bayesian
networks so far
Joint distribution
“Naïve” chain rule: for every (X1, .., Xn) the jointdistribution can be factorized as
… but sparser by using conditional independencerelations encoded in the DAG:
Conditional independence
19
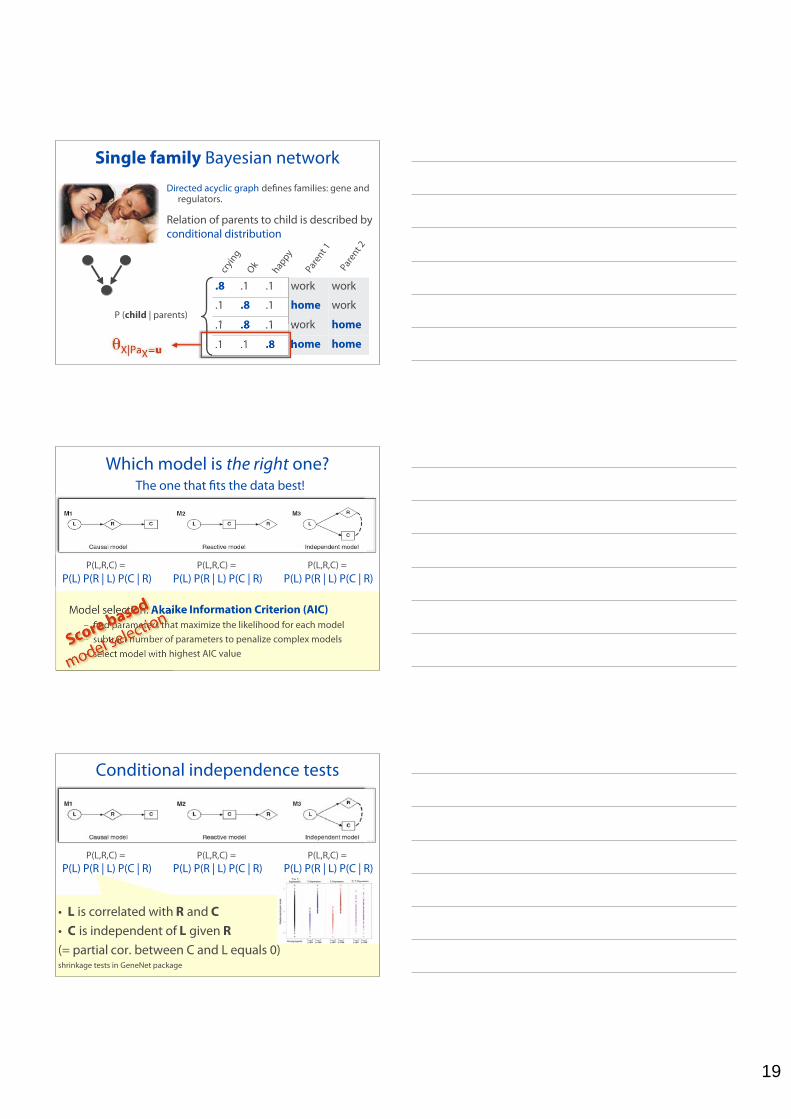
Single family Bayesian network
Directed acyclic graph defines families: gene andregulators.
homehome.8.1.1
homework.1.8.1
workhome.1.8.1
workwork.1.1.8
cryin
gOk hap
py
Paren
t 1
Paren
t 2
P (child | parents)
Relation of parents to child is described byconditional distribution
X|PaX=u
Which model is the right one?The one that fits the data best!
Model selection: Akaike Information Criterion (AIC)– find parameters that maximize the likelihood for each model– subtract number of parameters to penalize complex models– select model with highest AIC value
P(L,R,C) = P(L) P(R | L) P(C | R)
P(L,R,C) = P(L) P(R | L) P(C | R)
P(L,R,C) = P(L) P(R | L) P(C | R)
Score based
model selection
Conditional independence tests
P(L,R,C) = P(L) P(R | L) P(C | R)
P(L,R,C) = P(L) P(R | L) P(C | R)
P(L,R,C) = P(L) P(R | L) P(C | R)
• L is correlated with R and C• C is independent of L given R(= partial cor. between C and L equals 0)shrinkage tests in GeneNet package
20
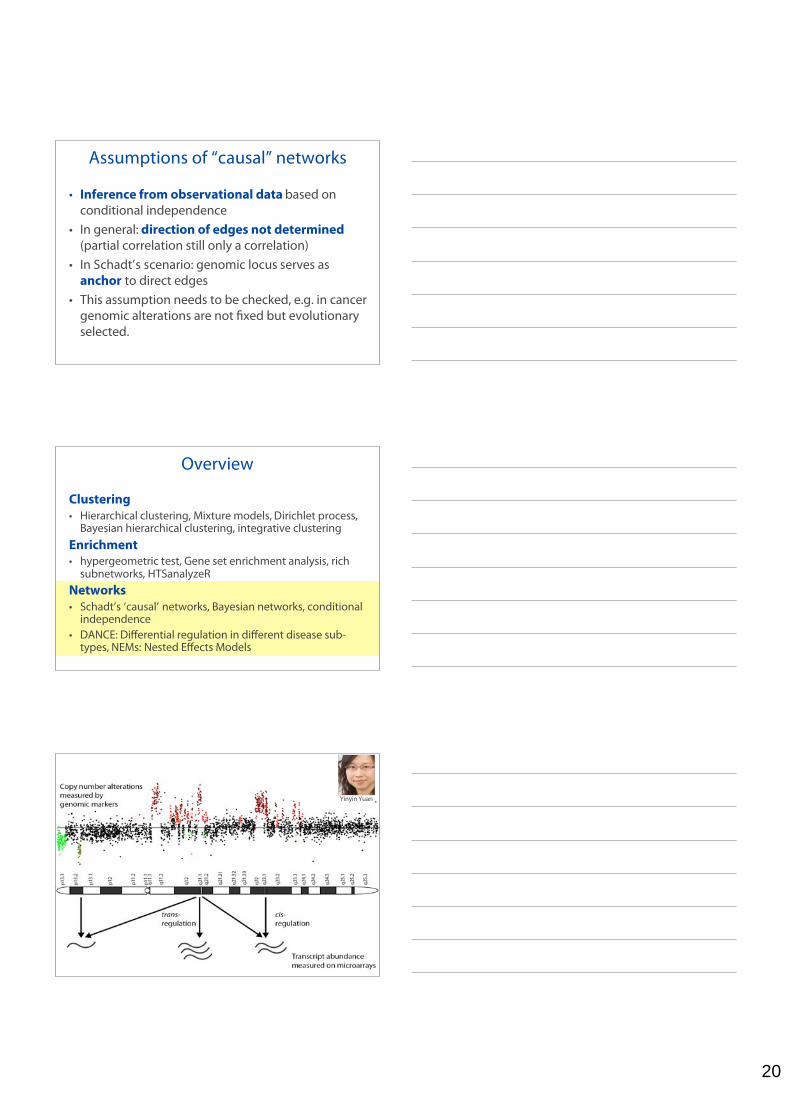
Assumptions of “causal” networks
• Inference from observational data based onconditional independence
• In general: direction of edges not determined(partial correlation still only a correlation)
• In Schadt’s scenario: genomic locus serves asanchor to direct edges
• This assumption needs to be checked, e.g. in cancergenomic alterations are not fixed but evolutionaryselected.
Overview
Clustering• Hierarchical clustering, Mixture models, Dirichlet process,
Bayesian hierarchical clustering, integrative clusteringEnrichment• hypergeometric test, Gene set enrichment analysis, rich
subnetworks, HTSanalyzeRNetworks• Schadt’s ‘causal’ networks, Bayesian networks, conditional
independence• DANCE: Differential regulation in different disease sub-
types, NEMs: Nested Effects Models
Yinyin Yuan
21
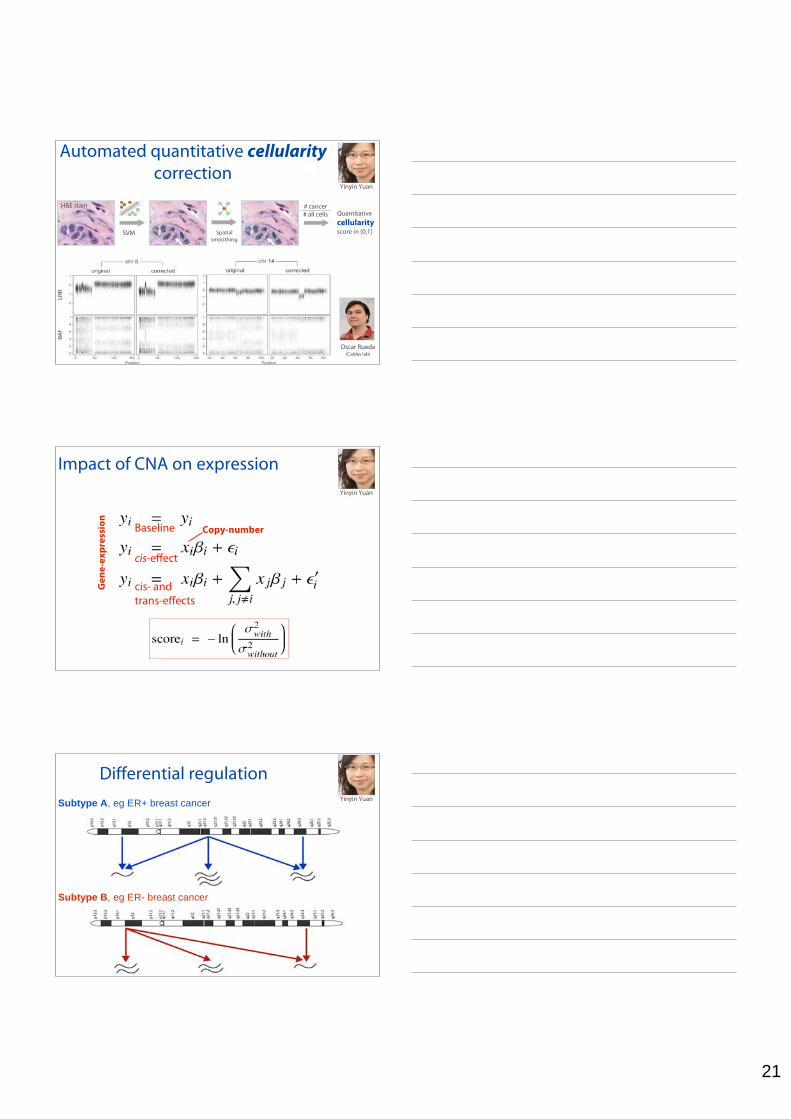
Automated quantitative cellularitycorrection
Yinyin Yuan
SVM Spatialsmoothing
Quantitativecellularity score in [0,1]
# cancer# all cells
H&E stain
Oscar Rueda(Caldas lab)
Impact of CNA on expression
Baseline
cis-effect
cis- andtrans-effects
Gen
e-ex
pres
sion
Copy-number
Yinyin Yuan
Differential regulationSubtype A, eg ER+ breast cancer
Subtype B, eg ER- breast cancer
Yinyin Yuan
22
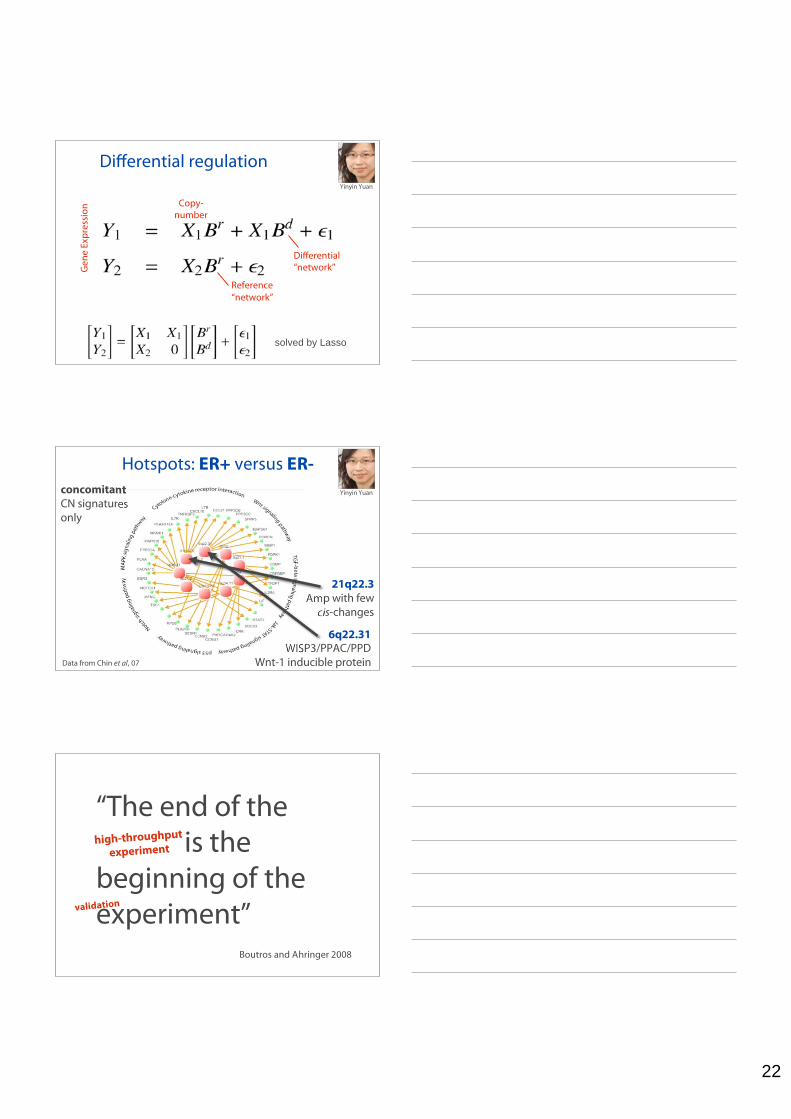
Differential regulation
Gen
e Ex
pres
sion
Copy-number
Differential“network”
Reference“network”
solved by Lasso
Yinyin Yuan
Yinyin Yuan
Data from Chin et al, 07
21q22.3Amp with few
cis-changes
concomitantCN signaturesonly
Hotspots: ER+ versus ER-
6q22.31WISP3/PPAC/PPD
Wnt-1 inducible protein
“The end of thescreen is thebeginning of theexperiment”
Boutros and Ahringer 2008
high-throughput
experiment
validation
23
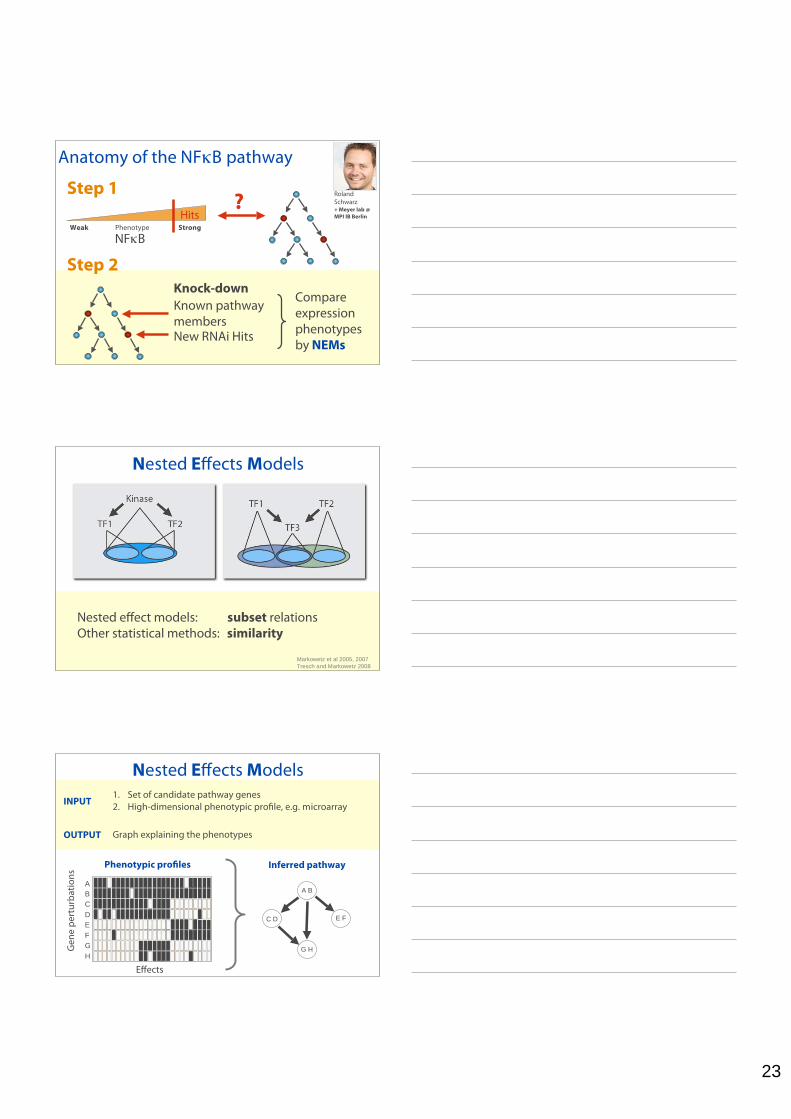
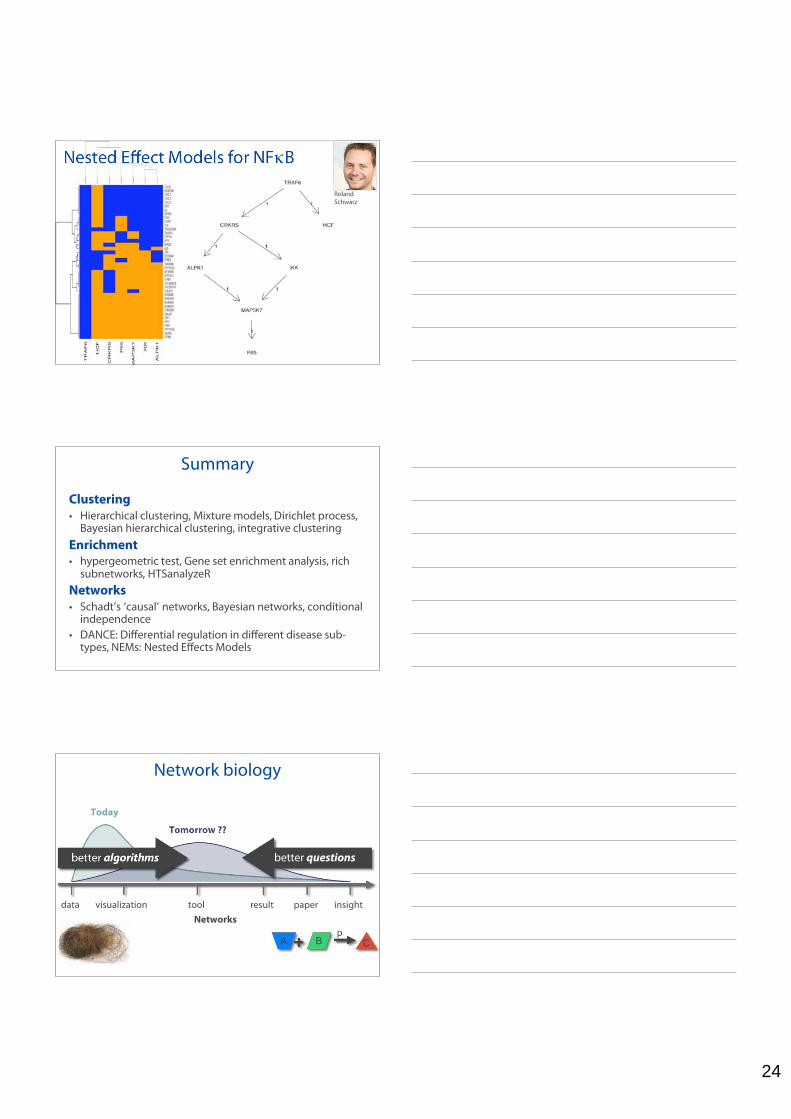
Anatomy of the NF B pathway
Weak StrongPhenotype
Step 1
Step 2
Hits
Knock-downKnown pathway membersNew RNAi Hits
Compareexpression phenotypesby NEMs
NF B
Roland Schwarz+ Meyer lab @MPI IB Berlin
?
TF1 TF2
Kinase TF1 TF2
TF3
Nested effect models: subset relationsOther statistical methods: similarity
Markowetz et al 2005, 2007
Tresch and Markowetz 2008
Nested Effects Models
Nested Effects Models
Inferred pathway
A B
C D E F
G H
Phenotypic profiles
A
B
C
F
D
H
E
GGen
e pe
rtur
batio
ns
Effects
1. Set of candidate pathway genes2. High-dimensional phenotypic profile, e.g. microarrayINPUT
OUTPUT Graph explaining the phenotypes
24
Roland Schwarz
Nested Effect Models for NF B
Summary
Clustering• Hierarchical clustering, Mixture models, Dirichlet process,
Bayesian hierarchical clustering, integrative clusteringEnrichment• hypergeometric test, Gene set enrichment analysis, rich
subnetworks, HTSanalyzeRNetworks• Schadt’s ‘causal’ networks, Bayesian networks, conditional
independence• DANCE: Differential regulation in different disease sub-
types, NEMs: Nested Effects Models
data visualization result paper insight
Today
Tomorrow ??
tool
A B C+p
better algorithms better questions
Network biology
Networks
25
“We do network analysis”what network?
what analysis?
“The network is a model”Model of what?
mechanistic model or predictive?
“The network”‘The’ or ‘A’?
Which one?
Is the network the solution?More than (just) a cluster?
Would anotherrepresentation be clearer?
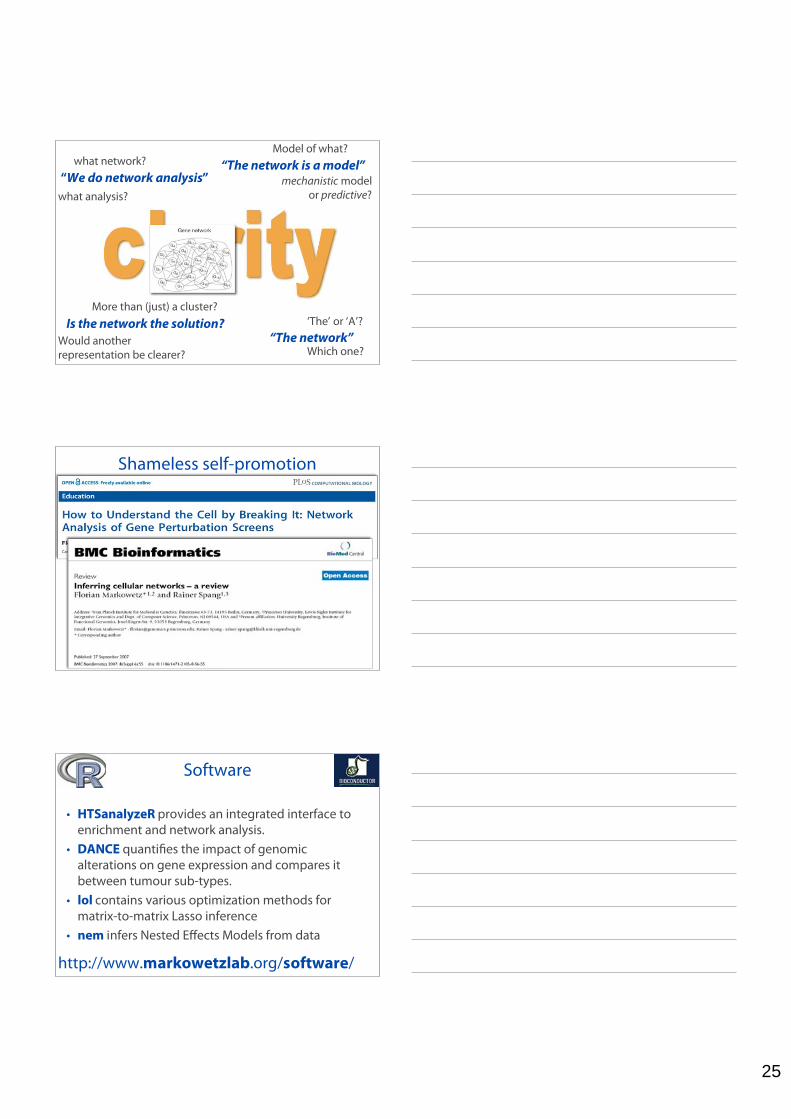
Shameless self-promotion
http://www.markowetzlab.org/software/
Software
• HTSanalyzeR provides an integrated interface toenrichment and network analysis.
• DANCE quantifies the impact of genomicalterations on gene expression and compares itbetween tumour sub-types.
• lol contains various optimization methods formatrix-to-matrix Lasso inference
• nem infers Nested Effects Models from data

26
Some take home messages
• Large chunks of network analysis are based onclustering and enrichment.
• Most of the rest is based on conditionalindependence and (sparse) regression.
• Big networks tend to be hairy. Avoid the hairball byasking more focused questions.
• Network analysis is even (more?) useful whentargeting a single pathway .
Practical session
Clustering• Hierarchical clustering, BHC: Bayesian hierarchical
clustering, iCluster: integrative clusteringEnrichment• Hypergeometric test, Gene set enrichment analysis,
BioNet: rich subnetworks, HTSanalyzeRNetworks• Schadt’s ‘causal’ networks, conditional independence• DANCE: Differential regulation in different disease sub-
types
Yinyin Yuan Mauro Castro
the team
27
Cambridge Breast CancerFunctional Genomics
Carlos CaldasSuet-Feung Chin
Stefan GräfOscar RuedaZhihao Ding
Irene PapatheodorouElena Provenzano
Helen BardwellHans Kristian Moen Vollan
Edouard Hatton
Cambridge Ovarian CancerFunctional Genomics
James Brenton
Cambridge CompBio & StatsSimon TavaréChristina Curtis
Andy LynchShamith Samarajiwa
Doug SpeedInma Spiteri
Cambridge CompBioFlorian Markowetz
Yinyin Yuan
CRI Bioinformatics CoreMatt Eldridge
Mark DunningRoslin RussellKevin Howe
British Columbia Cancer AgencySamuel Aparicio
Sohrab ShahGulisa Turashvili
Gavin HaDavid Huntsman
John Fee
NottinghamIan Ellis
Sarah WattsAndrew Green
OsloAnne-Lise Børresen-Dale
Anita Langerød
CRI Genomics CoreJames Hadfield
Michele OsborneSara Sayalero
Claire FieldingSarah Moffatt
CRI Histopathology CoreWill Howat
CRI BiorepositoryBob Geraghty
Maria Vias
Addenbrooke’s HospitalGordon Wishart
Stephen ShamuthBeverly Haynes
Linda Jones
Strangeway’s LaboratoryPaul Pharoah
Mitul ShahPatricia Harrington
Guy’s /St. ThomasArnie Purushotham
Sarah PinderAndy Tutt
Cheryl GillettRobert Springall
ManitobaLee Murphy
Michelle ParisienSandy Troup
Leigh MurphyEtienne Leygue
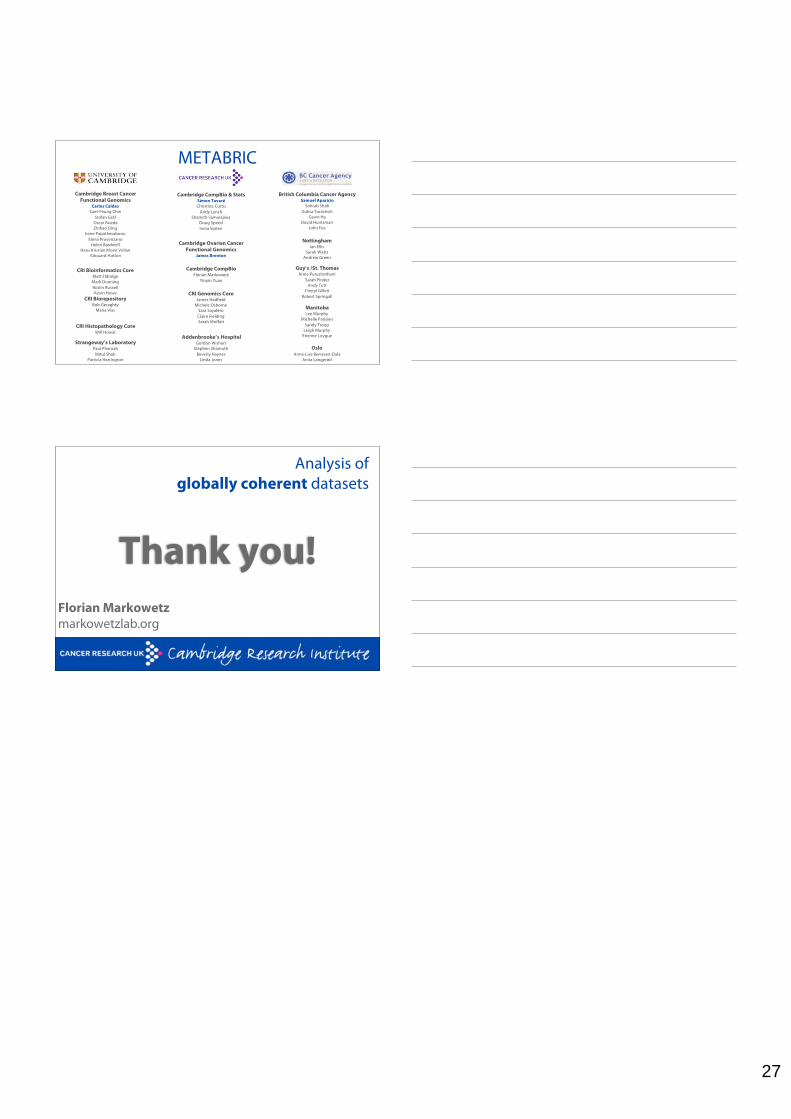
METABRIC
Florian Markowetzmarkowetzlab.org
Analysis ofglobally coherent datasets
Thank you!


![Conditional Generative Adversarial Networks (cGANs) for ...jmcauley/workshops/scmls...Remote Sens. 2019, 11, 2193 3 of 17 deal with spatially and temporally coherent datasets [31,34]](https://img.dokumen.tips/doc/110x75/6079a49dcc5c3a063b196e94/conditional-generative-adversarial-networks-cgans-for-jmcauleyworkshopsscmls.jpg)