Embed Size (px)
Citation preview

27
3 ANALYSIS OF EXISTING RIDERSHIP AND ROUTE PERFORMANCE
DATA COLLECTION
A comprehensive bus stop‐level data collection effort was undertaken to inventory existing transit use
and to develop a better understanding of the current travel patterns in the Study Area. This section of
the report summarizes the results of these data collection efforts. The numbers of passengers on and off
by stop were surveyed for weekday, Saturday, and Sunday service periods for each route that operates
in the Study Area. All of the scheduled bus trips ‐ 1,998 weekday, 751 Saturday, and 455 Sunday ‐ were
sampled multiple times. Data collection was completed during the winter and spring of 2010.
To provide a larger sample at a lower cost, Metro Transit used its automatic passenger counters (APCs)
to collect the data. Since only about one‐third of the fleet is equipped with APCs, buses equipped with
APC equipment were rotated through the Study Area routes to collect the sample.
Weekday Transit Ridership
On weekdays 1,568 in‐service hours are provided in the Study Area. The distribution of these in‐service
hours by time of day is illustrated in the first chart of Figure 15. Approximately 20 percent of in‐service
hours are provided during the AM peak period (6:00 to 9:00am), another third during the mid‐day
period (9:00 am to 3:00 pm), a quarter during the PM peak period (3:00 pm to 6:30 pm), with the
remaining revenue hours provided during the evening hours (including less than two percent between
1:00 and 5:00 am). The second chart of Figure 15 illustrates the distribution of the total number of
passengers boarding throughout the day. An average of about 90,000 weekday boardings were counted,
with 19 percent occurring during the AM peak period, 38 percent during the mid‐day period, and 25
percent during the PM peak period. The final chart in Figure 15 illustrates the average number of
boarding passengers per in‐service hour throughout the day. This chart shows that the level of transit
service in the Study Area throughout the day is reasonably well matched with the distribution of
demand throughout the day. Figure 15a shows the average passengers per in service by route on
weekdays.
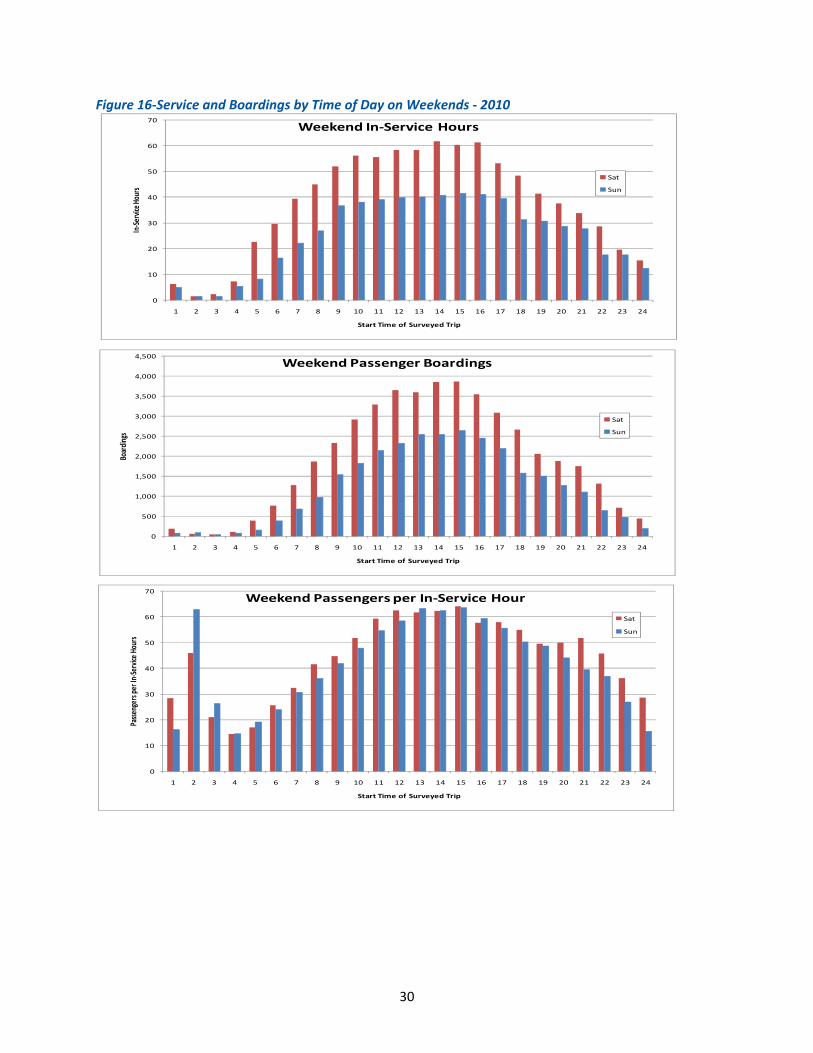
Weekend Transit Ridership
On weekends 897 in‐service hours are operated each Saturday and 609 in‐service hours each Sunday in
the Study Area. The distribution of these revenue hours is illustrated in the top chart of Figure 16.
Approximately 60 percent of these revenue hours are provided between 9:00 am and 6:00 pm. This
chart also illustrates the distribution of total number of passenger boardings counted with the APC
equipment throughout Saturdays and Sundays. An average of about 45,600 boarding passengers was
observed on Saturday, with 65 percent occurring between 9:00 am and 6:00 pm. On Sunday, an average
of about 29,400 boarding passengers was observed with 70 percent occurring between 9:00 am and
6:00 pm. This chart shows that the level of transit service in the Study Area throughout weekend days is
reasonably well matched with the distribution of demand throughout the day. Figure 16a shows the
average passengers per in service by route on weekends.

28
Figure 15‐Service and Boardings by Time of Day on Weekdays ‐ 2010
0
25
50
75
100
125
150
1 2 3 4 5 6 7 8 9 10 11 12 13 14 15 16 17 18 19 20 21 22 23
In‐Sevice
Hou
rs
Start Time of Surveyed Trip
Weekday In‐Service Hours
In‐Service Hours
0
1,000
2,000
3,000
4,000
5,000
6,000
7,000
8,000
9,000
10,000
1 2 3 4 5 6 7 8 9 10 11 12 13 14 15 16 17 18 19 20 21 22 23
Passen
ger B
oardings
Start Time of Surveyed Trip
Weekday Passenger Boardings
Boardings
0
10
20
30
40
50
60
70
80
1 2 3 4 5 6 7 8 9 10 11 12 13 14 15 16 17 18 19 20 21 22 23
Passen
gers per in
‐service hou
r
Start Time of Surveyed Trip
Weekday Passengers per In‐Service Hour
PPISH

29
Figure 15a‐Chart Passengers per Revenue Hour by Route Weekdays ‐ 2010
0 20 40 60 80 100 120
262
8
87
67
353
65
62
452
84
63
134
53
6
355
365
94
144
375
3
21
16
50
2
Passengers per In‐Service Hour
Route
Weekday Passengers per In‐Service Hour by Route
Midday
PM
AM
Other
30
Figure 16‐Service and Boardings by Time of Day on Weekends ‐ 2010
0
10
20
30
40
50
60
70
1 2 3 4 5 6 7 8 9 10 11 12 13 14 15 16 17 18 19 20 21 22 23 24
In‐Service Hou
rs
Start Time of Surveyed Trip
Weekend In‐Service Hours
Sat
Sun
0
500
1,000
1,500
2,000
2,500
3,000
3,500
4,000
4,500
1 2 3 4 5 6 7 8 9 10 11 12 13 14 15 16 17 18 19 20 21 22 23 24
Boardings
Start Time of Surveyed Trip
Weekend Passenger Boardings
Sat
Sun
0
10
20
30
40
50
60
70
1 2 3 4 5 6 7 8 9 10 11 12 13 14 15 16 17 18 19 20 21 22 23 24
Passen
gers per In
‐Service Hou
rs
Start Time of Surveyed Trip
Weekend Passengers per In‐Service Hour
Sat
Sun

31
Figure 16a‐Passengers per Revenue Hour by Route on Weekends ‐ 2010
BOARDINGS BY ROUTE AND DAY OF WEEK All day boardings per bus stop on each route for an average weekday, Saturday and Sunday during the
survey period are presented in Figure 17 – Weekday, Figure 18 – Saturday, and Figure 19 ‐ Sunday.
Routes are overlaid on the land use / density map to show the correlation between boardings and
population and employment densities. This exhibit shows that University (routes 16, 50), Selby (Route
21), Grand (Route 63) and Snelling (Route 84) avenues, are the highest ridership lines. The exhibits
indicate some very high volume transit routes in the east‐west direction along University Avenue and in
the north‐south direction along Snelling Avenue.
0 10 20 30 40 50 60 70 80
67
65
6
63
62
94
3
84
2
21
16
Passengers per In‐Service Hour
Route
Weekend Passengers per In‐Service Hour by Route
Sat
Sun

32
Figure 17‐Map of Weekday Ridership
94
35W
35E
35E94
35E
35E
35W
35W
94
35E
55
5
51
1362
280
65
62
49
55
149
47 280
5
51
13
55
7TH ST W
PARK AVE
CHI CAGO AVE
LAKE ST E
38TH ST E
42ND ST E
CEDAR AVE S
SELBY AVE
GRAND AVE
DODD RD
DALE ST N
28TH AVE S
NICOLLET AVE
UNIVERSITY AVE W
4TH
AVE S
35TH ST E
1ST AVE S
THOMAS AVE
MARSHALL AVE
SAINT CLAIR AVE
36TH ST E
RANDOLPH AVE
ROBERT ST S
LARPENTEUR AVE W
BLO
OMINGTON AVE
42ND AVE S
34TH AVE S
46TH AVE S
LEXINGTON PKWY N
COMO AVE
FRONT AVE
SHEPAR
D RD
CONCORDIA AVE
54TH ST E
4TH ST SE
31ST ST E
36TH AVE S
4TH ST S
JACKSO
N ST
46TH ST E
MINNEHAHA AVE W
3RD AVE S
28TH ST E
26TH ST E
3RD ST S
WESTERN AVE N
31ST
AVE S
SUMMIT AVE
CHARLTON ST
PRIOR AVE N
PIERCE BUTLER RTE
SAINT ANTHONY AVE
8TH ST S7TH ST S
6TH ST S
FAIRVIEW AVE S
5TH ST S
SNELLING AVE N
2ND ST N
DELAWARE AVE
SNELLING AVE S
FORD PKWY
60TH ST E
SIBLEY M
EMOR
IAL H
WY
CRETIN AVE S
HENN
EPIN A
VE E
25TH ST E
24TH ST E
ENERGY PARK DR
58TH ST E
AYD M
ILL RD
11TH
AVE S
HIGHLAND PKWY
LEXINGTO
N PKWY S
8TH ST SE
DAVERN ST
COMO AVE SE
RIVER PKWY E
26TH AVE S
9TH ST S
MONTREAL AVE
ROBERT ST N
HAMLINE AVE N
ARLINGTON AVE W
HAMLINE AVE S
UNIVERSITY AVE SE
MARYLAND AVE W
SAINT PA
UL A
VE
EUSTIS ST
PORTLA
ND AVE
CLEVEL A
ND AVE N
EDGCUMBE RD
LASALLE AV
E
FRANKLIN AVE E
JEFFERSON AVE
WENTWORTH AVE W
7TH ST E
ANNAPOLIS ST W
VICT O
RIA ST N
MISSISSIPPI ST
BUTLER AVE W
RAYMOND AVE
RIVERSIDE AVE
VANDAL IA ST
CLEVELA
ND AVE S
5TH ST E
CRETI N AVE N
1ST AVE N
KASOTA AVE
MARION ST
MINNEH
AHA AVE
11TH ST S
12TH ST
E
OHIO ST
ARLINGTON AVE E
GEORGE ST W
NOKOMIS PKWY E
8TH AV
E NE
LARPENTEUR AVE E
ELM ST SE
1ST A
VE NE
SMITH AVE S
9TH ST E
3RD A
VE NE
5TH ST N
MAIN ST SE
15TH
AVE SE
STRYKER AVE
27TH
AVE S
WASHINGTON AVE S
CEDAR ST
HORTON AVE
KELLO
GG BLVD
E
SNELLIN
G AVE
7TH ST N
OAK ST SE
SAINT PETER
ST
TRANSFER RD
RICE ST
KELLOGG BLVD W
27TH
AVE SE
50TH ST E
WEST RIVER PKWY S
34TH ST E
15TH ST E
PEL H
AM BLVD
HAMPDEN AVE
COMO LA
KE D
R E
CASE AVE
VICTO
RIA ST S
OTTO AVE
WHEELOCK PKWY W
WABASH
A ST S
JACKSO
N ST N
EAST R
IVER RD
GATEWAY DR20TH AVE S
GODFR
EY PKW
Y
STATE ST
LAFAYETTE RD N
FAIRVIEW AVE N
CAYUGA ST
1ST ST N
PARK ST
16TH ST E
EXCHANGE ST S
52ND ST E
MARYLAND AVE E19
TH AVE S
ELW
AY ST
CAPP RD
SYCAMORE ST W
SMITH
AVE N
MISSISSIPPI RIVER BLVD S
BURR ST
6TH ST S TO
EB I94
35TH AVE S
COMO AVE
HAMLINE AVE N
VICTO
RIA ST N
58TH ST EVICTO
RIA ST S
CLEVELA
ND AVE N
4TH ST S
SHEPAR
D RD
CEDAR AVE S
MINNEH
AHA AVE
42ND AVE S
54TH ST E
46TH ST E
ROBERT ST S
SAINT ANTHONY AVE
HAMLINE AVE N
NICOL LET AVE
JACKSON ST
RIVER PKWY E
PORTL A
ND AVE
Notes:
0 0.55 1.1 Miles
LegendWeekday Boardings by Stop (Spring 2010)
0-10
11-50
51-100
101-500
More than 500
Study Transit Routes
Jobs Per Acre on Commercial Land Use
0-10
10.1-20
20.1-100
More than 100
Persons Per Acre on Residental Land Use
0-10
10.1-20
20.1-30
More than 30
Study Area
Weekdays
Central Corridor Tranist Service Study Existing Conditions Report
Ridership and Service

33
Figure 18‐Map of Saturday Ridership
94
35W
35E
35E94
35E
35E
35W
35W
94
35E
55
5
51
1362
280
65
62
49
55
149
47 280
5
51
13
55
7TH ST W
PARK AVE
CHICAGO AVE
LAKE ST E
38TH ST E
42ND ST E
CED
AR AVE S
SELBY AVE
GRAND AVE
DODD RD
DALE ST N
28TH
AVE S
NICOLLET AVE
UNIVERSITY AVE W
4TH AVE S
35TH ST E
1ST AVE S
THOMAS AVE
MARSHALL AVE
SAINT CLAIR AVE
36TH ST E
RANDOLPH AVE
ROBER
T ST S
LARPENTEUR AVE W
BLO
OMINGTO
N AVE
4 2ND AVE S
3 4TH
AVE S
46T H
AVE S
LEXINGTO
N PKWY N
COMO AVE
FRONT AVE
SHEPAR
D RD
CONCORDIA AVE
54TH ST E
4TH ST SE
31ST ST E
36TH
AVE S
4TH ST S
JACKSO
N ST
46TH ST E
MINNEHAHA AVE W
3RD AVE S
28TH ST E
26TH ST E
3RD ST S
WESTE
RN AVE N
31ST
AVE S
SUMMIT AVE
CHARLTON ST
PRIOR AVE N
PIERCE BUTLER RTE
SAINT ANTHONY AVE
8TH ST S7TH ST S
6TH ST S
FAIRVIEW AVE S
5TH ST S
SNELLING AVE N
2ND ST N
DELAWARE AVE
SNELLING AVE S
FORD PKWY
60TH ST E
SIBLEY M
EMOR
IAL H
WY
CRET
IN AVE S
HENN
EPIN A
VE E
25TH ST E
24TH ST E
ENERGY PARK DR
58TH ST E
AYD M
ILL RD
11TH
AVE S
HIGHLAND PKWY
LEXINGTO
N PKWY S
8TH ST SE
DAVER
N ST
COMO AVE SE
RIVER PKWY E
26TH
AVE S
9TH ST S
MONTREAL AVE
ROBERT ST N
HAML INE AVE N
ARLINGTON AVE W
HAMLINE AVE S
UNIVERSITY AVE SE
MARYLAND AVE W
SAINT PA
UL A
VE
EUSTIS ST
PORTLA
ND AVE
CLEVELAND AVE N
EDGCUMBE RD
LASALLE AV
E
FRANKLIN AVE E
JEFFERSON AVE
WENTWORTH AVE W
7TH ST E
ANNAPOLIS ST W
VICTO
RI A ST N
MISSIS SIPPI ST
BUTLER AVE W
RAYMOND AVE
RIVERSIDE AVE
VANDALIA ST
CL EVELAND AVE S
5TH S
T E
CRET
IN AVE N
1ST AVE N
KASOTA AVE
MARION ST
MINNEH
AHA AVE
11TH ST S
12TH ST
E
OHIO ST
ARLINGTON AVE E
GEORGE ST W
NOKOMIS PKWY E
8TH AV
E NE
LARPENTEUR AVE E
ELM ST SE
1ST A
VE NE
SMITH AVE S
9TH ST E
3RD AV
E NE
5TH ST N
MAIN ST SE
15TH
AVE SE
STRYKER
AVE
2 7TH
AVE S
WASHINGTON AVE S
CEDAR ST
HORTON AVE
KELLO
GG BLVD
E
SNELLIN
G AVE
7TH ST N
OAK ST S E
SAINT PETER ST
TRANSFER RD
RICE ST
KELLOGG BLVD W
27TH
AVE SE
50TH ST E
WEST RIVER PKWY S
34TH ST E
15TH ST E
PELHAM BLVD
HAMPDEN
AVE
COMO LA
KE D
R E
CASE AVE
VICTO
RIA ST S
OTTO AVE
WHEELOCK PKWY W
WABASH
A ST S
JACKSO
N ST N
EAST R
IVER RD
GATEWAY DR20
TH AVE S
GODFR
EY PKW
Y
STATE ST
LAFAYETTE RD N
FAI RVIEW AVE N
CAYUGA ST
1ST ST N
PARK ST
16TH ST E
EXCHANGE ST S
52ND ST E
MARYLAND AVE E19
TH AVE S
ELWAY ST
CAPP RD
SYCAMORE ST W
SMITH
AVE N
MISSISSIPPI RIVER BLVD S
BURR ST
6TH ST S TO
EB I94
35TH
AVE S
COMO AVE
HAMLINE AVE N
VICTO
RIA ST N
58TH ST EVICT O
RIA ST S
CLEVE LAND AVE N
4TH ST S
SHEPAR
D RD
CED
AR AVE S
MINNEHAHA AVE
42ND AVE S
54TH ST E
46TH ST E
ROBERT ST S
SAINT ANTHONY AVE
HAMLINE AVE N
NICOLLET AVE
JACKSON ST
RIVER PKWY E
PORTLA
ND AVE
Notes:
0 0.55 1.1 Miles
LegendSaturday Boardings by Stop (Spring 2010)
0-10
11-50
51-100
101-500
More than 500
Study Transit Routes
Jobs Per Acre on Commercial Land Use
0-10
10.1-20
20.1-100
More than 100
Persons Per Acre on Residental Land Use
0-10
10.1-20
20.1-30
More than 30
Study Area
Saturdays
Central Corridor Transit Service Study Existing Conditions Report
Ridership and Service

34
Figure 19‐Map of Sunday Ridership
94
35W
35E
35E94
35E
35E
35W
35W
94
35E
55
5
51
1362
280
65
62
49
55
149
47 280
5
51
13
55
7TH ST W
PARK AVE
CHICAGO AVE
LAKE ST E
38TH ST E
42ND ST E
CEDAR AVE S
SELBY AVE
GRAND AVE
DODD RD
DALE ST N
28TH
AVE S
NI COL LET AVE
UNIVERSITY AVE W
4TH AVE S
35TH ST E
1ST AVE S
THOMAS AVE
MARSHALL AVE
SAINT CLAIR AVE
36TH ST E
RANDOLPH AVE
ROBER
T ST S
LARPENTEUR AVE W
BLO
OMI NGTO
N AVE
4 2ND AVE S
34TH AVE S
46TH
AVE S
LEXINGTON PKWY N
COMO AVE
FRONT AVE
SHEPAR
D RD
CONCORDIA AVE
54TH ST E
4TH ST SE
31ST ST E
36T H
AVE S
4TH ST S
JACKSO
N ST
46TH ST E
MINNEHAHA AVE W
3RD AVE S
28TH ST E
26TH ST E
3RD ST S
WESTERN AVE N
3 1S T
AVE S
SUMMIT AVE
CHARLTON ST
PRIOR AVE N
PIERCE BUTLER RTE
SAINT ANTHONY AVE
8TH ST S7TH ST S
6TH ST S
FAIRVIEW AVE S
5TH ST S
SNELLING AVE N
2ND ST N
DELAWARE AVE
SNELLING AVE S
FORD PKWY
60TH ST E
SIBLEY M
EMOR
IAL H
WY
CRET
IN AVE S
HENNEP
IN AV
E E
25TH ST E
24TH ST E
ENERGY PARK DR
58TH ST E
AYD M
ILL RD
11TH
AVE S
HIGHLAND PKWY
LEXINGTO
N PKWY S
8TH ST SE
DAVER
N ST
COMO AVE SE
RIVER PKWY E
26TH
AVE S
9TH ST S
MONTREAL AVE
ROBERT ST N
HAML INE AVE N
ARLINGTON AVE W
HAMLINE AVE S
UNIVERSITY AVE SE
MARYLAND AVE W
SAINT PA
UL A
VE
EUSTIS ST
PORTLA
ND AVE
CLEVELAND AVE N
EDGCUMBE RD
LASALLE AV
E
FRANKLIN AVE E
JEFFERSON AVE
WENTWORTH AVE W
7TH ST E
ANNAPOLIS ST W
VICTO
RI A ST N
MISSISSIPPI ST
BUTLER AVE W
RAYMOND AVE
RIVERSIDE AVE
VANDAL IA ST
CLEVE LAND AVE S
5TH S
T E
CRET
IN AVE N
1ST AVE N
KASOTA AVE
MARION ST
MINNEH
AHA AVE
11TH ST S
12TH ST
E
OHIO ST
ARLINGTON AVE E
GEORGE ST W
NOKOMIS PKWY E
8TH AV
E NE
LARPENTEUR AVE E
ELM ST SE
1ST A
VE NE
SMITH AVE S
9TH S
T E
3RD A
VE NE
5TH ST N
MAIN ST SE
15TH
AVE SE
STRYKER AVE
27TH
AVE S
WASHINGTON AVE S
CEDAR ST
HORTON AVE
KELLO
GG BLVD
E
SNELLIN
G AVE
7TH ST N
OAK ST SE
SAINT PETER ST
TRANSFER RD
RICE ST
KELLOGG BLVD W
27TH
AVE SE
50TH ST E
WEST RIVER PKWY S
34TH ST E
15TH ST E
PELH
AM BLVD
HAMPDEN
AVE
COMO LA
KE D
R E
CASE AVE
VICTO
RIA ST S
OTTO AVE
WHEELOCK PKWY W
WABASH
A ST S
JACKSO
N ST N
EAST R
IVER RD
GATEWAY DR20
TH AVE S
GODFR
EY PKW
Y
STATE ST
LAFAYETTE RD N
FAIRVIEW AVE N
CAYUGA ST
1ST ST N
PARK ST
16TH ST E
EXCHANGE ST S
52ND ST E
MARYLAND AVE E19
TH AVE S
ELWAY ST
CAPP RD
SYCAMORE ST W
SMITH
AVE N
MISSISSIPPI RIVER BLVD S
BURR ST
6TH ST S TO
EB I94
3 5TH AVE S
COMO AVE
HAMLINE AVE N
VICTO
RIA ST N
58TH ST EVICTO
RI A ST S
CL EVELAND AVE N
4TH ST S
SHEPAR
D RD
CED
AR AVE S
MINNEH
AHA AVE
42ND AVE S
54TH ST E
46TH ST E
ROBERT ST S
SAINT ANTHONY AVE
HAMLINE AVE N
NICOLLET AVE
JACKSON ST
RIVER PKWY E
PORTLA
ND AVE
Notes:
0 0.55 1.1 Miles
LegendSunday Boardings by Stop (Spring 2010)
0-10
11-50
51-100
101-500
Study Transit Routes
Jobs Per Acre on Commercial Land Use
0-10
10.1-20
20.1-100
More than 100
Persons Per Acre on Residental Land Use
0-10
10.1-20
20.1-30
More than 30
Study Area
Sundays
Central Corridor Transit Service Study Existing Conditions Report
Ridership and Service

35
SERVICE PERFORMANCE BY ROUTE Service performance is summarized for each of the routes on the following pages for the local and express services, respectively. For weekdays, please see Figure 20, Saturdays, Figure 21, and Sundays, Figure 22. The routes are sorted by high performance to low performance in terms of their average passengers per in‐service hour. The values in these tables reflect the service levels and ridership during the winter of 2010. The in‐service hours and passengers per in‐service hour are calculated for the entire route and not just for the route segment within the Study Area. The passengers per route are the total average Automatic Passenger Counter (APC) counts per day. Figure 20‐Weekday Route performance
Boardings are the total average of Automatic Passenger Counter (APC) counts per day.
PPISH is the average Passengers per In‐Service Hour.
Service
Route
Type Route
In‐Service
Hours Boardings PPISH
Weekday
Express
375 13.8 778 56.25
94 83.3 4,238 50.89
365 12.1 596 49.23
355 20.4 990 48.61
452 4.8 190 39.51
353 3.7 117 31.95
Express Total 138.1 6,909 50.04
Limited Stop
50 88.1 7,227 82.05
144 8.9 455 51.44
53 26.8 1,115 41.58
134 15.7 651 41.57
262 6.3 110 17.51
Limited Stop Total 145.7 9,559 65.60
Local
2 103.2 9,040 87.63
16 218.5 17,037 77.97
21 218.7 13,972 63.90
3 177.9 10,857 61.03
6 198.4 9,238 46.56
63 101.1 4,190 41.45
84 93.7 3,879 41.40
62 38.3 1,468 38.35
65 37.3 1,320 35.37
67 55.9 1,743 31.16
87 31.6 683 21.59
8 9.3 195 20.96
Local Total 1,283.9 73,622 57.34
Weekday Total 1,567.7 90,090 57.47

36
Figure 21‐Saturday Route performance
Figure 22‐Sunday Route performance
Boardings are the total average of Automatic Passenger Counter (APC) counts per day.
PPISH is the average Passengers per In‐Service Hour.
Service
Route
Type Route
In‐Service
Hours Boardings PPISH
Saturday
Express
94 31.6 1,384 43.84
Local
16 164.4 12,123 73.76
21 211.8 12,012 56.72
2 65.5 3,491 53.27
3 68.8 3,150 45.78
84 74.9 3,379 45.08
62 27.5 1,074 39.03
6 150.8 5,629 37.31
63 69.9 2,480 35.48
67 22.3 645 28.96
65 9.0 259 28.81
Local Total 865.0 44,243 51.15
Saturday Total 896.5 45,627 50.89
Service
Route
Type Route
In‐Service
Hours Boardings PPISH
Sunday
Express
94 22.9 899 39.29
Local
16 106.9 7,729 72.30
21 144.6 8,025 55.49
2 53.4 2,744 51.36
84 36.4 1,850 50.87
62 11.1 516 46.72
63 29.7 1,154 38.85
3 58.2 2,182 37.51
6 123.1 3,809 30.93
65 5.7 139 24.47
67 17.0 365 21.40
Local Total 586.1 28,513 48.65
Sunday Total 609.0 29,412 48.30