Embed Size (px)
Citation preview

Journal of The Electrochemical Society, 157 �7� H711-H720 �2010� H711
D
Analysis of Excess Carrier Concentration Controlin Fast-Recovery High Power Bipolar Diodes at LowCurrent DensitiesX. Perpiñà,a,z X. Jordà,a M. Vellvehi,a J. Vobecky,b and N. Mestresc
aInstituto de Microelectrónica de Barcelona, IMB-CNM (CSIC), Campus Universitat de la Autònoma deBarcelona, Bellaterra, Barcelona 08193, SpainbABB Switzerland Limited, Semiconductors, CH-5600 Lenzburg, SwitzerlandcInstitut de Ciència dels Materials de Barcelona (ICMAB-CSIC), Campus Universitat de la Autònoma deBarcelona, Bellaterra, Barcelona 08193, Spain
The combination of emitter control with local lifetime tailoring by ion irradiation is experimentally analyzed in fast-recovery highpower diodes. For this purpose, the carrier lifetime and excess carrier concentration profiles are measured and modeled within thelow doped region of unirradiated and helium irradiated diodes under low current densities ��20 A/cm2�. The interest in workingunder these current conditions responds to the fact that the only recombination mechanism that modulates the steady-state carrierconcentration is that of the multiphonon-assisted case �Shockley–Read–Hall model�. This enables us to extract parameters for theirmodeling under arbitrary working conditions and to detect the influence of ion irradiation on the excess carrier distribution. For abetter comprehension of the results, the excess carrier profile in the unirradiated diode is physically analyzed in detail by ananalytical model. Afterward, physical simulations are also carried out, employing the experimental lifetime profiles as inputparameters. As a result, a very good agreement between simulation predictions and experiments is observed, which is used toexplain, by the support of analytical expressions, how the ion-irradiation process can improve the diode operation at low currentdensities during the late phase of the reverse recovery.© 2010 The Electrochemical Society. �DOI: 10.1149/1.3421974� All rights reserved.
Manuscript received February 24, 2010. Published May 10, 2010.
0013-4651/2010/157�7�/H711/10/$28.00 © The Electrochemical Society
The main difference between low and high power discrete bipo-lar diodes is the presence of a thick low N-doped layer �drift region�between highly P- and N-doped layers �emitters�, which allows highpower diodes reaching blocking voltages in the kilovolt range.
During the blocking state �off-state�, the drift region is graduallydepleted until the full bus voltage is sustained by the PN− junction.In an on-state, carriers are injected from the highly doped layers intothe drift region, finally reaching an excess carrier concentrationmuch higher than that of the doping level �high injection condition�.Such a physical effect changes the initial resistivity of this layer�conductivity modulation�, highly reducing the power losses duringthe on-state.
The transition from an on-state to an off-state �reverse recovery�requires a certain time �reverse recovery time� because the devicedrift region stores a large amount of excess carriers that should beremoved. This removal time increases as the drift region is thicker.Additionally, it is required that for a safe reverse recovery process,the current flowing across the diode shows a smooth decay �softbehavior� without oscillations �snappy behavior�, and the reversecurrent peak should be as small as possible.1
Nowadays, two strategies are basically used to improve the re-verse recovery response of power diodes: the emitter2 and lifetimeengineering.3 There also exist sophisticated methods that utilize spe-cial PNP structures at the cathode side, e.g., field charge extraction4
or controlled injection of back-side holes�5 diodes. However, theirimplementation is more complicated and not without compromises.The emitter and lifetime engineering are based on tailoring the ex-cess carrier concentration profile in the drift region.6 By using emit-ter engineering, the injection efficiency at the PN− junction is con-trolled by the doping level of a single diffused emitter �singlediffused anode� or the insertion of a buffer layer with a lower dopinglevel �double diffused anode� to increase the breakdown voltage atthe same time, also implying in the second case a reduction of thedevice drift region. By contrast, lifetime engineering �or lifetimekilling� relies on the possibility of adjusting the lifetime of the car-riers injected into the drift region by inducing generation–recombination centers �deep level introduction within the energybandgap�.7 They can be created by noble metal atoms �diffusion orpostimplantation “drive-in” of platinum or gold at high tempera-
z E-mail: [email protected]
ownloaded 11 May 2010 to 205.161.180.253. Redistribution subject to
tures�, electron irradiation, or ion irradiation �protons or alpha par-ticles�. Lifetime tailoring is not recommendable in diodes with asingle diffused anode as this process raises the power losses duringthe on- and off-states. This is not a problem when a double diffusedanode is employed and the deep levels for the local lifetime killingare outside the space charge region.8 Then, a convenient trade-off isobtained between the static and dynamic parameters of the device.As a matter of fact, both strategies, the lifetime and emitter engi-neering, are frequently combined, while one of them has a predomi-nant role in the final characteristics of the device.6
Commonly, the previous study for an optimal ion irradiation isassisted by numerical simulations of the involved physicalphenomena,9-12 which require an accurate selection of their inputparameters. Although deep level transient spectroscopy �DLTS� andC-V profiling may provide information about recombination centers’characteristics �energy levels and spatial distribution� appropriate forthis purpose, the evolution of excess carrier concentration in thedrift region of a biased device is not directly measured. Moreover,the measurements of the carrier lifetime profile with traditionalmethods, such as open-circuit voltage decay13,14 �OCVD�, do nothave enough accuracy to spatially resolve such local effects due toion irradiation. For this reason, OCVD measurements should becomplemented with free-carrier absorption �FCA� results.15,16 Previ-ous works on this field were carried out by Rosling et al.16 Using theFCA technique, they measured the excess carrier concentration pro-file in electron and proton irradiated PIN diodes nonoptimized foractual working applications. They neither analyzed in detail the un-derlying physics concerning the excess carrier injection into the di-ode drift region nor described the excess carrier local modulation.Other works have been carried out to perform the calibration of theShockley–Read–Hall �SRH� model, but always in homogeneouslylifetime tailored power devices.17,18
This work intends to perform FCA measurements with fast-recovery diodes irradiated with alpha particles �He2+� and criticallydiscusses their effects on the device behavior. Particularly, our studyfocuses on the determination of the excess carrier concentration be-havior within unirradiated and irradiated diodes under low currentdensity pulses �from 1 to 16 A/cm2�, extracting the steady-stateexcess carrier concentration and lifetime profiles within the driftregion. From their comparison, it is possible to infer the differencesin their physical behavior during the diode turn-off, as the steady-state excess carrier profile predetermines the course of the reverse
ECS license or copyright; see http://www.ecsdl.org/terms_use.jsp

H712 Journal of The Electrochemical Society, 157 �7� H711-H720 �2010�H712
D
recovery process.1 The interest in working under these current den-sities responds to the fact that the recombination mechanism, whichgoverns the steady-state excess carrier concentration profile, is themultiphonon-assisted or SRH model. This allows us to directly in-spect the ion-irradiation effects on the SRH recombination, avoidingother recombination mechanisms that could shield them. Moreover,employing an analytical model, it is possible to assist in the inter-pretation of the obtained experimental results from the unirradiateddevice and to extract the lifetime profiles within both diodes tofinally perform two-dimensional �2D� physical simulations. Finally,a very good agreement is observed between measurements andsimulation.
Steady-State Excess Carrier Concentration and LifetimeCharacterization
The excess carrier concentration profile and its correspondinglifetime have been measured by OCVD and FCA techniques. On theone hand, OCVD measurements permit extracting the carrier life-time averaged within the drift region by an electricalmeasurement.14,19 The diode works in the on-state under a resistiveload with a small parasitic inductance in series. Suddenly, the cur-rent is rapidly cut by the action of a fast external semiconductorswitch, leaving the diode in an open circuit and forcing the excesscarrier removal by internal recombination and diffusion processes.20
This is electrically manifested on the time decay of the diode volt-age drop, in which two linear slopes that correspond to the condi-tions of high or low injection are observed. The former allows us todetermine the high level lifetime �HL �carrier high injection�, whilethe latter permits us to extract the low level lifetime �LL �carrier lowinjection�, both as an average value inside the device. This magni-tude can be determined from the slope of the voltage tail dV/dtusing the following relationship14
�m =− nkBT/q
dV/dt�1�
where m and n make reference to the injection regime �m = LL andn = 1 in low injection; m = HL and n = 2 in high injection�; kB andT are the Boltzmann constant and temperature, respectively. Onemay rewrite both lifetimes in terms of the minority lifetime of elec-trons ��n0� and holes ��p0� as21,22 �HL = �n0 + �p0 and �LL = �p0.
On the other hand, FCA measurements allow determining theexcess carrier concentration inside the device when high injectionconditions are reached in the inspected layer.23 In this technique, anIR-laser probe beam �� = 1.3 �m� passes through a biased diodeunder test �DUT� perpendicularly striking on its lateral sides orwalls at a given depth y0, as depicted in Fig. 1. When the DUT isturned on, carriers coming from the emitters are injected into the
Figure 1. �Color online� Schematic of the setup when performing FCAmeasurements within the diode �not to scale�.
ownloaded 11 May 2010 to 205.161.180.253. Redistribution subject to
drift region, eventually establishing an excess carrier concentrationC higher than that of the doping level �high injection condition�.This effect modifies the semiconductor optical properties, enhancingthe material absorption at the near-infrared spectrum due to the ex-cess carrier presence. From the radiation absorption measurements,it is possible to deduce a longitudinal averaged value of C at a givendepth y0 from the top surface.15 Additionally, if the excitation circuitis able to cut the diode bias current �Ibias� faster compared to thecarriers’ lifetime, a depth-resolved lifetime averaged along the inter-action laser DUT is derived �open-circuit carrier decay�.24 Figure 1also shows the main elements of the experimental rig: the lasersource, two lenses for controlling the laser beam shape, the sensingsetup �four-quadrant photodiode and processing signal circuitry�,and the biasing circuit for the device electrical excitation. Moredetails on this setup are given in Ref. 15 and 25. The excess carrierconcentration C is extracted from the transmitted radiation powerthrough the DUT by15
C =1
L� � �
� C�Ln� Vout,P
Vout,P�t�� �2�
where L denotes the interaction length with the sample. Vout,P andVout,P�t� represent the output signal of the radiation power sensed bythe detector before and during the diode excitation, respectively. Inthis expression, it is considered that the absorption coefficients �and C are linearly related, ���/�C� being the proportionality con-stant between them. At � = 1.3 �m and in similar experimentalconditions of this work, this coefficient was determined bySchlögl,26 obtaining ���/�C� = 8.08 � 10−18 cm−2.
Diode Structure and FCA Experimental Results
Diodes’ description.— The studied devices are 100 A/2.5 kV cir-cular power diodes �area 2 cm2�. Their total thickness is 390 �m,also considering top and bottom aluminum contacts �10 �m eachone�. As depicted in Fig. 2, their internal structure consists of adouble diffused anode �P+ and P-buffer�, a wide drift region�N−,2d = 297 �m�, and a single diffused cathode �N+�. The pres-ence of the P-buffer layer was to achieve a high breakdown voltageand to slightly modulate the excess carrier concentration in the on-state, as previously stated. From the point of view of the FCA mea-surements, the drift region thickness allowed the excess carrier con-centration measurement inside the device without having spatialrestrictions imposed by the sample. Additionally, excess carrier mea-surements were feasible within the P-buffer layer, as its doping level
Figure 2. Internal structure of the studied devices.
ECS license or copyright; see http://www.ecsdl.org/terms_use.jsp

H713Journal of The Electrochemical Society, 157 �7� H711-H720 �2010� H713
D
was lower than the excess carrier concentration reached during theon-state. This allowed detecting whether the high injection conditioncould be reached in this layer. The PN− junction was located 58 �mfrom the anode top. The junction termination consisted of a positivebevel with surface passivation using a rubber. The helium irradiationwas performed through the anode contact �10 �m thick aluminum�with a fluence of 1010 cm2 and an energy of 11 MeV. This processlocated the defect peak in the range rp = 60–65 �m. Afterward, alldiodes were annealed at 200°C for 60 min to remove the unstableradiation defects. As a result, the carrier lifetime was altered close tothe PN− junction depth yp. More details about the electrical behaviorof these diodes can be found in Ref. 9.
Experimental conditions.— Concerning the sample preparation,the diodes were cut in strips of 1.5 � 10 mm, and afterward, theirlateral walls were polished following physical and chemicalprocesses.27 Therefore, the spatial resolution and radiation powertransmission were enhanced. After that, the strips were finally sol-dered and bonded on a power substrate �insulated metal substrate�.This last step introduces a relatively high contact resistance on themeasured samples because their standard mounting is in press packhousing, supporting pressures up to 100 kN/cm2. However, depend-ing on the chosen biasing conditions �below 30 A/cm2�, this para-sitic resistance would not excessively influence the real distributionof excess carrier concentration inside the device also because thereis no current flowing through the contacts during OCVD measure-ments. The device was biased with short current pulses at low den-sity values using a high speed insulated gate bipolar transistor�IGBT� �IXGH22N50BS�. The IGBT was connected in series with aresistive load, a parasitic inductance, and the DUT. Switching onand off the IGBT, the diode was forward biased with current pulsesup to 16 A/cm2 for 84 �s. Thus, device self-heating effects wereavoided, as well as contact self-heating problems or current insta-bilities due to the high contact resistance. Additionally, the otherrecombination processes, i.e., Auger and radiative recombinations,were not manifested in the selected current range, as they appearedat higher current densities ��50 and �100 A/cm2,respectively�.23,28-30
Influence of diode preparation process on experimentalresults.— SRH recombination processes can be produced either in-side the bulk or at any surface/interface defined between silicon andanother material �e.g., chip lateral walls�. The excess carriers’ life-time measured by OCVD and FCA provides a carrier effective life-time �m,eff depending on �m,bulk �bulk lifetime� and �m,surf �surfacelifetime� as
1
�m,eff=
1
�m,bulk+
1
�m,surf�3�
where m makes reference to the injection regime reached within thedrift region far from the lateral walls of the device or bulk �m= LL in low injection; m = HL in high injection�. From the point ofview of the device physical modeling, the �m,bulk profile is moreinteresting as an input simulation parameter than the �m,surf because�m,bulk determines the excess carrier profiles in a real working diode.However, the DUT preparation process �cutting and polishing thediode� changes the initial �m,surf, and its contribution to �m,eff cannotbe neglected �specially when m = HL�. This fact makes the �m,bulkdetermination from �m,eff more difficult.
To qualitatively evaluate and stress the influence of the surfacerecombination on the measured excess carrier profile in steady state�CSS� and its effective lifetime profile, physical simulations withSentaurus device TCAD 31 were performed. The simulated structurecorresponds to a half cross section of the diode strip forward biasedunder a current density of 8 A/cm2 for both cases �irradiated andunirradiated diodes�, where the interface defined between air andsilicon at one of the lateral walls is also assumed. In contrast to thebulk SRH theory, the parameter that accounts for this effect in thesurface SRH model is the surface recombination velocity �S �.
SRHownloaded 11 May 2010 to 205.161.180.253. Redistribution subject to
The SSRH measurement is very difficult, as SSRH and �m,surf follow atranscendental equation.32,33 SSRH measurements were only carriedout on the top and bottom surfaces of silicon wafers33,34 or at theoxide interface of ultrathin silicon-on-insulator wafers.35 For thisreason, the parameter determination for each case was faced differ-ently. �n0 and �p0 were directly measured on the unirradiated diodeby OCVD ��n0 = 63 and �p0 = 31 �s�, and SSRH was extracted fromthe literature �SSRH = 2800 cm/s reported in Ref. 34�. Concretely,SSRH = 2800 cm/s was measured on silicon wafers with polishedsurfaces,34 and similar values were estimated on laterally polisheddiodes in Ref. 29. In the irradiated device, all defects created by theirradiation were taken into account, and their profiles were deter-mined by SRIM simulations.11,36
Figure 3a and b compares the typical OCVD measurements foreach diode �before and after the diode preparation process� withsimulation results considering only the surface recombination at thelateral walls of the sample. It is observed from the OCVD measure-ments that the lifetime was extremely reduced due to the preparationprocess in both cases, obtaining a good agreement with simulationresults. �HL,bulk and �HL,eff were determined from the OCVD mea-surements performed before and after the diode preparation. By us-ing Eq. 3, �HL,surf can also be derived. �HL,surf are 16 and 25 �s forthe unirradiated and irradiated diodes, respectively. One may expectfrom the similarity of these values that they are related to the prepa-ration process �cutting–polishing�. As this process generates a cer-tain amount of defect density on the sample lateral walls in an un-repeatable way, �HL,surf is considered as a stochastic error source onthe �HL,bulk determination. Another result from OCVD measure-ments is that no dependence of the measured �HL,eff on the current ihas been obtained, which means that �HL,eff is not a function ofexcess carrier at the current levels considered in this work. More-over, the recombination at the end regions �emitters, i.e., P-bufferand N+-layers� did not affect the results because the OCVD lifetimewas calculated when the charge in the emitters was removed.14 Thefact that there is no current flow through the contacts out of thedevice is one of the biggest advantages of the OCVD method: Life-time is not influenced by contacts and very little by emitters.
Figure 4 demonstrates how the surface recombination modulatesthe excess carrier distribution inside the device. Figure 4a and bcontains both the 2D and one-dimensional �1D� cuts of electronconcentration in steady state �both the doping level and excess car-riers, Cn� normalized to its highest value achieved close to the PN−
junction �Cn,max�. Only Cn is discussed here because both electronsand holes have the same concentration in the inspected region �highinjection condition�. Figure 4a visually shows how at 600 �m fromthe polished lateral wall, the C /C profile in the drift region
0.0 0.2 0.4 0.6 0.8 1.00.0
0.1
0.2
0.3
0.4
0.5
0.6
0.7
0.8
SimulationpredictionAfter
diode preparation
Beforediode preparation
(b)(a)Unirradiated Irradiated
VOCVD[V
]
Time [ms]
Simulationprediction
Afterdiode preparation
Beforediode preparation
0.0 0.1 0.2 0.3 0.4 0.5
Time [ms]
Figure 3. �Color online� OCVD measurements and simulated results, evi-dencing the influence of diode preparation on the excess carriers’ lifetime.
n n,max
ECS license or copyright; see http://www.ecsdl.org/terms_use.jsp
H714 Journal of The Electrochemical Society, 157 �7� H711-H720 �2010�H714
D
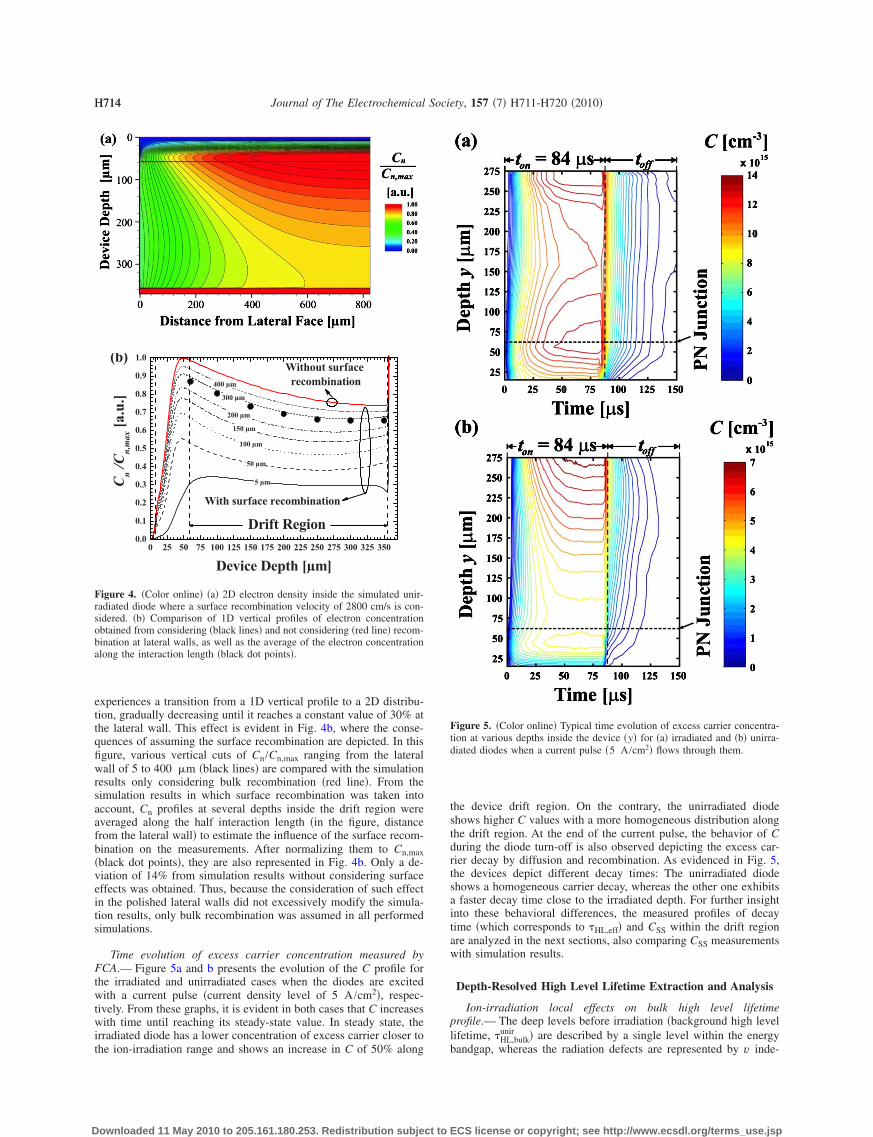
experiences a transition from a 1D vertical profile to a 2D distribu-tion, gradually decreasing until it reaches a constant value of 30% atthe lateral wall. This effect is evident in Fig. 4b, where the conse-quences of assuming the surface recombination are depicted. In thisfigure, various vertical cuts of Cn/Cn,max ranging from the lateralwall of 5 to 400 �m �black lines� are compared with the simulationresults only considering bulk recombination �red line�. From thesimulation results in which surface recombination was taken intoaccount, Cn profiles at several depths inside the drift region wereaveraged along the half interaction length �in the figure, distancefrom the lateral wall� to estimate the influence of the surface recom-bination on the measurements. After normalizing them to Cn,max�black dot points�, they are also represented in Fig. 4b. Only a de-viation of 14% from simulation results without considering surfaceeffects was obtained. Thus, because the consideration of such effectin the polished lateral walls did not excessively modify the simula-tion results, only bulk recombination was assumed in all performedsimulations.
Time evolution of excess carrier concentration measured byFCA.— Figure 5a and b presents the evolution of the C profile forthe irradiated and unirradiated cases when the diodes are excitedwith a current pulse �current density level of 5 A/cm2�, respec-tively. From these graphs, it is evident in both cases that C increaseswith time until reaching its steady-state value. In steady state, theirradiated diode has a lower concentration of excess carrier closer tothe ion-irradiation range and shows an increase in C of 50% along
0 25 50 75 100 125 150 175 200 225 250 275 300 325 3500.0
0.1
0.2
0.3
0.4
0.5
0.6
0.7
0.8
0.9
1.0
With surface recombination
Without surfacerecombination400 µm
300 µm
5 µm
50 µm
200 µm
150 µm
Cn/C
n,max[a.u.]
Device Depth [µm]
100 µm
(b)
Drift Region
Figure 4. �Color online� �a� 2D electron density inside the simulated unir-radiated diode where a surface recombination velocity of 2800 cm/s is con-sidered. �b� Comparison of 1D vertical profiles of electron concentrationobtained from considering �black lines� and not considering �red line� recom-bination at lateral walls, as well as the average of the electron concentrationalong the interaction length �black dot points�.
ownloaded 11 May 2010 to 205.161.180.253. Redistribution subject to
the device drift region. On the contrary, the unirradiated diodeshows higher C values with a more homogeneous distribution alongthe drift region. At the end of the current pulse, the behavior of Cduring the diode turn-off is also observed depicting the excess car-rier decay by diffusion and recombination. As evidenced in Fig. 5,the devices depict different decay times: The unirradiated diodeshows a homogeneous carrier decay, whereas the other one exhibitsa faster decay time close to the irradiated depth. For further insightinto these behavioral differences, the measured profiles of decaytime �which corresponds to �HL,eff� and CSS within the drift regionare analyzed in the next sections, also comparing CSS measurementswith simulation results.
Depth-Resolved High Level Lifetime Extraction and Analysis
Ion-irradiation local effects on bulk high level lifetimeprofile.— The deep levels before irradiation �background high levellifetime, �HL,bulk
unir � are described by a single level within the energybandgap, whereas the radiation defects are represented by v inde-
Figure 5. �Color online� Typical time evolution of excess carrier concentra-tion at various depths inside the device �y� for �a� irradiated and �b� unirra-diated diodes when a current pulse �5 A/cm2� flows through them.
ECS license or copyright; see http://www.ecsdl.org/terms_use.jsp

H715Journal of The Electrochemical Society, 157 �7� H711-H720 �2010� H715
D
pendent energy levels �no interaction among them�.37 Thus, the highlevel lifetime after irradiation �HL,bulk
ir is approximated by38
1
�HL,bulkir =
1
�HL,bulkunir + �
i=1
v1
�a,i�4�
where �HL,bulkunir and �a,i represent the contributions of the deep levels
before and after the irradiation to �HL,bulkir , respectively. �HL,bulk
unir de-pends on the doping level N. This effect is usually accounted for bythe empirical Scharfetter relation38,39 that applies separately for theminority lifetimes of electrons and holes. When the diode is in on-state and its drift region is under high injection conditions, �HL,bulk
unir
may be written as
�HL,bulkunir = �0�a +
b
1 + � N
Nref�� �5�
where �0 is the high level lifetime at the low doped regions �driftregion�, defined as the sum of the minority lifetimes of electrons andholes before the irradiation �i.e., �0 = 94 �s�. a, b, Nref, and � arefitting parameters with the same value for electrons and holes. a andb vary between 0 and 1 and verify the condition a + b = 1. Nref and� provide the lifetime decrease when the doping level increases,where � = 1 in silicon.39
Apart from the energy level introduced by the background deeplevels, the irradiated devices can be modeled by only consideringtwo other dominant energy levels9,37 within the bandgap �i.e., v= 2�: the vacancy–oxygen pair VO�−/0� �EC − 0.16 eV, denoted asE1� and the single acceptor level of divacancy V2
�−/0� �EC− 0.42 eV, denoted as E4�. The former dominates the lifetime underhigh injection, whereas the latter is deeper within the bandgap andthus dominates the lifetime under low injection conditions40,41 aslong as the postirradiation annealing is not performed above 300°C.The deep levels resulting from the irradiation can contribute in aunique �ir, as can be inferred from Eq. 4. Therefore, the ion irradia-tion creates an inverse lifetime distribution G�y� within the deviceas42
G�y� = �ir−1f�y� �6�
where f�y� corresponds to the normalized profile of defects inducedby irradiation and is proportional to the loss of ion energy due to theinteraction with the electrons and atoms. Mostly, all ion energy isdissipated close to the penetration range where the ions are finallystopped. f�y� may be represented by the following equation43
f�y� = exp�− �y − rp�E��2
2�rp�E��2 � if y� � y �nuclear stopping�
exp�− �y − rp�E��l
� if 0 y y� �electronic stopping� �7�
where rp�E� is the range �penetration depth� as a function of theincident ion energy, rp�E� represents the standard deviation of theranges of individual particles �straggle�, l is the defects’ decaylength defined from the ion range, and y� is the depth from whichf�y� makes the transition from the nuclear stopping behavior to theelectronic one �defect tail�.
Table I. Measured lifetimes through OCVD and FCA, jointly with t
�0 ��s� from OCVD measurements previous to sample preparation�HL,eff ��s� from OCVD measurements after sample preparation�HL,eff ��s� from FCA measurements �drift region average far from irrad�HL,surf calculated ��s�
ownloaded 11 May 2010 to 205.161.180.253. Redistribution subject to
Usually, the helium irradiation process is followed by annealingto remove the defects unstable at the working temperature range ofthe device, which would otherwise change the device parametersduring its operation.43 Therefore, from Eq. 4, the resulting �HL,bulk
ir
when the diode is in the on-state and its drift region is under highinjection corresponds to
�HL,bulkir �y� = �0��N�� 1
1 +�0
�ir��N�f�y� �8�
where
��N� = �a +b
1 + � N
Nref�
Notice that �0−1 and �ir
−1 are related to the density of the recom-bination centers Nt,0 �background� and Nt,i �radiation induced foreach energy level i� by the proportionality factors c0 and ci as �0
−1
= �c0 � Nt,0� and �ir−1 = �i=1
2 �ci � Nt,i�. c0 and ci are functions ofthe excess carrier concentration, the emission rate of carriers, andthe capture rate of carriers �capture coefficients�.44
Depth-resolved high level lifetime determination.— �HL,eff hasbeen derived by fitting procedures on the carrier decay after turningoff the current. The error in �HL,eff is evaluated from the fitting andconsidering the standard deviation of �HL,eff ���HL,eff
� along the driftregion, which is assumed as a stochastic noise introduced by a non-uniform surface carrier recombination. The spatial error in �HL,eff ismostly associated with the beam radius averaged along the interac-tion length with the diode � 12.5 �m�. �HL,surf has been derivedfrom FCA and OCVD results following the procedure previouslymentioned: Before cutting the diode, the OCVD measurements areperformed, and after the diode preparation, both the OCVD andFCA measurements are again carried out to quantify the lifetimevariation. Table I reports these OCVD results before and after thediode preparation, jointly with the FCA lifetime measurements andthe finally extracted �HL,surf for each device. Notice that in cut di-odes, �HL,eff measured by OCVD agrees with the FCA results whenthey are averaged along the drift region.
For the determination of �HL,bulk in both cases, Eq. 3, 5, and 8have been used. In the first place, the parameters a, b, and Nref havebeen extracted by fitting Eq. 5 to the results of the unirradiateddevice, considering for �0 and �HL,surf the values detailed in Table I.The value obtained for Nref agrees with other results reported �e.g.,see Ref. 39�. Once the parameters for the unirradiated case havebeen identified, the parameters rp�E�, l, rp�E�, and �ir
−1 correspond-ing to G�y� are determined by fitting Eq. 8 to �HL,eff. DeterminingG�y� is very interesting because it can be settled into any physicalsimulation package by introducing the extracted f�y� and setting thesimulation parameters to obtain the derived �ir
−1. All parameters re-sulting from these fittings are summarized in Table II.
Figure 6a and b compares �HL,eff and �HL,bulk between both di-odes �the origin of the depth y is at the device top�, respectively. Theresults obtained from the fitting of Eq. 5 and 8 are plotted within therange in which the high injection condition is reached �FCA mea-surement range�. Figure 6a shows that the main difference between
racted �HL,surf. In OCVD measurements, the error is not computed.
Unirradiated Irradiated
94 2320 16
depth� 19 1 14 116 24
he ext
iation
ECS license or copyright; see http://www.ecsdl.org/terms_use.jsp

H716 Journal of The Electrochemical Society, 157 �7� H711-H720 �2010�H716
D
the measured results from the unirradiated and irradiated devices isthe sudden increase in �HL,eff from 2.5 to 14 �s, experienced closeto the ion-penetration range rp�E� �near the PN− junction� for theirradiated diode �red dot points�, which contrasts with the constantprofile �around 19 �s� obtained in the other case �black squarepoints�. This fact gives evidence for the local lifetime change, aspreviously noticed, and allows a direct inspection of the irradiationeffects inside the diode. The difference observed between the mea-sured values of �HL,eff for each device �i.e., 14 and 19 �s� is due tothe sample preparation procedure because the surface recombinationis not totally controlled during this process �see Table I�, as previ-ously stated. In Fig. 6a, experiments are compared to the theoreticalpredictions from Eq. 3 and 5-18 �unirradiated, in solid black line;irradiated, in dash red line�.
Figure 6b shows the �HL,bulk extracted from Eq. 8 for the unirra-diated and irradiated devices �in solid black and dash red lines,respectively�. From the results, it is observed that the irradiationpeak diminishes the lifetime locally at rp�E�, and the defect tail has
Table II. Parameters extracted from fitting Eq. 8 to experimentalresults.
a 0.05b 0.95Nref �cm−3� 7 � 1015
�ir−1 ��s−1� 0.8
rp�E� ��m� 60rp�E� ��m� 12l ��m� 6
Figure 6. �Color online� Comparison of �a� �HL,eff and �b� �HL,bulk betweenboth considered diodes �black square points, unirradiated; red dot points,irradiated�.
ownloaded 11 May 2010 to 205.161.180.253. Redistribution subject to
a slight effect on the lifetime. The inset in Fig. 6b compares a defectprofile derived from SRIM simulations36 �solid black� to the resultsinferred from Eq. 8 �dash red�. To better compare both curves, thecurve in the inset that refers to SRIM simulations corresponds to theproduct of f�y� derived from SRIM calculations with �ir
−1 obtainedfrom the fittings. The inset in Fig. 6b evidences how the fittingresults present a higher rp�E� than SRIM simulations because thedefects’ diffusion during the irradiation and the subsequent thermalannealing are not taken into account by SRIM.43,45 Moreover, SRIMresults predict rp�E� = 65 �m, in agreement with DLTS measure-ments shown in Ref. 46 with another diode, whereas the best fit ofEq. 8 is obtained when rp = 60 �m �see Fig. 6a�. This difference isin the error range when several devices are altogether irradiated inthe same process �below 10 �m�, as shown in Ref. 46. These resultssuggest that the procedure detailed above is suitable to experimen-tally extract f�y�.
Steady-State Excess Carrier Profile Analysis
Excess carrier concentration in unirradiated bipolar power di-odes in steady state.— Under the current densities �i� at which bi-polar power diodes are usually working, the excess carrier concen-tration of electrons �n� and holes �p� in the drift region is higherthan that of the doping level N, verifying n = p = CSS �high in-jection condition�. According to Ref. 47, the excess carrier concen-tration CSS�y� within the drift region for low current densities��20 A/cm2� depends on the depth y as
CSS�y� = i�m�0
q2La� cosh��y − yp − d�/La�
sinh�d/La�
− B�sinh��y − yp − d�/La�
cosh�d/La�� �9�
where the origin is taken from the top of the P+ anode layer �see Fig.2�, yp corresponds to the location of the PN− junction, d represents ahalf of the drift region thickness, q is the electron charge, and La isthe ambipolar diffusion length defined as La = ��0Da �Da is the am-bipolar diffusivity�. The constant B� is defined as
B� =B + �r − �l
�m�10�
where B is expressed in terms of the electron and hole mobilities ��nand �p, respectively� as
B =�n/�p − 1
�n/�p + 1�11�
and �r, �l, and �m account for the contribution to the total currentdensity corresponding, respectively, to the diffusion currents at thePN− �in�yp�, electrons� and N−N+ �ip�yp + 2d� holes� junctions andthe excess carrier recombination within the drift region �im�. Allthese coefficients must verify the condition
�m + �r + �l = 1 �12�
because the sum of all these current components must be equal tothe total current i, that is
i = in�yp� + im + ip�yp + 2d� �13�
In turn, in�yp�, ip�yp + 2d�, and im can be expressed as47
in�yp� = �li = qDn
Lncoth� dp
Ln�CSS
2 �yp�NA
− �14�
ip�yp + 2d� = �ri = qDp
Lpcoth� dn
Lp�CSS
2 �yp + 2d�ND
+ �15�
ECS license or copyright; see http://www.ecsdl.org/terms_use.jsp

H717Journal of The Electrochemical Society, 157 �7� H711-H720 �2010� H717
D
im = �mi =q2dC̄SS
��16�
where C̄SS = �1/2d��yp+2dyp dyCSS�y�, NA
− and ND+ are the peak doping
concentrations of the P-buffer and N+-layers, dp and dn correspondto the thickness of the P-buffer and N+-layers, Dn and Ln depict theelectrons’ diffusivity and diffusion length in the P-buffer layer, andDp and Lp show the holes’ diffusivity and diffusion length in theN+-layer. This model predicts the displacement of the minima of theexcess carrier concentration as a function of the emitter carriers’injection �see Eq. 10�. This is an interesting issue as shown furtheron.
When designing a fast-reverse recovery diode, the following pa-rameter is defined1
k =CSS�yp�
CSS�yp + 2d��17�
which corresponds to the ratio between the excess carrier concen-tration at the PN− and N−N+ junctions. Usually, for an optimum andreliable reverse recovery,1 k � 1 is desired, i.e., CSS�yp�� CSS�yp + 2d�. With this excess carrier shape, the time requiredfor the carrier removal close to the PN− junction is shorter. Conse-quently, the depletion of the drift region to gradually sustain theblocking voltage is started earlier in time, hereby considerably re-ducing the peak reverse recovery current.42 This unbalance is alwaysobtained by emitter engineering or lifetime control processes, as canbe seen from rewriting k in terms of technological parameters usingEq. 14 and 15 as follows
k = �NA− �l�Dp/Lp�coth�dn/Lp�
ND+ �r�Dn/Ln�coth�dp/Ln�
�18�
From Eq. 18, it can be inferred that CSS�yp� can be diminished byeither increasing dp and diminishing NA
− /ND+ �emitter-control, front-
end process�, or lowering Lp, Ln, and �l �axial lifetime control tech-niques, back-end process�.
Measured excess carrier concentration modulation by emittercontrol.— To demonstrate the influence of the P-buffer layer on theexcess carrier concentration, the unirradiated device has been elec-trically excited by short current pulses �84 �s� from 1.5 to16 A/cm2. Subsequently, the model outlined in Eq. 9-12 has beenemployed for the sake of the results’ interpretation by fitting it to theexperimental data. To compute the carrier mobilities in Eq. 11, thefollowing expression is used42
�n�p�−1 = �n�p�,0
−1 + 1/2�eh−1 �19�
where �p,0 and �n,0 are the hole and electron mobilities when notemperature and injection effects are considered, and the term �ehtakes into account the mobility reduction due to the e−–h+ scattering.In this work, �eh has been described by the Cornwell–Weisskopfmodel42
�eh−1 =
CSS�y�D
Ln�1 + FCSS−2/3�y�� �20�
where D and F are fitting parameters. To determine Da and La in Eq.9, the ambipolar mobility �a is calculated according to42
�a−1 = �p,0
−1 + �n,0−1 + �eh
−1 �21�
This result allows the determination of the ambipolar diffusivity Daunder a high injection condition42
Da =2kT
q�a �22�
All values of the parameters used in the computation of Eq. 19 and22 are summarized in Table III.48-50 D and F have been identifiedfrom fitting Eq. 20 to the measured ambipolar diffusion data re-
ownloaded 11 May 2010 to 205.161.180.253. Redistribution subject to
ported in Ref. 50, obtaining F = 2.14 � 1012 and D = 2.99
� 1020 cm−1 V−1 s−1. Furthermore, CSS�y� � C̄SS is assumed inEq. 20. This is a good approximation because no significant varia-tion in the measured CSS�y� has been observed, and the model pre-diction agrees with the experimental data.
The fitting procedure consisted in introducing all known param-eters into Eq. 9 and gradually determining �m,�l,�r, following aniteration loop and taking into account the relationship �m + �l+ �r = 1. First, �m was identified because it was the only parameter
not directly measured, which provided the C̄SS value. After that, B�was extracted for each i. From the evaluation of B, �l and �r weredetermined using Eq. 10 and 12. This process was repeated until theerror between the experimental points and the model prediction wasminimized.
Figure 7a and b gives evidence for the emitter-control effects onCSS when the current density i is increased. Figure 7a compares theCSS model fit with the measured excess carrier data, showing a highagreement between experiment and theory. This figure also depictsthat CSS grows with increasing i �as the SRH model predicts� up to11 A/cm2, maintaining k � 1 approximately. From i = 16 A/cm2,it is clearly observed as k � 1. Figure 7b depicts the dependence ofthe total current i on CSS�yp� and CSS�yp + 2d�. From Eq. 13-15,one may infer that i should quadratically depend on CSS�yp� andCSS�yp + 2d�, but in our measurements, there is a contribution of therecombination current in the drift region. This is inferred from thefact that although in both cases of CSS�yp� and CSS�yp + 2d�, apowerlike dependence has been measured, it is not a pure quadraticone. This behavior can be attributed to the low current biasing con-ditions �im contribution to i not negligible�, as already observed inRef. 51. Therefore, one may admit that there is a transition betweena conduction current based on carrier recombination to anotherbased on carrier diffusion at the PN− and N−N+ junctions. One im-portant outcome of the used model in Fig. 7a is that it allows ex-tracting the dependence of �m, �l, and �r on i, as well as the injec-tion efficiency of the junctions ��l,�r� defined as follows47
�l = �1 − �l� �23�
�r = �1 − �r� �24�
�l��r� provides information on the efficiency of a P �N� emitterwhen injecting holes �electrons� into the N− drift region. In thisprocess, the recombination at the P- and N+-layers has been ne-glected because this effect is mostly manifested at higher i and CSSvalues ��50 A/cm2 and �1017�, as shown in Ref. 51. Figure 8aand b plots the aforementioned dependencies. Figure 8a illustratesthe dependence of �m, �l, and �r on i. Even at very low currentdensities �around 1 A/cm2�, it is observed that the diffusion com-ponents of the total current ��l and �r� have a higher contributionthan the recombination one ��m�, as already reported for these cur-rent densities.47,52 �m diminishes as i increases, following a square-
like law. This dependence is expected, as im � C̄SS � i1/2 and �m= im/i.47 On the other hand, �r and �l maintain a slight dependenceon i. This behavior is in accordance with the observed results in Fig.7, which demonstrates as the P-buffer layer modulates CSS�yp�.47
Figure 8b reports that �l and �r slightly diminish with i following apowerlike law. At first sight, there is no strong dependence of �l and� on i for the selected biasing conditions.
Table III. Parameters used for the mobility computation
Value Reference
�n,0 �cm2 V−1 s−1� 1360 48�p,0 �cm2 V−1 s−1� 495 49F �cm−2� 2.1372 � 1012 This work and Ref. 50D �cm−1 V−1 s−1� 2.9934 � 1020 This work and Ref. 50
r
ECS license or copyright; see http://www.ecsdl.org/terms_use.jsp

H718 Journal of The Electrochemical Society, 157 �7� H711-H720 �2010�H718
D
Emitter control and local lifetime tailoring effects on excess car-rier concentration.— Due to the lack of analytical models describ-ing the diode forward-bias behavior when ion irradiation was per-
Figure 7. �Color online� �a� Comparison between the measured excess car-rier concentration profiles and the results inferred from fitting Eq. 8 to ex-periment at several current densities. �b� Measured dependence of the currentdensity on CSS�yp� �red dot points� and CSS�yp + 2d� �black square points�and its corresponding trend lines.
1 100.01
0.1
1
-0.49+0.05
ηr
ηl
ηη m,ηη
l,ηη r
[]
i [A/cm2]
ηηm
γγl
1 100.4
0.45
0.5
0.55
0.6
0.65
0.7 (b)
γγl ,γγr []
i [A/cm2]
(a)
γr
Figure 8. �Color online� �a� Observed dependence of the diffusion and re-combination contribution to the total current i. �b� Dependence of PN− andN−N+ junction injection efficiency on the current density.
ownloaded 11 May 2010 to 205.161.180.253. Redistribution subject to
formed, physical device simulations were carried out using the soft-ware package Sentaurus device, TCAD.31 The measured parametersfor the lifetime dependence on the doping level were used in theperformed simulation. Concerning the irradiated diodes, the deeplevels E4 and E1 were considered. From the measurements of highlevel lifetime profiles, we extracted f�y� and we considered that thesame profile f�y� �with rp = 60 �m� applies for both deep levels,but with a different defect concentration peak Nt,i �weighting factor�.Each Nt,i has been modified to obtain the lifetime profile extractedfrom the irradiated diode. The capture coefficients for the SRHmodel have been taken from Refs. 28 and 37. In these simulations,the recombination on the polished walls of the devices has not beentaken into account. Although this effect is mitigated by the polishingprocess, C experiences slight changes inside the device that affectthe simulation results less than an order of magnitude �as previouslydemonstrated�. Thus, as a first approximation, simulation resultsprovide the trends and the order of magnitude of the excess carrierconcentration inside the drift region.
Figure 9a and b illustrates the dependence of CSS profiles on thecurrent density for the irradiated and unirradiated diodes, respec-tively. In this graph, the experimental �points� and simulation �solidlines� results are compared at several current densities representative
Figure 9. �Color online� Comparison of the excess carrier concentration inthe drift region between measurements �points� and simulation results �solidlines� at current densities of 2.8 �white triangles�, 5 �black squares�, 8 �whitediamonds�, and 11 �black dots� �A/cm2� for both diodes: �a� irradiated and�b� unirradiated. From simulation results, the excess carrier concentrations ofholes �red solid lines, p� and electrons �black solid lines, n� are alsoshown, as well as the doping profile �blue dot-dashed line�.
ECS license or copyright; see http://www.ecsdl.org/terms_use.jsp

H719Journal of The Electrochemical Society, 157 �7� H711-H720 �2010� H719
D
of the nonemitter-control regime �2.8, 5, 8, and 11 A/cm2�. In ad-dition, the background doping profile �blue dot-dashed line� is alsoshown for a better comprehension of the experimental results. In thisfigure, CSS increases with the current density in both cases, main-taining its profile shape. It can also be observed that the excesscarrier concentrations of electrons �n, black solid line� and holes�p, red solid line� reach the same level along the drift region forboth devices �high injection condition�. By contrast, p and n arevery different outside this region. Depending on the difference be-tween the excess carrier and doping concentrations, n and p ei-ther increase following the doping profile �majority carrier case� orrapidly decrease to very low concentrations �minority carrier case�.It is detected by FCA measurements that CSS slightly overcomes thedoping level at the P-buffer anode.
From the comparison between simulation and experiment, theyqualitatively agree. As observed in Fig. 9a, the differences betweenexperiment and simulation increase when the current density de-creases. Nonetheless, the higher discrepancies between experimentand simulation are observed in the unirradiated diode when CSS ismeasured closer to the cathode side. As Fig. 9b shows, the experi-mental points deviate from the simulation results. This may be dueto the error introduced by the diode preparation process �within 14%deviation� as previously estimated, but this fact does not affect theinterpretation of the results when both devices are compared.
Figure 10 graphically depicts the ion-irradiation modulation onCSS at two current densities, 2.8 A/cm2 �square points, dashedlines� and 11 A/cm2 �dot points, solid lines�, by comparing experi-mental �points� and simulation �solid and dashed lines� results forboth diodes �unirradiated experimental results in black and irradi-ated experimental results in white�. In addition, the background dop-ing profile �blue dot-dashed line� is also included for a better com-prehension. The main difference between both devices stems fromthe behavior of n and p in the drift region. In comparison withthe unirradiated case, the defects created at the ion penetration rangeinduce a decrease in CSS along the drift region, as CSS�yp� is re-duced by the carrier recombination. As Fig. 10 shows, this effect isexperimentally observed, obtaining a good agreement with simula-tion results. This behavior is due to an increase in im�yp�, whichinduces a decrease in in�yp�. This can be demonstrated from themeasurements by comparing the �m and �l before �i.e., �m
unir and�unir� and after �i.e., �ir and �ir� the device irradiation, expecting to
Figure 10. �Color online� Comparison of the excess carrier concentrationprofiles between experiment �points� and simulation results �solid and dashedlines� for the unirradiated �black symbol� and irradiated diodes �white sym-bol� at two current densities: 2.8 A/cm2 �square points, dashed lines� and11 A/cm2 �dot points, solid lines�. Hole �red solid and dashed lines� andelectron �black solid and dashed lines� carrier excess concentrations �p,n�are also represented, as well as the doping profile �blue dot-dashed line�.
l m l
ownloaded 11 May 2010 to 205.161.180.253. Redistribution subject to
find �mir � �m
unir and �lir � �l
unir. This can be derived consideringthat in the irradiated diode, the recombination current im,ir corre-sponds to47
im,ir = q�yp+2d
yp
dyCSS,ir�y�
�HL,bulkir �y�
�25�
where CSS,ir�y� is the CSS�y� for the irradiated diode. Taking Eq. 8and supposing �a + b/�1 + �N/Nref��� � 1 because N � Nref in thedrift region, as previously demonstrated, the mean value of excesscarrier concentration stored in the drift region of the irradiated diode
�C̄SS,ir� is
C̄SS,ir =�0i�m
ir
2dq−
�0
2d�ir�
yp+2d
yp
dy�CSS,ir�y�f�y�� �26�
Determining both �mir from Eq. 26 and �m
unir from Eq. 16, one mayinfer that im is changed by the irradiation process as follows
�mir − �m
unir =q
i�ir�
yp+2d
yp
dy�CSS,ir�y�f�y�� −q2d
�0i�C̄SS,unir − C̄SS,ir�
�27�
where C̄SS,unir corresponds to the CSS value averaged within thediode drift region, calculated as defined in Eq. 16. By assuming thatthe ion irradiation does not affect the diffusion current component atthe N−N+ junction �i.e., �r�, Eq. 27 may be rewritten as
�lir − �l
unir = −q
i�ir�
yp+2d
yp
dy�CSS,ir�y�f�y�� +q2d
�0i�C̄SS,unir − C̄SS,ir�
�28�
Equations 27 and 28 verify �mir − �m
unir = −��lir − �l
unir� and depicttwo competing mechanisms, which differently contribute to the dif-fusion current at the PN− junction. The locally induced defects in-crease the current recombination component, diminishing the diffu-
sion one, whereas C̄SS,unir − C̄SS,ir increases the gradient of thecarrier concentration at the PN− junction, provoking the oppositeeffect. From the design point of view, it is required that the defects’term becomes more important than the reduction in excess carrierconcentration. In such an optimal situation, the injection efficiency�l of the PN− junction increases. To check whether the behaviortheoretically described corresponds to the observed one on the ana-lyzed diodes, Eq. 27 has been evaluated using the experimental re-sults. We obtain that �m
ir − �munir are 0.14 and 0.20 for i
= 2.8 A/cm2 and i = 11 A/cm2, respectively. Therefore, the previ-ous assumptions �m
ir � �munir and �l
ir � �lunir are corroborated from
the experimental results. Notice that although Eq. 27 and 28 areaveraged results along the drift region, their predictions are validbecause the local irradiation directly actuate on the efficiency of thePN− junction, changing the rest of the other parameters within thedevice drift region.
One may infer from Fig. 10 and 7a that emitter-control tech-niques are very effective for medium and high current densities butnot efficient enough for the operation at very low current densitiesduring a very fast recovery when a snappy recovery can occur andan undesired electromagnetic interference or even a failure can takeplace.1 From Eq. 18, it is possible to estimate which is the depen-dence of the parameter k after irradiation �kir� on the unirradiatedone �kunir� by substituting �l
ir in Eq. 18 after its extraction from Eq.28. One may see that from the previous results, kir is related to kuniras
ECS license or copyright; see http://www.ecsdl.org/terms_use.jsp
H720 Journal of The Electrochemical Society, 157 �7� H711-H720 �2010�H720
D
kir = kunir�1 −q
�iri�lunir�
yp+2d
yp
dy�Cir�y�f�y�� +q2d
�0i�lunir�C̄SS,unir − C̄SS,ir�
�29�As may be inferred from Eq. 29, the ion-irradiation process im-proves the diode response for low current densities because the con-dition k � 1 can be achieved by �i� an appropriate irradiation dose,�ii� a sufficiently low doping concentration at the position of thedefect peak �ion range�, and �iii� using both the irradiation and an-nealing techniques, giving at least one suitable deep level within thebandgap, which controls the low level lifetime. In our case, it is thedivacancy V0
�−/0�.As the current density i increases, the recombination current in
the drift region diminishes, whereas the diffusion current at bothjunctions increases.47 In these current ranges, the excess carrier pro-file is totally fixed by the emitter-control mechanisms as it is pinnedto the doping profile. Therefore, the combination of emitter andlifetime control strategies is the best choice to obtain an optimumexcess carrier profile from low to high current densities in a fast-recovery diode.
Conclusions
The excess carrier control mechanisms are measured on fast-recovery diodes working at low current densities when local irradia-tion is performed. For this purpose, the excess carrier concentrationand its lifetime profile are measured in irradiated and unirradiateddiodes. From their comparison, it is clearly demonstrated how theexcess carrier concentration, jointly with the excess carrier lifetime,is modified by emitter or lifetime engineering approaches. Suchmeasurements have been performed biasing the devices at low cur-rent density levels during short pulses �84 �s� to avoid the self-heating effects. From lifetime measurements, it has been possible toextract by simple analytical models the lifetime dependence on thedoping level, the defect profile waveform, and the ion-irradiationeffect on the lifetime profile. The emitter control by a buffer layerhas been studied using an analytical model to highlight its behaviorat low current densities. Moreover, the measured excess carrier con-centration in both diodes has been compared with simulation results.The simulations have been calibrated by the lifetime measurementsperformed in both devices to achieve a good agreement betweenexperiment and simulation. As a result, it has been shown how theirradiation can improve the excess carrier distribution for softer fast-recovery diodes at low current densities. A valuable analysis of thelifetime and carrier concentration can be performed by analyticalmodeling and physical simulation, provided that an accurate param-eter identification is available from experiment.
Acknowledgment
This work has been partially supported by the “Consejo Superiorde Investigaciones Científicas” �CSIC� �under contract “Junta parala Ampliación de Estudios,” JAE-Doc�, the Spanish Ministry of Sci-ence and Innovation �research programs: THERMOS TEC2008-05577 and RUE CSD2009-00046�, and the Ministry of Education,Youth and Sports of the Czech Republic �research program no.MSM 6840770017�. The authors acknowledge H. von Kiedrowski�PDI Berlin, Germany� for polishing the samples, Polovodiče a. s.�Prague� for providing the samples, and T. Schumann �FZR Dres-den, Germany� for irradiating the diodes.
Centro Nacional de Microelectrónica assisted in meeting the publicationcosts of this article.
References1. M. T. Rahimo and N. Y. A. Shammas, IEEE Trans. Ind. Appl., 37, 661 �2001�.
ownloaded 11 May 2010 to 205.161.180.253. Redistribution subject to
2. A. Porst, F. Auerbach, H. Brunner, G. Deboy, and F. Hille, in Proceedings ofISPSD, Weimar, Germany, p. 213 �1997�.
3. J. Lutz, in Proceedings of EPE, Trondheim, Norway, p. 1502 �1997�.4. M. Rahimo and A. Kopta, in Proceedings of ISPSD, Santa Barbara, USA, p. 83
�2005�.5. J. Lutz, R. Baburske, M. Chen, B. Heinze, M. Domeij, H.-P. Felsl, and H.-J.
Schulze, IEEE Trans. Electron Devices, 56, 2825 �2009�.6. J. Vobecký, in Proceedings of ASDAM, Smolenice Castle, Slovakia, p. 21 �2000�.7. R. Siminiec, F.-J. Niedernostheide, H.-J. Schulze, W. Südkamp, U. Kellner-
Werdehausen, and J. Lutz, J. Electrochem. Soc., 153, G108 �2006�.8. P. Hazdra, J. Vobecký, and K. Brand, Nucl. Instrum. Methods Phys. Res. B, 186,
414 �2002�.9. P. Hazdra, J. Vobecký, H. Dorschner, and K. Brand, Microelectron. J., 35, 249
�2004�.10. J. Vobecký, P. Hazdra, J. Voves, and F. Spurný, in Proceedings of ISPSD, Davos,
Switzerland, p. 265 �1994�.11. N. Keskitalo, A. Hallén, F. Masszi, and J. Olsson, Solid-State Electron., 39, 1087
�1996�.12. O. Humbel, N. Galster, T. Dalibor, T. Wikström, F. D. Bauer, and W. Fichtner,
IEEE Trans. Power Electron., 18, 23 �2003�.13. T. T. Mnatsakanov, A. E. Schlögl, L. I. Pomortseva, and D. Schröder, Solid-State
Electron., 43, 1703 �1999�.14. S. R. Lederhandler and L. J. Giacoletto, in Proc. IRE, 43, 477 �1955�.15. X. Perpiñà, X. Jordà, N. Mestres, M. Vellvehi, P. Godignon, J. Millán, and H. von
Kiedrowski, Meas. Sci. Technol., 15, 1011 �2004�.16. M. Rosling, H. Bleichner, and E. Nordlander, in Proceedings of EPE-MADEP,
Firenze, Italy, p. 59 �1991�.17. F. Hille, L. Hoffmann, H.-J. Schulze, and G. Wachutka, in Proceedings of ISPSD,
Toulouse, France, p. 299 �2000�.18. R. Thalhammer, Ph.D. Thesis, Fakultät der Elektrotechnik und Informationstech-
nik, Technishe Universität München, Munich �2000�.19. L. W. Davies, Proc. IEEE, 51, 1637 �1963�.20. H. Benda and E. Spenke, Proc. IEEE, 55, 1331 �1967�.21. W. Shockley and W. T. Read, Phys. Rev., 87, 835 �1952�.22. J. Vobecký, P. Hazdra, and V. Záhlava, Microelectron. J., 30, 513 �1999�.23. H. Bleichner, M. Rosling, J. Vobecky, M. Lundqvist, and E. Nordlander, in Pro-
ceedings of ISPSD, Tokyo, Japan, p. 246 �1990�.24. M. Rosling, H. Bleichner, M. Lundqvist, and E. Nordlander, Solid-State Electron.,
35, 1223 �1992�.25. X. Perpiñà, X. Jordà, M. Vellvehi, J. Millán, and N. Mestres, Rev. Sci. Instrum., 76,
025106 �2005�.26. A. E. Schlögl, Ph.D. Thesis, Fakultät der Elektrotechnik und Informationstechnik,
Technishe Universität München, Munich �1999�.27. H.-J. Schulze, A. Frohnmeyer, F.-J. Niedernostheide, F. Hille, P. Tütto, T. Pavelka,
and G. Wachutka, J. Electrochem. Soc., 148, G655 �2001�.28. P. Jonsson, H. Bleichner, M. Isberg, and E. Nordlander, J. Appl. Phys., 81, 2256
�1997�.29. H. Schlangenotto and H. Maeder, IEEE Trans. Electron Devices, 26, 191 �1979�.30. W. Gerlach, H. Schlangenotto, and H. Maeder, Phys. Status Solidi A, 13, 277
�1972�.31. Synopsys, Sentaurus Device User Guide, Version A-2008.09 �2008�.32. D. K. Schroder, IEEE Trans. Electron Devices, 44, 160 �1997�.33. K. L. Luke and L.-J. Cheng, J. Appl. Phys., 61, 2282 �1987�.34. Z. G. Ling, P. K. Ajmera, and G. S. Kousik, J. Appl. Phys., 75, 2718 �1994�.35. S. Sumie, F. Ojima, K. Yamashita, K. Iba, and H. Hashizume, J. Electrochem. Soc.,
152, G99 �2005�.36. J. F. Ziegler and J. P. Biersack, SRIM2000.39, Stopping and Range of Ions in
Matter �2000�.37. A. Hallén and N. Keskitalo, J. Appl. Phys., 79, 3906 �1996�.38. Synopsis, Sentaurus Device User Guide, p. 293 �2008�.39. J. G. Fossum and D. S. Lee, Solid-State Electron., 25, 741 �1982�.40. J. Vobecký, P. Hazdra, O. Humbel, and N. Galster, Microelectron. Reliab., 40, 427
�2000�.41. H. Bleichner, P. Johnsson, N. Keskitalo, and E. Nordlander, J. Appl. Phys., 79,
9142 �1996�.42. B. J. Baliga, Modern Power Devices, p. 196, Wiley-Interscience, Singapore �1987�.43. J. P. Spratt, E. A. Burke, J. C. Pickel, and R. E. Leadon, IEEE Trans. Nucl. Sci.,
48, 2136 �2001�.44. J. Vobecký, P. Hazdra, and V. Záhlava, Microelectron. Reliab., 43, 537 �2003�.45. A. Hallén and N. Keskitalo, Nucl. Instrum. Methods Phys. Res. B, 186, 344 �2002�.46. P. Hazdra, J. Rubeš, and J. Vobecký, Nucl. Instrum. Methods Phys. Res. B, 159,
207 �1999�.47. A. Herlet, Solid-State Electron., 11, 717 �1968�.48. G. Baccarani and P. Ostoja, Solid-State Electron., 18, 579 �1975�.49. D. M. Caughey and R. E. Thomas, Proc. IEEE, 55, 2192 �1967�.50. M. Rosling, H. Bleichner, P. Jonson, and E. Nordlander, J. Appl. Phys., 76, 2855
�1994�.51. F. Berz, R. W. Cooper, and S. Fagg, Solid-State Electron., 22, 293 �1979�.52. S. K. Ghandi, Semiconductor Power Devices, p. 93, Wiley-Interscience, New York
�1977�.
ECS license or copyright; see http://www.ecsdl.org/terms_use.jsp