Embed Size (px)
Citation preview

ANALYSIS OF ENVIRONMENTAL BACTERIA CAPABLE
OF UTILIZING REDUCED PHOSPHORUS COMPOUNDS
____________
A Thesis
Presented
to the Faculty of
California State University, Chico
____________
In Partial Fulfillment
of the Requirements for the Degree
Master of Science
in
Biological Sciences
____________
by
Brandee L. Stone
Summer 2011

ANALYSIS OF ENVIRONMENTAL BACTERIA CAPABLE
OF UTILIZING REDUCED PHOSPHORUS COMPOUNDS
A Thesis
by
Brandee L. Stone
Summer 2011
APPROVED BY THE DEAN OF GRADUATE STUDIES AND VICE PROVOST FOR RESEARCH:
Eun K. Park, Ph.D.
APPROVED BY THE GRADUATE ADVISORY COMMITTEE:
!"#$%#&'()**"$+,#&*"-.(,#/'0($'1"'' Andrea K. White, Ph.D., Chair Graduate Coordinator Daniel D. Clark, Ph.D. Patricia L. Edelmann, Ph.D. Larry F. Hanne, Ph.D. Gordon V. Wolfe, Ph.D.

iii
ACKNOWLEDGEMENTS
A thesis, though bearing a single author, is never a solo project.
Without the support of the faculty (past and present in biology and chemistry) I
never would have made it to the beginning of a Masters program. Without their
continued support, I never would have made it to the end. Thank you Dr. Dan
Clark, Dr. Patricia Edelmann, Dr. Larry Hanne, and Dr. Gordon Wolfe for your
extensive support including guidance on developing experiments, data analysis,
and reviews of this thesis. Thank you to past and present members of the
Microbial Biochemistry Research Group, especially Dr. Larry Kirk, for your
interest, questions, and suggestions. A huge thank you to Dr. Colleen Hatfield for
your guidance and the very often swift kicks to get me back on track. Thank you
Dr. Andrea White for taking a chance on a (sometimes) misguided
undergraduate. Without you, this thesis would have been authored by another.
Thank you Dr. William W. Metcalf for the control strains used in this study. Thank
you Jeremy Ault and Jared Stockwell for your help with the PCR experiments.
Finally, thank you to my friends and family. You never stopped cheering,
pushing, and understanding. Support was received through the California State
University, Chico Graduate Equity Fellowship. This work was funded by the
Faculty-Student Collaborative Research Seed Grant from the California State
University Program for Education and Research in Biotechnology (CSUPERB).

iv
TABLE OF CONTENTS
PAGE
Acknowledgements ....................................................................................... iii List of Tables ................................................................................................. vi List of Figures ................................................................................................ vii List of Nomenclature ...................................................................................... ix Abstract ......................................................................................................... x CHAPTER
I. Introduction .................................................................................. 1
Molecular and Biochemical Characterization of Reduced Phosphorus Oxidation Pathways .................................... 4
Questions .......................................................................... 9
II. Materials and Methods ................................................................. 11
Media and Growth Conditions ........................................... 11 Most Probable Number for Reduced Phosphorus Oxidizing Bacteria ........................................................... 12 Genetic Analyses for htxA and ptxD .................................. 19
III. Results ......................................................................................... 24
Most Probable Number for Reduced Phosphorus Oxidizing Bacteria ........................................................... 24 Genetic Analyses for htxA and ptxD .................................. 32
IV. Discussion .................................................................................... 47
Most Probable Number for Reduced Phosphorus Oxidizing Bacteria ........................................................... 47 Genetic Analyses for htxA and ptxD .................................. 52

v
PAGE References .................................................................................................... 61 Appendix
A. Percent similarities for 16s, ptxD, and htxA .................................. 67

vi
LIST OF TABLES
TABLE PAGE
1. Locations of sample sites in Glenn and Butte County, California ........ 14
2. Soil properties from the Soil Data Mart database for 12 natural environmental sites in Butte and Glenn County showing these are typical (i.e. not extreme) sites .................................................. 16
3. Primers and expected product size for amplified htxA and ptxD
products ......................................................................................... 21 4. Substrate ranges, hybridization, and PCR for ptxD and htxA of
19 isolates ..................................................................................... 34

vii
LIST OF FIGURES
FIGURE PAGE
1. Structure, oxidation states, and abbreviations of reduced P compounds used or referenced in this study ................................ 2
2. Diagram showing the traditional P cycle ............................................ 3
3. Operons, loci, and substrates specific to each involved in the
catalysis of reduced P compounds in P. stutzeri WM88, A.
faecalis WM2072, X. flavus WM2814, and E. coli B ..................... 6
4. Biochemical pathway for HtxA and PtxD as characterized in P. stutzeri WM88 .............................................................................. 7
5. Location of MPN sites in Glenn and Butte County, California ............ 15
6. Diagram of MPN experimental setup ................................................. 19
7. MPN/g soil for sample Soil1 ............................................................... 25
8. The average MPN/g for 12 aquatic and terrestrial sites shows the
number of bacteria capable of oxidizing Hpt, Pt, or AEpn are comparable to the MPN/g with Pi as the sole P source ................ 26
9. MPN/g sediment or soil slurry for 12 samples collected during
summer (A) or winter (B) .............................................................. 28 10. MPN/g for reduced P oxidizing bacteria in each of the 12 aquatic
(Sed) and terrestrial (Soil) sites arranged by most pristine (Sed1, mountain stream) to least pristine (Sed8, extensive urban and agricultural run-off) ...................................................... 30
11. Ratio of MPN capable of growth on Hpt, Pt, and AEpn expressed
as a percentage of Pi (defined as 100%) ...................................... 31 12. Average MPN/g sediment or soil slurry for paired sites .................... 32 13. 16S rRNA identifications of 19 reduced P oxidizing bacteria ............. 35

viii
14. Hybridization for P. stutzeri WM88 ptxD ............................................ 37 15. Hybridization for htxA ......................................................................... 37
16. A 1% TAE agarose gel stained with ethidium bromide for htxA
PCR products for all isolates ........................................................ 38 17. A 1% TAE agarose gel stained with ethidium bromide for A.
faecalis WM2072 ptxD PCR products for all isolates.................... 39 18. A 1% TAE agarose gel stained with ethidium bromide for P.
stutzeri WM88 ptxD PCR products for all isolates ........................ 40 19. A 1% TAE agarose gel stained with ethidium bromide for X.
flavus WM2814 ptxD PCR products for all isolates ...................... 41 20. A 1% TAE agarose gel stained with ethidium bromide for X.
flavus WM2814 ptxD PCR products for all isolates ...................... 42 21. Phylogenetic tree of ptxD amino acid sequences obtained from
!"#$%&'()*+&"*,-./*0#+#1#!"!*2!""*34#+#1#!"*5'('()6*'(* Methods) and sequencing BS isolate ptxD PCR products ............ 43
22. 16S rRNA phylogenetic tree for bacteria possessing a ptxD
ortholog (see Fig. 21) ................................................................... 45 23. A more accurate P cycle .................................................................... 60

ix
LIST OF NOMENCLATURE P Phosphorus. Refers to any molecule or compound containing
phosphorus. Pi Phosphate. Inorganic phosphorus compound. Oxidation state +5. Hpt Hypophosphite. Inorganic reduced phosphorus compound.
Oxidation state +1. Pt Phosphite. Inorganic reduced phosphorus compound. Oxidation
state +3.
AEpn Aminoethylphosphonate. Organic reduced phosphorus compound. Oxidation state +3.
PH3 Phosphine. Fully reduced phosphorus compound. Oxidation state -3.
htxA Gene encoding a 2-oxoglutarate-dependent hypophosphite dioxygenase. Responsible for the oxidation of hypophosphite to phosphite.
ptxD Gene encoding an NAD-dependent phosphite dehydrogenase. Responsible for the oxidation of phosphite to phosphate.
RPO Reduced phosphorus oxidation RPOB Reduced phosphorus oxidizing bacteria

x
ABSTRACT
ANALYSIS OF ENVIRONMENTAL BACTERIA CAPABLE
OF UTILIZING REDUCED PHOSPHORUS COMPOUNDS
by
Brandee L. Stone
Master of Science in Biological Sciences
California State University, Chico
Summer 2011
Although bacterial metabolic pathways to oxidize the reduced
phosphorus compounds hypophosphite and phosphite have been characterized,
bacterial reduced phosphorus oxidation in the environment and the impact of this
activity on P biogeochemistry has largely been overlooked. In this study, I
attempted to answer two of the basic questions in this field: (1) how abundant are
culturable reduced phosphorus oxidizing bacteria in a variety of soils and
sediments; and (2) how common are previously characterized bacterial pathways
to oxidize hypophosphite and phosphite. To determine how common the ability is
in the environment to oxidize hypophosphite and phosphite, I used a 5-tube most
probable number method to estimate the concentrations of viable hypophosphite
and phosphite oxidizing bacteria from 12 natural aquatic and terrestrial
environments in northern California. The percent of total culturable bacterial

xi
concentrations able to use these reduced phosphorus compounds as a sole
source of phosphorus were: hypophosphite, 7-100%; phosphite, 10-67%; and
aminoethylphosphonate, 34-270%. Relatively high concentrations of reduced
phosphorus oxidizing bacteria were found in both pristine sites and sites with
urban and agricultural disturbance, and did not correlate with likely
concentrations of reduced phosphorus compounds. Concentrations of reduced
phosphorus oxidizing bacteria in anoxic sediments were similar to those in soils. I
isolated 19 bacteria able to grow on reduced phosphorus sources, including
Proteobacteria (Pseudomonas, Acinetobacter, Variovorax, and Bradyrhizobium),
and two actinobacteria, suggesting a far wider phylogenetic occurrence of
reduced phosphorus oxidation than previously known. To detect pathways
responsible for reduced phosphorus oxidation, I characterized one gene
responsible for hypophosphite oxidation, htxA, and one gene for phosphite
oxidation, ptxD, in these isolates. These genes have previously only been
described for a few closely related taxa. I found all isolates possessed a ptxD
ortholog, though not all were capable of growth on phosphite. Partial sequence
analysis showed ptxD was 100% identical to one previously characterized.
Thirteen isolates possessed htxA, though two were not capable of growth on
hypophosphite. My results indicate reduced phosphorus oxidizing bacteria and
the genes required for the oxidation of hypophosphite and phosphite are
abundant in the environment, and provide strong evidence for the importance of
bacterial phosphorus oxidation in nature.

1
CHAPTER I
INTRODUCTION
A common misconception is that phosphorus (P) is inert to biological
oxidation and reduction despite clear evidence that bacteria are able to oxidize
and reduce P compounds (9, 21, 30, 35, 42, 44, 45, 48, 54, 55, 65-68). As a
result, bacterial oxidation of reduced P compounds (Fig. 1) and the impact of this
activity on P biogeochemistry have largely been overlooked. Unlike other
biogeochemical cycles (e.g. nitrogen, sulfur, mercury, arsenic), in which redox
reactions carried out by bacteria are central, the role of bacteria in the currently
accepted P cycle is limited to the inter-conversion of inorganic phosphate (Pi, P
oxidation +5) and organic Pi-containing compounds (e.g. phosphate esters, P
oxidation +5) through the degradation of organic matter, in which P remains in its
most oxidized state (Fig. 2).
Clearly P, particularly Pi, is biologically important, yet, Pi is often a
limiting nutrient in the natural environment and microbes will often face P
starvation. The most common Pi starvation processes (e.g. Pho regulons) elicit
the induction of enzymes that acquire Pi from myriad P-containing compounds
predominantly those with Pi in a fully oxidized state (33, 60, 70). While it is true
that the majority of P compounds identified in the environment are found to
contain fully oxidized P, reduced organic P compounds such as phosphonates

2
FIG. 1. Structure, oxidation states, and abbreviations of reduced P compounds used or referenced in this study. (P valence +3), and phosphinates (P valence +1), which contain a stable carbon-
phosphorus (C-P) bond in lieu of a phosphate ester bond, are also widely
distributed in the environment. The existence of these reduced P compounds are
due to introduction by human activities (e.g. Roundup®) and their production by
soil dwelling Streptomyces sp., which produce a large number of diverse reduced

3
FIG. 2. Diagram showing the traditional P cycle. In a traditional P cycle only the movement of phosphate and phosphate-esters are depicted. The sole attributed role of bacteria as decomposers is shown in red.
P compounds (42).
In addition, a growing number of investigations with increasingly
sensitive techniques have shown the presence of the reduced inorganic P
compounds phosphite (Pt, P valence +3), hypophosphite (Hpt, P valence +1),
and phosphine (PH3, P valence -3) in numerous, particularly reducing or
anaerobic environments (15, 16, 19, 24-28, 41, 42, 47, 51, 52, 65). While the
natural origins of these reduced P compounds is unclear, their presence in the
environment is contributed to by numerous human activities such as the use of Pt
as an herbicide/fungicide and alternative P source in fertilizers, PH3 as a
fumigant/pesticide, and the use of Hpt industrially.
Bacterial Pt oxidation was first reported by Adams and Conrad (1).

4
Shortly thereafter, three more studies (9, 21, 30) demonstrated bacterial
oxidation of Hpt and Pt. For nearly a century researchers have demonstrated
various aspects of bacterial redox of P compounds (35, 42, 48, 51, 57, 58, 65).
The discovery of bacteria that are able to oxidize Pt and Hpt has suggested that
compounds like these are perhaps important environmental sources of P. These
studies, coupled with the growing evidence that reduced P compounds are
present in natural environments, suggest that reduced P oxidation (RPO) may be
a ubiquitous activity among soil bacteria. However, to my knowledge, no
comprehensive study investigating the abundance of reduced P oxidizing
bacteria (RPOB) in the environment has yet been reported. Without this critical
piece of information, the impact of bacterial redox reactions on Pi bioavailability is
unknown. It follows that perhaps our understanding of P flux and transformation
through ecosystems is not fully understood. Such understanding is essential for
effective P conservation efforts, understanding nutrient cycling, and improving
agricultural and bioremediation practices.
Molecular and Biochemical Characterizations of Reduced Phosphorus Oxidation Pathways
More recent molecular studies have shown Desulfotignum
phosphitoxidans can use Pt as an energy source (54, 56). Meanwhile, the
genetic (Fig. 3) and biochemical (Fig. 4) details of Hpt and/or Pt oxidation by
Pseudomonas stutzeri WM88 (45, 66), Alcaligenes faecalis WM2072 (67, 68),
and Xanthobacter flavus WM2814 (67) for use as a sole P source have been
determined. Five mechanisms have been identified and characterized to oxidize

5
organic and inorganic reduced P compounds (65). The phosphonate (Phn)
pathway is extremely common and has been described in diverse bacterial
species where it is responsible for transportation, regulation, and cleavage of the
C-P bond of phosphonates (e.g. AEpn) and phosphinates (organic reduced P
compounds) but has also been shown to oxidize Pt to Pi (40, 43, 44, 61, 62, 66).
Depending on the organism, 13-17 genes encode a multisubunit C-P lyase, a
protein-dependent transporter, and transcriptional regulators (Fig. 3). In
Escherichia coli, 14 genes (phnCDEFGHIJKLMNOP, 10.9-kb operon) encode the
C-P lyase pathway. In P. stutzeri WM88, 13 genes (phnCDEFGHIJKLMNP, 10.6-
kb operon) encode a single C-P lyase pathway.
A second mechanism, the htx operon, found in P. stutzeri WM88, A.
faecalis WM2072, and X. flavus WM2814 is responsible for the oxidation of Hpt
to Pi (Fig. 3 and Fig. 4). The htx operon varies between P. stutzeri, A. faecalis,
and X. flavus. In P. stutzeri the htx operon consists of 16 genes,
htxABCDEFGHIJKLMNOP (11.8-kb). Interestingly, htxBCDEFGHIJKLMN are
homologous in function (though arranged differently) to phnCDEFGHIJKLMNP in
E. coli. P. stutzeri also possesses a second phn operon with nearly the same
arrangement as the E. coli phn operon (sans phnO). Specifically, htxBCDE are
responsible for transporting Hpt into the cell, htxFGHIJKLM encodes a C-P lyase
(htxFGHIJKL are involved in the catalysis of Hpt, htxMN are putative accessory
proteins), and htxOP have no known function. Remarkably, the htx operon
contains no known regulatory genes. A. faecalis has a truncated htx-ptx operon
consisting of only htxABCDptxDE. The arrangement and sequence identity of

6
FIG. 3. Operons, loci, and substrates specific to each involved in the catalysis of reduced P compounds in P. stutzeri WM88, A. faecalis WM2072, X. flavus WM2814, and E. coli B. Key genes in this study are htxA, a 2-oxoglutarate dependent hypophosphite dioxygenase responsible for the oxidation of Hpt to Pt, and ptxD, an NAD-dependent phosphite dehydrogenase responsible for the oxidation of Pt to Pi.

7
FIG. 4. Biochemical pathway for HtxA and PtxD as characterized in P. stutzeri WM88. A. faecalis WM2072 possesses the same pathway. In X. flavus WM2814, the Pt to Pi portion of the pathway is the same as depicted; however, it does not possess the same Hpt to Pt oxidation pathway. htxABCD is 100% identical to htxABCD in P. stutzeri. Finally, X. flavus has a
unique htx operon. The htxBCDXY are encoded on the reverse strand and there
is no htxA. The htxA gene, a 2-oxoglutarate-dependent hypophosphite
dioxygenase, oxidizes Hpt to Pt, and has been identified in P. stutzeri WM88 and
A. faecalis WM2072. In both organisms, htxA is 100% identical at the nucleotide
and amino acid level. X. flavus WM2814 has htxXY, which oxidizes Hpt to Pt.
Unlike htxA, htxXY is an NAD-dependent hypophosphite dehydrogenase.
The final three mechanisms deal with the oxidation of Pt to Pi and
include bacterial alkaline phosphatase (BAP) and ptxD. BAP, encoded by phoA,
has been found in E. coli to oxidize Pt (71). Despite BAP enzymes from diverse
organisms being tested, the ability of BAP to oxidize Pt has only been
documented in E. coli (71).
The ptx operon, responsible for the oxidation of Pt to Pi, has been
described in P. stutzeri WM88, A. faecalis WM2072, and X. flavus WM2814 (Fig.

8
3 and Fig. 4). As with the htx operon, the ptx operons are varied among these
three bacteria. P. stutzeri has a dedicated 4.4-kb ptx operon; A. faecalis only
possesses ptxDE directly downstream of htxABCD, but part of the same 5.48-kb
htx-ptx operon; and X. flavus has ptxED that is downstream of the htx locus. In all
three organisms, the ptxD gene, an NAD-dependent phosphite dehydrogenase
responsible for oxidizing Pt, are each ca. 50% identical at the amino acid level.
Desulfotignum phosphitoxidans, capable of oxidizing Pt as an energy source, has
been found to have a ptxD ortholog, which is 39% and 40% identical at the amino
acid level to the PtxD of A. faecalis and P. stutzeri, respectively.
In P. stutzeri WM88 and A. faecalis WM2072, htx and ptx are regulated
by the two-component PhoBR system (64, 67, 68). The PhoBR system, induced
as a response to Pi-starvation and characterized extensively in E. coli and other
Gram-negative bacteria, prompts the expression of genes that allow alternative
sources of Pi (e.g. phosphate esters) to be obtained. Pho regulon genes are
repressed under Pi-rich conditions due to the saturation of PstS with Pi. The
mechanism of repression is a repressor complex consisting of PhoRR (repressor
PhoR), PhoU, and PstSCAB. When extracellular Pi concentrations become low,
PstS is no longer saturated with Pi, and the PhoBR Pi-starvation response is
elicited. PstS, part of the PstSCAB complex undergoes a conformational change,
which in turn causes a change in and dissociation of PhoRR from the PstSCAB
repressor complex. The dissociated PhoRR then dimerizes with another PhoR to
form PhoRA (activator PhoR). The histidine of PhoRA is auto-phosphorylated,
which then phosphorylates the aspartate of PhoB to form PhoB~P. The PhoB~P
9
then binds DNA and induces transcription of Pho regulon genes.
Clearly, Pi-starvation mechanisms are important. They are found in
enteric bacteria that may face Pi-starvation less often than environmental
bacteria. Understandably, it makes sense that Pi-starvation mechanisms would
!"#"$%"&'())*#'+%,-.(/.#0,-#1.-2"3#"/4'-,/+"/.()#!(&teria to thrive in harsh
environments such as soil, sediment, and water. With the intricate regulatory
overlap between htx, ptx, and the PhoBR systems, it seems htx and ptx are
potentially important and understudied Pi-starvation mechanisms for
environmental bacteria. If reduced P compounds are common (or relatively
common) in sediments and soils, it would only make sense that these bacteria
would benefit by possessing mechanisms that would allow for the use of diverse
P compounds, including Hpt and Pt. As with the abundance of reduced P
oxidizers in the environment, there has been no published determination of the
abundance and diversity of ptxD and htxA in the natural environment. These
deficits in knowledge have led to the two questions addressed in this study.
Questions
How abundant are culturable RPOB in a variety of soils and
sediments? A culture-dependent enrichment of RPOB approach was used to
address this question. Specifically, I used a most probable number (MPN)
method to estimate concentrations of RPOB from 12 aquatic and terrestrial
environments. It is extremely important to note that the point of this study was not
to characterize the individual sites chosen. Rather, I attempted to determine the

10
abundance of reduced P oxidizers in common environments.
How common are the previously characterized ptxD and htxA genes
among bacteria in the natural environment? To address this question I used an
approach to detect RPO pathways in 19 isolates cultured on reduced P sources.
Specifically, PCR, hybridization, and sequencing were used to detect and
characterize ptxD and htxA from environmental bacterial isolates.

11
CHAPTER II
MATERIALS AND METHODS
Media and Growth Conditions
All media and buffers for this study were prepared as previously
described (61) unless otherwise stated. Two types of samples were used: (1)
sediment, which was defined as soil covered by water (e.g. creek bed, lake bed);
and (2) soil, which was defined as soil not covered by water (e.g. bank soil). Soil
slurry referred to soil that had been suspended in a small aliquot of buffer to aid
in pipetting or was the consistency of mud. For MPN analysis, samples were
prepared as follows to remove debris and cell-free Pi: one mL of sediment or soil
!"#$$%&'(!&)*"#+,)&*-&.&/0&12343&5#66,$&740 mM 3-[N-morpholino]propanesulfonic
acid [MOPS] based) and vortexed (61). The sample was set aside for
approximately 5 minutes to allow sediment to settle. The supernatant was pre-
6*"+,$,)&+'*8,&#!*-9&:;(+/(-&6*"+,$&<(<,$=&<>$,&!*?,&@AB&C/=&">+D&EF1G.HG= into a
-,'&+#5,&+>&$,/>I,&())*+*>-("&!,)*/,-+&),5$*!A&J<<$>K*/(+,"%&1&9&>6&LMNJ&
L;>!0>8OP&9$(-#",!&76,$$*8&;%)$>K*),&+>&5*-)&(-)&$,/>I,&8,""-free Pi;
Magnavore Company) was added to the supernatant and incubated for 1 hour at
room temperature with gentle agitation. The remaining supernatant was filtered
+;$>#9;&(&Q("9,-,R&BAG&C/&<>$,&6*"+,$&5%&I(8##/&6*"+$(+*>-A&S>"",8+,)&8,""!&',$,&
+;,-&$,!#!<,-),)&6$>/&+;,&6*"+,$&*-+>&12343&4TLU&5#66,$&(61). For genetic

12
analyses, samples were prepared as described except the supernatant was not
pre-!"#$%&%'()*'(*+(,-./(,0+12+345(6&)*7#%1(8%&%(71%'($+(&%9+:%(3%##-free Pi.
All bacteria grown on reduced P compounds were incubated at 27oC for 7 days.
Most Probable Number for Reduced
Phosphorus Oxidizing Bacteria
Direct plating was initially used to culture and quantify RPOB.
However, it is a method that is prone to error and the resources that must be
used to obtain a high number of replicates would be far greater than with other
methods, such as MPN. In addition, because agar is an impure substance, trace
amounts of Pi may be present and many bacteria, particularly soil bacteria, are
extremely adept at scavenging trace amounts of Pi. As a result, background
growth would occur on P-free agar plates, making the interpretation of Pi, Hpt, Pt,
and AEpn agar plates difficult. All of these issues make the use of liquid media
and MPN quite appealing. MPN is the standard method in food, water, and soil
microbiology for determining the concentration of particular bacteria in a sample
(20, 34, 36). MPN requires at least one observable and distinct characteristic that
is unique to the target population. For this study, that characteristic was the
ability to grow only in the presence of the reduced P compound Hpt, Pt, or AEpn.
In the presence of Hpt, Pt, or AEpn, growth can only occur if the bacteria can
oxidize the reduced P compound to Pi.
Site descriptions. Twelve samples were obtained from nine aquatic
and terrestrial locations in Butte and Glenn County (Table 1 and Fig. 5). The

13
sample area consisted of a variety of sites including flowing and still water, large
and small water bodies, and pristine to non-pristine areas. The selected sites
were primarily located along Big Chico Creek, which flows from the Sierra
Nevada foothills through Chico and into the Sacramento River. The watershed
and sample locations within it follow a concomitantly increasing hydrological
discharge and disturbance gradient due to urban and agricultural run-off. In
determining the pristineness of sites, a qualitative assessment taking into
account the amount of potential run-off as well as the sample type (sediment or
soil) was performed. Sed1 was defined as a relatively pristine site because of
upstream features. Upstream of this location is the Big Chico Creek Ecological
Reserve and very little urban or agricultural run-off compared to the other sites in
!"#$%$!&'()%*+#,%'-!-%+.!-#/0'%12+3%!"0%4/#!0'%*!-!0$%506-2!30/!%+1%782#9&,!&20:$%
National Conservation Service Soil Data Mart database
(http://soildatamart.nrcs.usda.gov) show the 12 sites are typical (i.e. not extreme)
environments (Table 2). Within the 12 sites pH values ranged from 5.1-8.4;
cation exchange capacity ranged from 3.9-50 milliequivalents/100 g; salinity
ranged from 0-0.5 mmhos/cm; clay ranged from 2-60%; and organic matter
ranged from 0.5-6.0%. Soil data. To characterize the 12 environments chosen and show they
are typical environments, soil data was obtained from the United States
506-2!30/!%+1%782#9&,!&20:$%;-!#+/-,%<+/$02=-!#+/%*02=#ce Soil Data Mart
database (http://soildatamart.nrcs.usda.gov). The Soil Data Mart database is the

14
TABLE 1. Locations of sample sites in Glenn and Butte County, California Sample ID
Location Name/Description Approximate Coordinates
Sed1 BCC directly south/downstream of the Big Chico Creek Ecological Reserve
39o !"#$%&'!()$*+
121o !(#$!('"!)$,
Sed2 Soil3
Lindo Channel near 5 Mile 39o !&#$!!'"-)$*+
121o !-#$(-'.%)$,
Sed3 Thermalito Afterbay 39
o /"#$%/'-0)$*+
121o (0#$(&'.()$,
Sed4 Big Chico Creek on the California State University Chico
Campus 39
o !(#$!0'0")$*+
121o &.#$!/'%!)$,
Sed5 Horseshoe Lake 39
o !1#$%0)$*+
121o !1#$&/)$,
Sed6 Feather River between Palm and Almond Ave. 39
o /!#$/('(.)$*+
121o (-#$.!'1&)$,
Sed7 Soil2
Big Chico Creek Access Boat Ramp 39o !/#$%-'0!)$*+
121o &1#$/.'%-)$,
Sed8 Soil1
Irvine Finch Boat Ramp 39o !&#$..'!/)$*+
121o &0#$&.'%!)$,
Sed9 Sacramento River upstream of Big Chico Creek
confluence 39
o !/#$%1'%0)$*+
121o &1#$(&'.-)$,
most extensive database for soil characterization available with numerous
parameters determined. Five relevant chemical and physical properties were
collected from the Soil Data Mart database for each site (Table 2). These
properties show the chosen sites are typical (i.e. not extreme) environments. It
should be noted that like many environmental characteristics, most, if not all, of
the properties reported here are interrelated. For example, pH affects cation
exchange capacity (CEC) and soil texture (% clay) affects CEC.
The optimal pH for bacterial activity, plant growth, and nutrient
availability is approximately 6-7. Cation exchange capacity (CEC) measures the

15
FIG. 5. Location of MPN sites in Glenn and Butte County, California. Red stars indicate sites where only sediment was collected; Blue stars indicate sites where sediment and soil were collected. Image obtained from Google Earth.
capacity of soil to retain cations at pH 7 and is reported as milliequivalents per
100 g soil (meq/100 g). Thus, CEC is a measure of the fertility of the soil, the
capacity to retain nutrients, soil texture, and, ultimately, microbial communities.
For agricultural soils, 10-30 meq/100 g is optimal. Salinity measures soluble salts
16
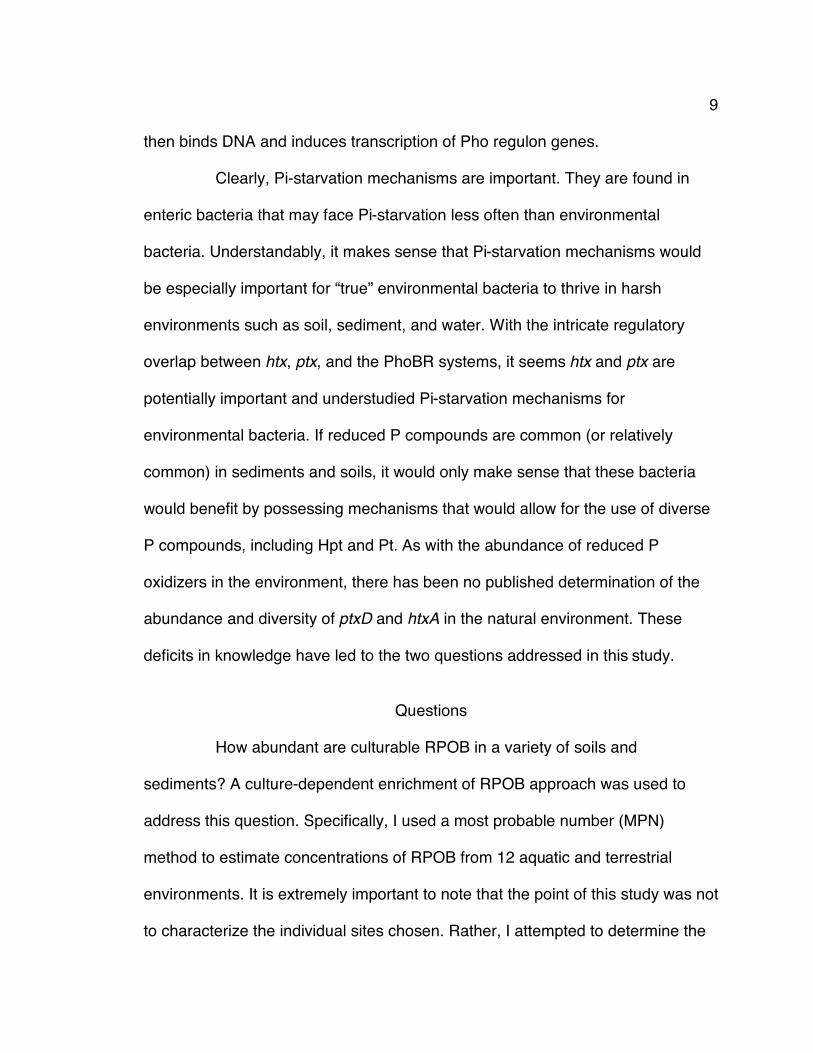
TABLE 2. Soil properties from the Soil Data Mart database for 12 natural environmental sites in Butte and Glenn County showing these are
typical (i.e. not extreme) sites Sample MUSYS
a pH CEC
(meq/100 g) Salinity
(mmhos/cm) % Clay % Organic
matter Sed1 648 6.1-7.3 25-40 0 20-27 4.0-10
Sed2 /Soil3
b,c 300 6.1-7.8 20-30 0-0.5 16-24 1.6-5.0
991 6.1-7.3 10-20 0 2-10 1.0-4.0
Sed3 603 5.6-6.5
5.1-6.5 5.6-6.5 5.6-6.5
8.0-13 6.4-11 8.0-9.7 6.4-12
0 0 0 0
15-24 12-20 15-18 12-22
0.5-2.0 0.5-2.0 0.5-1.2 0.5-1.2
Sed4 425 6.1-8.4 11-18 0-0.5 12-20 2.5-5.0
Sed5 676 6.6-7.8
6.3-8.0 6.6-7.8 6.7-7.8
40-50 40-50 15-30 15-30
0-0.5 0-0.5 0 0
40-59 40-60 18-35 20-30
2.0-5.0 2.0-5.0 2.0-6.0 2.0-6.0
991 6.1-7.3 10-20 0 2-10 1.0-4.0
Sed6 118 5.1-7.3 7.4-12 0 10-16 0.5-1.0
Sed7/Soil2 152 5.6-8.4 3.9-18 0-0.5 4-20 1.0-5.0
158 5.6-8.4 3.9-18 0-0.5 4-20 1.0-5.0
Sed8/Soil1 ChA 6.6-7.3 5.0-15 0 10-18 0.5-2.0
Sed9 152 5.6-8.4 3.9-18 0-0.5 4-20 1.0-5.0
a The map unit symbol (MUSYS) is used in the Soil Data Mart database as a unique identifier for each soil type. b Locations with multiple MUSYS were on the boundary of all noted MUSYS so, chemical and physical properties for each MUSYS are presented. c Indicates sediment and soil samples were obtained from the same location. in soils and is reported as millimhos per centimeter at 25oC (mmhos/cm). Non-
saline soils are typically defined as having salinity of 0-4 mmhos/cm. Clay is one
of three components of soil texture (clay, sand, silt) and is reported as an
estimate of the percentage of the total soil weight of particles with a diameter of
less than 2 mm. A soil higher in clay content is more structured and thus more

17
conducive to microbial communities forming than soils high in silt or sand.
Typically, a soil is classified as clay if it has more than 40% clay. No optimum
percentage of clay for microbial communities could be found. The percent
organic matter is an estimate of the percentage of the total soil weight of plant
and animal residue with a diameter of less than 2 mm. Organic matter affects
water capacity and infiltration, microbial and plant soil communities by providing
carbon and nitrogen, and overall healthy soil. The optimum percent organic
matter for agriculture is approximately 5-10%.
Validation of MPN method. To verify that the MPN method would
produce consistent results, a preliminary experiment was performed using P.
stutzeri WM88 with Luria-Bertani (LB) media. An aliquot of an overnight culture of
P. stutzeri !"#$#%#&'()')$*($+,-.-$%(/*0$1"2'03$/%21*)4$5#*(6$"$7-tube MPN
dilution series with 12 dilutions (10-1 to 10-12) per tube, the cell suspension was
serially diluted 1:10 into a 96-well plate containing LB. The same cell suspension
was also serially diluted 1:10 and plated onto LB agar plates with five plates per
dilution. Plates were incubated overnight at 27oC.
Sampling of sites. Twelve samples of sediment (soil beneath water)
and adjacent bank soil prone to seasonal flooding were collected during July
2009, December 2009, and October 2010. The samples collected in July 2009
were initially used to determine the validity of the sampling method for quantifying
RPOB from environmental samples. Validity was defined as consistent results
within each MPN series (e.g. all Pi tubes for sample Sed1 did not vary greatly
with one dilution series having five positive tubes and another having one

18
positive tube, rather all dilution series had four to five positive tubes).Once the
validity of the sampling method was determined using the July 2009 samples,
more sites were sampled in December 2009. Soil1 was initially analyzed in
December 2009. However, results showed the MPN/g for Hpt, Pt, and AEpn
were higher than the MPN/g for Pi. This prompted a reanalysis of Soil1 in
October 2010. Soil1 was obtained in duplicate and analyzed in triplicate.
For each sample, three sediment or adjacent bank soil samples were
obtained approximately 2 inches below the surface from each site from three
random spots, then thoroughly mixed together to form one representative sample
from each site.
Plating samples. A 5-tube MPN dilution series with six dilutions (10-1
to 10-6) for each tube was performed for each cleaned sample (Fig. 6). Samples
were serially diluted 1:10 into 96-well plates with MOPS minimal media
containing 10 mM sodium pyruvate (CAS No. 113-24-6) and 1 mM of one of four
P sources: Pi (Dipotassium phosphate, CAS No. 7758-11-4), Pt (Phosphorus
acid, CAS No. 10294-56-1), Hpt (Sodium hypophosphite monohydrate, CAS No.
10039-56-2), or AEpn ((2-Aminoethyl)phosphonic acid, CAS No. 2041-14-7) (61).
Phosphorus free (P-free) media was also inoculated for use as a negative
control. The plates were incubated at 27oC with gentle agitation. Growth was
scored by qualitatively observing turbidity after 7 days.
Analysis. MPN and 95% confidence interval (CI) values were
determined using Briones and Reichardt (5). A two-tailed t-test was performed for
Soil1 replicates. No growth was observed in P-free media, thus no data are

19
FIG. 6. Diagram of MPN experimental setup. Briefly, three samples were collected at !"#$%&'(%)"*+%#,'-+*.+#'"',+*/'0,//'12"&3(+#4'%5',+*/,678')(/"#/$'0,//'19/$+"'"#$'4!%-*.')%#$+*+%#,678'*./#'3("*/$'+#'9:;2'&+#+&"('&/$+"')%#*"+#+#4'#%';8';+8'<3*8';*8'%!'=>3#'0,//'1;("*+#4',"&3(/,67?'>").'$+(@*+%#'0)%(@&#,7'."$'A'replicates (rows). presented for P-free replicates. Charts were created using SigmaPlot (version
12.0; Systat Software Inc., San Jose, CA).
Genetic Analyses for htxA and ptxD
Bacterial strains used and obtained in this study. The bacteria
used in this study were isolated from sediment obtained from Klamath Lake,
Oregon. Cells resuspended from cleaned sediment were directly plated in
triplicate on agar plates containing Pi, Hpt, Pt, or AEpn. P-free agar plates were

20
also inoculated. Bacteria were restreaked until pure colonies were obtained.
Each isolate was identified to the species level by sequencing 1495 bases of the
16S rRNA gene using degenerate primers (27F: GTTTGATCMTGGCTCAG;
1522R: AAGGAGGTGATCCANCCRCA). Identifications were based on forward
!"#$%&'&%(&$()%!"#$(&*+&",&$-.&&$/.&*+&",&$!"!01(2($34$56.$%789:$htxA, and
ptxD ;<7$=%3#+,)(>$2"$?&)@3#(AB$<3")%30$()%!2"($-P. stutzeri WM88 [wt,
htxA+ptxD+], P. stutzeri C?D65E$F#&0&)23"$G+)!"):$Hhtx Hptx Hphn] A. faecalis
WM2072 [wt], and X. flavus WM2814 [wt]) were obtained from Dr. William W.
Metcalf.
Determination of each isolates substrate range. The reduced P
phenotypes of pure cultures were determined by inoculating each isolate into
liquid MOPS media containing Pi, Hpt, Pt, or AEpn. P-free media tubes were also
inoculated. No turbidity was observed in the P-free media. Growth in the reduced
P media was scored after 7 days and compared to growth in Pi media. Growth
was scored by qualitatively observing turbidity in each media type.
PCR and hybridization for htxA and ptxD. To determine the
presence of htxA, A. faecalis ptxD, P. stutzeri ptxD, and X. flavus ptxD, PCR was
performed on each isolate using primers specific for each gene (Table 3). The X.
flavus ptxD is extremely GC-rich (72.8%) making amplification difficult. A NaOH
pretreatment was initially attempted (2). This worked well for amplifying ptxD
from X. flavus but proved tedious, difficult, and unreliable for the isolates. Adding
DMSO to a final concentration of 5% (v/v) to the PCR reactions worked equally
well for amplifying ptxD from X. flavus. It also gave products from many of the

21
TABLE 3. Primers and expected product size for amplified htxA and ptxD products
Primer !"#$%"&'%()%*+%&,-.-/.0 Expected Product
Size (nt) htxA SpeI AAGCTTACTAGTTGATCGAATCAGCATGCC 936 htxA XbaI GTTTCTAGATCAGTAGTACTTTTGAGTCAAAGC
P. stutzeri ptxD CCGAGTACACGATGAGATCC 953
GGTTCGCAGCGTTGATTGGG
A. faecalis ptxD CGTAACAACGCATCGAATCC 934
AACGCTTCGAGGATACTGAGG
X. flavus ptxD CCCGCAAGACCATCGTCACC 962
GGTCCTGCTGCAATCCGTCC
isolates.
A. faecalis WM2072 ptxD, P. stutzeri WM88 ptxD, htxA, 16S rRNA
were amplified using a two cycle PCR program (annealing temperature of 55oC
for 30 cycles, then 50oC for 10 cycles). This program was used for the initial
amplification of X. flavus WM2814 ptxD, but produced multiple bands in most
isolates. A one cycle PCR program (annealing temperature of 57oC for 30 cycles)
was then attempted. This cleaned up a couple isolates with multiple bands.
Further troubleshooting is required for X. flavus ptxD PCR.
DNA hybridization was also performed for htxA, P. stutzeri ptxD, and
A. faecalis ptxD using the DIG-High Prime DNA Labeling and Detection Starter
Kit I per manufactu"%".1&#*12")+2#3*1&,4526&736&889:-;/<=8>?&@3+A%&B#5C*312#+1?&
Indianapolis, IN). Probes were purified and labeled htxA, P. stutzeri WM88 and
A. faecalis WM2072 ptxD PCR products. The labeling reaction was incubated
overnight at 37oC to increase DIG-labeled probe yield. Whole chromosomal DNA
from controls and isolates were dotted and heat fixed (80oC for 1 h) onto a nylon

22
membrane. Optimum hybridization temperatures (Topt) were found to be 50oC for
htxA and A. faecalis ptxD, 55oC for P. stutzeri ptxD, and were calculated using
the following equations: Tm = 49.82 + 0.41 (%GC) ! (600/l) where l = length of
hybrid in bp, and Topt = Tm ! 20oC. The hybridization reactions were incubated at
the appropriate temperature (see above) overnight with gentle agitation.
Membranes were then washed under constant agitation first at low stringency (5
min in 2X SSC with 0.1% SDS at room temperature twice) then at high
stringency (15 min in 0.5X SSC with 0.1% SDS at 66oC twice). Detection was
performed using the color development substrates nitro blue tetrazolium and 5-
bromo-4-chloro-3-indolyl-phosphate (NBT/BCIP).
Sequence analysis of 16S rRNA, htxA, and ptxD PCR products.
PCR products were cleaned using the QIAquick PCR Purification Kit per
"#$%&#'(%)*)+,-.$,()%'(./$,-01#(2-3/2-456789-:.#;*$-<$'29-=#>*$'.#9-1?@-#$A-)%$-
on a 1% TAE agarose gel stained with ethidium bromide to quantify the amount
of purified PCR product, which was then sent to the San Diego State CSUPERB
Microchemical Core Facility to be sequenced. A. faecalis ptxD products from
three isolates were sequenced twice to ensure sequence validity.
Chromatograms were visually inspected using FinchTV 1.4.0 (Geospiza, Inc.;
Seattle, WA; http://www.geospiza.com) then aligned using ClustalW (29, 38).
A region of ca. 500 bp acquired from sequencing and aligning forward
and reverse strands was obtained for all 16S rRNA sequences. This region was
then searched in the Ribosomal Database to determine the identity of isolates
(10, 11). A region of 838 and ca. 815 bp obtained from sequencing and aligning

23
forward and reverse strands was obtained for all ptxD and htxA sequences,
respectively. Sequences were then aligned and percent identifies were found
using ClustalW.
Database mining for DNA similar to htxA and ptxD. Three methods
were used to find sequences similar to htxA and the three ptxDs in the NCBI
database (http://www.ncbi.nlm.nih.gov/): (1) Searching three NCBI BLAST
nucleotide databases (Nucleotide collection [nr/nt], Whole-genome shotgun
reads [wgs], and Environmental samples [env_nt] databases at
http://www.ncbi.nlm.nih.gov/BLAST); (2) Searching htxA or ptxD in the NCBI
!"#$%&'()%*)+'+,+-%.*+/)*012*3%+4#5(/6*'5%*'%47-*895&-95('%*)%5:)4&6%/+-%;<*
895&-95('%;<*85:9&95&-95('%;<*&4*85:9&95&-95('%*)%5:)4&6%/+-%<*+/)*4%=(%>(/6*
each result for annotations specific to htxA or ptxD.
P. stutzeri WM88 and A. faecalis WM2072 htxA DNA sequences, as
well as ptxD DNA sequences from P. stutzeri WM88, A. faecalis WM2072, and X.
flavus WM2814 were searched in the NCBI BLAST database. Once BLAST
results were obtained, a minimum query coverage of 80% was required for
sequence matches to be included in alignments with control and sequenced (this
study) ptxD and htxA products.

24
CHAPTER III
RESULTS
Most Probable Number for Reduced Phosphorus Oxidizing Bacteria
Validation of MPN method. MPN and viable cell counts were
calculated and were within the same order of magnitude. This experiment
showed I could obtain results using a 5-tube MPN dilution series consistent with
a plate dilution method.
Validation of sampling method for estimating reduced P oxidizers
in the environment. Two independent experiments were performed for Soil1
samples to determine the reliability of the sampling method for estimating RPOB
from environmental samples (Fig. 7). A two-tailed t-test comparing the MPN/g
soil for the same media types confirmed the samples were not significantly
different (p > 0.05). The sampling method is a reliable method for estimating
concentrations of reduced P oxidizers.
Reduced P oxidizing bacteria are present in substantial
concentrations in the natural environment. The previous research (see
!"#$%&'()$*&#+,-.$%&#/01-.(//2.$.-3456-7%2-8%2.2#$-*#-97#1-7#72%&:*)-.&*0.;-
however, no known comprehensive study has been performed to show the
presence and concentration of RPOB in the natural environment. It is assumed
that all culturable bacteria under the experimental conditions used are

25
FIG. 7. MPN/g soil for sample Soil1. Two independent experiments for soil samples collected from the Soil1 site (Soil1a and Soil1b) were performed. P-free samples are not shown because no growth was observed. Each bar represents the average of three separate MPN trials. Error bars represent ± one standard deviation. represented by concentrations observed with Pi as the P source. Since Pi is the
predominate form of P in the environment, the assumption has been that if RPOB
are present, they will be in extremely small concentrations relative to
concentrations with Pi. However, the average concentrations of bacteria with Hpt
or Pt as the sole P source are present in relatively large concentrations (Fig. 8).
Reduced P oxidizing bacteria are present regardless of the
season. The collection of samples in summer and winter was simply an artifact
of when samples could be collected. That is, I did not seek to determine temporal

26
FIG. 8. The average MPN/g for 12 aquatic and terrestrial sites shows the number of bacteria capable of oxidizing Hpt, Pt, or AEpn are comparable to the MPN/g with Pi as the sole P source. Error bars represent standard error of the mean. differences. However, I did see that regardless of the season (winter or summer),
reduced P oxidizers are present (Fig. 9). Indeed, the overall pattern of
concentrations with reduced P compounds, relative to Pi, is consistent in summer
and winter. That is, the concentrations of Hpt and Pt oxidizers are generally lower
than concentrations with Pi and AEpn concentrations are approximately equal to
Pi concentrations. Since temperatures are colder in winter and rainfall increases,
I would expect viable bacterial populations to decrease in winter due to increased
rainfall, which coupled with colder temperatures could result in frequent freezing.

27
This frequent freezing would kill some of the soil populations or result in
sporulation or other survival mechanisms being initiated. While culturing on rich
media would result in sporulating bacteria growing, this may not be the case
when cultured on minimal media as was used in this study. As a result, I
expected an overall decrease in MPN/g values from summer to winter samples
(Fig. 9). One reason to expect a decrease would be due to colder temperatures
during winter.
Interestingly, in summer samples, when comparing only the MPN/g
values and not the 95% confidence intervals, the concentrations of Hpt oxidizers
are equal to or higher than concentrations of Pt oxidizers. In winter samples,
again comparing only the MPN/g values, the concentrations of Pt oxidizers are
equal to or higher than the concentrations of Hpt oxidizers. Still, within most
samples, the 95% confidence intervals overlap indicating there are no significant
differences. There were significant differences found in concentrations for three
sites: Sed3, between Pt and AEpn; Sed6, between Pi and Hpt; and Soil1,
between Pi and Pt. Further studies using soils or sediments from the same site
collected and analyzed during summer and winter are required to determine
whether the relative concentrations of Hpt and Pt oxidizers to Pi utilizers do differ
between summer and winter and may provide additional, though indirect
information regarding the availability of Hpt and Pt.
Microbial reduced P oxidization is not a new phenomenon. With
the increasing use of commercial and agricultural products containing reduced P

28
A. Summer B. Winter
FIG. 9. MPN/g sediment or soil slurry for 12 samples collected during summer (A) or winter (B). These graphs show within each site the estimates for Hpt and Pt oxidizers are below but within the 95% CI relative to Pi. Error bars represents upper and lower 95% CI boundaries.

29
compounds, it could be postulated that RPO is a relatively new phenomenon. To
examine this I investigated a number of sites within or downstream of numerous
urban and agricultural areas, including the Chico State University Farm known to
use PH3 and Roundup® as fumigants and pesticides. If RPO were a relatively
new phenomenon, driven by the introduction of these compounds through the
use of products containing reduced P compounds, I would expect to see lower
concentrations in areas where these products are not used. When the MPN/g
from a relatively pristine site (Sed1) is compared to the MPN/g from less pristine
sites, similar concentrations of RPOB, relative to Pi, are observed (Fig. 10).
Percentages normalize the data. Since samples were collected in
different seasons, it can be difficult to determine distinct patterns in the data. The
percentage of total culturable bacteria (represented by Pi) capable of growth on
the reduced P compounds was determined (Fig. 11). The percentage observed
on Hpt ranged from 7-100%, on Pt from 10-67%, and on AEpn from 34-270%.
The percentages on AEpn are above 100% for Sed3, Sed9, and Soil2. This was
not surprising since, as stated previously, phosphonates are extremely common
in the environment and numerous bacteria are capable of using phosphonates as
a sole P source. In addition, the 95% confidence intervals for Pi and AEpn
MPN/g overlap (Fig. 9 and Fig. 10), indicating no significant difference between
Pi and AEpn.
No differences exist between sediment and soil concentrations.
For paired sediment and soil samples the concentrations of RPOB were

30
FIG. 10. MPN/g for reduced P oxidizing bacteria in each of the 12 aquatic (Sed) and terrestrial (Soil) sites arranged by most pristine (Sed1, mountain stream) to least pristine (Sed8, extensive urban and agricultural run-off). Sites were ranked based on the proximity to the pristine site (Sed1) and, consequently, the amount of potential urban and/or agricultural run-off likely to occur upstream from a particular site. Summer (S) and winter (W) sites are indicated. Error bars represent upper and lower 95% CI boundaries.

31
FIG. 11. Ratio of MPN capable of growth on Hpt, Pt, and AEpn expressed as a percentage of Pi (defined as 100%). For most of the sites the percentage of total culturable concentration capable of growth on Hpt or Pt is under 25%. However, for four sites (Sed1, Sed3, Sed6, Soil2) the percentage capable of growth on Hpt and/or Pt is 50% or greater. As expected, the percentage capable of growth on AEpn was generally equal to or greater than concentrations on Pi.

32
FIG. 12. Average MPN/g sediment or soil slurry for paired sites. A two-tailed t-test showed no significant difference among reduced P compounds for soil and sediment samples. Relative to Pi, the concentrations of RPOB are high in both sediment and soil. Error bars represent standard error of the mean. compared (Fig. 12). Although soil samples had a slightly higher MPN/g compared
to sediment samples, no significant difference was found using a two-tailed t-test,
p > 0.05. It is important to note that the culture methods used allow only obligate
and facultative aerobes to be accounted for even though anaerobic RPOB may
also be present. Still, these data show high concentrations of RPOB are found in
low and high oxygen environments.
Genetic Analyses for htxA and ptxD
Identification of cultured reduced P oxidizing bacteria. Nineteen
bacteria, isolated from Klamath Lake, capable of growth using Hpt, Pt, and/or

33
AEpn as the sole P source were identified from 16S rRNA gene sequencing (Fig.
13 and Table 4). Most of the isolated bacteria were Pseudomonads
(Pseudomonas sp., P. mendocina, P. fluorescens, P. reinekei, P. putida, P.
aeruginosa, P. stutzeri). There were also other Proteobacteria (Bradyrhizobium
elkanii, Variovorax paradoxus, and Acinetobacter calcoaceticus/baumannii
complex (Acb complex)) and two Gram-positive bacteria (Streptomyces sp. and
Micrococcus luteus). Unfortunately, a species level identification was not possible
for Streptomyces and those identified as Pseudomonas sp. Adequate sequence
was obtained (ca. 500 nt), however, matches from searching these sequences in
the Ribosomal Database Project yielded no single species identification, only
genera level identifications.
The 16S identification of Gram-positive bacteria did raise questions
about the validity of those two identifications, especially for M. luteus since the
use of minimal media is not typically conducive to culturing Gram-positive
bacteria (7). Streptomyces is an extremely common soil bacterium and generally
considered a resilient Gram-positive bacterium (e.g. spore-forming, diverse
physiology/metabolism). M. luteus is commonly classified as a skin bacterium but
is easily found in soils and water. Colony morphologies for Streptomyces and M.
luteus matched published descriptions (3, 49). A Gram stain showed
Streptomyces was Gram-variable and M. luteus was clearly Gram-positive. Cell
shape and arrangement was consistent with those described for M. luteus
(coccus, tetrad arrangement) (3).
Determination of reduced P substrate range. The reduced P

34
TABLE 4. Substrate ranges, hybridization, and PCR for ptxD and htxA of 19 isolates. !"#$"#%&'#(#)&')*%+,#Proteobacteria class and G+ indicates Gram-positive.
Isolate
ptxD htxA Substrate Rangea
P. stutzeri A. faecalis X. flavus PCR Hyb Hpt Pt AEpn
PCRb Hyb PCR PCRc
Acinetobacter Acb BS14 -(. / / + + / / + + +
Streptomyces sp. BS20 (G+) / / + + + / +// + +
Bradyrhizobium elkanii 012#-!. / / + MBd / / + + +
Pseudomonas aeruginosa 0134#-(. / / + MB / / / +// +
Pseudomonas reinekei BS4 -(. / / + MB / / / +// +//
Acinetobacter Acb BS13 -(. + / + + + / + + +
Variovorax paradoxus BS2 -$. + / + + + / + + +
Micrococcus luteus BS12 (G+) + / + + + / + / /
Variovorax paradoxus BS8 -$. + / + + + / / + +
Variovorax paradoxus 014#-$. + / + MB/+e + / +// +// +
Variovorax paradoxus BS5 -$. + / + MB/+ + / / +// +
Pseudomonas putida 0135#-(. + / + MB + / + + +
Pseudomonas 678#0139#-(. + / + MB + / + + +//
Pseudomonas 678#01:3-(. + / + MB + / / +// +
Pseudomonas stutzeri BS3 -(. / + / MB / + + +// +//
Pseudomonas putida 013;#-(. / + + MB + / / / +
Pseudomonas 678#0132#-(. / + / MB / / + + +//
Pseudomonas fluorescens 013#-(. + + + MB + + + + +
Pseudomonas mendocina BS7 -(. + + + MB + + + + + a A (+) indicates turbidity was ca. equal to turbidity with Pi. A (+//) indicates turbidity was less than Pi. A (/) indicates no turbidity. b A (+) indicates a product was obtained with primers designed from the corresponding control strain c Results for X. flavus PCR are a combination of two separate PCR cycles. d Indicates multiple bands present. e Indicates multiple bands present but the strongest product was ca. 950 bp.

35
FIG. 13. 16S rRNA identifications of 19 reduced P oxidizing bacteria. Most are Pseudomonads, various Proteobacteria, and two Gram-positive bacteria. Identifications are based on ca. 500 bp (double strand [forward and reverse] sequence for species, single strand [forward or reverse] sequence for genus) of the 16S rRNA gene. The light blue line shows the outgroup (Nostoc sp.); red lines show Gram-positive bacteria; blue line shows !-Proteobacteria; green lines show "-Proteobacteria; purple lines show #-Proteobacteria. Phylogenetic tree created using ClustalW. See Table A1 in Appendix A for a matrix comparison of sequence homologies.

36
substrate range of each isolate was determined to further characterize the
isolated bacteria and elucidate potential RPO pathways (Table 4). Twelve were
capable of strong (+) or moderate (+/ !) growth on Hpt, Pt, and AEpn. Five were
capable of strong or moderate growth on Pt and AEpn. Pseudomonas putida
BS17 was only capable of growth on AEpn. Micrococcus luteus BS12 was
capable of growth only on Hpt (not Pt or AEpn).
Hybridization for htxA. Hybridization was performed for htxA for all
isolates (Table 4, Fig. 14, and Fig. 15). Only P. fluorescens BS1 and P.
mendocina BS7 gave a positive result with hybridization and PCR. B. elkanii
BS9, P. reinekei BS4, P. aeruginosa BS16, Acinetobacter Acb BS14, and
Pseudomonas sp. BS19 were negative with hybridization and PCR. P. stutzeri
BS3 was positive with hybridization but negative with PCR. The remaining 11
isolates were positive with PCR and negative with hybridization.
Hybridization for ptxD. Hybridization was performed for P. stutzeri
WM88 ptxD (Table 4). Hybridization was also performed for A. faecalis WM2072
ptxD, however, all isolates were negative. Due to the high GC content of the X.
flavus WM2814 ptxD, hybridization was not performed. Only P. fluorescens BS1
and P. mendocina BS7 were positive with both PCR and hybridization for P.
stutzeri WM88 ptxD. B. elkanii BS9, P. reinekei BS4, Acinetobacter Acb BS14, P.
aeruginosa BS16, and Streptomyces sp. BS20 were negative for both PCR and
hybridization. P. stutzeri BS3, P. putida BS17, and Pseudomonas sp. BS19 were
negative with PCR but positive with hybridization. The remaining nine were
positive with PCR and negative with hybridization.

37
FIG. 14. Hybridization for P. stutzeri WM88 ptxD. P. s. + is P. stutzeri WM88 and a positive control; A. f. ! is A. faecalis WM2072 and a negative control; P.s. ! is P. stutzeri WM3617 and a negative control; numbers indicate BS isolates.
FIG. 15. Hybridization for htxA. P. s. + is P. stutzeri WM88 and a positive control; A. f. + is A. faecalis WM2072 and a positive control; P.s. ! is P. stutzeri WM3617 and a negative control; numbers indicate BS isolates.
PCR for ptxD and htxA. PCR using primers for the three known ptxDs
and one known htxA was performed for each isolate (Table 4). Amplified
products were the predicted sizes (Table 2). Thirteen of nineteen isolates
possessed an amplifiable htxA (Fig. 16). B. elkanii BS9 was capable of growth on

38
FIG. 16. A 1% TAE agarose gel stained with ethidium bromide for htxA PCR products for all isolates. The band for htxA is 936 bp. Lane designation: P. s. + is P. stutzeri WM88 and a positive control; A. f. + is A. faecalis WM2072 and a positive control; numbers indicate BS isolate. but lacked a detectable htxA. P. stutzeri BS3 and Pseudomonas sp. BS19 were
capable of strong growth on Hpt but lacked a detectable htxA. Between the three
ptxD primer sets used, a product of the predicted size was obtained from every
isolate (Fig. 17, Fig. 18, Fig. 19, and Fig. 20). PCR for the X. flavus ptxD resulted
in the amplification of multiple bands. Increasing the annealing temperature
resulted in the amplification of one band that was the predicted size but multiple
bands were still present (Fig. 19 and Fig. 20). For V. paradoxus BS2, M. luteus
BS12, Acinetobacter Acb BS14, and Streptomyces sp. BS20, increasing the
annealing temperature allowed for the amplification of a single band. Further

39
FIG. 17. A 1% TAE agarose gel stained with ethidium bromide for A. faecalis WM2072 ptxD PCR products for all isolates. The band for ptxD is 934 bp. Lane designation: A. f. + is A. faecalis positive control; numbers indicate BS isolate. troubleshooting is required to amplify a single product from the remaining
isolates.
Sequencing and alignment of htxA. The PCR products from V.
paradoxus BS5, V. paradoxus BS8, P. fluorescens BS1, P. putida BS15, P.
putida BS17, Pseudomonas sp. BS18, Pseudomonas sp. BS21, and M. luteus
BS12 were sequenced. Sequences obtained allowed the first 798 nucleotides of
the 861 nucleotide protein coding sequence to be determined. All htxA
sequences obtained were 100% identical at the nucleotide and amino acid (266
residues) levels to the P. stutzeri WM88 and A. faecalis WM2072 htxA (data

40
FIG. 18. A 1% TAE agarose gel stained with ethidium bromide for P. stutzeri WM88 ptxD PCR products for all isolates. The band for ptxD is 953 bp. Lane designation: P. s. + is P. stutzeri positive control; numbers indicate BS isolate. not shown).
Sequencing P. stutzeri WM88 and X. flavus WM2814 ptxD.
Sequencing was not performed for the P. stutzeri WM88 and X. flavus WM2814
ptxD products. After numerous successful amplifications with the isolates, PCR
repeatedly failed when using the P. stutzeri WM88 ptxD primer set (PCR was
always successful using P. stutzeri ptxD with P. stutzeri WM88). Numerous
troubleshooting steps were attempted including preparing new chromosomal
DNA, new GoTaq Green and primer stocks, new PCR cycles, and the addition of
DMSO. The only exception was P. mendocina BS7, which requires multiple

41
FIG. 19. A 1% TAE agarose gel stained with ethidium bromide for X. flavus WM2814 ptxD PCR products for all isolates. PCR was run using a one cycle PCR program with an annealing temperature of 57oC. The band for ptxD is 962 bp and is indicated by the arrow. Lane designation: X. f. + is X. flavus positive control; numbers indicate BS isolate. amplifications to obtain enough PCR product to sequence.
As stated previously, PCR with X. flavus WM2814 ptxD was difficult
due to the high GC content of the ptxD gene (72.8%). At this time, no sequence
data have been obtained for the few isolates with single amplifiable bands (V. 5
paradoxus BS2, Acinetobacter Acb BS14, Streptomyces sp. BS20, and M. luteus
BS12) and PCR is still being optimized to determine whether the remaining
isolates with multiple bands are true X. flavus ptxD products.
Sequencing and alignment of A. faecalis WM2072 ptxD. The PCR

42
FIG. 20. A 1% TAE agarose gel stained with ethidium bromide for X. flavus WM2814 ptxD PCR products for all isolates. PCR was run using a two cycle PCR program with annealing temperatures of 55oC 30X and 50oC 10X. The band for ptxD is 962 bp and indicated by the arrow. Lane designation: X. f. + is X. flavus positive control; numbers indicate BS isolate. A No DNA negative control was clean. products obtained from V. paradoxus BS2, V. paradoxus BS5, V. paradoxusBS6,
P. fluorescens BS1, P. reinekei BS4, P. mendocina BS7, P. aeruginosa BS16, P.
putida BS15, and P. putida BS17 were sequenced. Sequences obtained covered
838 nucleotides within the protein coding region. All ptxD sequences obtained
were 100% identical at the nucleotide and amino acid levels to the A. faecalis
WM2072 ptxD (Fig. 21).
Database sequences. A BLAST search using the A. faecalis

43
FIG. 21. Phylogenetic tree of ptxD amino acid sequences obtained from !"#$%&'()*+&"*,-./*0#+#1#!"!*2!""*34#+#1#!"*5'('()6*'(*7"+&80!9*#(0*sequencing BS isolate ptxD PCR products. All BS isolates were 100% identical to the A. faecalis WM2072 ptxD. Red lines show Gram-positive bacteria; blue lines show :-Proteobacteria; green lines show ;-Proteobacteria; purple lines show <-=$8+"81#%+"$'#>*8$#()"*?'("*!&8@!*A-Proteobacteria. Phylogenetic tree created using ClustalW. See Table A2 in Appendix A for a matrix comparison of sequence homologies WM2072/P. stutzeri WM88 htxA amino acid sequence revealed a 100% match to
a 286 residue region in Pusillimonas sp. T7-7 (GenBank accession CP002663).
This region is annotated as an alpha-ketoglutarate-dependent hypophosphite
dioxygenase. A BLAST search of the entire A. faecalis WM2072 htx-ptx operon
shows this Pusillimonas sp. also shares 99% identity across ca. 7362 nucleotides
comprising ca. 87% of the A. faecalis htx-ptx operon.

44
A BLAST search using the A. faecalis WM2072 ptxD amino acid
sequence revealed a 100% match to a 333 residue region of Pusillimonas sp.
T7-7. The P. stutzeri WM88 ptxD amino acid sequence matched ca. 98% to P.
aeruginosa 2192 and 99% to Pseudomonas sp. K (GenBank accession
HQ910240), K. pneumoniae MGH 78578 (GenBank accession CP000648), and
Thioalkalivibrio sp. HL-EbGR7 (GenBank accession CP001339). No matches
were found using the X. flavus WM2814 ptxD sequence.
A BLAST search of the Environmental samples and Whole-genome
shotgun read databases using the nucleotide sequences for htxA and all three
ptxD sequences revealed no matches to htxA. No novel matches to A. faecalis or
X. flavus ptxD sequences were found in these two databases. Using the P.
stutzeri ptxD sequence revealed three novel sequence matches that were not
found in the Nucleotide collection database: a marine metagenome (GenBank
accession ABEF01009771) matched ca. 99%; an activated sludge metagenome
(GenBank accession AERA01017811) matched ca. 98%; and Marinobacter
algicola DG893 (GenBank accession ABCP01000001) matched ca. 66%.
Tracing the evolutionary history of known ptxD sequences. The
100% sequence homology of htxABCD from A. faecalis !"#$%#&'(')-
Proteobacteria, and P. stutzeri !"**&'('+-Proteobacteria, suggest horizontal
transfer occurred and no evolutionary history is clear. The 50% sequence
homology of ptxDE from A. faecalis WM2072, P. stutzeri WM88, and X. flavus
!"#*,-&'(.'/-Proteobacteria, suggest a long evolutionary history. To obtain
more data for the evolutionary history of ptxD, 16S rRNA sequences from

45
organisms identified to have a ptxD were aligned (Fig. 22). For those without a
published 16S sequence, a substitute sequence (same species but different
strain) was used instead. For the two metagenome sequences, no 16S sequence
could be found and so are not included in Fig. 22.
FIG. 22. 16S rRNA phylogenetic tree for bacteria possessing a ptxD ortholog (see Fig. 21). !"#$%"&'$(%()*+%,--.*/$*012/$.&13%4.$$'%"&'$(%()*+%5--.*/$*012/$.&13%6#.6"$%"&'$(%()*+%7--.*/$*012/$.&13%*.1'4$%"&'$%()*+(%8-Proteobacteria; red line shows the Gram-positive M. luteus BS12. Phylogenetic tree created using ClustalW.
The ptxD sequences fall into distinct phylogenetic groups with the
exception of Cupriavidus metallidurans 9:;<=%1%5-Proteobacteria with a ptxD
>*.$%(&>&"1.%/*%/)*($%?*#'@%&'%/)$%,-Proteobacteria. This suggests horizontal

46
transfer may have occurred more recently in C. metallidurans !"#$%&$%!"'%(!"')%*-
Proteobacteria. The grouping of ptxD +',-'$.'+%(/!#&$'0%&$%!"&+%+!-01%2)(3%4-
Proteobacteria and the Gram-positive M. luteus BS12 suggest potential
horizontal transfer that crosses bacterial divisions (68).

47
CHAPTER IV
DISCUSSION
Most Probable Number for Reduced Phosphorus Oxidizing Bacteria
Research into various aspects of the P cycle, particularly biologically
mediated redox of P compounds, has been largely ignored especially when
compared to the amount of research still performed on other equally important
biogeochemical cycles where bacteria have substantial roles in the redox of
nutrients (e.g. nitrogen, sulfur, carbon). This lack of interest and discussion lead
me to conclude the apparent consensus held by many outside the field of
reduced P biogeochemistry is that RPO, for any purpose (e.g. as an energy or a
sole P source), is so rare among environmental bacteria the issue is not a
pressing one to thoroughly investigate. My results, however, show RPOB are
present in high concentrations regardless of the season, site, or soil
characteristics. The high concentration of AEpn oxidizers observed in this study
is consistent with previous findings that bacteria able to degrade reduced organic
P compounds such as AEpn, are common in the environment, as is the biological
production of these phosphonate compounds (42, 63). From these data, it can be
concluded that the concentrations of bacteria with the ability to use the reduced P
compounds, Hpt, Pt, and AEpn, as a sole source of P are exceedingly high in
these common environments.

48
Unfortunately, bacterial RPO is still in its infancy and as such, there
remain numerous fundamental questions that must be answered to obtain a full
understanding of P biogeochemistry, or at least one on par with other
biogeochemical cycles. For example, the temporal progression for in situ
oxidation of PH3 to Pi is not well established. This means the concentrations and
biological availability of PH3, Hpt, and Pt in the environment as well as how the
oxidation of PH3 affects concentrations and availabilities of Hpt and Pt are not
established (i.e. is PH3 immediately oxidized to Pi or is it first oxidized to Hpt,
then to Pt, and finally to Pi?). Ultimately this means the effect on the availability
of reduced P compounds by bacteria is not established. In addition, biologically
relevant concentrations have not been established. As a result, experimental
concentrations may be toxic to these populations (discussed below) (21).
In terms of oxidation rates, it is known that as oxidation states
decrease, the stability in the presence of oxygen also decreases. Thus, in a
typical aerobic environment where there are no apparent consistent sources of
inorganic reduced P compounds, it would be expected that Pi and perhaps AEpn
would be the predominant P species with Pt, Hpt, and PH3 ranking somewhere
below respectively. In this environment it would be expected the majority of
bacteria would use Pi and AEpn with some minority capable of using inorganic
reduced P compounds. In an aerobic environment where the availability of any
reduced P compound is unknown but quite possibly present (e.g. agricultural
areas), it is expected there would be more bacteria capable of using reduced P
compounds, particularly if horizontal gene transfer is commonly occurring among

49
the populations (45, 66, 68). In other words, the P profile of an area should mimic
the bacterial profile. However, this idea is dependent upon determining in situ
concentrations and the rate of oxidation of the reduced P compounds. While site-
specific P composition (in soils this will require new or refined detection and
quantification methods) and bacterial population profiles are needed to clarify the
data in future studies, studies of ammonia-oxidizing bacteria provide potential
insight into the possible correlations between P and RPOB profiles. Temporal
changes in ammonia-oxidizing bacteria populations resulting from the
introduction of ammonia have shown the concentration of ammonia-oxidizing
bacteria typically increases when ammonia is introduced (6, 17, 46, 53). This
means that concentrations of RPOB may increase when reduced P compounds
are introduced.
There is currently little direct evidence for the presence of substantial
concentrations of Hpt and Pt in the environment. Pt has been detected in a
!"#$%#&'()&)'"*+#,(-'*%.'"/)0(!**0(#&(0*1(,*&,'&%")%#*&$(23435(678((47). In other
less pristine environments, Hpt and Pt have not been clearly identified in situ.
PH3, however, has been detected in several anaerobic sites (25). Highly reduced
compounds are extremely stable in anaerobic environments, thus it is not
surprising that PH3 has been found in numerous anaerobic environments such as
swamps and marshes (8, 16, 19, 25-28, 31, 51, 52). In aerobic environments,
however, PH3 rapidly oxidizes (the half-life can be as few as 5 h) to Pi (69). While
it has not been directly demonstrated, presumably when PH3 oxidizes to Pi, it
does so through Hpt and Pt intermediates. Hilton and Robinson (31) found

50
approximately 70% of PH3 was detectable after 40 days as Pi. This suggests at
least some of the remaining 30% may have been in the form of Hpt and/or Pt.
Indeed, Robinson and Bond, in a previous experiment found Hpt and Pt were
products of PH3 oxidation (50). While there are no data available for the half-life
of Hpt in soil (59), the half-life of Pt is on the order of a few months (4, 39). From
all of this, it might be expected that a higher concentration of RPOB would be
found in more anoxic sediments. To explain the high concentrations of bacteria
able to oxidize them, it might be suggested that this is the result of the
introduction of reduced P compounds into the environment by human activities.
To examine the effects of introduced reduced P compounds on the
concentrations of bacteria that can oxidize Pt, Hpt and AEpn in the environment,
MPN of reduced P oxidizers were determined in samples ranging from pristine to
those with extensive agricultural and urban run-off. When the MPN/g from Sed1
(pristine environment) are compared to those from Sed8 (downstream from
numerous agricultural areas including one known to use PH3 and Roundup® as
fumigants and pesticides), it is clear that similar numbers of reduced P oxidizers
are observed in both sites (Fig. 10). Thus, the high concentrations of bacteria
that can carry out RPO in these environments are independent of introduced
reduced P compounds. This suggests that reduced P compounds such as Hpt
and Pt may indeed be present in the natural environment in significant enough
quantities to maintain a high concentration of bacteria that can use them as a P
source.
While the MPN data clearly demonstrate RPOB are present, MPN

51
does not allow for the identification of bacterial species in the original sample and
their contribution to RPO. Thus, the diversity of RPOB from the 12 sites is
unknown. Identifications (Fig. 13 and Table 4) and preliminary data using direct
plating of soil samples onto Hpt, Pt, and AEpn do show diversity among RPOB
(data not shown).
While it was assumed that any bacteria capable of growth on the
reduced P compounds would also grow on Pi, there are limitations: (1) MPN
provides only an estimate of culturable bacteria, which is further compounded
due to the small percentage of environmental bacteria that are culturable under
laboratory conditions and the highly selective nature of the media used in this
study. (2) MPN analysis assumes an even distribution of bacteria. That is, it is
assumed the same bacteria present in the Pi media are also present in Hpt, Pt,
and AEpn media. (3) Environmental concentrations of the P compounds
(including Pi) may be significantly lower than experimental concentrations. This
may result in experimental concentrations (including Pi) being toxic to some or
many environmental bacteria (21). (4) The concentrations of the reduced P
compounds in certain environments may be higher than Pi making growth on
reduced P compounds easier. (5) The bacteria cultured may have
uncharacterized mechanisms that allow for growth on Hpt and Pt that would lead
some species outgrowing others. Currently all pathways characterized for RPO
requires Hpt to be oxidized to Pt and then to Pi (45, 67, 68). A novel pathway
could allow for more efficient oxidation of the reduced P compounds resulting in
relatively faster growth.

52
Genetic Analyses for htxA and ptxD
The aforementioned hypothesis that the P profile (e.g. concentrations
of reduced P compounds) and microbial profile (e.g. concentrations of reduced P
oxidizers) should positively correlate is not unreasonable and is consistent with
microbial genetics that repeatedly shows nonessential genes encoding for
nonessential functions are readily lost (14). P. stutzeri WM88, A. faecalis
WM2072, and X. flavus WM2814 all have entire operons devoted to transporting
and metabolizing reduced P compounds with regulatory genes often included
and which are induced in response to Pi starvation (45, 66-68). While it is
currently speculation, it logically follows that the reduced P compounds Hpt, Pt,
and AEpn must be present in natural environments in concentrations that are
biologically useful to these organisms and populations, including unculturable
populations, to keep selective pressure on the local bacterial populations to gain,
retain, and maintain some form of a functional RPO metabolic pathway. The
genetic data in this study supports this conclusion.
All isolates appear to have some ortholog of ptxD. However, two were
incapable of growth on Pt (M. luteus BS12, P. putida BS17) and six were capable
of moderate growth on Pt (P. stutzeri BS3, P. reinekei BS4, V. paradoxus BS5,
V. paradoxus BS6, P. aeruginosa BS16, Pseudomonas sp. BS21). The presence
of ptxD does not mean the isolate possesses a fully functional and complete ptx
operon. Without complete sequence data for the entire ptxD gene, a truncated or
mutated ptxD cannot be ruled out. In addition, a truncated or mutated ptx operon
could result in poor or no transporting of Pt.
53
There were notable differences between PCR and hybridization
results. For P. stutzeri WM88 ptxD and htxA, only P. fluorescens BS1 and P.
mendocina BS7 were positive with both PCR and hybridization. For htxA, P.
stutzeri BS3 was negative with PCR and positive for hybridization yet grows well
on Hpt. For P. stutzeri WM88 ptxD, P. stutzeri BS3 (moderate growth on Pt), P.
putida BS17 (no growth on Pt), and Pseudomonas sp. BS19 (strong growth on
Pt) were negative with PCR and positive with hybridization. Twelve isolates were
positive with PCR and negative with hybridization. Five were negative with both
PCR and hybridization.
There are three possible explanations as to why an isolate would be
positive for one (PCR or hybridization) and negative with the other. One
explanation may have to do with the homology of the primer region versus
homology of the entire gene. The primers used in PCR are ca. 20 nucleotides
while the genes used in hybridization are between ca. 850 to 950 bp. It is
possible there are mutations in the primer regions that prevent amplification but
not hybridization. It also may be that non-specific binding (hybridization) or
amplification (PCR) is occurring.
Without sequence data for the P. stutzeri WM88 ptxD, X. flavus
WM2814 ptxD, or the remaining htxA PCR products, it cannot be determined
whether non-specific amplification is occurring during PCR. Finally, the htxA
forward primer binds 75 nt upstream of the start codon. It may be that P. stutzeri
BS3 (negative PCR, positive hybridization) has mutations in this upstream region
that prevents primer binding. Ultimately, this may mean P. stutzeri BS3 has an

54
htxA that is less than 100% identical to the P. stutzeri WM88 and A. faecalis
WM2072 htxA. Without in-depth genetic analyses of those with negative PCR
and positive hybridization, I cannot determine to what region in the chromosome
htxA is hybridizing. Further study, especially for those positive with hybridization,
negative with PCR, and capable of strong growth on the respective reduced P
compound, is required.
There are two possible explanations for those with no detectable htxA
(negative with PCR and hybridization) capable of oxidizing Hpt (Pseudomonas
sp. BS19, Acinetobacter Acb BS14, B. elkanii BS9). These bacteria may have
novel Hpt oxidation pathways. Alternatively, they may possess genes similar to
the X. flavus WM2814 htxXY.
Sequence analysis showed all htxA PCR products were 100% identical
at the amino acid level to the previously characterized P. stutzeri WM88 and A.
faecalis WM2072 htxA. This much homology between genes found in bacteria
isolated from regions separated by a great geographic distance seems
suspicious (P. stutzeri WM88 and A. faecalis WM2072 were isolated from Illinois;
isolates from this study are from Oregon). Contamination can be ruled out since
some isolates did not give a PCR product and the negative (no DNA) control was
always clean. Sequence errors, however, cannot be ruled out since the Taq
polymerase used in this study is not a high-fidelity polymerase.
It is important to note Pusillimonas sp. T7-7, an isolate from the Bohai
Sea in China, has not only an htxA that matches 100% with htxA from P. stutzeri
WM88 and A. faecalis WM2072, but 87% (7362 of 8193 nucleotides) of the entire

55
A. faecalis WM2072 htx-ptx operon shares 99% sequence homology to a region
in Pusillimonas sp. T7-7. Given 87% of a nearly 8.2-kb region appears to be so
strongly conserved in isolates from Illinois and China strongly suggests finding a
region of ca. 0.9-kb conserved in isolates from Oregon is not improbable.
All of the ptxD sequences were 100% identical at the amino acid level
to the A. faecalis WM2072 ptxD. This was surprising since, unlike with htxA,
three ptxD orthologs have been identified and each are 50% identical at the
amino acid level. Contamination was not an issue as some isolates did not give a
PCR product and the negative control (no DNA) was always clean. The PCR
products from P. fluorescens BS1, V. paradoxus BS5, and M. luteus BS12 were
resequenced. Unfortunately, the sequence data was incomplete. The incomplete
data did show that for P. fluorescens BS1, nucleotides 72-262 and 638-900 and
for V. paradoxus BS5, nucleotides 92-298 and 498-878 were 100% identical to A.
faecalis. More sequence data was available for M. luteus BS12 and showed
nucleotides 70-888 were 100% identical to A. faecalis.
Without sequence data from P. stutzeri WM88 and X. flavus WM2814
ptxD PCR products, it is extremely difficult to completely interpret the ptxD data
and many questions remain to be answered. What is the actual distribution of
each ptxD gene in the natural environment? Do most of the isolates have an A.
faecalis WM2072 ptxD? Do some of the isolates have multiple ptxD genes or am
I amplifying P. stutzeri WM88 ptxD genes with the A. faecalis ptxD primer set? It
does seem unlikely, given the difficulty I have encountered when using X. flavus
WM2814 ptxD primers on my isolates, that I am amplifying X. flavus ptxD with

56
either P. stutzeri or A. faecalis ptxD primers. It would seem much more likely I
would amplify P. stutzeri or A. faecalis ptxD with X. flavus ptxD primers.
The increasing ease of genome sequencing will help to answer the
distribution question for both ptxD and htxA. Five sequences (Bradyrhizobium sp.
BTAi1, GenBank accession CP000494.1; Roseibium sp. TrichSKD4, GenBank
accession GL476319; Pantoea ananatis AJ13355, GenBank accession
AP012032; P. ananatis LMG 20103, GenBank accession CP001875;
Burkholderia rhizoxinica HKI 454, GenBank accession FR687359) in the NCBI
nucleotide database are annotated as htxA, HtxA-like, hypophosphite
dioxygenase, or putative alpha-ketoglutarate-dependent hypophosphite
dioxygenase. However, aligning these sequences with empirically known htxA
sequences showed these were not htxA genes (amino acid similarities to htxA
ranged from 16-44%) (See Table A3 in Appendix A for a matrix comparison of
sequence homologies). The percent similarities, as well as the presence of
conserved motifs (specifically the H-X-D-X motif), suggest these sequences are
part of the dioxygenase superfamily, not the htxA protein family.
!"#$%&'()*+&"*+"$,-*.ptxD/*#(0*/1&2-1&'+"*0"&30$2)"(#-"/*'(*+&"*
BLAST nucleotide database, as well as including bacteria previously determined
to have ptxD, resulted in 17 unique bacteria. Four bacteria found using P. stutzeri
WM88 were 99-100% identical indicating the P. stutzeri ptxD is strongly
conserved. Three bacteria found using A. faecalis WM2072 ptxD were ca. 65%
and 100% identical indicating more diversity. No bacteria were found using X.
flavus WM2814 that covered at least 80% of the query sequence.

57
The database results showing more bacteria match the P. stutzeri ptxD
suggest this ortholog may be more common in the environment. However, the
sequence analysis results presented here suggest the A. faecalis ptxD ortholog
may be more common. Since isolates identified in this study came from the same
environmental sample, it is entirely possible horizontal transfer events occurred
among the sample population. There is evidence ptxD has been horizontally
transferred between the !- and "-Proteobacteria classes (68). While horizontal
transfer is not uncommon between Gram-negative and Gram-positive bacteria, it
has not been demonstrated for ptxD. This is because ptxD had only been
identified in Gram-negative bacteria.
Broader implications. The potential impacts of bacterial RPO are
great and include the degree to which P is available, obtaining a fuller
understanding of bioremediation, as well as developing and maintaining effective
agricultural practices. In terms of P availability, there is concern that P,
specifically Pi, is not a renewable resource (32). The influence RPOB have on P
availability will remain unknown until further multi-disciplinary research is
performed on a wide range of environments. The impact on bioremediation,
especially with the increasing popularity of reduced P compounds like Pt in
fertilizers and as a treatment for Sudden Oak Death (22, 37), may not be as clear
but is still important given the unknown state of biotic and abiotic oxidation of
reduced P compounds. Currently, the assumption is when Pt is applied to an
area it rapidly oxidizes to Pi and thus there are little or no ramifications from
using Pt. There are at least four problems with this idea. First, only a handful of

58
studies have shown the oxidation rate of Pt in situ (estimated half-life is on the
order of a few months) (4, 39) but, this rate is likely dependent on a multitude of
site-specific or region-specific factors. Thus, not only are studies required to
determine the rate of Pt oxidation under various environmental conditions, also
required are studies using equipment that can detect small biologically useful
concentrations of Pt. Second, the total effects on the surrounding environment
from the introduction of Pt are unknown but given bacteria can oxidize Pt to Pi,
there are likely some effects. Third, at the very least, assuming Pt rapidly
oxidizes to Pi, the introduction of Pt is introducing high amounts of Pi, which can
lead to numerous ecological problems (e.g. eutrophication, run-off creating algal
plumes and dead zones) (12, 13, 18). Finally, there may be agricultural impacts.
The presence of reduced P compounds in fertilizers and herbicides/pesticides
may lead to rhizobacterial populations and plants competing for these
compounds. The results could be ineffective fertilizers or toxic amounts of P
compounds (reduced and Pi) that may affect rhizobacterial populations and,
directly or indirectly, plant populations.
Despite the increasing number of reports demonstrating the oxidation
of reduced P compounds by bacteria, this biological phenomenon continues to
be largely overlooked in the current description of P cycling in the environment,
perhaps due to a lack of understanding of the environmental significance of this
activity. In an effort to further investigate the contribution of bacterial RPO to a
global P redox cycle in an environmental context, I sought to quantify microbial
RPO in the environment and the genes used. The ubiquity of RPOB and

59
oxidation genes indicates the apparent importance of this activity in the
environment, and provides indirect evidence that these compounds may be
important sources of P for bacteria. Finally, these data indicate that our current
understanding of P flux and transformation through ecosystems is incomplete.
Additional investigations of this activity and its impact on the environment are
critical to our understanding of P cycling and availability, which is essential for
effective P conservation efforts (23), understanding nutrient availability, and
improving agricultural and bioremediation practices. In total, these data provide
very strong evidence for the importance of RPO by bacteria in the environment
and their roles in altering available Pi levels (Fig. 23). In addition, sufficient
evidence is provided to warrant further investigation of bacterial oxidation of
reduced P compounds and investigation of the roles bacterially mediated P redox
play in P cycling and biogeochemistry.

60
FIG. 23. A more accurate P cycle. By combining the results of this study with results from studies over the last 100 years, a more accurate P cycle can be drawn. Known point sources of reduced P compounds (PH3, Hpt, and Pt) include fertilizers, pesticides, and industrial processes. Known bacterial oxidation via the genes htxA and ptxD are shown in red. Known bacterial reduction of phosphonates and phosphinates are shown in blue. While natural sources of PH3, Hpt, or Pt are still unclear, abiotic reduction has been demonstrated (27) and biotic reduction is possible (51). Possible bacterial reduction is shown in green.

REFERENCES

62
REFERENCES
1. Adams, F., and J. P. Conrad. 1953. Transition of phosphite to phosphate in soils. Soil Sci. 75:361-371.
2. Agarwal, R. K., and A. Perl. 1993. PCR amplification of highly GC-rich DNA template after denaturation by NaOH. Nucleic Acids Res. 21:5283-5284.
3. Baird-Parker, A. C. 1974. Genus I. Micrococcus, p. 478-483. In R. E. Buchanan and N. E. Gibbons (ed.), Bergey's manual of determinative bacteriology, 8th ed. The Williams & Wilkins Company, Baltimore, MD.
4. Bezuidenhout, J., J. Darvas, and J. Kotze. 1987. The dynamics and distribution of phosphite in avocado trees treated with phosetyl-Al. South African Avocado Growers' Association Yearbook 10:101-103.
5. Briones, A. M., and W. Reichardt. 1999. Estimating microbial population counts by 'most probable number' using Microsoft Excel. J. Microbiol. Methods 35:157-161.
6. Bruns, M. A., J. R. Stephen, G. A. Kowalchuk, J. I. Prosser, and E. A. Paul. 1999. Comparative Diversity of Ammonia Oxidizer 16S rRNA Gene Sequences in Native, Tilled, and Successional Soils. Appl. Environ. Microbiol. 65:2994-3000.
7. Buchanan, R. E., and N. E. Gibbons (ed.). 1974. Bergey's manual of determinative bacteriology, 8th ed. The Williams & Wilkins Company, Baltimore, MD.
8. Burford, J. R., and J. M. Bremner. 1972. Is phosphate reduced to phosphine in waterlogged soils? Soil Biol. Biochem. 4:489-495.
9. Casida, L. E., Jr. 1960. Microbial oxidation and utilization of orthophosphite during growth. J. Bacteriol. 80:237-241.
10. Cole, J., B. Chai, R. Farris, Q. Wang, A. Kulam-Syed-Mohideen, D. McGarrell, A. Bandela, E. Cardenas, G. Garrity, and J. Tiedje. 2006. The ribosomal database project (RDP-II): introducing myRDP space and quality controlled public data. Nucleic Acids Res. 35:D169-172.
11. Cole, J., Q. Wang, E. Cardenas, J. Fish, B. Chai, R. Farris, A. Kulam-Syed-Mohideen, D. McGarrell, T. Marsh, and G. Garrity. 2009. The Ribosomal Database Project: improved alignments and new tools for rRNA analysis. Nucleic Acids Res. 37:D141-145.
12. Conley, D. J., H. W. Paerl, R. W. Howarth, D. F. Boesch, S. P. Seitzinger, K. E. Havens, C. Lancelot, and G. E. Likens. 2009. Controlling eutrophication: nitrogen and phosphorus. Science 323:1014-1015.
13. Correll, D. L. 1998. Role of phosphorus in the eutrophication of receiving waters: a review. J. Environ. Qual. 27:261-266.

63
14. Davis, B. D., and M. K. Waldor. 2002. Mobile genetic elements and bacterial pathogenesis, p. 1040-1059. In N. L. Craig, R. Craigie, M. Gellert, and A. M. Lambowitz (ed.), Mobile DNA II. ASM Press, Washington, DC.
15. De Graaf, R. M., and A. W. Schwartz. 2000. Reduction and activation of phosphate on the primitive earth. Orig. Life Ecol. Biosph. 30:405-410.
16. Devai, I., and R. D. Delaune. 1995. Evidence for phosphine production and emission from Louisiana and Florida marsh soils. Org. Geochem. 23:277-279.
17. Di, H. J., K. C. Cameron, J. P. Shen, C. S. Winefield, M. O'Callaghan, S. Bowatte, and J. Z. He. 2010. Ammonia oxidizing bacteria and archaea grow under contrasting soil nitrogen conditions. FEMS Microbiol. Ecol. 72:386-394.
18. Diaz, R. J., and R. Rosenberg. 2008. Spreading dead zones and consequences for marine ecosystems. Science 321:926-929.
19. Eismann, F., D. Glindemann, A. Bergmannt, and P. Kuschk. 1997. Soils as source and sink of phosphine. Chemosphere 35:523-533.
20. Feng, P., S. D. Weagant, and M. A. Grant. September 2002. Enumeration of Escherichia coli and the coliform bacteria, chapter 4. In Bacteriological analytical manual online, 8th ed. U. S. Food and Drug Administration, Washington, DC.
21. Foster, T. L., L. Winans, Jr., and S. J. Helms. 1978. Anaerobic utilization of phosphite and hypophosphite by Bacillus sp. Appl. Environ. Microbiol. 35:937-944.
22. Garbelotto, M., D. Schmidt, and T. Harnik. 2007. Phosphite injections !"#$%!&'$!(()*+!,*-"$-.$/0-1(0*,2$3$/2",&!%!&'4$+-",&-)$15##2"$-!'$#2!,0$in coast live oak. Arboric. Urban For. 33:309-317.
23. Gilbert, N. 2009. Environment: The disappearing nutrient. Nature 461:716-718.
24. Glindemann, D., R. M. De Graaf, and A. W. Schwartz. 1999. Chemical reduction of phosphate on the primitive earth. Orig. Life Ecol. Biosph. 29:555-561.
25. Glindemann, D., M. Edwards, J.-a. Liu, and P. Kuschk. 2005. Phosphine in soils, sludges, biogases and atmospheric implications--a review. Ecol. Eng. 24:457-463.
26. Glindemann, D., M. Edwards, and P. Morgenstern. 2005. Phosphine from rocks: mechanically driven phosphate reduction? Environ. Sci. Technol. 39:8295-8299.
27. Glindemann, D., M. Edwards, and O. Schrems. 2004. Phosphine and methylphosphine production by simulated lightning--a study for the volatile phosphorus cycle and cloud formation in the earth atmosphere. Atmos. Environ. 38:6867-6874.
28. Glindemann, D., F. Eismann, A. Bergmann, P. Kuschk, and U. Stottmeister. 1998. Phosphine by bio-corrosion of phosphide-rich iron. Environ. Sci. Pollut. Res. Int. 5:71-74.

64
29. Goujon, M., H. McWilliam, W. Li, F. Valentin, S. Squizzato, J. Paern, and R. Lopez. 2010. A new bioinformatics analysis tools framework at EMBL!EBI. Nucleic Acids Res. 38:W695-699.
30. Heinen, W., and A. Lauwers. 1974. Hypophosphite oxidase from Bacillus caldolyticus. Arch. Microbiol. 95:267-274.
31. Hilton, H. W., and W. H. Robison. 1972. Fate of zinc phosphide and phosphine in the soil-water environment. J. Agric. Food Chem. 20:1209-1213.
32. Hirota, R., A. Kuroda, J. Kato, and H. Ohtake. Bacterial phosphate metabolism and its application to phosphorus recovery and industrial bioprocesses. J. Biosci. Bioeng. 109:423-432.
33. Hsieh, Y. J., and B. L. Wanner. 2010. Global regulation by the seven-component Pi signaling system. Curr. Opin. Microbiol. 13:198-203.
34. Islam, K., and S. Wright. 2006. Microbial biomass measurement methods, p. 1067-1070. In R. Lal (ed.), Encyclopedia of soil science, second edition. Taylor & Francis, New York.
35. Jenkins, R. O., T. A. Morris, P. J. Craig, A. W. Ritchie, and N. Ostah. 2000. Phosphine generation by mixed- and monoseptic-cultures of anaerobic bacteria. Sci. Total Environ. 250:73-81.
36. Kaysner, C. A., and A. DePaola Jr. May 2004. Vibrio, chapter 9. In Bacteriological analytical manual online, 8th ed. U. S. Food and Drug Administration, Washington, DC.
37. Kliejunas, J. T. 2010. Sudden oak death and Phytophthora ramorum: a summary of the literature. USDA Forest Service General Technical Report PSW-GTR-234. USDA Pacific Southwest Research Station, Albany, CA.
38. Larkin, M., G. Blackshields, N. Brown, R. Chenna, P. McGettigan, H. McWilliam, F. Valentin, I. Wallace, A. Wilm, and R. Lopez. 2007. Clustal W and Clustal X version 2.0. Bioinformatics 23:2947-2948.
39. Lovatt, C. J., and R. L. Mikkelsen. 2006. Phosphite Fertilizers: What are they? Can you use them? What can they do? Better Crops 90:11-13.
40. Martinez, A., G. W. Tyson, and E. F. DeLong. 2010. Widespread known and novel phosphonate utilization pathways in marine bacteria revealed by functional screening and metagenomic analyses. Environ. Microbiol. 12:222-238.
41. McDowell, M. M., M. M. Ivey, M. E. Lee, V. V. Firpo, T. M. Salmassi, C. S. Khachikian, and K. L. Foster. 2004. Detection of hypophosphite, phosphite, and orthophosphate in natural geothermal water by ion chromatography. J. Chromatogr. A 1039:105-111.
42. Metcalf, W. W., and W. A. van der Donk. 2009. Biosynthesis of Phosphonic and Phosphinic Acid Natural Products. Annu. Rev. Biochem. 78:65-94.
43. Metcalf, W. W., and B. L. Wanner. 1993. Evidence for a fourteen-gene, phnC to phnP locus for phosphonate metabolism in Escherichia coli. Gene 129:27-32.

65
44. Metcalf, W. W., and B. L. Wanner. 1991. Involvement of the Escherichia coli phn (psiD) gene cluster in assimilation of phosphorus in the form of phosphonates, phosphite, Pi esters, and Pi. J. Bacteriol. 173:587-600.
45. Metcalf, W. W., and R. S. Wolfe. 1998. Molecular genetic analysis of phosphite and hypophosphite oxidation by Pseudomonas stutzeri WM88. J. Bacteriol. 180:5547-5558.
46. Okano, Y., K. R. Hristova, C. M. Leutenegger, L. E. Jackson, R. F. Denison, B. Gebreyesus, D. Lebauer, and K. M. Scow. 2004. Application of real-time PCR to study effects of ammonium on population size of ammonia-oxidizing bacteria in soil. Appl. Environ. Microbiol. 70:1008-1016.
47. Pech, H., A. Henry, C. S. Khachikian, T. M. Salmassi, G. Hanrahan, and K. L. Foster. 2009. Detection of geothermal phosphite using high-performance liquid chromatography. Environ. Sci. Technol. 43:7671-7675.
48. Postgate, J. R. 1968. Fringe biochemistry among microbes. Proc. R. Soc. London., B, Biol. Sci 171:67-76.
49. Pridham, T. G., and H. D. Tresner. 1974. Genus I. Streptomyces, p. 748-829. In R. E. Buchanan and N. E. Gibbons (ed.), Bergey's manual of determinative bacteriology, 8th ed. The Williams and Wilkins Company, Baltimore, MD.
50. Robinson, J., and E. Bond. 1970. The toxic action of phosphine:: Studies with 32PH3; Terminal residues in biological materials. J. Stored Prod. Res. 6:133-146.
51. Roels, J., and W. Verstraete. 2001. Biological formation of volatile phosphorus compounds. Bioresour. Technol. 79:243-250.
52. Rutishauser, B. V., and R. Bachofen. 1999. Phosphine formation from sewage sludge cultures. Anaerobe 5:525-531.
53. Schauss, K., A. Focks, S. Leininger, A. Kotzerke, H. Heuer, S. Thiele Bruhn, S. Sharma, B. M. Wilke, M. Matthies, and K. Smalla. 2009. Dynamics and functional relevance of ammonia oxidizing archaea in two agricultural soils. Environ. Microbiol. 11:446-456.
54. Schink, B., and M. Friedrich. 2000. Bacterial metabolism: Phosphite oxidation by sulphate reduction. Nature 406:37.
55. Schink, B., V. Thiemann, H. Laue, and M. W. Friedrich. 2002. Desulfotignum phosphitoxidans sp. nov., a new marine sulfate reducer that oxidizes phosphite to phosphate. Arch. Microbiol. 177:381-391.
56. Simeonova, D. D., M. M. Wilson, W. W. Metcalf, and B. Schink. 2010. Identification and heterologous expression of genes involved in anaerobic dissimilatory phosphite oxidation by Desulfotignum phosphitoxidans. J. Bacteriol. 192:5237-5244.
57. Singh, B. K. 2009. Organophosphorus-degrading bacteria: ecology and industrial applications. Nat. Rev. Microbiol. 7:156-164.
58. Tsubota, G. 1959. Phosphate reduction in the paddy field I. Soil and Plant Food 5:10-15.

66
59. U. S. Environmental Protection Agency. 2010. Printed wiring board cleaner technologies substitutes assessment: making holes conductive. U. S. Environmental Protection Agency publication no. EPA/744-R-01-003B. U. S. Environmental Protection Agency, Washington, DC.
60. Vershinina, O. A., and L. V. Znamenskaya. 2002. The Pho Regulons of Bacteria. Microbiology 71:497-511.
61. Wanner, B. L. 1986. Novel regulatory mutants of the phosphate regulon in Escherichia coli K-12. J. Mol. Biol. 191:39-58.
62. Wanner, B. L., and W. W. Metcalf. 1992. Molecular genetic studies of a 10.9-kb operon in Escherichia coli for phosphonate uptake and biodegradation. FEMS Microbiol. Lett. 100:133-139.
63. Warren, W. A. 1968. Biosynthesis of phosphonic acids in Tetrahymena. Biochim. Biophys. Acta 156:340-346.
64. White, A. K., and W. W. Metcalf. 2004. The htx and ptx operons of Pseudomonas stutzeri WM88 are new members of the Pho regulon. J. Bacteriol. 186:5876-5882.
65. White, A. K., and W. W. Metcalf. 2007. Microbial metabolism of reduced phosphorus compounds. Annu. Rev. Microbiol. 61:379-400.
66. White, A. K., and W. W. Metcalf. 2004. Two C--P lyase operons in Pseudomonas stutzeri and their roles in the oxidation of phosphonates, phosphite, and hypophosphite. J. Bacteriol. 186:4730-4739.
67. Wilson, M. M. 2006. Characterization of reduced phosphorus metabolism in Alcaligenes faecalis WM2072 and Xanthobacter flavus WM2814. Ph.D. Thesis. University of Illinois at Urbana-Champaign, IL.
68. Wilson, M. M., and W. W. Metcalf. 2005. Genetic diversity and horizontal transfer of genes involved in oxidation of reduced phosphorus compounds by Alcaligenes faecalis WM2072. Appl. Environ. Microbiol. 71:290-296.
69. World Health Organization. 1988. Environmental health criteria 73. Phosphine and selected metal phosphides. World Health Organization, Geneva, Switzerland.
70. Wösten, M. M. S. M., C. T. Parker, A. Van Mourik, M. R. Guilhabert, L. Van Dijk, and J. P. M. Van Putten. 2006. The Campylobacter jejuni PhosS/PhosR operon represents a non-classical phosphate-sensitive two-component system. Mol. Microbiol. 62:278-291.
71. Yang, K., and W. W. Metcalf. 2004. A new activity for an old enzyme: Escherichia coli bacterial alkaline phosphatase is a phosphite-dependent hydrogenase. Proc. Natl. Acad. Sci. U.S.A. 101:7919-7924.

APPENDIX A

68
TABLE A1. Pairwise sequence alignment scores for the 16S rRNA sequences of the 19 bacterial isolates identified in this study. Pairwise alignment scores, in addition to phylogenetic trees, can be used to approximate how closely related certain species or genera are to each other.
B. e
lkan
ii B
S9
V. p
ara
doxus
BS
2
V. p
ara
doxus
BS
5
V. p
ara
doxus
BS
6
V. p
ara
doxus
BS
8
Acin
eto
bacte
r A
cb B
S1
3
Acin
eto
bacte
r A
cb B
S1
4
P. a
eru
gin
osa
BS
16
P. fluore
scens
BS
1
P. m
end
ocin
a
BS
7
P. p
utida B
S15
P. p
utida B
S17
P. re
ineke
i B
S4
P. stu
tzeri
BS
3
Pseud
om
onas
sp. B
S18
Pseud
om
onas
sp. B
S19
Pseud
om
onas
sp. B
S21
M. lu
teus B
S12
Str
epto
myces
sp. B
S20
Bradyrhizobium elkanii BS9
--- 82 80 81 80 81 77 81 77 80 79 79 78 81 78 83 82 77 77
Variovorax paradoxus BS2
82 --- 99 100 100 78 80 81 81 82 80 81 81 82 79 82 81 79 79
Variovorax paradoxus BS5
80 99 --- 99 98 79 76 81 78 81 80 80 81 81 76 81 80 76 78
Variovorax paradoxus BS6
81 100 99 --- 99 79 77 81 79 81 80 81 81 82 77 81 81 77 79
Variovorax paradoxus BS8
80 100 98 99 --- 79 77 81 79 81 78 78 79 81 78 81 81 77 77
Acinetobacter Acb BS13
81 78 79 79 79 --- 98 84 85 85 85 86 86 85 83 86 87 78 79
Acinetobacter Acb BS14
77 80 76 77 77 98 --- 83 86 82 82 82 82 85 85 86 85 76 74
Pseudomonas aeruginosa BS16
81 81 81 81 81 84 83 --- 93 95 96 96 94 95 93 95 95 77 80
Pseudomonas fluorescens BS1
77 81 78 79 79 85 86 93 --- 93 93 93 91 96 97 99 98 75 75
Pseudomonas mendocina BS7
80 82 81 81 81 85 82 95 93 --- 96 95 93 97 93 97 96 77 79

69
TABLE A1 (continued)
B. e
lkan
ii B
S9
V. p
ara
doxus
BS
2
V. p
ara
doxus
BS
5
V. p
ara
doxus
BS
6
V. p
ara
doxus
BS
8
Acin
eto
bacte
r A
cb B
S1
3
Acin
eto
bacte
r A
cb B
S1
4
P. a
eru
gin
osa
BS
16
P. fluore
scens
BS
1
P. m
end
ocin
a
BS
7
P. p
utida B
S15
P. p
utida B
S17
P. re
ineke
i B
S4
P. stu
tzeri
BS
3
Pseud
om
onas
sp. B
S18
Pseud
om
onas
sp. B
S19
Pseud
om
onas
sp. B
S21
M. lu
teus B
S12
Str
epto
myces
sp. B
S20
Pseudomonas putida BS15
79 80 80 80 78 85 82 96 93 96 --- 100 96 96 95 96 96 77 80
Pseudomonas putida BS17
79 81 80 81 78 86 82 96 93 95 100 --- 96 96 96 96 96 77 80
Pseudomonas reinekei BS4
78 81 81 81 79 86 82 94 91 93 96 96 --- 94 92 97 96 76 78
Pseudomonas stutzeri BS3
81 82 81 82 81 85 85 95 96 97 96 96 94 --- 94 96 96 80 81
Pseudomonas sp. BS18
78 79 76 77 78 83 85 93 97 93 95 96 92 94 --- 96 94 78 77
Pseudomonas sp. BS19
83 82 81 81 81 86 86 95 99 97 96 96 97 96 96 --- 100 78 80
Pseudomonas sp. BS21
82 81 80 81 81 87 85 95 98 96 96 96 96 96 94 100 --- 77 79
Micrococcus luteus BS12
77 79 76 77 77 78 78 77 75 77 77 77 76 80 78 78 77 --- 92
Streptomyces sp. BS20
77 79 76 79 77 79 74 80 75 79 80 78 78 81 77 80 79 92 ---

70
TABLE A2. Pairwise sequence alignment scores for the ptxD sequences referenced in this study. The alignment scores for Pusillimonas sp. T7-7, V. paradoxus BS2, V. paradoxus BS5, V. paradoxus BS6, P. aeruginosa BS16, P. fluorescens BS1, P. mendocina BS7, P. putida BS15, P. putida BS17, P. reinekei BS4, and M. luteus BS12 are not included in this table since they were all 100% identical to the A. faecalis WM2072 ptxD sequence. Pairwise alignment scores, in addition to phylogenetic trees, can be used to approximate how closely related the sequences are to each other.
Activa
ted s
ludg
e
A. fa
ecalis
WM
20
72
A. d
enitrificans K
601
B. vie
tna
mie
nsis
G4
C. m
eta
llidura
ns C
H34
D. ph
osphitoxid
ans
H. ars
enic
oxydans
K. p
neu
mon
iae M
GH
785
78
Ma
rin
e m
eta
gen
om
e
M. a
lgic
ola
M. exto
rquens A
M1
ME
TA
2p
036
0
M. exto
rquens A
M1
ME
TA
2p
123
3
M. exto
rquens D
M4
P. a
eru
gin
osa 2
19
2
P. a
eru
gin
osa P
AG
I-7
Pseud
om
onas s
p.
K
P. stu
tzeri
WM
88
Rals
tonia
sp. 5-7
-47F
AA
S. p
utr
efa
cie
ns 2
00
T. sulfid
op
hilu
s H
L E
bG
r-7
X. flavus W
M2
814
Activated sludge AERA01017811
--- 53 52 52 45 39 55 97 97 64 54 53 51 100 96 96 97 53 59 96 53
Alcaligenes faecalis WM2072
53 --- 62 64 44 40 59 52 52 54 49 48 50 53 53 52 52 62 51 52 49
Alicycliphilus denitrificans K601
52 62 --- 70 47 42 65 53 53 56 48 52 52 52 54 53 53 100 53 53 51
Burkholderia vietnamiensis G4
52 64 70 --- 42 39 67 52 52 53 50 49 50 52 53 53 52 70 50 53 50
Cupriavidus metallidurans CH34
45 44 47 42 --- 32 43 45 45 44 49 51 52 45 45 44 45 47 45 45 47
Desulfotignum phosphitoxidans
39 40 42 39 32 --- 39 39 39 37 36 36 37 39 38 38 39 42 36 39 34

71
TABLE A2 (continued)
Activa
ted s
ludg
e
A. fa
ecalis
WM
20
72
A. d
enitrificans K
601
B. vie
tna
mie
nsis
G4
C. m
eta
llidura
ns C
H34
D. ph
osphitoxid
ans
H. ars
enic
oxydans
K. p
neu
mon
iae M
GH
785
78
Ma
rin
e m
eta
gen
om
e
M. a
lgic
ola
M. exto
rquens A
M1
ME
TA
2p
036
0
M. exto
rquens A
M1
ME
TA
2p
123
3
M. exto
rquens D
M4
P. a
eru
gin
osa 2
19
2
P. a
eru
gin
osa P
AG
I-7
Pseud
om
onas s
p.
K
P. stu
tzeri
WM
88
Rals
tonia
sp. 5-7
-47F
AA
S. p
utr
efa
cie
ns 2
00
T. sulfid
op
hilu
s H
L E
bG
r-7
X. flavus W
M2
814
Herminiimonas arsenicoxydans
55 59 65 67 43 39 --- 55 55 53 50 50 50 55 55 55 55 65 51 55 50
Klebsiella pneumoniae MGH 78578
97 52 53 52 45 39 55 --- 99 64 55 52 51 97 98 97 99 53 60 98 53
Marine metagenome ABER01009771
97 52 53 52 45 39 55 99 --- 64 55 52 51 97 98 98 100 53 60 99 53
Marinobacter algicola
64 54 56 53 44 37 53 64 64 --- 54 54 54 64 64 64 64 56 66 64 51
Methylobacterium extorquens AM1 META2p0360
54 49 48 50 49 36 50 55 55 54 --- 73 71 54 55 54 55 48 49 55 54
Methylobacterium extorquens AM1 META2p1233
53 48 52 49 51 36 50 52 52 54 73 --- 84 53 53 52 52 52 47 52 54
Methylobacterium extorquens DM4
51 50 52 50 52 37 50 51 51 54 71 84 --- 51 52 52 51 52 47 52 54
Pseudomonas aeruginosa 2192
100 53 52 52 45 39 55 97 97 64 54 53 51 --- 96 96 97 53 59 96 53

72
TABLE A2 (continued)
Activa
ted s
ludg
e
A. fa
ecalis
WM
20
72
A. d
enitrificans K
601
B. vie
tna
mie
nsis
G4
C. m
eta
llidura
ns C
H34
D. ph
osphitoxid
ans
H. ars
enic
oxydans
K. p
neu
mon
iae M
GH
785
78
Ma
rin
e m
eta
gen
om
e
M. a
lgic
ola
M. exto
rquens A
M1
ME
TA
2p
036
0
M. exto
rquens A
M1
ME
TA
2p
123
3
M. exto
rquens D
M4
P. a
eru
gin
osa 2
19
2
P. a
eru
gin
osa P
AG
I-7
Pseud
om
onas s
p.
K
P. stu
tzeri
WM
88
Rals
tonia
sp. 5-7
-47F
AA
S. p
utr
efa
cie
ns 2
00
T. sulfid
op
hilu
s H
L E
bG
r-7
X. flavus W
M2
814
Pseudomonas aeruginosa PAGI-7
96 53 54 53 45 38 55 98 98 64 55 53 52 96 --- 99 98 54 60 99 53
Pseudomonas sp. K
96 52 53 53 44 38 55 97 98 64 54 52 52 96 99 --- 98 53 60 98 53
Pseudomonas stutzeri WM88
97 52 53 52 45 39 55 99 100 64 55 52 51 97 98 98 --- 53 60 99 53
Ralstonia sp. 5-7-47FAA
53 62 100 70 47 42 65 53 53 56 48 52 52 53 54 53 53 --- 53 54 51
Shewanella putrefaciens 200
59 51 53 50 45 36 51 60 60 66 49 47 47 59 60 60 60 53 --- 61 46
Thioalkalivibrio sulfidophilus HL EbGr-7
96 52 53 53 45 39 55 98 99 64 55 52 52 96 99 98 99 54 61 --- 53
Xanthobacter flavus WM2814
53 49 51 50 47 34 50 53 53 51 54 54 54 53 53 53 53 51 46 53 ---

73
TABLE A3. Pairwise sequence alignment scores for the htxA sequences identified or referenced in this study. Pairwise alignment scores, in addition to phylogenetic trees, can be used to approximate how closely related the sequences are to each other. Sequences with scores greater than 50% are considered to be in the htxA family. Sequences with scores lower than 50% are considered to be in the 2-oxoglutarate-dependent dioxygenase superfamily.
A.
faeca
lis W
M
20
72
Bra
dyrh
izo
biu
m
sp
. B
TA
i1
B.
rhiz
oxin
ixa
HK
I
M.
lute
us B
S1
2
P.
an
an
atis
a
P.
flu
ore
sce
ns
BS
1
P.
pu
tid
a B
S1
5
P.
pu
tid
a B
S1
7
Pse
ud
om
on
as s
p.
BS
18
Pse
ud
om
on
as s
p.
BS
21
P.
stu
tzeri
WM
88
Pu
sill
imo
na
s s
p.
T7-7
Ro
se
ibiu
m s
p.
V.
pa
rad
oxu
s B
S5
V.
pa
rad
oxu
s B
S8
Alcaligenes faecalis WM 2072 --- 44 16 100 25 100 100 100 100 100 100 100 35 100 100
Bradyrhizobium sp. BTAi1 44 --- 18 44 28 44 44 44 44 44 44 44 35 44 44
Bradyrhizobium rhizoxinixa HKI 454 16 18 --- 16 22 16 16 16 16 16 16 16 15 16 16
Micrococcus luteus BS12 100 44 16 --- 25 100 100 100 100 100 100 100 34 100 100
Pantoea ananatisa 25 28 22 25 --- 25 25 25 25 25 25 25 24 25 25
Pseudomonas fluorescens BS1 100 44 16 100 25 --- 100 100 100 100 100 100 34 100 100
Pseudomonas putida BS15 100 44 16 100 25 100 --- 100 100 100 100 100 34 100 100
Pseudomonas putida BS17 100 44 16 100 25 100 100 --- 100 100 100 100 34 100 100
Pseudomonas sp. BS18 100 44 16 100 25 100 100 100 --- 100 100 100 34 100 100
Pseudomonas sp. BS21 100 44 16 100 25 100 100 100 100 --- 100 100 34 100 100
Pseudomonas stutzeri WM88 100 44 16 100 25 100 100 100 100 100 --- 100 35 100 100
Pusillimonas sp. T7-7 100 44 16 100 25 100 100 100 100 100 100 --- 35 100 100
Roseibium sp. TrichSKD4 35 35 15 34 24 34 34 34 34 34 35 35 --- 34 34
Variovorax paradoxus BS5 100 44 16 100 25 100 100 100 100 100 100 100 34 --- 100
Variovorax paradoxus BS8 100 44 16 100 25 100 100 100 100 100 100 100 34 100 --- a Two strains were found in the NCBI database (AJ13355 and LMG 20103) but the annotated region of interest was 100% identical in both strains.


![Selection of Bacteria Capable of Dissimilatory Reduction ...eprints.ibb.waw.pl/210/1/Sikora_et_al.pdfMPN values were calculated using McCrady’s table [12]. To determine the content](https://img.dokumen.tips/doc/110x75/5b18389f7f8b9a2d258b9320/selection-of-bacteria-capable-of-dissimilatory-reduction-values-were-calculated.jpg)