Embed Size (px)
Citation preview

ANALYSIS OF EMERGENCY DEPARTMENT USE in MAINE
A Study Conducted on Behalf of the Emergency Department Use Work Group of the
Maine Advisory Council on Health System Development
Beth Kilbreth Barbara Shaw
Danielle Westcott Carolyn Gray
Muskie School of Public Service
January, 2010
Report funded by a grant from the Maine Health Access Foundation and a Cooperative Agreement Between the Cutler Institute and the Maine Department of Health and Human Services
Acknowledgements
The authors would like to thank the many individuals, physicians, nurses, nurse practitioners, hospital administrators and practice managers who generously shared their thoughts and experiences with us on the topic of emergency department utilization. We would, in addition, would like to express our appreciation to the MaineCare program participants who participated in focus groups and shared their experiences with us. Karl Finison at Onpoint Health Data produced the analyses based on hospital discharge data that are included in the report. He and the research analysts at Onpoint Health Data are valued colleagues in this research. The analysis of potentially preventable visits presented in this report borrows a methodology developed by Mr. Finison with medical consultants in the New Hampshire Medicaid Program. Finally, we would like to express our appreciation to the Maine Health Access Foundation and the Maine Department of Health and Human Services who, together, provided the funding to support this research.
TABLE OF CONTENTS
Executive Summary .......................................................................................................... 1
I. Introduction ........................................................................................................... 3 II. Study Methods ...................................................................................................... 5 III. Findings from Analyses of Statewide Emergency Department Use .................... 11 IV. Comparison of Six Maine Health Service Areas ................................................. 21 V. MaineCare Enrollee Focus Group Report ........................................................... 33 VI. Health System Factors Related to ED Use ......................................................... 43 VII. Patient Beliefs and Behaviors Related to Emergency Department Use .............. 47 VIII. Recommendations for Policy Options and Further Analysis ............................... 49
Bibliography .................................................................................................................... 53 Appendices
Appendix 1. Data Collection Instruments Appendix 2. Analysis Support Documents Matrix Appendix 3. Council on Health System Development ED Use Workgroup

Emergency Department Use
EXECUTIVE SUMMARY
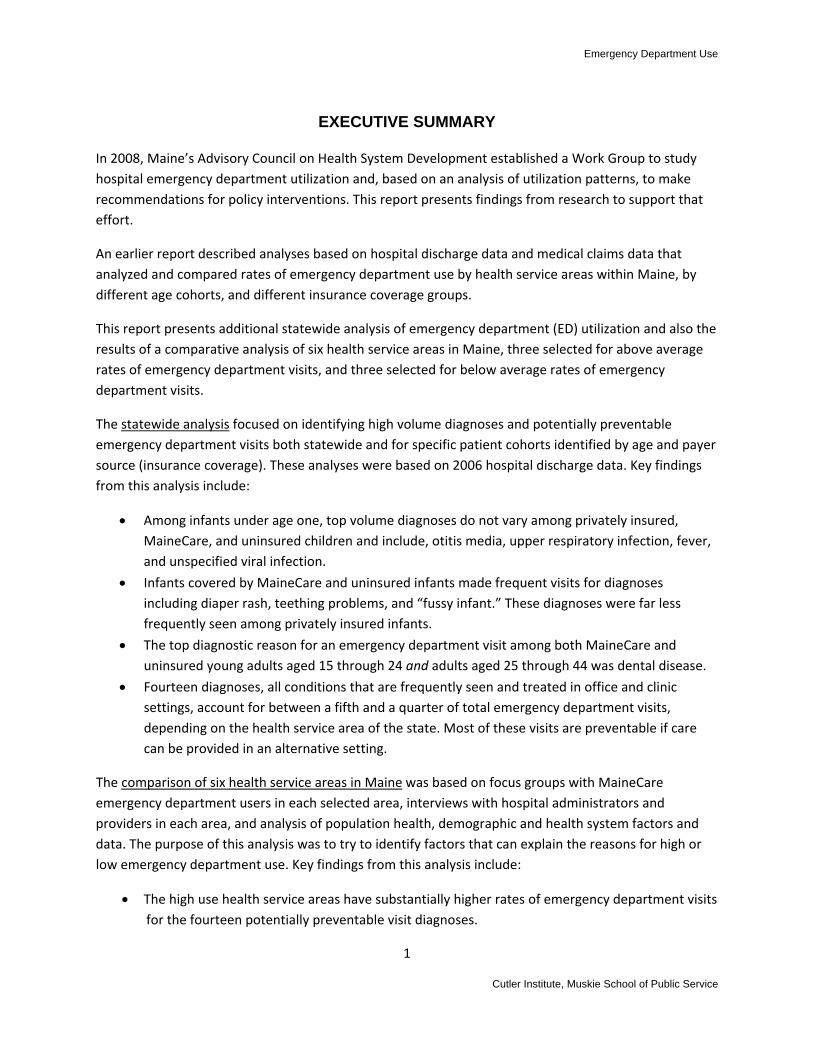
In 2008, Maine’s Advisory Council on Health System Development established a Work Group to study hospital emergency department utilization and, based on an analysis of utilization patterns, to make recommendations for policy interventions. This report presents findings from research to support that effort.
An earlier report described analyses based on hospital discharge data and medical claims data that analyzed and compared rates of emergency department use by health service areas within Maine, by different age cohorts, and different insurance coverage groups.
This report presents additional statewide analysis of emergency department (ED) utilization and also the results of a comparative analysis of six health service areas in Maine, three selected for above average rates of emergency department visits, and three selected for below average rates of emergency department visits.
The statewide analysis focused on identifying high volume diagnoses and potentially preventable emergency department visits both statewide and for specific patient cohorts identified by age and payer source (insurance coverage). These analyses were based on 2006 hospital discharge data. Key findings from this analysis include:
• Among infants under age one, top volume diagnoses do not vary among privately insured, MaineCare, and uninsured children and include, otitis media, upper respiratory infection, fever, and unspecified viral infection.
• Infants covered by MaineCare and uninsured infants made frequent visits for diagnoses including diaper rash, teething problems, and “fussy infant.” These diagnoses were far less frequently seen among privately insured infants.
• The top diagnostic reason for an emergency department visit among both MaineCare and uninsured young adults aged 15 through 24 and adults aged 25 through 44 was dental disease.
• Fourteen diagnoses, all conditions that are frequently seen and treated in office and clinic settings, account for between a fifth and a quarter of total emergency department visits, depending on the health service area of the state. Most of these visits are preventable if care can be provided in an alternative setting.
The comparison of six health service areas in Maine was based on focus groups with MaineCare emergency department users in each selected area, interviews with hospital administrators and providers in each area, and analysis of population health, demographic and health system factors and data. The purpose of this analysis was to try to identify factors that can explain the reasons for high or low emergency department use. Key findings from this analysis include:
• The high use health service areas have substantially higher rates of emergency department visits for the fourteen potentially preventable visit diagnoses.
1
Cutler Institute, Muskie School of Public Service

Emergency Department Use
2
Cutler Institute, Muskie School of Public Service
• A larger percent of the populations in the high use areas use the emergency department than in the low use areas.
• There was no discernable pattern associating high or low ED use with poverty rates, mortality rates, prevalence of health risk factors or chronic disease, or insurance status.
• While there is a statistically valid correlation between high and low emergency department use rates and physician to population ratios, there are many exceptions to the pattern. In addition, almost all providers interviewed stated that trends over time have been toward higher provider ratios at the same time that ED use has increased rapidly. Thus provider shortages cannot be implicated directly in driving high emergency department use.
• Health system factors that appear to mitigate emergency department visit rates include: availability of walk‐in clinics, reserving slots in primary care practices for same day appointments, and availability of after‐hours medical advice and triage.
• Patients who make emergency department visits complain of long waits for medical appointments, high physician turnover (in rural high use areas), difficulty taking time from work for medical appointments, and the inefficiency inherent in going one place for an appointment and another for diagnostic testing or treatment.
The comparative analysis, particularly interviews with providers, indicated that the problems encouraging emergency department use are endemic and the differences between high and low use areas are a matter of degree rather than absolutes.
Based on a synthesis of findings from the various analyses undertaken, the report identifies eight areas to be considered for policy interventions. These areas are:
• Reimbursement: current reimbursement systems reward high utilization and provide no incentives for providers to work to reduce ED use.
• Lack of sufficient service availability for same day, urgent care needs.
• Lack of sufficient service availability for medical advice and consultation in evenings and on weekends.
• Poor patient understanding of the importance of a functional provider/patient relationship and preventive health.
• Poor access for both preventive and acute dental care needs.
• Medication management: insufficient access to medical records and insufficient use of central drug use data banks hinder the ability of providers to assure patient safety and detect patient substance abuse.
• EMTALA: determining the extent to which federal “anti‐patient‐dumping” laws constrain treatment options and billing options at hospitals.
• MaineCare primary care case management program: the high rate of ED use by MaineCare enrollees indicate that the PCCM program is not meeting the goals of providing care management for some individuals in the program.
Emergency Department Use
I. INTRODUCTION
Maine’s Advisory Council on Health System Development was given a charge by the legislature in 2008 to study rising health care costs in the State of Maine, determine cost drivers, and make recommendations to the legislature on policy interventions that might mitigate the rate of increase in health care spending. In response to this charge, the Council established a Work Group to study hospital emergency department (ED) utilization and, based on an analysis of ED utilization patterns, to make recommendations for policy interventions to improve efficiency and quality of care in emergency department services in Maine. A list of members of the Workgroup is included in Appendix 3. This report presents findings from the second phase of a study intended to inform the development of policy recommendations by the Work Group and the Advisory Council on Health System Development. The analyses included in this report were conducted by the Cutler Institute of the Muskie School of Public Service and Onpoint Health Data. This work was supported jointly by a grant from the Maine Health Access Foundation and a Cooperative Agreement with Maine’s Department of Human Services.
The first phase of this study used hospital discharge data and insurance claims data to profile patterns of emergency department use and uncover differences in ED use associated with different age cohorts, health service areas, and insurance coverage groups in Maine. These findings are presented in a separate report (Kilbreth et al, 2009). Among the key findings from phase one were:
• Maine’s emergency department use in 2006 was, in aggregate, about 30 percent higher than the national average.
• Maine’s rate of use in every age cohort was higher than the national average. The age groups where Maine’s experience was most disproportionate compared to national norms was among 5 to 14 year olds and 15 to 25 year olds.
• Use of emergency department care by MaineCare members in 2006 was substantially higher than privately insured residents. A higher rate of admissions resulting from emergency department visits among MaineCare members suggested a higher level of morbidity in this population. However, the high percentage of MaineCare members using the emergency department for at least one visit suggests that other factors contribute to ED use by this population.
• The rate of emergency department use varies substantially by health service area in Maine, with the highest use area having a rate almost 90 percent above the state average and the lowest use area having a rate 26 percent below the state average. High use areas are found in both urban and rural locations. In high use areas, ED visit rates are higher for both privately insured and MaineCare populations, suggesting causal factors that affect the entire population. However, having a high concentration of MaineCare residents also contributes to raising the average rate of a health service area.
3
Cutler Institute, Muskie School of Public Service

Emergency Department Use
4
Cutler Institute, Muskie School of Public Service
The purpose of the phase two analyses presented in this report was to determine, to the extent possible, the reasons for different rates of use revealed in the study’s phase one by examining emergency department use patterns of specific age and health coverage cohorts and of specific health service areas. The ED study group selected three health service areas in Maine with per capita ED use rates higher than Maine’s average rate, and three health service areas with ED use rates lower than the average. In each of these areas, research staff have gathered the following information:
• Area profiles of disease prevalence, age distribution, income distribution, and employment.
• Health Service Area‐specific emergency department use data based on further analysis of hospital discharge data.
• Area profiles of numbers of primary care providers, dentists, and selective information on physician practice hours of operation, scheduling protocols, and after hours policies.
• Interview data from hospital administrators and emergency department clinical providers providing information on hospital policies as well as hospital and provider perspectives on use patterns and utilization drivers.
• Interview data from community‐based primary care physicians providing a physician perspective on use patterns and utilization drivers.
• Focus groups with participants in the MaineCare program who have made at least two Emergency department visits in the past year, to gain a patient perspective on reasons for ED use.
In addition to the comparative study of the six health service areas, this study includes three additional statewide analyses based on hospital discharge data. These analyses are: a review of per capita rates of certain potentially preventable ED visits within each health service area in the state; a review of the most frequently seen diagnoses by specific age/insurance cohorts; and an analysis of the correlation, statewide, of the primary care physician‐to‐population ratio and ED use rates.1
Section II describes the study methods. Section III of the report presents the findings from the new statewide data analyses. Section IV presents the comparative analyses of the six selected health service areas, based on hospital discharge data and secondary data collection. Section V summarizes findings from the focus groups with MaineCare emergency department users. Section VI presents an analysis of health system characteristics associated with high and low emergency department use, based on the study of six health service areas. Section VII presents an analysis of patient characteristics that contribute to high emergency department use, based on the focus groups with MaineCare emergency department users and interviews with providers. In Section VIII, we present options for consideration for policy changes targeted to reducing potentially avoidable emergency department visits.
1 The correlation analysis is presented courtesy of the Maine Health Quality Forum which assembled the necessary physician data and conducted the correlation analysis.

Emergency Department Use
II. STUDY METHODS
The purpose of this study was to analyze factors that may contribute to high rates of use of hospital emergency departments in Maine. The study builds on prior analysis using hospital discharge data and insurance claims data to describe patterns of emergency department use in the state.
The basic framework for the study was a comparative analysis of six Maine health service areas (HSAs) – three selected for emergency department use rates that were above the state average rate in 2006 and three selected for below average use rates. In addition, some analyses were conducted looking at the emergency department use of specific age cohorts and insurance coverage cohorts to better understand use patterns that contribute to high ED use.
This study made use of multiple data sources including: interviews with hospital administrators, emergency department providers, and community providers; focus groups with MaineCare enrollees; analysis of hospital discharge data; and collection and analysis of population health and demographic data on a county and health service area specific basis. Each of the data sources and methods of analysis is described below.
Hospital Discharge Data
Maine Health Data Organization (MHDO) hospital reports provide information on all emergency department visits for all users of Maine hospitals including uninsured, Medicare, Medicaid, privately insured and self‐pay patients. We analyzed data for the year 2006 because our earlier analysis of Maine hospital experience used 2006 data. In order for the analyses in this report to build a more complete picture of ED use on a health service area specific basis, or an age‐cohort specific basis, it was important to maintain continuity of the data. Otherwise, it would be difficult to determine whether differences found in the present analysis derived from changes over time or from new variations in utilization not discerned in the earlier analyses.
Hospital discharge analyses were restricted to residents of Maine. Visits to Maine hospitals by residents of other states or countries were not included. Conversely, we did not have access to data for visits made by Maine residents to hospitals out of state.
Emergency Department visits were tabulated by age group, gender, Hospital Service Area (HSA) and source of payment defined as follows:
• Hospital Service Area There are 32 hospital service areas in Maine comprised of the towns surrounding a hospital location where the plurality of residents’ care is received at that hospital. When two hospitals are located in the same town or city, they share a service area.
• Source of Payment The expected source of payment coding available on the hospital discharge records can be aggregated into five groups as follows: Medicare, Medicaid, privately insured, uninsured, and
5
Cutler Institute, Muskie School of Public Service

Emergency Department Use
other. In this report, emergency department use is reported for the three groups: Medicaid, privately insured, and uninsured.
• Emergency Department Visit Emergency department visits were identified using standard coding systems for hospital billing: Uniform Billing (UB) Revenue Codes or CPT codes (Current Procedural Terminology). Both of these systems include multiple codes that refer to emergency department care. The comprehensive list of codes applied in this study follows the system developed by the National Committee for Quality Assurance (NCQA) Health Effectiveness Data Information Set (HEDIS). This method assured that this study’s findings with regard to Maine can be compared to national studies of ED use. Outpatient emergency department visits that did not result in a hospitalization and visits that resulted in a hospitalization are reported separately. Throughout the report, when the term “outpatient emergency department (ED) visit is used, the data exclude visits that result in a hospital admission.
• Diagnosis The clinical diagnosis associated with each ED visit was assigned using the ICD‐9‐CM (International Classification of Diseases, Ninth Revision) code available on the hospital discharge data and administrative claims.
• Frequent Users Frequent users are defined as individuals who make four or more visits to an emergency department over the course of a year.
Analysis Methodology
The hospital discharge data is used in four types of analyses: determining population rates of emergency department visits; determining the proportion of visits attributable to high users and the proportion of visits that result in a hospital admission; measuring the proportion of visits attributable to certain diagnoses selected because they are conditions that are likely to be treatable in office or clinic settings; identifying high volume diagnoses for specific age and payer group cohorts and health service areas.
Rates of Use
Rates of use are calculated as the number of ED visits generated by a given population divided by the number of people included in the population. Rates are presented in terms of the number of ED visits for every 1000 persons. In order to calculate rates, it is necessary to have a count of the total people included in the population. We are not able to calculate rates for uninsured people in Maine because we do not have an exact count of the number of uninsured. Similarly, while we have total population counts by health service area (HSA), we do not have counts of individuals who fall into particular age groups or
6
Cutler Institute, Muskie School of Public Service

Emergency Department Use
coverage groups and thus can provide overall use rates for HSAs but not for specific age cohorts or sub‐groups within HSAs.
Proportions of High Users and Admissions
Admission rates for specific ED users are calculated by adding total outpatient ED visits and visits that result in an admission for the population of interest to arrive at the total visit count, and then calculating the percent of total visits that resulted in an admission. The proportion of high users is calculated by developing a count of all individuals in the population of interest with four or more ED visits within a year and then calculating that number as a percent of total users within the population.
Potentially Preventable Visit Diagnoses
Fourteen diagnoses were selected that consist of conditions that likely are treatable in a non‐hospital or office‐based setting and thus may be preventable emergency department visits. The criteria for selection of the included conditions were: 1) matching diagnostic codes of conditions seen frequently both in hospital emergency departments and in primary care settings; 2) eliminating any diagnoses that, when seen in an emergency department, result in the patient being admitted more than 5 percent of the time; 3) a review of the list of diagnoses generated through this process by clinicians with emergency department experience and selection by the clinicians of a sub‐set of conditions that, based on their clinical judgment, met the criterion of usually being an avoidable ED visit.
The clustering of these fourteen diagnoses into a single category is not intended to provide a comprehensive inventory of all potentially preventable visits but rather to create a uniform subset of frequently seen diagnoses that constitute a substantial portion of overall ED use and where the likelihood is that most of these visits could have occurred in an alternative care setting. The uniform category provides a basis for comparing ED utilization across different health service areas and population groups.
We calculated rates of use for the category of potentially preventable visits by counting total visits of the included diagnoses and dividing the number in the total population by the number of visits. We calculated the proportionate distribution of the selected potentially preventable visits by calculating the total number of potentially preventable visits as a percent of total visits.
High Volume Visits
Using 2006 hospital discharge data, total statewide emergency department visits were ranked in order of frequency and lists generated of the 30 diagnoses with the highest volume seen within each group and each insurance category. Some diagnoses were combined to create broader diagnostic categories. For example, all visits related to dental disease (Disorder of teeth and supporting structure, periapical abscess, apical periodontitis, and dental caries) were combined into a single diagnostic category of dental disease. “Headache” and “migraine” were combined, “abdominal pain, unspecified site” and “abdominal pain other specified site” were combined, and “lumbago” was combined with “lumbar strain and sprain.”
7
Cutler Institute, Muskie School of Public Service

Emergency Department Use
Focus Groups
Focus groups with MaineCare members were conducted in each of the study’s six health service areas to gain an understanding of member attitudes about receiving care in emergency departments and the barriers that prevent them from getting care in other settings such as family practices and health centers. Focus group participants were recruited by telephone from lists of enrollees who had made at least two emergency department visits within the last twelve months. Five focus groups included adults who had used emergency departments for their own health care needs and/or those of their children. One focus group conducted in Bangor was made up of parents who had taken a child age 4 or under for treatment at an emergency department. In addition, a seventh focus group of MaineCare individuals with behavioral health diagnoses was held in the Portland. Volunteers for this focus group were recruited with the assistance of staff at the Amistad Peer Support and Recovery Center.
Seventy‐two people were recruited to attend one of the 6 focus groups and 32 participated. Participants were provided with $50 grocery store gift certificates as tokens of appreciation for their time and insights. Initial recruitment was done at least a week prior to the scheduled time. Reminder phone calls were made to individuals the day before the scheduled event.
All participants were informed of the purpose of the study and signed informed consent statements agreeing to participate. Sessions were tape recorded and the tapes transcribed for analysis. The same semi‐structured interview format and questions were used at each focus group. The interview protocol is included in Appendix 1.
The transcripts of the focus groups were analyzed to identify common themes and areas of difference. The content was analyzed to identify any patterns that were associated with high and low use health service areas and any patterns associated with urban and rural health service areas.
Provider Interviews
Research staff conducted interviews with thirty providers and hospital administrators in the six health services areas of the study. Interviews included, at a minimum, the Chief of the Emergency Department and the Nurse Director or Manager of the ED at each of the eight hospitals included in the study. In addition, community‐based primary care providers were contacted in each health service area. An effort was made to include provider representatives of both federally qualified health centers and primary care practices owned by hospitals. Interviews were conducted by telephone and were one‐on‐one with the research interviewer. All participants were asked a uniform set of questions (interview protocol included in Appendix 1.).
In addition to the interviews with providers, research staff contacted the office staff of a sample of community‐based practices in each of the study health service areas, including hospital‐owned physician practices, private practices, and federally qualified health centers, to obtain information on practice hours, policies with regard to scheduling same day appointments or urgent visits, and after hours coverage.
8
Cutler Institute, Muskie School of Public Service

Emergency Department Use
The information from the interviews was summarized in matrices highlighting similarities and differences between high use and low use HSAs and examined for patterns associated with urban or rural location. A summary case study of each HSA was developed. Synthesized findings are presented in the report.
Population and Health Services Characteristics Data for Six Health Service Areas
Using U.S. Census, state Labor Department, and health department data, project staff collected demographic information for each of the study sites including: population density; age distribution; and percent of population in poverty; unemployment rates; and health insurance status. Population health characteristics included in the analysis were: overall age‐adjusted mortality rates and mortality due to various diseases; leading causes of death; and the prevalence of various chronic diseases and behavioral risk factors.
Data on primary care provider to population ratios were provided by the Maine Quality Forum based on data tabulated by the Maine Medical Association from Maine’s Bureau of Licensure. Where possible, information was collected on whether the providers treat MaineCare patients and whether or not their practice is open to new MaineCare patients. We also determined the number of federally qualified health centers and school‐based health centers within each study area. Information on dentists was collected from the Maine Office of Data, Research and Vital Statistics and the Maine Dental Association.
Much of the data is available only for counties or the state as a whole. Several of the health service areas study sites are not contiguous with the state’s county boundaries. They cross county boundaries and embrace only portions of some counties. In cases where health service areas encompass more than one county, statistics were collected for both counties that fall within a health service area.
Matrices of summary secondary data were developed allowing comparison of high use and low use HSAs and urban and rural HSAs. Full matrices, together with data source are included in Appendix 2. Summary findings are presented in the report.
9
Cutler Institute, Muskie School of Public Service

Emergency Department Use
10
Cutler Institute, Muskie School of Public Service

Emergency Department Use
III. FINDINGS FROM ANALYSES OF STATEWIDE EMERGENCY DEPARTMENT USE
Frequent Diagnoses Among Selected Age and Health Coverage Cohorts
Prior analysis of emergency department use in Maine has shown that Maine’s overall rate of emergency department visits is about 30 percent above the national rate of use. In addition, emergency department use within selected age groups is high by national standards (Kilbreth, et al. 2009). In order to better understand some of the factors that contribute to unusually high use by particular age groups, the project research team reviewed the patient complaints that generate the highest volume of emergency department visits by specific age cohorts of privately insured, MaineCare insured, and uninsured patients. We further compared the high volume diagnoses of frequent emergency department (ED) users with individuals in the same age cohorts who made fewer visits. Frequent users were defined as individuals with four or more ED visits within a twelve month period. The age cohorts, selected by the ED Use Work Group, are infants below the age of one, young adults between the ages of 15 and 24, and adults between the ages of 25 and 44.
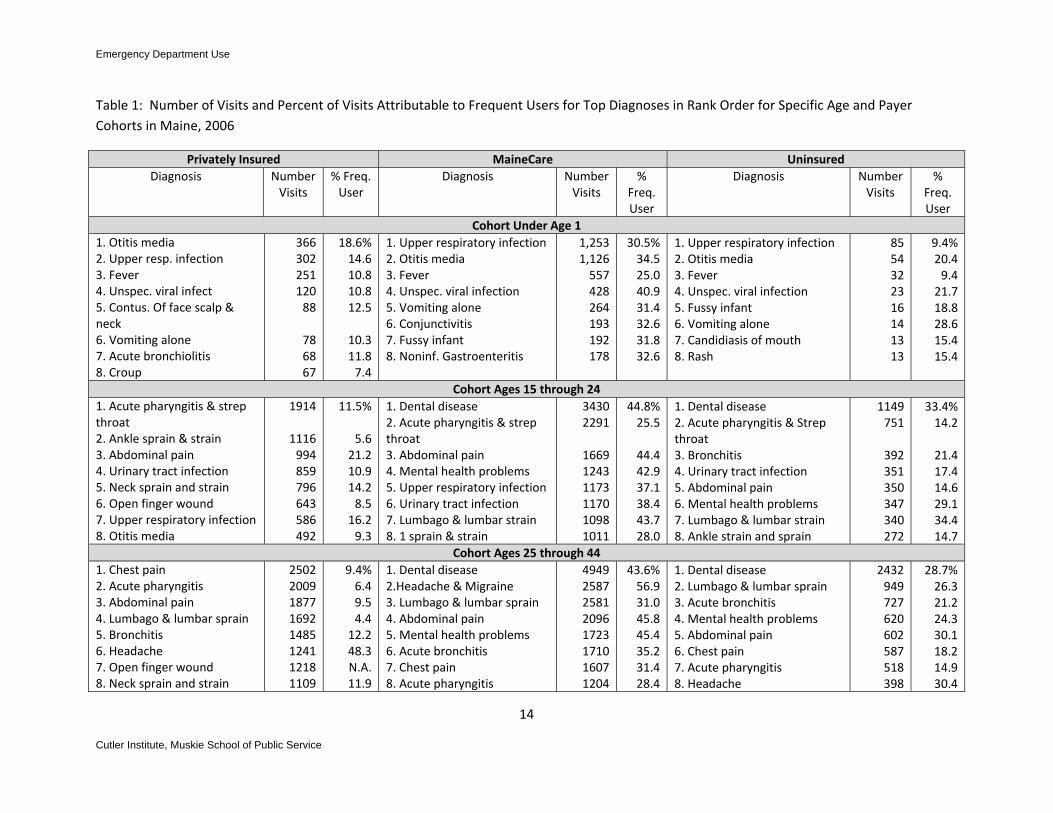
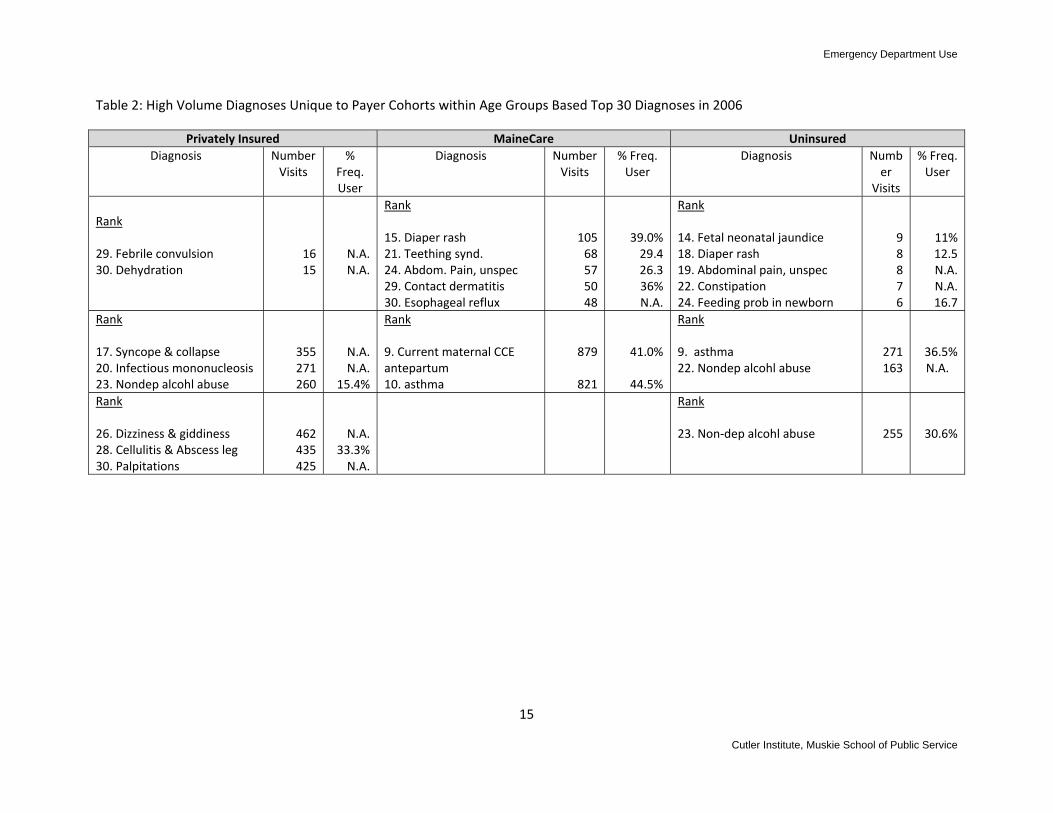
Table 1 compares the top eight diagnoses for each cohort of interest. (A rank order list of 30 highest volume diagnoses for each age and coverage cohort is included in Appendix 2.) Table 2 highlights differences in the most frequently seen diagnoses between Medicaid, privately insured, and uninsured populations within the same age cohorts.
Diagnostic Patterns among Infants
Among infants, the same four diagnoses – otitis media, upper respiratory infection, fever and unspecified viral infections – were responsible for generating the largest number of visits in all three insurance coverage categories. Although the MaineCare program covers about one in four children in the state, in 2006 MaineCare‐covered children generated about three times as many visits for these four diagnoses as did privately insured children. All four of these illnesses can vary in severity from mild, non‐threatening conditions to serious and even life‐threatening illnesses. It is not possible to ascertain definitively whether the larger volume of visits among MaineCare‐covered children arose from a higher incidence of serious illness in this population or a greater propensity to bring a baby in for evaluation and treatment for mild illness. However, in each insurance category, fewer than 2 percent of the infants’ emergency department visits for these four diagnoses resulted in an admission, suggesting that many of the visits in all insurance cohorts were for less severe cases and that the higher volume in the MaineCare population arose from more visits for non‐severe illness. In the MaineCare population, a substantially higher proportion of the visits in all the highest volume diagnoses were generated by high users. This difference between the MaineCare and the privately insured and uninsured suggests that some of the difference in rates of use within this age cohort can be attributable to a subset of the total MaineCare population who turned to the emergency department repeatedly for care or evaluation of their infants.
For the diagnoses ranked below the top four, numbers of visits dropped off fairly precipitously. A number of differences emerged among visits from privately insured infants in comparison to visits from
11
Cutler Institute, Muskie School of Public Service

Emergency Department Use
MaineCare infants and uninsured infants. Among the most frequently seen diagnoses for MaineCare and uninsured infants were “fussy infant” (7th most frequent reason for a visit among MaineCare babies), diaper rash (15th for MaineCare and 18th among the uninsured) teething syndrome (21st for MaineCare) and feeding problems in newborn (24th among uninsured babies) (Table 2). These diagnoses did not appear among the top 30 among privately insured infants. The disparity suggests that MaineCare and uninsured families utilize the emergency department for primary care at a higher rate than privately insured families, either because of financial or structural barriers to primary care in settings other than the emergency department or because of insufficient education in home care for infants and appropriate triggers for emergency visits.
Diagnostic Patterns among Individuals Aged 15 through 24
Among young adults, disparities in patterns of emergency department use by insurance status are immediately apparent. The top diagnostic reason for visits to the ED among both MaineCare enrollees and the uninsured in 2006 was dental disease. MaineCare enrollees in this age group made more than 3400 emergency department visits for complaints ranging from tooth decay to periapical abscess and apical periodontitis. Forty‐five percent of visits for dental complaints by MaineCare participants were made by frequent ED users.2 Among the uninsured, a third of dental visits were generated by frequent users. Although we do not know whether the repeat use among those who presented at the ED with dental disease was for dental care in each instance or for other medical problems, it is apparent that unmet dental care needs among ED users is associated with frequent visits. Also prevalent among MaineCare recipients and the uninsured and less so among the privately insured, were emergency department visits for mental health problems, specifically, depression and anxiety. Taken together, these two diagnoses constituted the fourth most frequent reason for an ED visit among MaineCare enrollees in this age group and the 6th most frequent among uninsured young adults. Among privately insured young adults, depressive disorders ranked as the 13th most frequently seen diagnosis while anxiety was not among the top 30 diagnoses. Among MaineCare enrollees, 43 percent of visits related to mental health diagnoses were generated by individuals making more than four visits in a year. Among uninsured young adults, 29 percent of mental health visits were generated by frequent users. High volume diagnoses shared by all young adults regardless of coverage status were acute pharyngitis, abdominal pain, and ankle sprains and strains.
Asthma is a frequently seen diagnosis among MaineCare and uninsured young adults (ranked 9th and 10th), but is not listed among the top 30 diagnoses for their privately insured counterparts (Table 2). Care for complications of pregnancy is the 9th most frequent diagnosis among MaineCare enrollees in this age group – a diagnosis that does not appear among the top 30 for the other cohorts of young adults. Visits for treatment of nondependent alcohol abuse were frequent among the privately insured and the uninsured (ranked 22nd and 23rd) but not among MaineCare enrollees of this age.
12
2 Dental care is a covered benefit under MaineCare for children up through age 20. MaineCare adults do not have coverage for dental benefits, except tooth extraction.
Cutler Institute, Muskie School of Public Service

Emergency Department Use
13
Cutler Institute, Muskie School of Public Service
Diagnostic Patterns among Adults Aged 25 through 44
Disparities in patterns of emergency department use similar to those among younger adults are seen in the cohort of adults aged 25 through 44. While chest pain was the top ranked diagnosis among privately insured adults, ED visits for dental disease far outranked all others among both MaineCare enrollees and the uninsured. As with the younger adults, about 4 in 10 dental visits among MaineCare enrollees and 3 in 10 among the uninsured were generated by frequent users. Among MaineCare recipients, close to 5000 visits were made for dental complaints in 2006. The next most frequent diagnosis treated in this cohort, lumbago and lumbar strain, generated a little over 2500 visits. Among uninsured adults, over 2400 visits related to dental pain and disease were made compared to about 950 for lumbago, the second ranked diagnosis. Visits for treatment of anxiety and depression were the fourth most frequent diagnostic category among both MaineCare and uninsured adults. Neither dental disease nor mental health problems were among the top 30 diagnoses for privately insured adults.
Except for the high prevalence of mental health and dental complaints among two of the three adult cohorts, the high volume diagnoses among all the adult groups were similar. All three groups included chest pain, acute pharyngitis, abdominal pain, bronchitis, and headache among the top eight reasons for ED visits. Uninsured adults were the only group where treatment for alcohol abuse was among the top 30 diagnoses.
Discussion
The review of high volume diagnoses among specific age and coverage groups suggest that Maine’s unusually high ED use rates among young age cohorts are driven by a high volume of potentially preventable visits. Three situations are particularly noteworthy. The prevalence of dental emergencies suggests severe barriers to office‐based dental care. Lack of insurance coverage for adults (including many with private health insurance) may impose substantial financial barriers for many Maine adults. In addition, workforce shortages may contribute to the problem. A high incidence of mental health visits among MaineCare and uninsured adults suggests undiagnosed or inadequately treated illness – or both. Finally, the frequency with which MaineCare‐enrolled and uninsured infants are treated in emergency departments for conditions such as diaper rash, usually treated in a pediatrician’s or family practice office, merits additional investigation. For uninsured families, financial barriers to office‐based pediatric care may encourage ED use. For MaineCare recipients, barriers might arise from lack of established relationships with providers, from inability to get timely appointments, from transportation difficulties or lack of clarity on the part of parents on the appropriate use of emergency departments. These questions were explored with MaineCare enrollees and a discussion of these issues is presented in Section V of this report.
Emergency Department Use
Table 1: Number of Visits and Percent of Visits Attributable to Frequent Users for Top Diagnoses in Rank Order for Specific Age and Payer Cohorts in Maine, 2006
Privately Insured MaineCare UninsuredDiagnosis Number
Visits % Freq. User
Diagnosis Number Visits
% Freq. User
Diagnosis NumberVisits
% Freq. User
Cohort Under Age 11. Otitis media 2. Upper resp. infection 3. Fever 4. Unspec. viral infect 5. Contus. Of face scalp & neck 6. Vomiting alone 7. Acute bronchiolitis 8. Croup
366 302 251 120 88
78 68 67
18.6%14.610.810.812.5
10.311.87.4
1. Upper respiratory infection2. Otitis media 3. Fever 4. Unspec. viral infection 5. Vomiting alone 6. Conjunctivitis 7. Fussy infant 8. Noninf. Gastroenteritis
1,253 1,126 557 428 264 193 192 178
30.5%34.525.040.931.432.631.832.6
1. Upper respiratory infection2. Otitis media 3. Fever 4. Unspec. viral infection 5. Fussy infant 6. Vomiting alone 7. Candidiasis of mouth 8. Rash
8554322316141313
9.4%20.49.421.718.828.615.415.4
Cohort Ages 15 through 241. Acute pharyngitis & strep throat 2. Ankle sprain & strain 3. Abdominal pain 4. Urinary tract infection 5. Neck sprain and strain 6. Open finger wound 7. Upper respiratory infection 8. Otitis media
1914
1116 994 859 796 643 586 492
11.5%
5.621.210.914.28.516.29.3
1. Dental disease2. Acute pharyngitis & strep throat 3. Abdominal pain 4. Mental health problems 5. Upper respiratory infection 6. Urinary tract infection 7. Lumbago & lumbar strain 8. 1 sprain & strain
3430 2291
1669 1243 1173 1170 1098 1011
44.8%25.5
44.442.937.138.443.728.0
1. Dental disease2. Acute pharyngitis & Strep throat 3. Bronchitis 4. Urinary tract infection 5. Abdominal pain 6. Mental health problems 7. Lumbago & lumbar strain 8. Ankle strain and sprain
1149751
392351350347340272
33.4%14.2
21.417.414.629.134.414.7
Cohort Ages 25 through 441. Chest pain 2. Acute pharyngitis 3. Abdominal pain 4. Lumbago & lumbar sprain 5. Bronchitis 6. Headache 7. Open finger wound 8. Neck sprain and strain
2502 2009 1877 1692 1485 1241 1218 1109
9.4%6.49.54.412.248.3N.A.11.9
1. Dental disease2.Headache & Migraine 3. Lumbago & lumbar sprain 4. Abdominal pain 5. Mental health problems 6. Acute bronchitis 7. Chest pain 8. Acute pharyngitis
4949 2587 2581 2096 1723 1710 1607 1204
43.6%56.931.045.845.435.231.428.4
1. Dental disease2. Lumbago & lumbar sprain 3. Acute bronchitis 4. Mental health problems 5. Abdominal pain 6. Chest pain 7. Acute pharyngitis 8. Headache
2432949727620602587518398
28.7%26.321.224.330.118.214.930.4
14
Cutler Institute, Muskie School of Public Service
Emergency Department Use
Table 2: High Volume Diagnoses Unique to Payer Cohorts within Age Groups Based Top 30 Diagnoses in 2006
Privately Insured MaineCare UninsuredDiagnosis Number
Visits %
Freq. User
Diagnosis NumberVisits
% Freq. User
Diagnosis Number
Visits
% Freq. User
Rank 29. Febrile convulsion 30. Dehydration
16 15
N.A.N.A.
Rank 15. Diaper rash 21. Teething synd. 24. Abdom. Pain, unspec 29. Contact dermatitis 30. Esophageal reflux
10568575048
39.0%29.426.336%N.A.
Rank 14. Fetal neonatal jaundice 18. Diaper rash 19. Abdominal pain, unspec 22. Constipation 24. Feeding prob in newborn
98876
11%12.5N.A.N.A.16.7
Rank 17. Syncope & collapse 20. Infectious mononucleosis 23. Nondep alcohl abuse
355 271 260
N.A.N.A.
15.4%
Rank 9. Current maternal CCE antepartum 10. asthma
879
821
41.0%
44.5%
Rank 9. asthma 22. Nondep alcohl abuse
271163
36.5%N.A.
Rank 26. Dizziness & giddiness 28. Cellulitis & Abscess leg 30. Palpitations
462 435 425
N.A.33.3%N.A.
Rank 23. Non‐dep alcohl abuse 255 30.6%
15
Cutler Institute, Muskie School of Public Service

Emergency Department Use
Potentially Preventable Emergency Department Visits
In this section, we present information for all Maine Health Service Areas (HSAs) on a uniform sub‐set of emergency department visits. The selected diagnoses consist of conditions that likely were treatable in a non‐hospital or office‐based setting and thus may have been preventable. The criteria for selection of the included conditions were: 1) matching diagnostic codes of conditions seen frequently both in hospital emergency departments and in primary care settings; 2) eliminating any diagnoses that, when seen in an emergency department, result in the patient being admitted more than 5 percent of the time; 3) a review of the list of diagnoses generated through this process by clinicians with emergency department experience and selection by the clinicians of a sub‐set of conditions that, based on their clinical judgment, met the criterion of usually being an avoidable ED visit.3 The fourteen conditions included in the category of potentially avoidable visits are shown below.
Potentially avoidable ED visits
Sore Throat
Viral infection (unspecified)
Anxiety (unspecified or generalized)
Conjunctivitis (acute or unspecified)
External and middle ear infection (acute or unspecified)
Upper Respiratory infections (acute or unspecified)
Bronchitis (acute or unspecified)
Asthma
Dermatitis and rash
Joint pain
Lower and unspecified back pain
Muscle and soft tissue limb pain
Fatigue
Headache
Analysis of the selected cluster of diagnoses provides a window – albeit an imperfect one – for comparing utilization patterns by different populations and different health service areas. The diagnostic information that is available on hospital discharge records and insurance claims data is insufficient to determine whether a particular episode of care required emergency department treatment. Some conditions that are treatable in a physician’s office during the day might appropriately require emergency department care if an exacerbation occurs in the middle of the night. Some conditions which, after assessment, are determined to need minimal treatment might have required diagnostic testing available in a hospital in order to eliminate the possibility of a more serious injury or illness. Thus visits grouped using the selected diagnosis codes may include some visits that were not avoidable. Conversely, many visits with diagnoses not included on our list may be avoidable. However, because the conditions included in the selected diagnostic cluster are high volume and are usually treatable in an office setting, in aggregate, they provide a measure of a portion of ED use that might be transferable to alternative care settings and they provide a uniform basis for comparing differences in ED use by health service area and by different population groups.
3 This methodology was developed by Onpoint Health Data in collaboration with New Hampshire’s Office of Medical Assistance. The conditions selected for analysis in New Hampshire were used for the Maine analysis with one exception. New Hampshire’s avoidable visit condition list included abdominal pain. This condition was eliminated from the Maine list of potentially avoidable visits.
16
Cutler Institute, Muskie School of Public Service

Emergency Department Use
17
Cutler Institute, Muskie School of Public Service
Use Rates for Potentially Avoidable Visits by Hospital Service Area
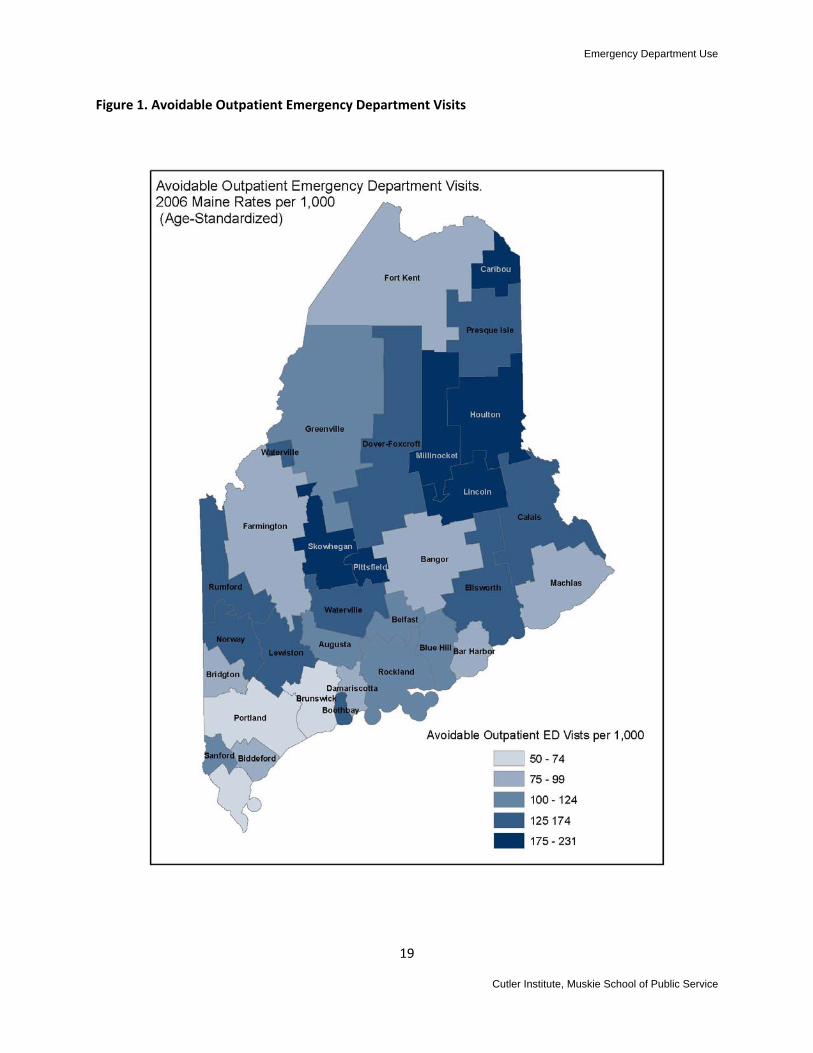
Table 3 shows the age‐standardized rate of visits per 1000 population for the selected group of potentially avoidable ED visits for each health service area in the state as well as the rate of use for all ED visits. The population rates of use for this cluster of visits vary more than three‐fold from the highest use HSA to the lowest. This is a higher rate of geographic variability than is seen for ED use inclusive of all visits – where the highest use rate is about 2.5 times the lowest – suggesting there is more variability in rates of potentially preventable visits than in visits for true emergency care. The selected cluster of potentially preventable visits also varies substantially as a proportion of overall ED use in different health service areas. Table 3 shows that in Caribou, which has the highest overall ED visit rate, the selected cluster of potentially preventable visits makes up more than 25 percent of total outpatient ED volume. By contrast, in two general service hospitals with among the lowest overall ED use rates, Bar Harbor and Midcoast, the cluster of potentially preventable visits constitute 16 percent and 18 percent, respectively, of overall use.4
The strong correlation between health service areas with high overall ED use rates and those with a high proportion of potentially preventable visits suggests that strategies undertaken to provide alternative care settings for potentially preventable visits could successfully bring ED use rates in high use areas closer to the norm in Maine.
Figure 1 shows that, while the highest use rate for the cluster of potentially preventable ED visits tend to be in rural areas, this relationship is not uniform. Caribou, for example, has the highest use rate for the selected diagnoses in Maine, while neighboring Fort Kent is below the state average.
4 HSAs with low ED use community hospitals were selected for this comparison rather than Portland or Bangor (both of which have very low population ED use rates) because Portland and Bangor house tertiary care hospitals and are major trauma centers and, thus, have a different mix of ED visits that is likely to differ from other hospitals in the state.

Emergency Department Use
Table 3: 2006 Maine Emergency Department Use by Health Service Area: Age‐Standardized ED Use Rates, All ED Visits and Selected Potentially Preventable Diagnoses5
Hospital Service Area
Population Estimate
Total ED Visits Age standardized rate per 1000
Selected PPD Visits Age Standardized rate per 1000
PPD Visits as a percent of Total Visits
Caribou 17,057 905 230 25.4%Millinocket 7,962 786 190 24.2Lincoln 13,108 728 188 25.8Pittsfield 15,386 719 183 25.4Houlton 18,874 721 179 24.8Skowhegan 28,965 762 175 23.0Calais 12,867 765 174 22.7Waterville 72,460 639 159 24.9Rumford 15,816 650 148 22.8Presque Isle 24,828 609 139 22.8Dover‐Foxcroft 19,775 621 139 22.4Ellsworth 25,386 579 134 23.1Norway 24,861 581 129 22.2Lewiston 121,611 571 128 22.4Boothbay 6,281 620 127 20.5Belfast 22,493 585 123 21.0Greenville 2,468 609 120 19.7Rockland 49,355 483 109 22.6Augusta 61,435 487 103 21.1Sanford 35,224 499 101 20.2Blue Hill 11,110 490 100 20.4Machias 16,260 508 95 18.7Damariscotta 12,082 490 93 19.0Bridgton 18,530 458 90 19.7Farmington 33,874 408 90 22.0Fort Kent 14,710 423 86 20.3Biddeford 74,963 423 82 19.4Bangor 131,548 409 81 19.8Bar Harbor 11,402 471 76 16.1Brunswick 74,200 367 68 18.5Portland 265,702 359 68 18.9York6 61,012 272 54 19.9
5 Highlighted HSAs on those included in comparative analysis. See page 21. 6 York area may be low due to border crossing. Data source only includes Maine hospital data.
18
Cutler Institute, Muskie School of Public Service
Emergency Department Use
Figure 1. Avoidable Outpatient Emergency Department Visits
19
Cutler Institute, Muskie School of Public Service

Emergency Department Use
20
Cutler Institute, Muskie School of Public Service

Emergency Department Use
IV. COMPARISON OF SIX MAINE HEALTH SERVICE AREAS
This section of the report presents a comparative analysis of six health service areas in Maine, three selected because they have emergency department use rates above the state average and three selected because their ED use rates are below the state average. Bangor and Lewiston are compared as urban areas with contrasting use rates (Bangor, low and Lewiston, high). Two low use rural areas, Damariscotta and Farmington, and two high use rural areas, Calais and Caribou form the remaining study sites.
Project staff undertook a multi‐method research approach to collect information that might uncover patterns associated with either high or low ED use rate and allow deductions as to factors that contribute to ED use. The research project included: collection and analysis of secondary data on population demographics and health status and health service area characteristics; analysis of age and payer defined subsets of ED users within the selected HSAs; analysis of the most frequently seen ED diagnoses in each HSA; interviews with emergency department administrators and ED and community‐based clinicians in each selected site; and focus groups with MaineCare enrollees at each site who have received emergency department care within the past year.7
ED Use Rates by Age in High and Low Use Health Service Areas
Tables 3 and 4 show the population emergency department use rates in total and across different age cohorts for the six health service area study sites in 2006. Lewiston, in comparison to Bangor experienced about 150 more ED visits per 1000 residents (Table 3). However, the rates of visits resulting in an admission in these two urban areas were the same. The proportion of the population making frequent ED visits (more than four in a year) in Lewiston was more than double the proportion in Bangor. Taken together, these statistics suggest that the higher rate of ED visits in Lewiston, compared to Bangor arises from a combination of a larger number of visits with less urgency and multiple visits from a small proportion of the population. The rate of use in Lewiston is higher in every age group, but the disparity is particularly striking among infants, where the rate of use in Lewiston is 17.5 visits per 1000 infants compared to 2.8 visits in Bangor.
21
7 A sixth data collection effort, an on‐site survey of ED users at each hospital in the selected sites, had to be postponed due to the risk posed to interviewers by the high prevalence of H1N1 virus in the emergency departments in the winter months. This data collection effort will be completed in the spring and the findings released as an addendum to this report.
Cutler Institute, Muskie School of Public Service

Emergency Department Use
22
Cutler Institute, Muskie School of Public Service
Table 3: Comparison of Emergency Department Use Rates by Selected Age Groups, Bangor and Lewiston
Age Group Rate of ED visits per 1000
Rate of ED visits resulting in admission per 1000
Number of Frequent Outpatient ED Users
Frequent Users as a Percent of total Population Age Group Cohort
Bangor Total Lewiston Total
420578
5959
1903 4051
1.4%3.3%
Bangor <1 Lewiston <1
5931105
3649
41 263
2.817.5
Bangor 1‐4 Lewiston 1‐4
473798
1313
74 508
1.49.1
Bangor 15‐24 Lewiston 15‐24
508859
1328
499 1642
2.29.7
Bangor 25‐44 Lewiston 25‐44
507660
2739
788 2005
2.26.0
Bangor 45‐64 Lewiston 45‐64
327394
6459
426 1088
1.23.3
The overall ED visit rates of the two rural, high use areas were about double the rates of the two low use areas in 2006 (Table 4). Calais, one of the high use areas, had a substantially lower rate of visits resulting in a hospital admission than the other study areas, but Caribou, the second high use area, had a higher rate of admission. The proportion of the population who make frequent ED visits is substantially higher in the two high use areas than in the two low use areas.
Calais had a particularly high rate of use among infants under age one in comparison to all the other study areas. Twenty‐seven percent, or more than one in four infants in the area visited the emergency department more than four times over the course of a year. Caribou and Calais, the two high use areas, had higher rates of use in each age cohort and higher proportions of frequent users.
Over all ages, Calais had a low percent of admissions arising from ED visits compared to the other study areas.

Emergency Department Use
Table 4: Comparison of Emergency Department Use Rates by Selected Age Groups, Calais, Caribou, Damariscotta and Farmington
Age Group Rate of ED visits per 1000 Rate of ED visits resulting in admission per 1000
Number of Frequent Outpatient ED Users
Frequent Users as a Percent of total
Population Age Group Cohort
Calais, Total Caribou, Total Damariscotta, Total Farmington, Total
759894476412
20766554
494928223566
3.8%5.41.81.7
Calais <1 Caribou <1 Damariscotta <1 Farmington <1
2263178511881010
51210
60
37304
24
27%20.85.88.0
Calais 1‐4 Caribou 1‐4 Damariscotta 1‐4 Farmington 1‐4
12821285627581
163
1421
63681031
11.311.02.82.5
Calais 15‐24 Caribou 15‐24 Damariscotta 15‐24 Farmington 15‐24
8331131565491
10161019
6121340
184
3.79.13.03.1
Calais 25‐44 Caribou 25‐44 Damariscotta 25‐44 Farmington 25‐44
746995553464
17312635
14128660
194
4.57.12.42.3
Calais 45‐64 Caribou 45‐64 Damariscotta 45‐64 Farmington 45‐64
574689332282
25693445
1012144988
2.74.11.20.9
23
Cutler Institute, Muskie School of Public Service

Emergency Department Use
Visit Rates for Potentially Preventable Diagnoses by Health Service Area
Fourteen diagnoses frequently seen in both emergency departments and in primary care settings were selected for a comparative analysis of the six study areas (see discussion of selection process, page 5). In aggregate, the rate of visits for this cluster of diagnoses ranged from 223 per 1000 in Caribou to 83.5 per 1000 in Bangor in 2006 (Table 5). Of the individual diagnoses, the greatest disparity was for upper respiratory infections where the rate of visits in Caribou was more than 56 per 1000 compared to about 17 per 1000 in Bangor and Damariscotta. Calais had an unusually high rate of diagnoses for viral infections – 20 per 1000 compared to under 10 in the other five HSAs. It is possible that some of the disparity is due to differences in coding practices from hospital to hospital. However, the high use health service areas had consistently higher rates of visits within each diagnosis as well as in aggregate.
The number of persons within each health service area that had at least one ED visit for one of these potentially preventable conditions was proportionately larger in the higher use health service areas, ranging from 16 percent of the population in Caribou to about 7 percent in Bangor and Damariscotta.
For purposes of comparison, Table 6 shows the population rate of visit in 2006 for two frequently seen conditions likely to merit immediate medical attention and resources available in an emergency department – chest pain and an open wound of the finger. Given the non‐discretionary need for immediate medical care and – in the case of a finger wound – the unpredictability of injury, one would hypothesize that the rate of visits for these conditions across different geographic areas would vary less than for conditions where care can possibly be delayed or provided in a non‐hospital setting. Indeed, the visit rates per 1000 in 2006 for these two conditions showed less extreme variability than the diagnoses reported in Table 5. However, the same underlying pattern is evident even with these diagnoses. Bangor and Lewiston, which vary from each other substantially on potentially preventable diagnosis visits, have rates that are less disparate in Table 6 although Lewiston rates are still higher. The highest population visit rates for these non‐discretionary visits were in Caribou and Calais. Some of the disparity for visits related to chest pain may be attributable to the higher prevalence of risk factors for heart disease seen in these health service areas (see discussion, p. 11). Higher use rates may also be associated with less successful disease management of individuals with chronic illnesses in high use areas.
24
Cutler Institute, Muskie School of Public Service

Emergency Department Use
Table 5: ED Visit Rates and Percent of Population Making a Visit for Selected Potentially Preventable Diagnosis (PPD) Visits
Bangor Lewiston Calais Caribou Damariscotta Farmington Rate per
1000 % with visit
Rate per 1000
% with visit
Rate per 1000
% with visit
Rate per 1000
% with visit
Rate per 1000
% with visit
Rate per 1000
% with visit
Total PPD Visits
83.5 7.0% 131.0 9.9% 172.2 13.1% 223.4 16.0% 84.8 7.2% 89.9 7.5%
U.R.I. 17.6 1.6% 28.6 2.6% 29.0 2.6% 56.3 4.9% 16.9 1.6% 20.0 1.9%
Ear Infections 10.0 0.9% 18.4 1.6% 25.5 2.2% 35.4 2.9% 11.8 1.1% 10.3 0.9%
Bronchitis 9.6 0.9% 16.5 1.5% 24.2 2.2% 38.0 3.3% 13.2 1.2% 7.3 0.7%
Unspecified lower back pain
9.3 0.8% 10.9 0.9% 14.1 1.2% 19.5 1.4% 7.2 0.6% 9.4 0.9%
Asthma 5.0 0.4% 8.5 0.7% 17.6 1.4% 13.1 1.1% 5.1 0.4% 4.2 0.3%
Joint pain 6.5 0.6% 7.5 0.7% 7.8 0.7% 10.9 1.0% 4.2 0.4% 8.2 0.8%
Viral Infection 3.5 0.3% 7.7 0.7% 20.1 1.8% 8.1 0.8% 2.6 0.2% 6.1 0.6%
Muscle/soft tissue pain
4.1 0.4% 7.7 0.5% 6.1 0.6% 9.0 0.8% 3.3 0.3% 4.7 0.5%
Table 6: ED Visit Rates for Frequently Seen Diagnoses Usually Requiring Emergency Care
Bangor Lewiston Calais Caribou Damariscotta Farmington
Rate per 1000 Rate per 1000 Rate per 1000 Rate per 1000 Rate per 1000 Rate per 1000
Chest Pain 16.8 18.0 20.0 33.0 19.1 16.0
Open wound of finger
5.5 8.5 9.6 9.9 8.5 5.6
25
Cutler Institute, Muskie School of Public Service

Emergency Department Use
Population Profiles and Provider Availability in Six Health Service Areas
Using U.S. Census, state Labor Department, and health department data, project staff collected demographic information for each of the study sites including: population density; age distribution; percent of population in poverty; unemployment rates; and health insurance status. Population health characteristics included in the analysis were: overall age‐adjusted mortality rates and mortality due to various diseases; leading causes of death; and the prevalence of various chronic diseases and behavioral risk factors.
To measure the availability of primary care in the selected sites, we obtained data on the number of primary care physicians and dentists (measured as number of doctors per 100,000 population) and, where possible, collected information on whether the providers treat MaineCare patients and whether or not their practice is open to new MaineCare patients. We also determined the number of federally qualified health centers and school‐based health centers within each study area.
Much of the data is available only for counties or the state as a whole. Several of the health service areas study sites are not contiguous with the state’s county boundaries. They cross county boundaries and embrace only portions of some counties. In cases where health service areas encompass more than one county, statistics were collected for both counties that fall within a health service area.
Site Characteristics Associated with High or Low Emergency Department Use
Matrices of all the data collected, organized by health service area, along with information on data sources is included in the report appendices. Here, we report only on patterns that emerged that might bear a relationship to emergency department use.
Of all the measures we examined, only one aligns with ED use rates in the six health service areas of our study – primary care physicians per population. Overall, across the state, the PCP to population ratio is 109 physicians per 100,000 population. In the three health service areas selected for study with high ED use rates, the PCP to population ratios were 76 and 101 per 100,000, respectively in the two rural health service areas, and 105 per 100,000 in the urban high ED use health service area. By comparison, the ratios in the three low use HSAs (while still below the state average) were 121,137 and 157 (Table 7).
26
Cutler Institute, Muskie School of Public Service
Emergency Department Use
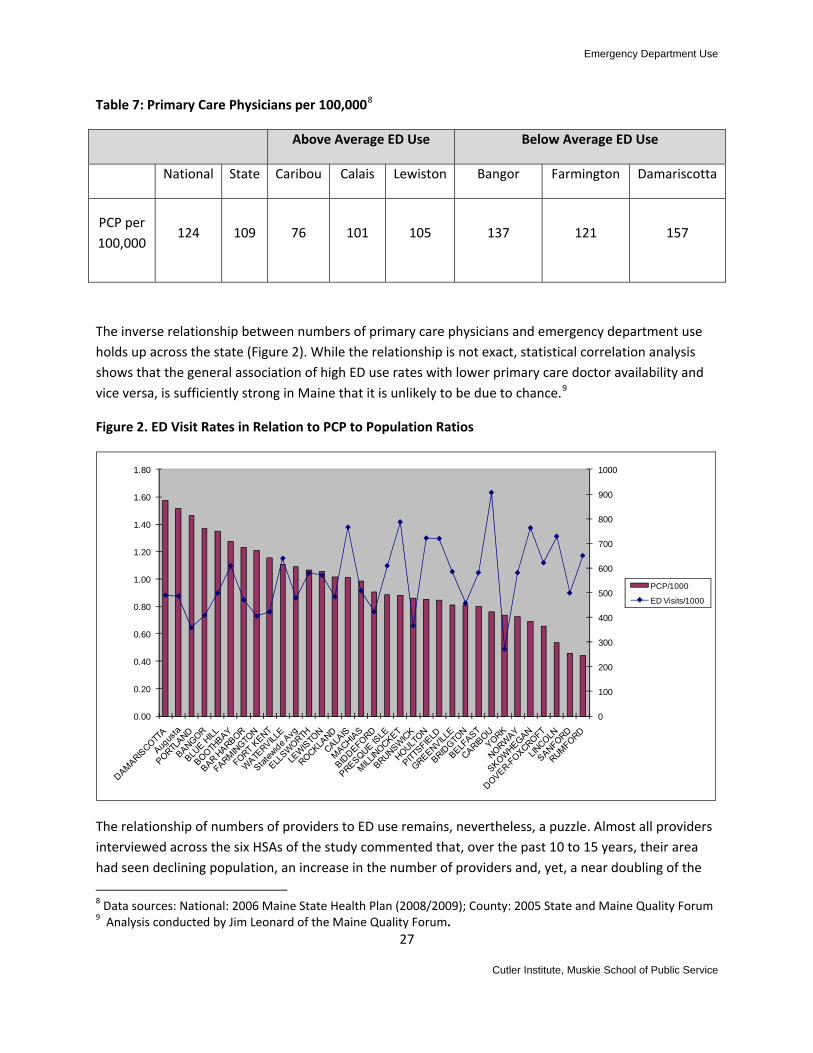
Table 7: Primary Care Physicians per 100,0008
Above Average ED Use Below Average ED Use
National State Caribou Calais Lewiston Bangor Farmington Damariscotta
PCP per 100,000
124 109 76 101 105 137 121 157
The inverse relationship between numbers of primary care physicians and emergency department use holds up across the state (Figure 2). While the relationship is not exact, statistical correlation analysis shows that the general association of high ED use rates with lower primary care doctor availability and vice versa, is sufficiently strong in Maine that it is unlikely to be due to chance.9
Figure 2. ED Visit Rates in Relation to PCP to Population Ratios
0
100
200
300
400
500
600
700
800
900
1000
0.00
0.20
0.40
0.60
0.80
1.00
1.20
1.40
1.60
1.80
PCP/1000
ED Visits/1000
The relationship of numbers of providers to ED use remains, nevertheless, a puzzle. Almost all providers interviewed across the six HSAs of the study commented that, over the past 10 to 15 years, their area had seen declining population, an increase in the number of providers and, yet, a near doubling of the
8 Data sources: National: 2006 Maine State Health Plan (2008/2009); County: 2005 State and Maine Quality Forum 9 Analysis conducted by Jim Leonard of the Maine Quality Forum.
27
Cutler Institute, Muskie School of Public Service

Emergency Department Use
rate of emergency department visits. Given patterns over time, differences in ED use rates cannot be attributed solely to physician‐to‐population ratios.
Providers and administrators familiar with the patterns of ED use in their areas uniformly point to inadequate access to dental care as a major contributor to preventable ED use (see discussion, Section III). Our data collection did not discern an association between ratios of dental providers and high and low ED use rates. However, our data affirms that there are shortages of dental providers, generally, and for MaineCare participants, in particular. In the six health service areas under study, the number of general practice dentists with active practices per 100,000 population ranged from about 25 to 37. The number of active general practice dentists who treat MaineCare patients ranges from 7 to 24 per 100,000; and the number of dentists that are still accepting new MaineCare patients ranges from under 2 per 100,000 (in Androscoggin County) to 11 per 100,000 (in Aroostook County) (based on 2006 data from the Maine Office of Vital Statistics) (Table 8).
Table 8: Active General Practice Dentists per 100,00010
Above Average ED Use Below Average ED Use
State Caribou Calais Lewiston Bangor Farmington Damariscotta
Active (GP) dentists per
100,000
35.29 24.96 30.51 32.70 36.76 24.58 34.48
GP dentists that treat
MaineCare per100,000
15.67 20.80 24.41 6.54 19.87 9.83 11.49
GP dentists that accept new
MaineCare per100,000
6.08 11.09 18.30 1.87 10.43 3.69 2.87
There were no major differences between HSAs in terms of prevalence of depression or substance abuse according to the Maine CDC Health Indicator Report, 2004 – 2006 (Appendix 2). However, mental health resources are unevenly concentrated. From a review of Maine’s Office of Mental Health Services resource guide by town, it is apparent that there are more mental health agencies in urban settings (Bangor and Lewiston have 18 and 21 agencies respectively) than in rural areas (range from 3 to 10
10 Data source: data as of 1/1/06 – Maine Office of Data, Research, and Vital Statistics
28
Cutler Institute, Muskie School of Public Service
Emergency Department Use
agencies).11 While crisis services, such as the crisis hotline, are available statewide 24 hours a day, Bangor has the highest number of agencies providing crisis services; some areas such as Calais and Damariscotta do not have any agencies providing these services.
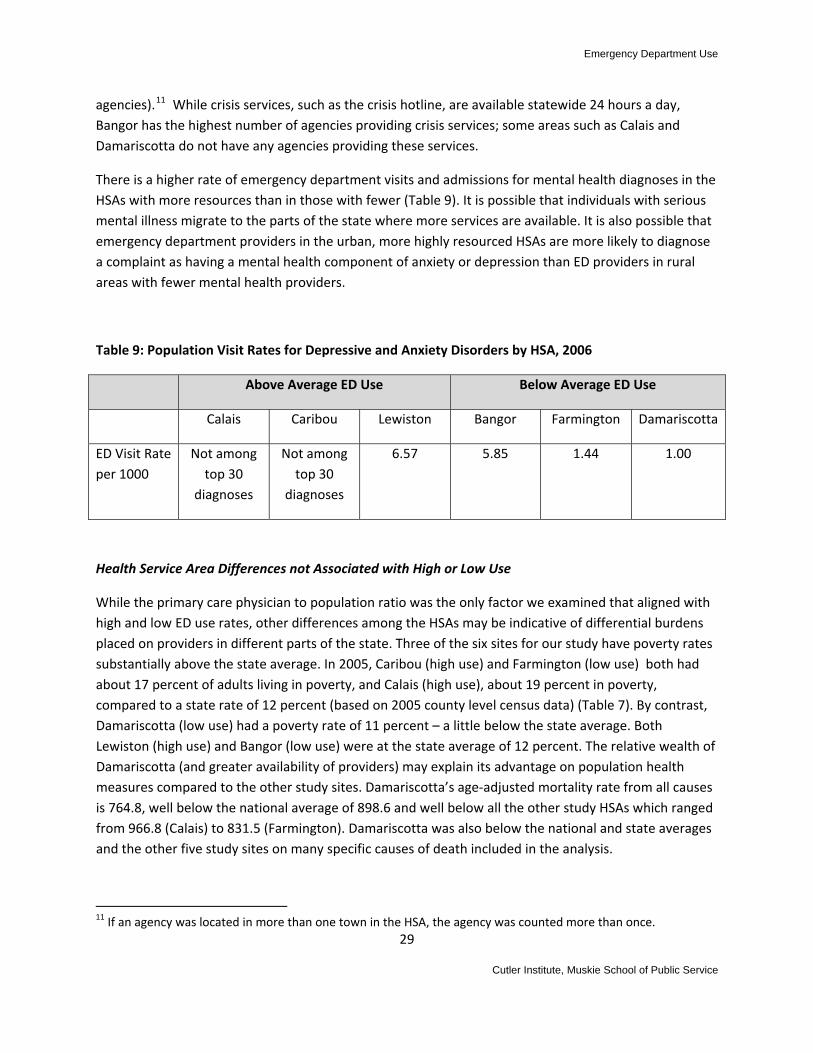
There is a higher rate of emergency department visits and admissions for mental health diagnoses in the HSAs with more resources than in those with fewer (Table 9). It is possible that individuals with serious mental illness migrate to the parts of the state where more services are available. It is also possible that emergency department providers in the urban, more highly resourced HSAs are more likely to diagnose a complaint as having a mental health component of anxiety or depression than ED providers in rural areas with fewer mental health providers.
Table 9: Population Visit Rates for Depressive and Anxiety Disorders by HSA, 2006
Above Average ED Use Below Average ED Use
Calais Caribou Lewiston Bangor Farmington Damariscotta
ED Visit Rate per 1000
Not among top 30
diagnoses
Not among top 30
diagnoses
6.57 5.85 1.44 1.00
Health Service Area Differences not Associated with High or Low Use
While the primary care physician to population ratio was the only factor we examined that aligned with high and low ED use rates, other differences among the HSAs may be indicative of differential burdens placed on providers in different parts of the state. Three of the six sites for our study have poverty rates substantially above the state average. In 2005, Caribou (high use) and Farmington (low use) both had about 17 percent of adults living in poverty, and Calais (high use), about 19 percent in poverty, compared to a state rate of 12 percent (based on 2005 county level census data) (Table 7). By contrast, Damariscotta (low use) had a poverty rate of 11 percent – a little below the state average. Both Lewiston (high use) and Bangor (low use) were at the state average of 12 percent. The relative wealth of Damariscotta (and greater availability of providers) may explain its advantage on population health measures compared to the other study sites. Damariscotta’s age‐adjusted mortality rate from all causes is 764.8, well below the national average of 898.6 and well below all the other study HSAs which ranged from 966.8 (Calais) to 831.5 (Farmington). Damariscotta was also below the national and state averages and the other five study sites on many specific causes of death included in the analysis.
11 If an agency was located in more than one town in the HSA, the agency was counted more than once.
29
Cutler Institute, Muskie School of Public Service

Emergency Department Use
The rural sites other than Damariscotta each have elevated disease rates and/or high risk behaviors, but the results are not consistent. Calais has rates of smoking, obesity, and high blood pressure higher than the other sites. Caribou has elevated rates of asthma and diabetes. Calais has a high rate of death from motor vehicle accidents, as does Somerset County (a part of the Farmington HSA).
Lewiston fares slightly worse than Bangor on most health risk factors but outcomes as measured by age‐adjusted mortality rates present a mixed picture. Death from coronary artery disease is substantially higher in the Bangor HSA than in Lewiston (179.1 and 164.4 in Hancock and Penobscot counties, respectively, compared to 150.6 in Androscoggin County). (See Appendix 2 for presentation of health risk factors and death rates).
All of the study HSAs with the exception of Damariscotta have MaineCare enrollment rates above the state average including two of the low use areas, Bangor (with a 26 percent enrollment rate) and Farmington (with a 29 percent enrollment rate).12 Five of the six HSAs have a higher proportion of uninsured persons than the state average with the exception being Lewiston (Androscoggin County), where the uninsured rate of 7 percent is below the state average. (Appendix 2).
These mixed findings generally suggest that population health measures, coverage rates and poverty do not explain differences in ED use by health service area. Damariscotta, a low ED use area with higher than average income and health care resources, stands in contrast to Farmington, another low use area with substantial poverty and fewer providers. Differences in population characteristics between Bangor and Lewiston do not seem sufficient to explain why Bangor has a substantially lower ED use rate than Lewiston.
Table 10: Health Service Area Differences Not Associated with High or Low Use
Above Average ED Use Rate Below Average ED Use Rate
National State Caribou Calais Lewiston Bangor Farmington Damariscotta
Poverty rate adult13
11.9%
12.3% 16.6% 19.1% 12.0%
Hancock (H)‐10.4%
Penobscot (P)‐12.8%
Franklin (F)‐16.9%
Somerset (S)‐16.9%
11.0%
12 Private coverage rates (shown in the table in Appendix 2) are calculated from counts of persons with private insurance in the Maine Health Data Organization database. No other data source provides coverage information at the county level. Because some national companies in Maine are not obligated to report to the MHDO, these counts underestimate the actual population with private coverage, so, although the data estimates are included, they are not discussed in the report. 13 Data sources: National: 2006 Census, Maine Department of Labor (ages 18‐64); State and County: 2005 Margaret Chase Smith Policy Center UMaine Poverty in Maine, 2008.
30
Cutler Institute, Muskie School of Public Service

Emergency Department Use
Above Average ED Use Rate Below Average ED Use Rate
National State Caribou Calais Lewiston Bangor Farmington Damariscotta
Causes of Death per 100,000 – age‐adjusted14
All causes of death15
898.6 N/A 889.3 966.8 859.1
H‐851.1
P‐892.5
F‐831.5
S‐910.1
(874.9‐945.4)
764.8
Health Statistics
Smokers 20.1 21% (+/‐ 1.6)
24.3% 27.5% 24.7% H‐22.5% P‐24.5%
F‐20.1% S‐26.5%
17.2%
Obesity 34% 25.2% 15.4% 25.0% 24.6% H‐17.7% P‐22.6%
F‐22% S‐23.2%
16.8%
High Blood Pressure
32% 25.4% (+/‐1.6)
24.6% 32.4% 25.1% H‐15.1% P‐23.5%
F‐24.6% S‐29.8%
27.7%
Diabetes 10% 7.3 (+/‐0.6)
10.0% 6.6% 6.7% H‐5.8% P‐8.5%
F‐9.3% S‐9.8%
4.3%
Asthma 8.5% 9.6%
(+/‐1.2)
13.3% (includes Caribou ‐ VanBuren)
8.5% 9.3% 10.7% 9.4% 10.4%
14 See Appendix for data sources. 15 Data source: 1999‐2003 CDC National Center for Health Statistics – Community Health Status Report
31
Cutler Institute, Muskie School of Public Service

Emergency Department Use
32
Cutler Institute, Muskie School of Public Service
Emergency Department Use
V. MAINECARE ENROLLEE FOCUS GROUP REPORT
Introduction
Per capita use rates of hospital emergency departments are higher among enrollees in the MaineCare program than among privately insured Maine residents in both high and low use health service areas. Focus groups with MaineCare members were conducted in each of the study’s six health service areas to gain an understanding of member attitudes about receiving care in emergency departments and the barriers that prevent them from getting care in other settings such as family practices and health centers. Focus group participants were recruited by telephone from lists of enrollees who had made at least two emergency department visits within the last twelve months. Five focus groups included adults who had used emergency departments for their own health care needs and (in some cases, for their children, as well). One focus group conducted in Bangor was made up of parents who had taken a child age 4 or under for treatment at an emergency department. In addition, a seventh focus group of MaineCare individuals with behavioral health diagnoses was held in the Portland. Volunteers for this focus group were recruited with the assistance of staff at the Amistad Peer Support and Recovery Center.
In October, November and December 2009, six focus groups with a total of 32 participants were conducted in Caribou, Damariscotta, Lewiston, Farmington, Calais, and Bangor. Of the 32 participants, the median age for adults was 32 and the median age for the children of participants was 8. Twenty‐eight of the focus groups’ participants were female. When asked to rate their health status, 8 participants reported that they were “healthy”, 21 “somewhat healthy” and 3 “not healthy.” Twelve people (8 women and 4 men) attended the focus group for individuals with behavioral health diagnoses in Portland. Findings for this group are reported in a separate section.
Researchers anticipated that there would be a larger study population. Seventy‐two people were recruited who initially indicated that they would attend one of the 6 focus groups. However, only 32 participated, despite reminder phone calls and offers of $50 gift certificates for attendees. In order to understand this poor attendance, recruiters made follow‐up phone calls to some non‐participants to ask why they didn’t attend. Reasons cited included illness, and a more vague answer of “something came up.” In one instance, a person said that she was not able to find the site because its name was not familiar. Research staff had booked a room from an individual who referred to the site as the “municipal building” when people more commonly refer to it as the police and fire station. Another possible reason, hinted at by one participant’s comment that she was worried about “being set up,” was that people were fearful of repercussions that might affect their MaineCare benefits – despite the fact that they were assured of anonymity and that the purpose of the study was to improve health services. Even after questioning a number of non‐attendees, researchers still don’t fully understand the reasons for this poor attendance.
33
Cutler Institute, Muskie School of Public Service

Emergency Department Use
Limitations of the study
Focus groups provide individual contextual information, not statistically reliable data that can be generalized to a larger population. The poor attendance at these focus groups is another reason to be cautious in drawing conclusions. Those who attended may be different from those who were “no shows” in ways researchers cannot discern.
Questions
Project researchers asked focus group participants a series of questions intended to help elucidate the factors that led to ED use, and, alternatively, the factors that influenced the decisions people made to seek out medical care in other locations. Care was taken to ask questions in a manner that did not suggest that some ED use is either appropriate or inappropriate. Similarly, questions about use of community‐based health care services were phrased so as not to suggest any causal link between community resources and ED use. Rather, focus group participants were asked to describe the reasons for their ED visits in their own terms and, as a separate discussion item, to describe their usual sources of care in the community.
As a final question, participants were asked: “For you, what is the most important change Maine could make so you can get the care you need? “
Findings
Some patterns of ED use suggested by participants were common to all focus groups, while others were unique to the particular service area. Responses to focus group questions can be grouped into 3 general categories of reasons why participants chose emergency departments: availability and access; convenience; and quality of patient/physician interaction.
Availability and Access
The availability of and access to health care in settings other than EDs reportedly influenced the choices some people made about where and when to go for treatment, whenever they or their children were sick. The patterns of participant responses to questions about access and availability can be grouped as: wait times; finding doctors and dentists; and on‐call coverage.
Wait Times Focus group participants in Lewiston, Farmington, Bangor, Caribou and Calais reported that they were more likely to seek ED treatment for illness or pain when they could not be treated by their primary care provider, community health center or walk‐in clinic within a reasonable period of time. Reportedly long wait times for PCP visits by adults were most common in the northern rural regions and in Lewiston, all high ED use areas. Study group participants from Caribou and Calais said that, on average, they waited, or would have had to wait, 3‐5 months before being seen by their doctors. In Lewiston, waits ranging from 3 to 7 months to see a PCP for adult care were reported by almost half of the participants. One individual in Caribou estimated that he would have had to wait 4 months to see his doctor for treatment of back pain. He said “It’s just ridiculous. I hurt my back and I didn’t even
34
Cutler Institute, Muskie School of Public Service

Emergency Department Use
bother calling the doctor. There’s no point calling your physician because you call in August and you can’t be seen until December.” In another instance concerning access to preventive care, a woman who recently moved to Caribou said that she called in August for an appointment to get birth control and was given an appointment for December.
In contrast, the focus group participant in Damariscotta, a low ED use area, said that generally speaking she could see her physician within two days, eliminating the need to go to the ED for reasons that could be avoided. “I believe my family practice has always done an excellent job at doing sort of a modified triage over the phone.” In response to a question about the availability of same‐day service, this participant reported that 6 to 8 months ago her physician practice, comprised of 4 doctors, adopted a new open‐access policy. The practice reserves appointments for last minute patients. Patients can call in the morning for appointments with one of the practice’s physicians that day.
Finding Doctors Finding doctors with open practices who would accept MaineCare patients was reportedly difficult for a number of participants, suggesting to them that the only option for urgent care was the ED. Reasons cited for needing to find a new physician, dentist or psychiatrist included: a move to a new community; decision to leave the provider for personal reasons; the “three strikes and you’re out rule;”16 frequent provider turnover; and, in one case, death of a physician. A participant in Lewiston reported that she had to make as many as 12 calls before finding a PCP with an open practice who would accept her daughter as a patient. Waits of 5 months to see a new PCP were commonly reported.
Access to dentists Lack of access to practicing dentists, to dentists who accept MaineCare, and to adult dental coverage other than for extractions, was also cited as the reason for going to EDs for treatment of dental pain. In most focus groups, participants complained of not having dentists and adequate dental services available to them as adults. Lack of dental care was of such importance that participants frequently commented about it in focus group discussions and also cited it when asked to recommend improvements in their community healthcare systems.
Several participants commented that while MaineCare provides better dental coverage for children than for adults, access or timely access can be problematic. One mother in Caribou said that it usually took 4 to 6 months to get her children in for dental treatment. Another mother commented, “My three‐year‐old son cracked a tooth off the gum line and got an infection and kept getting one and they still wouldn’t get him in. This was back in July and they got him in, in September.” A woman in Farmington remarked, “You can’t get in there [community dental clinic serving children]. They just say, if they are in pain, bring them to the emergency room. You bring them there and they are like, here’s some pain medicine, go see a dentist.”
35
16 “Three strikes and out” is a policy adopted by some practices around the state that reserves for the practice or individual provider, the right to remove a patient from the practice for three or more violations. Violations include non‐compliance with self‐management contracts, particularly with regard to substance abuse, and no‐shows for appointments.
Cutler Institute, Muskie School of Public Service

Emergency Department Use
On‐Call Coverage While access to PCPs for advice after hours and on weekends was reported to be helpful to some participants, most reported that they still ended up in EDs. For example, many participants, after consulting with on‐call doctors, reported that they were referred directly to the ED, particularly if the on‐call doctor didn’t know them. Commenting from Damariscotta, the participant said, “[The] on‐call system now includes a few doctors that are in practices of their own and they share on call. I will say, I believe many times, if it is not one of my doctors from my own practice, I wind up being sent to the emergency room.”
In some cases, on‐call doctors gave medical advice, but also suggested that the patient go to the ED if “you think you should” or if the symptoms persist. In one case, a participant from Caribou reported that the response to her calling after hours was a recorded message to go directly to the ED. Whatever the details of the on‐call process, in a majority of cases, participants reported that they ended up in EDs rather than at some other “next day” treatment setting such as a family practice or community healthcare center. A comment from a woman in Lewiston serves as a summary statement: “Usually on‐call is pretty useless for me. They are not going to go to the hospital to meet you.”
Convenience
Convenience, timeliness, and guaranteed treatment were cited by participants as reasons for using EDs for non‐emergent care. Participants’ comments included: open access 24/7; the convenience of having diagnostic equipment and treatment available in one location; the surety of getting treatment; and avoiding long waits to see PCPs just to ask for referrals to specialists. One woman in Caribou stated, “The one thing that they do makes it more appealing to go to the ED. You go to your physician, they say we have to do this test and this test, but you have to go to the hospital to get them done at the lab. Whereas if you go to the ER, you get it all done in one shot.” A participant in Lewiston explained that she would usually just go to the ED because getting in to see her doctor was so hard. “I call and I have to wait for hours for them to call me back. It’s just easier sometimes to go to the ED. It’s the only place that won’t turn you away. When you need an answer, you got to get an answer.” Another participant discussed the dilemma she and other working parents face. She said that a lot of employers in Lewiston don’t provide sick time and parents can’t afford to take time off work to take their children for sick or regular doctor visits during the day. This concern was echoed by a parent participant in Caribou who travels long distance to her job and has found it very difficult to schedule medical care visits for her child.17
Several participants also commented that unnecessary office visits affected their healthcare decisions. According to a woman in Lewiston, MaineCare has a requirement that new patients make an appointment to “meet and greet” their new PCP before scheduling an appointment for care. “They called, sent me a letter saying I needed to come in for an appointment to meet this doctor. I said, no, I don’t need to go to meet this doctor. When I’m sick or my children are sick, then I’ll make an
17 This concern regarding time off from work was also cited by ED staff as an explanation for after hours visits. Most of the MaineCare focus group participants were not working so this issue arose less in the group discussions than it might in groups of working adults and parents.
36
Cutler Institute, Muskie School of Public Service
Emergency Department Use
appointment and meet this doctor.” Others commented that having their PCPs call in prescriptions for medical conditions already known by them to reoccur (e.g., strep throat, yeast infections) would improve efficiency of treatment in community healthcare settings, thereby eliminating the necessity to go to the ED.
Quality of Patient/Physician Interaction
In many cases, the perceived quality of the patient‐physician interaction influenced care setting choices. The absence of a trusting, personable, caring and responsive primary care physician who takes time to carefully listen and check things over was cited by several participants as the reason they avoided seeing their PCPs. In Caribou, two participants stated that they went to the ED precisely because they liked the ED doctor better. In contrast, a participant in Farmington stated that her husband preferred the more impersonal interaction afforded in the ED.
Several participants commented that the doctors that treated them were not competent, didn’t treat them well, or didn’t like patients very much. As a result, they stopped seeing their doctors and received no treatment until something serious arose, when they had to go to the ED. Perhaps the most common complaint made by participants about their PCPs involved how little time their PCPs spent diagnosing and treating them. One person commented, “In and out; it ruins trust.” A participant in Bangor, speaking of her children’s pediatrician, remarked, “Like I said, they are only in the room and actually looking at you for five minutes or less, almost every single time.”
Several participants remarked that it was very difficult to change physicians when they were not satisfied with the care they were getting. They stated that MaineCare requires members to get permission first, a fact disputed by a number of participants. A mother in Bangor commented, “They should make it easier to switch pediatricians because to switch a pediatrician you have to call MaineCare, get permission from MaineCare, and then you have to go through the process of finding a new pediatrician. It is hard. I mean, around here there are not very many people [who] are taking new patients.” In Farmington, a participant commented, “Forget trying to switch doctors. You have to prove that you’re being killed and they might still say no.”
A common subject of some sensitivity raised by participants in 5 locations‐‐Farmington, Damariscotta, Calais, Caribou and Lewiston‐‐involved their perception of unequal treatment and lack of respect by PCPs because they are on MaineCare. A participant in Lewiston said, “They [PCPs] make you feel like a low life because you are on MaineCare. It’s like, that’s too bad, you are on MaineCare so we’re going to punish you. You know, you go to the back of the line.” One individual claimed that he was treated better in the ED.
During discussions, at least one participant in Lewiston, Farmington, Bangor, Caribou and Calais commented that the high illicit drug use in their communities negatively affected the treatment they received or would have received from their PCPs and ED doctors. As MaineCare members, participants
37
Cutler Institute, Muskie School of Public Service

Emergency Department Use
believed that they were routinely judged to be “drug seekers” and therefore undeserving of quality health care and appropriate pain relief.
Parents with young children in Bangor
The Bangor focus group was specifically designed to consist of parents who had taken a child 4 or younger for treatment in an emergency room. These 7 participants were asked the same questions that were posed to participants in the other 5 focus groups, even though the medical conditions for taking children to the ED were often different from those leading to adult visits. Within the Bangor focus group, 8 of 12 cases of parents taking young children to EDs were cases of high fevers, vomiting, dehydration, ear infections, upper respiratory infections and inconsolability. In addition, several parents remarked that their children never seemed to get sick or injured during normal office hours, but in the middle of the night, on weekends and holidays.
Pediatric care provided by pediatricians and family doctors was rated very highly by parents in Bangor as it was by participating parents in most focus group locations. One participant, with corroboration from a number of others, stated, “When it comes to pediatric care for my kids, I give them a 5. They do an amazing job.” MaineCare also received high ratings. As one parent in Lewiston said, “I think, for children, MaineCare is really good.”
Whereas, deficiencies such as long wait times, lack of available primary care, impersonal physicians, and inadequate on‐call services were commonly cited by participants in other groups, these conditions did not generally seem to apply as barriers to seeking pediatric care. Consequently, the only solid recommendation from this group for improving the system of care was to lower the patient‐to‐doctor ratio.
People with behavioral healthcare diagnoses in Portland
A seventh focus group comprised of individuals with behavioral health diagnoses, who had used an emergency department for treatment within the past year, was held in Portland. For this convenience sample, participants were recruited with the assistance of staff at Portland’s Amistad Peer Support and Recovery Center. Twelve people from Amistad (8 women and 4 men) attended.
Participants in this focus group were asked to share their experiences and opinions about the factors that contributed to their ED use when other sources of treatment and support for behavioral health problems might have been available and appropriate. To a large degree, findings from the Amistad focus group were similar to the findings of the six high use/low ED use focus groups. Factors contributing to ED use for potentially avoidable reasons included: lack of timely access to outpatient clinical treatment; limited access to on‐call support after hours and on weekends; and the convenience, certainty and perceived safety of treatment in EDs.
Focus group participants named the following alternatives to the ED: publicly funded community mental health centers; the homeless health clinic; a “warm line” operated by the peer support and recovery center; crisis response teams; and a crisis hotline. While these places were said to make an enormous
38
Cutler Institute, Muskie School of Public Service

Emergency Department Use
difference in the lives of people with mental illness by helping them “keep safe,” participants noted a range of reasons why they either went directly to the ED or were referred there.
One participant commented that getting access to outpatient psychiatric treatment can be a very difficult process and that there can be a wait of up to 6 weeks to get an appointment with clinicians in one key agency. A peer counselor said, “I had somebody who was really in a rough state. We called and they said we’ll call you in 6 weeks. If you don’t hear back from us, call us.” He also reported that, while people try to hang on in the interim, sometimes their only option is to go to the ED because they know they can get help and will feel safe there. Reportedly, this key agency has to reserve a certain amount of appointments for people being discharged from in‐patient psychiatric settings. Therefore, if someone in the community is in crisis and cannot wait, they are sometimes advised by their case managers to go the ED, first for treatment, but also for speedier access to outpatient treatment.
Participants reported that, for most people living in the community, there is limited availability or ineffective on‐call clinical services at night and on weekends. According to one person, there is only so much time or amount of advice on‐call crisis staff can give. After hours, people are either referred to the ED or go on their own to the ED, where they feel protected and have someone to talk to.
When asked what steps they took to avoid ED use, participants reported that they applied the practice of the “crisis pyramid” and relied on their circle of friends, whenever possible, to feel safer and to avoid unnecessary hospitalizations. In this “crisis pyramid,” participants first talked with their friends, then to a clinician, then to peers on the warm line, next to a crisis clinician, and finally to a physician in the ED.
In this focus group, the recommendations for systemic change were largely aimed at refining the system, by re‐structuring the ED, increasing training for first responders, nurses and teachers, and providing more funding to strengthen existing programs.
Participant Recommendations
As a final question, participants were asked: “For you, what is the most important change Maine could make so you can get the care you need? “ The responses are itemized below by high and low ED use.
Participants in Caribou and Calais said:
1. Stop the rotation of visiting doctors and traveling nurses. “These healthcare providers are in the community for 6 months and sometimes as short as a month, then they are gone.”
2. Provide preventive care. 3. Provide more dentists. 4. Provide after‐hours, on‐call services. 5. Get better [trained, sociable and non judgmental] doctors. 6. Evaluate patient satisfaction with primary care physicians.
39
Cutler Institute, Muskie School of Public Service

Emergency Department Use
Participants in Lewiston, Farmington and Bangor said:
1. Provide more dentists. 2. Provide more walk‐in clinics. 3. Reduce the time it takes to get approval for payment of non‐generic drugs. 4. Get doctors who listen to patients. 5. Have more doctors accept MaineCare. 6. Expand MaineCare coverage for adults. 7. Provide preventive care. 8. Make available a bridge or safety net between the ED and PCP. 9. Provide more behavioral health services. 10. Lower the patient to doctor ratio so doctors get to know their patients. 11. Make it easier to switch pediatricians.
Participants with behavioral health needs in Portland said:
1. Make a paradigm shift. Instead of viewing frequent visits to the ED as a deficit, look at them as strengths; people are getting what they need in the absence of other resources.
2. Split up the ED into sections, one that serves people with physical problems and one that serves people with mental problems.
3. Improve police promptness to calls for help. 4. Provide better crisis training for police. 5. Provide access to case managers outside of normal office hours, especially for people who are
homeless. 6. Provide more funding to staff the statewide “warm line” so people don’t have to wait too long
in the queue; also provide more funding for marketing and peer volunteer training. 7. Make sure that the ED doctors write prescriptions that are covered by MaineCare. 8. Change MaineCare rules to permit people to see their psychiatrists and therapists on the same
day. 9. Teach counseling skills to nurses and teachers.
Discussion
Most MaineCare recipients (175,000 members) are enrolled in primary care case management (PCCM). Under MaineCare PCCM, providers are paid an enhanced fee to manage the care of patients who select or are assigned to them as their primary care provider (PCP). PCPs are required to provide coverage or access to medical advice 24 hours a day 7 days a week.
The comments from MaineCare participants in the focus groups suggests that the PCCM program is not working as intended for some MaineCare recipients. Some of the problem arises from recipients who have not experienced or do not perceive the value of an ongoing relationship with a PCP and so do not
40
Cutler Institute, Muskie School of Public Service

Emergency Department Use
understand the need for a baseline visit or understand the value to the provider of a medical history. It also appears from the comments of some participants, particularly in remote rural areas, that rapid turnover of community‐based providers can stand as a barrier to establishing or maintaining a relationship. “Three‐strikes” policies are an understandable response from providers who want to reduce inefficiencies from no‐shows and to protect themselves and their staffs from abusive or irresponsible patients. However, the outcome of this strategy may be the creation of a permanent cohort of rootless, high‐user patients who receive no care management and spend a lot of time in emergency departments.
41
Cutler Institute, Muskie School of Public Service

Emergency Department Use
42
Cutler Institute, Muskie School of Public Service
Emergency Department Use
VI. HEALTH SYSTEM FACTORS RELATED TO ED USE
In an effort to understand health system factors that may impact on high or low rates of emergency department use, research staff conducted interviews with hospital administrators, clinical staff within emergency departments, and community‐based primary care physicians in each of the six study health service areas. In addition, we gathered data, to the extent possible, on practice hours, policies with regard to same day appointments, evening and weekend coverage, and whether a practice is open to new patients and/or accepting new MaineCare patients. Findings from these interviews or perspectives gained from the providers have been incorporated throughout the report, where relevant. The discussion, below, of health system factors related to ED use is derived almost exclusively from these interviews.
The findings from our interviews, taken together with information from the health service area profiles and focus group discussions, reinforce the perception that high rates of ED use constitutes a complex problem with no single “silver bullet” solution. However, several health system arrangements and practices emerged that have a significant impact on ED use.
Meeting Acute Care Needs in the Community
Every source of information we have examined points to barriers to primary care in the community as being directly related to increased use of emergency departments for acute primary care episodes. Barriers may be self‐imposed by patient non‐compliance, related to external constraints such as difficulty in taking time from work, or related to primary care practice choices such as hours of operation and open booking policy. At the simplest level, the ratio of primary care providers to total population is statistically correlated in an inverse relationship with total rates of ED use within health service areas in Maine (Figure 2).18 Damariscotta, one of the low use study areas, has the highest provider to population ratio of any health service area in the state. Farmington, our second low‐use study area is also above the state average in PCP to population ratio, while Caribou has the eighth lowest ratio of PCPs to population in Maine and Calais is at the state average. A similar relationship is observed with the two urban health service areas in the study. Bangor has 137 PCPs per 100,000 population compared to Lewiston’s 105 PCPs.
However, factors other than numbers of providers affect access and rates of ED use. Figure 2, on page _ shows that the relationship between providers ratios and ED use is far from exact. Through data analysis, interviews and focus groups we identified four health system arrangements and practice patterns that appear to impact ED use positively or negatively.
43
18 The counts of primary care providers are derived from data within the Licensure Division of the Department of Human Services and were gathered by an intern at the Maine Medical Association. The figures include M.D.s and D.O.s but do not include mid‐level practitioners such as nurse practitioners or physician assistants.
Cutler Institute, Muskie School of Public Service

Emergency Department Use
Availability and Flexibility of PCP Care
We found some, but not systematic differences among primary care practices in different health service areas with regard to practice hours. Only in the low‐use urban HSA did we find a family practice Saturday office hours. In addition, Cary hospital has Saturday clinics in the months from September through May. Administrators at Miles Memorial and Franklin Memorial hospitals both commented that weekend clinics had been tried but were terminated due to insufficient volume. Franklin Memorial Hospital holds a weekend clinic every fifth weekend (both Saturday and Sunday), a practice that seems satisfactory to both providers and the hospital. In six communities surveyed, there were primary care practices that had office hours as late as 8 pm, usually, one day a week.
Nevertheless, there were differences in total hours of availability. In one high use rural HSAs, for example, the physicians in the hospital owned practice see patients 32 hours a week and have one day designated as a “paper day.” This same community uses hospitalists for inpatient care so office‐based physicians are not obligated to manage the care of their patients in the hospital. In another high use HSA, Friday is a half day for patient appointments. Caribou has lost six physicians in recent years and has had difficulty replacing them.
Where substantial differences were noted between the rural high and low use study areas were protocols with regard to same day appointments and after hours urgent care. Calais Regional Medical Services (the hospital owned practice) does not leave any schedule openings for same day appointments and the practice is booked out for three months. The providers try to doublebook to fit in a patient who needs to be seen. However, the provider interviewed in Calais believed that the majority of patients who call in are not able to get appointments the same day. Eastport Health Care, an FQHC 28 miles from Calais has two providers and reserves four appointment slots a day for patients who call in. Eastport has no evening coverage, with patients referred by tape recording to the hospital emergency department. In Caribou, evening coverage of patients’ calls is provided by an out‐of‐state nurse line without direct access to an on‐call doctor. The answering service conducts phone triage to determine whether the patient should be advised to go to the emergency department or call his or her physician the next day.
In Farmington and Damariscotta, the low use rural areas, the family practices contacted all reserved times in each day’s schedule for same‐day appointments. In Damariscotta’s Full Circle Family Medicine practice, 2/3 of the schedule is kept open and one provider, on a rotating basis, stays after the office closes from 5 to 6 pm each evening to handle unscheduled acute care visits. The Franklin Health Family Practice holds from 2 to 3 slots in the morning and 2 to 3 slots in the afternoon each day for acute visits. Both communities have shared physician on‐call coverage to provide patient consultation after hours.
“Fast Track” or “Walk‐in” Care availability outside of the hospital Emergency Department
One particularly salient delivery system component that takes pressure off of hospital emergency departments is alternative urgent care “walk‐in” centers. In Bangor, the walk‐in clinic, located in a location entirely separate from the EMMC campus, sees 25,000 patients a year. In 2006, 36,938 individuals in the Bangor HSA made a total of about 63,000 emergency department visits. If one
44
Cutler Institute, Muskie School of Public Service

Emergency Department Use
assumes that each of the 25,000 patients seen in the walk‐in urgent care center had, instead, made at least one visit to the emergency department, that would have increased the ED volume by close to 40 percent. Patients who enter the emergency department at EMMC cannot be referred to the walk‐in clinic, regardless of the level of severity of the complaint, according to the hospital’s interpretation of EMTALA.19 However, physician practices in the health service area appear to be aware of the availability of the walk‐in clinic and refer “over‐load” acute care patients there, rather than to the emergency department.
In contrast, Central Maine Medical Center, St. Mary’s, Franklin Memorial and Cary Hospital all have “Fast Track” care systems set up within their emergency departments. These systems are specifically designed to provide timely and efficient care to lower acuity patients who present at the emergency department, frequently through use of mid‐level practitioners. The system relieves congestion within the emergency department and increases patient satisfaction with wait times. However, because the care is provided in the emergency department, the overhead costs are high and the visits are billed as emergency department visits. It is also likely that these systems reinforce patient beliefs that the hospital emergency department properly functions as an urgent care center and a convenient resource for primary care at any time of the day. A dynamic referenced by a number of interviewees in both Caribou and Calais is that the emergency department physicians are the longest standing members of the medical community, are very popular with patients, and many patients see these doctors as their primary care providers.
Structure of Financing Incentives
The rate of reimbursement for a potentially avoidable visit treated in a hospital emergency department is substantially higher than for identical treatment provided in a physician office. As more and more physician practices come under the ownership of hospitals or their parent entities, the incentives to divert care from physician offices to the ED mount. This point was made very bluntly by a hospital administrator in a rural HSA (not one of the study HSAs). He stated, “Why should we ask our physicians to hold their offices open until 5 pm or 5:30 to see a patient with an acute need when we can see the patient in our emergency department and receive four times the revenue for that visit?”
This dynamic may also be particularly pronounced in areas where it is difficult to recruit and hold physicians, since it allows the hospital to limit physician work hours. However, ED providers in all the study HSAs, regardless of volume or provider ratios, indicated that the concern they heard from hospital management was how to keep ED volume up or to increase it – not how to reduce ED volume.
The structure of incentives is also evident in the wide‐spread upgrades to hospital EDs recently undertaken by hospitals. Six of the eight hospitals in the study HSAs are currently undergoing or have recently undergone major renovations in the EDs to increase capacity and improve flow.
19 The federal Emergency Medical Treatment and Active Labor Act, an “anti‐dumping” law that forbids hospital emergency departments from refusing treatment.
45
Cutler Institute, Muskie School of Public Service
Emergency Department Use
Availability of Dental Care, particularly for acute care needs
Urgent care needs for teeth and supporting structures were among the 20 most frequently seen diagnoses in all six study areas, ranking third and fourth in Farmington and Lewiston, respectively. In interviews, providers in all the emergency departments mentioned the frequency of visits related to dental care needs and pointed out that emergency room providers are generally limited to prescribing antibiotics for infection and medications for pain control but do not have the resources for repair or restoration. Many complained of limited resources in their community for referring care out.
In 2006, 11,960 emergency department visits related to dental care needs were made in Maine just by adults between the ages of 15 and 44 (see table 1). Clearly, one area where early intervention and alternative care sites could reduce emergency department utilization is across the full spectrum of dental care from preventive care to dental surgery.
46
Cutler Institute, Muskie School of Public Service

Emergency Department Use
VII. PATIENT BELIEFS AND BEHAVIORS RELATED TO EMERGENCY DEPARTMENT USE
Two factors regarding patient behaviors and beliefs are likely significant contributors to over‐use of emergency departments. These issues – insufficient connection to a primary care provider and drug dependence – were raised in interviews both by patients and providers.
Insufficient Connection to Primary Care Providers
The patients we spoke to (Mainecare enrollee emergency department users) and emergency department clinical providers all indicated that patients, when asked, state that they have a primary care provider (PCP). However, when probed, it frequently turns out that this relationship is tenuous. Patients in Washington and Aroostook counties complained of rapid turnover of providers which curtailed their ability to establish a relationship. Also, general shortages resulted in very long waits (five or six weeks or longer) for appointments. Further, many stated that the time pressures on physicians were such that the face‐to‐face time they had with providers was insufficient to get questions answered.
Another dynamic described both by providers and patients clearly reflects a misunderstanding between the parties. Providers complain that their office will get calls from patients with acute care problems when the patient has never before been to the office and there is no medical record or history. Most primary care practices give scheduling priority to existing patients and have slots for “new patients” booked out several months. Some MaineCare enrollees, on the other hand, assigned a provider by DHS, told us they see no purpose in making an appointment to “meet and greet” a physician. “I’ll make an appointment when I need to see a doctor, not before,” we were told. Then they are surprised and frustrated when they call with a medical complaint and are told they can be seen in five or six weeks. The emergency department is the logical alternative and once the pattern is established, these patients are unlikely to call the physician office the next time and self refer to the hospital.
Drug Dependence
Another issue raised by both patients and providers is the prevalence of emergency department traffic from individuals with dependency to pain medications seeking prescriptions. MaineCare enrollees that we spoke to raised this as a concern because they felt that the behavior of a small cohort cast suspicion upon all MaineCare recipients and made it more difficult for them to get legitimate medical problems appropriately treated. Almost all ED providers interviewed acknowledged drug seeking as a problem but had very little idea how to measure the extent of the problem. Among the ED top diagnoses seen across the state are complaints of headache, back pain, and dental pain – all difficult problems for measuring severity except based on patient self report and all difficult, in some circumstances to pinpoint an underlying pathology that can be treated. Over 11,000 visits to the ED across Maine in 2006 among adults between the ages of 15 and 44 were for diagnoses related to headache, back pain and dental
47
Cutler Institute, Muskie School of Public Service

Emergency Department Use
pain.20 If just 20 percent of these visits were preventable through treatment of drug dependence, that would result in a decrease in ED visits of almost 2,300 visits.
48
20 The specific ICD‐9 code diagnoses included in this calculation are: headache, unspecified disorder of teeth and supporting structure, unspecified migraine, lumbago, unspecified backache, lumbar strain, and dental caries.
Cutler Institute, Muskie School of Public Service

Emergency Department Use
VIII. RECOMMENDATIONS FOR POLICY OPTIONS AND FURTHER ANALYSIS
The use of emergency departments for treatment of illnesses and conditions that can be appropriately managed in an office or clinic setting is a wide‐spread phenomenon affecting all hospitals (in Maine and elsewhere). Our analyses indicate that the higher than average emergency department use experienced by some hospitals in Maine is predominantly a result of increased potentially preventable visits rather than a higher rate of use for emergency care and, therefore, should be amenable to interventions that would reduce ED use. The factors contributing to high use are complex, involve both health system arrangements and patient behaviors and are frequently mutually reinforcing. Moreover, the incentives built into the health care reimbursement system reduce motivation to introduce changes that would reduce ED use.
While provider to population ratios were among the few factors identified that show a general pattern of association with high and low ED use, this factor does not explain the very substantial growth in ED use over the past 10 years. As numerous providers in high use areas pointed out, primary care provider availability has increased in their area, population has decreased, and ED use has, nonetheless, doubled. Changes in practice patterns, patient expectations, and hospital messaging about ED purpose and availability have probably all contributed to changes in use.
Some areas where policy interventions might reduce emergency department volume, shift care to appropriate treatment locations, and reduce unnecessary health care spending, are identified below for consideration, by the ED Work Group.
1. Reimbursement Incentives Currently, joint hospital/physician practice systems receive greater revenue for the same care provided in an emergency department as opposed to an office setting. Physician practices, regardless of ownership, have no financial incentives to hold unscheduled slots for same day appointments. Realigning financial incentives could stimulate provider‐driven innovations to direct more patients to appropriate settings where care would be less fragmented and care management, possible. A logical starting point for testing one or more new reimbursement models would be Maine’s Patient Centered Medical Home Pilot Program. Overtime, payment models that worked satisfactorily for payers and providers in the context of the demonstration project, could be adopted more widely across the state.
2. Availability of same day, unscheduled urgent care visits Most of the providers interviewed for this study agreed that patients who cannot be seen the same day that contact a provider for a problem they deem to be urgent, will default to the emergency department. Our analysis indicated that the most critical health system factors that impact a community’s rate of ED use are whether or not “walk‐in” urgent care or open
49
Cutler Institute, Muskie School of Public Service

Emergency Department Use
scheduling of same day appointments are available.
3. Availability of medical advice and consultation in evenings and on weekends. Both our research and the research literature suggest that the availability of medical advice during times when primary care provider offices are not open can reduce emergency department visits.
4. Patient understanding of the importance of a functional provider/patient relationship and preventive health A complaint we heard from primary care providers related to new patients, not previously seen in the office, who call for an urgent care appointment when they are acutely ill. Providing care in the absence of a medical history is problematic for the providers and working patients in on short notice is prioritized to established patients over new patients. From the patients we heard complaints that when they called with an acute problem, they were offered an appointment weeks later. Strategies that encourage patients to establish and maintain an ongoing relationship with a provider or clinic could reduce frustrations on both sides.
5. ED visits related to dental disease Visits for dental complaints are the highest volume complaint among teens and young adults in the MaineCare Program and among the uninsured. Emergency departments are not staffed or equipped to deal with dental emergencies and are limited to providing pain medication and antibiotics, as appropriate. The diversion of this critical care need to an appropriate setting and improved prevention could substantially reduce ED volume.
6. Medication management in EDs. All ED providers we contacted acknowledged that some ED patients have developed a dependency on prescription medication and generate visits to seek medications. While small in number, these individuals may be repeat visitors. Another dynamic that can result in unnecessary visits are requests for prescription refills on weekends when patients can’t reach their regular provider. Finally, ED providers can be handicapped in treating patients without access to their medical record and accurate information on current medications. Each of these issues could benefit from interventions.
7. Understanding EMTALA’s constraints on creating alternative venues for patients with non‐emergent care needs and billing services.
50
Cutler Institute, Muskie School of Public Service

Emergency Department Use
51
Cutler Institute, Muskie School of Public Service
8. Limits to the efficacy of the MaineCare PCCM program. Hospital discharge data show that the rate of ED use by the MaineCare population is substantially higher than that of privately insured people in Maine. This fact in addition to the complaints we heard in focus groups with MaineCare participants indicate that some individuals in the MaineCare program are insufficiently linked to the primary health care system and use emergency department care as a substitute.

Emergency Department Use
52
Cutler Institute, Muskie School of Public Service

Emergency Department Use
BIBLIOGRAPHY
(No author listed). (2005). Putting the Brakes on Inappropriate ER Utilization. Disease Management Advisor, 11(3): 28‐32.
Bowe, T., D. Thayer, C. McGuire and A. Leighton. (2009). MaineCare Physician Practice Physician and Office Manager Surveys. Portland, ME: University of Southern Maine, Muskie School of Public Service.
Edelstein, B. (2009). Training New Dental Health Providers in the U.S. A Report prepared for the W.K. Kellogg Foundation by Columbia University and Children’s Dental Health Project.
Estee, S., L. He, D. Mancuso, and B. Felver. (2007). Medicaid Costs Declined Among Emergency Department Patients who Received Brief Interventions for Substance Use Disorders through WASBIRT. Interim Report. Olympia, WA: Department of Social and Health Services Research and Data Analysis Division.
Freeman, E. and M. Narasimhan. (2009). A Multi‐state Analysis of Emergency Department Use for People with Mental Health and Substance Abuse Disorders: Challenges and Results. Presented at the 19th Annual State Mental Health Services Research Conference, Washington D.C., April 16. Gadomski, A., V. Perkis, L. Horton, S. Cross, and B. Stanton. (1995). Diverting Managed Care Medicaid Patients from Pediatric Emergency Department Use. Pediatrics, 95:170‐178.
Kilbreth, B., C. McGuire, C. Gray, T. Chitashviliand, and K. Finison (2009). Analysis of 2006 Maine Emergency Department Utilization. Portland, ME: University of Southern Maine, Muskie School of Public Service.
Maine Department of Health and Human Services. (2004). MaineCare Emergency Department Utilization and the Impact of MaineCare Interventions, FY 2003. Portland, ME: Analysis conducted by the Maine Health Information Center.
McConnell, W., C. Gallia, and J. Smith. (2008). How Effective Are Copayments in Reducing Expenditures for Low‐Income Adult Medicaid Beneficiaries? Health Services Research, 43(2): 515‐530.
Mortensen, K. (2009). Do Copayments Affect Emergency Department Use of Medicaid Enrollees? University of Houston Center for Public Policy Brown Bag Seminars. For additional information: [email protected]
Pew Center on the States. (2009). Help Wanted: A Policy Maker’s Guide to New Dental Providers. Washington D.C. Available at www.pewcenteronthestates.org
53
Cutler Institute, Muskie School of Public Service

Emergency Department Use
54
Cutler Institute, Muskie School of Public Service
Piehl, M., C. Clemens, and J. Joines. (2000). Narrowing the Gap: Decreasing Emergency Department Use by Children Enrolled in the Medicaid Program by Improving Access to Primary Care. Archives of Pediatric Adolescent Medicine, 154:791‐795.
Selby, J., B. Fireman, and B.Swain. (1996). Effect of a Copayment on Use of the Emergency Department in a Health Maintenance Organization. New England Journal of Medicine, 334(10):635‐641.
Sutton, S. and J. Feinstein. (2009). Collaborative Dental Recruitment Initiative Working Group Interim Report. For additional information: [email protected] or [email protected].
APPENDIX 1.
Data Collection Instruments


ED Questions Community Provider 1. What is your position and how long have you worked in this practice. What have been your other clinical practice experiences? Is this practice owned by the hospital or by the physicians? 2. Please describe the staffing of your practice – number of locations/offices, physicians, nurses, midlevels. How many patients are seen by your practice (total number)? Can you estimate the daily number of patients you see in the office? 3. Please describe the times available for patient office visits (days and hours). Does you practice offer any office hours on evenings, weekends? If so, has that been successful and what has been the feedback from patients? 4. What is the method of triage within your practice regarding scheduling of office visits by patients and determining acuity of complaints? Do you leave openings for scheduling same day appointments? How many? 5. What is the average wait time for an appointment for an established patient with a new complaint? 6. Does your practice have policies about referring patients to the ED after hours or on the weekend? What is your practice’s call coverage arrangement? 7. Are you accepting new patients in your practice? If so, how long does a new patient wait for an appointment? 8. What are your patients instructed to do if they need prescription orders outside of the normal office hours? 9. How frequently (on a weekly basis) do you refer patients to the ED? 10. How and when do you find out if one of your patients is in the ED? 11. How often do you believe your patients self‐refer to the ED? (Do not call the office before going to the ED). Probe – frequency, any particular age group, diagnoses? 12. Our ED study showed that in Maine the emergency room among infants and 19‐24 year olds is much higher than the national average. Do you have any opinion about why those groups are using the ED in greater proportion? Do you have a high percentage of those age groups in your practice? 13. What do you believe are the most frequent reasons that patients use the local hospital ED for non‐emergency reasons? Do you think this is a problem in your community?

14. What factors do you believe would reduce or prevent unnecessary ED use? Probes – more PCPs, more urgent care facilities at hospital, extended hours by PCPs, better chronic disease management, greater availability of home care services. 15. Is there anything unique about your community that might be affecting ED use rates?

ED Study Provider (P)/Hospital Administrator (A) Interview Questions I. Background 1.What is your position in the hospital, how long have you worked in this ED/hospital; what other ED experiences have you had? (A/P) 2.Describe ED staffing – number of physicians, nurses, midlevels, other staff; any idea of the volume of ED visits? Have there been any changes in staffing, resources devoted to ED in recent years? (A/P) 3. What are the peak times and days of ED use (P). 4. Please describe the hospital protocol for triage (P). II. ED utilization 1. We are interested in the non‐emergent use of EDs in Maine. Do you have any opinion about non‐emergency use of the ED at your hospital? Do you think it has increased in the last two years, stayed about the same, or decreased? What do you think are the primary reasons for non‐emergency visits at the ED: (A/P) Probes: i. not enough PCPs in the community
ii. inability to schedule visits with PCP s (long waits or no extended hours) iii. no or not enough urgent care resources in community, iv. perception that ER provides better care than doctor’s office v. perception that ER is same as a primary care clinic.
2. Which would you say has greater impact on your ED service, high numbers of infrequent or one‐time users, or a small number of frequent users? 3. How would you define a frequent user of your ED in terms of number of visits per year? Are there diagnoses that are typical of the frequent users? Do you think that the number and kind of frequent users has changed over the last year or two? Do you believe chronic ED users are a significant population in your ED? (A/P) 4. What kind of data does the hospital collect around ED use? Is data regularly collected around volume, patterns, amount of outpatient care, number of admissions from ED, DX. How often does this data get reviewed and how is data used? (A/P) 5. Our ED study showed that Maine shows a much higher rate of ED use among infants and 19‐24 year olds compared to the national average. Why do you believe that those groups are visiting EDs in Maine in greater proportion than the national average? Does that pattern reflect your hospital’s experience? (P)

6. Are you aware of whether patients you see in the ED have a PCP? If so, what do you estimate is the percentage of ED patients with PCPs? How do you communicate, if at all, with PCPs regarding their patient’s use of the ED? (P) 7. Do you believe that many ED patients look upon the ED as a place to receive primary care services? (A) 8. Please comment on the frequency of patients coming to the ED with the following problems. (A/P)
1. oral health problems 2. prescription refills 3. mental health problems 4. common childhood conditions typically seen in a PCP office
9. Do you ever hear the following comments from your patients in the ED; if so how frequently (P)
a. I’m here because I can’t get in to see my PCP b. I don’t have any other provider c. I’d rather come to the ED than see my PCP III. Community and Hospital Resources 1. Do you think there is anything unique about your community/hospital and its ED use, compared with other Maine hospitals and communities? (A/P) 2. Are you aware of any policies of the medical practices in your community about referring patients to the ED? Does the hospital have guidelines for hospital‐owned practices regarding referrals to the ED and arrangements for after hours care? (A) 3. Has the hospital has undertaken any actions to address non‐emergency use of ED? If so, what are they? What have been the results? (A) 4. What do you think are the strategies that would reduce or prevent non‐emergent use of the ED: Probes: 1. More ED resources 2. More urgent care facilities 3. Extended hours/weekend hours for PCP 4. More PCPs better access to health care 5. Better health promotion about alternative resources 6. Patient education 7. higher copays (A/P)

Focus Group Discussion Guide
2/4/2010
Introduction (10 minutes) Thank you for joining us today. I’m Danny Westcott from the Muskie School at the University of Southern Maine. I’m the moderator for today’s discussion and part of the team looking into emergency room use in Maine communities. My goal is to learn from you what you’ve experienced getting medical care for yourself, someone in your family or someone you know well. Let me introduce [NAME], s/he is here to help and will take notes. Some background information--In an earlier study, we learned that Maine has a higher emergency room use than other states. The Department of Health and Human Services in Augusta is funding this research project because it’s interested in where people go for health care and why.
Again, thanks for being here. We really appreciate your help in finding the answer to this question: Where do you go for health care in your area and why? Before we begin, I’d like to take a moment to say a few things. • Our discussion will last approximately 90 minutes. We should be done by [Time]. • It’s very important to stay for the entire discussion. Does anyone have to leave early? • If you need to use the restroom or get a drink during the discussion, please feel free to do so. The
bathrooms are (give directions). Water and snacks are over there (point). • We will only use first names when we talk with each other. If it’s OK with you, please write your
first name—or the name you like to be called—on the card and put it on the table in front of you. If you’d rather not, that’s fine.
• I ask that you not talk with anyone about our discussion outside of this room. It’s important for you to know that people working on the project, including me, will not give your name to anyone or share any personal information about you.
• Your participation is voluntary. You can leave at any time if you want to. • With your permission, we will tape record this session to make sure we don’t miss anything you’ve
said. [Name] will be assisting me by taking notes. When we type up our notes and the discussion that’s recorded on tape, we will delete your names. We will also destroy the tape after it is transcribed.
• Please speak clearly, one at a time, so that we hear each other and the tape recorder can pick up each voice.
• Please remember that while we have asked everyone here to respect each other’s privacy and not share anything said here with anyone else, we can’t guarantee that this will happen.
• The findings of this discussion will be included in a report to the Department of Health and Human Services about use of emergency rooms in various parts of the state. If you’d like a summary of the report, please email Beth Kilbreth at [email protected] or call Danny Westcott at 228-8038. We hope that the report will finished in the fall.
• And finally, as a thank you for your thoughts, time and travel, we will give you a gift card for $50 when you leave.

Focus Group Discussion Guide
2/4/2010
Consent to Participate (5 minutes) I believe that consent forms were sent to you so you could read them before you got here. In case you didn’t get one or didn’t bring the form with you, I have another one here. Please read it and if, after thinking about it, you want to take part in today’s discussion, please sign it and date it. Thanks, are there any questions I can answer before we start? Focus Group Questions (45 min) Ice Breaker
1. Please tell us your first name, where you live, and what you like most about summertime.
Introductory Question:
2. Tell me about the kinds of places that you can go to get medical care in your area.
Transition: 3. Now think for a moment about the last time you went to an emergency room.
Key Questions:
4. Was the ER the first place you contacted about the medical care you needed? Y/N 5. What are some of the reasons you went to the emergency room? 6. How long had you been dealing with this issue before going to the emergency room?
7. Do you think your care could have taken place somewhere other than in the emergency
room? Y/N 8. What made it difficult for you to get care somewhere else?
after office hours no longer eligible for MaineCare/uninsured prescription
refill/primary not available can’t get appointment that day-need referral
told to go there couldn’t take off work /lose pay? transportation problem
can’t find doctor who’ll take MaineCare child care problem

Focus Group Discussion Guide
2/4/2010
**FU Q. Of all these you’ve mentioned, which problem is the most difficult one you faced.
9. You’ve already talked about this some but to be sure it’s clear, what kinds of places are
available for getting health care in this area?
doctor’s office (family practice/primary care physician) walk-in clinic ER dentist’s office
10. Are these places available when you need them? For instance, if you, a family member or
someone you know well is sick in the evening or on a weekend, who would you contact? FU Q: When you saw your doctor, did the doctor tell you what you should do in case you need to see someone? [Hypothetical scenarios could be asked here – see addendum]
Transition:
11. Now, I’d like to talk about family doctors and other places you can go for regular care. Do you have a family doctor or a regular doctor who you see for routine care? If you don’t have a doctor right now, think about a time when you did have a doctor. Y/N
12. If you have a family doctor or a place to go for routine care, did you contact them before going to the emergency room? Y/N
Key questions:
13. If you call the doctor because you are sick, how long do you typically have to wait for an
appointment? 14. Does your doctor have someone on call if you need help after business hours? 15. You’ve already talked about this some, but to be sure it’s clear, are there other problems you
have getting medical care from your doctor?
hard to get a referral hard to get a telephone consult don’t like doctor Transition:
16. For this last set of questions, I’d like to talk about things like walk-in clinics or urgent care
centers—places you can go to get outpatient health care without an appointment. Do you have any of these places in this area? Y/N
Key questions:
17. What do you like about these places? 18. And what do you dislike about them?

Focus Group Discussion Guide
2/4/2010
Closing question:
19. You talked about [cite examples] as being some of the reasons you went to the ER rather than to your regular doctor or walk-in clinic. For you, what is the most important change that Maine could make so you could get the care you need somewhere else?
paid sick leave child care transportation other health system improvements 20. On a scale of 1-5, how would you rate access to non-emergency care available in your area?
1 = not good, 3 = OK, 5 =excellent
For example, # options, convenience, quality
21. Is there anything I’ve missed? Many thanks again for your time and participation. The things you talked about today will be very helpful to us. Addendum: Hypothetical Scenarios A. It’s Monday at 5:00 PM and your baby is crying and fussing with a fever of 101 degrees. Do you
have a doctor or nurse you can call? B. It’s Friday at 5:00 PM and your back pain isn’t getting any better. You have already been out of
work one day because of the pain, and aspirin has not made it any better. C. You have been out of work for two days with a fever and a bad sore throat. Aspirin has helped with
the fever, but the fever still comes back. You feel like you’re getting worse and not better.

APPENDIX 2.
Analysis Support Documents Matrix


National State Caribou (Aroostook) Calais (Washington) Lewiston (Androscoggin)
Bangor (Penobscot, Hancock)
Farmington (Franklin, Somerset)
Damariscotta (Lincoln)
High or Low ED UseHigh High High Low Low Low National State
County (by county,
unless noted)Rural or Urban Rural Rural Urban Urban Rural Rural
Pop (2008 census) 304,059,724 1,316,456 71,676 32,499 106,877 201,788 81,234 34,628 2008Census
2008Census
2008Census
Pop (2006 census) 298,754,819 1,314,910 72,122 32,778 107,031 201,316 81,382 34,806 2006Census
2006Census
2006Census
Population by HSA (2005)
N/A N/A 17,057 12,867 121,611 131,548 33,874 12,082 N/A N/ABy HSA
Maine Quality Forum
Pop per square mile (2000 census)
79.6 (2000)
86 (2008)
41.3 (2000)
43 (2008)11.1 13.2 220.8 Hancock- 32.6
Penobscot - 42.7Franklin-17.4Somerset-13 73.7 2008
Census2008
Census2000
Census
Pop living below poverty (2007 census) 13% 12.2% 17.4% 20.1% 14.1% H-9.9%
P-13.5%F-16%
S-17.2% 10.8% 2007Census
2007Census
2007Census
Unemployment Rate
4.6% 4.0% 6.0% 5.7% 4.3%
H-3.4%P-4.8%
F-5.4%S-5.5% 3.4%
2006Maine DOL Center for Workforce
Research and Information - not
seasonally adjusted
2006Maine DOL Center for Workforce
Research and Information - not
seasonally adjusted
2006as of 8/06
Maine DOL Center for Workforce
Research and Information - not seasonally
adjusted
11.9% (2006 18-64) 12.3% 16.6% 19.1% 12.0% H-10.4%P 12 8%
F-16.9%S 16 9% 11.0%
2006Census
2005Margaret Chase
Smith Policy Center UMaine
2005Margaret Chase
Smith Policy Center UMaine
Employment
Years and Source
Population
Poverty rate adult
( ) P-12.8% S-16.9% Maine DOL Center UMaine, Poverty in Maine
(2008)
Center UMaine, Poverty in
Maine (2008)
Poverty rate child (0-17 years)
18.3% (2006) 16.7% 22.3% 28.4% 18.1% H-15.5%P-15.3%
F-22.3%S-25.3% 16.2%
2006Census
Maine DOL
2005Margaret Chase
Smith Policy Center UMaine, Poverty in Maine
(2008)
2005Margaret Chase
Smith Policy Center UMaine,
Poverty in Maine (2008)
under 1927% 24% 21% 22% 24% 22% 23% 20%
2006Census
(19 and under)
2006Census
(19 and under)
2005CensusCHSR
19-6460% 61% 61% 60% 62% 64% 63% 62%
2006Census (20-64)
2006Census (20-64)
2005CensusCHSR
65-8411% 13% 15% 15% 12% 13% 12% 16% 2006
Census2006
Census
2005CensusCHSR
85+2% 2% 2% 3% 2% 2% 2% 3% 2006
Census2006
Census
2005CensusCHSR
Ages
Insurance Coverage

National State Caribou (Aroostook) Calais (Washington) Lewiston (Androscoggin)
Bangor (Penobscot, Hancock)
Farmington (Franklin, Somerset)
Damariscotta (Lincoln)
High or Low ED UseHigh High High Low Low Low National State
County (by county,
unless noted)Rural or Urban Rural Rural Urban Urban Rural Rural
Years and Source
Uninsured
45,657,200 (2007) 118,900 (2007) 7,914 3,832 7,792
H - 6,860P - 16,144
Total=23,004
F-3,064S-5,895
Total=8,959
4,810 2007Census
2007Census
2006Census Small Area Health Insurance Estimates
(SAHIE) (<age 65)
Uninsured Percentage (#/population) 2007 state/national; 2006 county
15% 9% 11% 12% 7% 11% 11% 14%
Calculation based on 2007
population Census
Calculation based on 2007
population Census
Calculation based 2006 population
Census
Medicare Elderly
35224339 189,693 12,866 6,233 14,403
H- 8,878P-20,616
Total=29,494
F-4,662S-7,048
Total=11,710
6,6652006
CMS - as of 7/06
2006CMS - as of 7/06
2007CMS - as of
7/07
Medicare Elderly Pecentage 2006 state/ 2007 county
12% 14% 18% 19% 13% 15% 14% 19%
Calculation based on 2006
population Census
Calculation based on 2006
population Census
Calculation based on 2007
population Census
Medicare Disabled
6,689,118 48,309 4,118 1,499 4,934
H-1,620P-7,060
Total=8,680
F-1,233S-2,470
Total=3,703
1,0412006
CMS - as of 7/06
2006CMS - as of 7/06
2007CMS - as of
7/07
Medicare Disabled Percentage 2006 state / 2007 county
2% 4% 6% 5% 5% 4% 5% 3%
Calculation based on 2006
population Census
Calculation based on 2006
population Census
Calculation based on 2007
population Census2007 county Census p p Census
Medicaid
39,296,400 316,947 6,006 4,094 34,705 34,322 9,755 2,263
2007Census
Kaiser Family Foundation
(KFF)
CY2008 based on claims data
By HSACY2008 based on claims data
Medicaid Percentage 2008 (2007 national)
13% 24% 35% 32% 29% 26% 29% 19%
Calculation based on 2007
population Census
Calculation based on 2008
population Census
Calculation based on 2007
HSA population
Private
173,853,200 588,058 5,378 3,543 56,085 57,482 11,947 4,3532007
CensusKFF
2006 claims analysis
commercialaverage members
(member months/12)
By HSA2006
claims analysiscommercial
average members (member
months/12)
Private Percentage 2006
58% 45% 32% 28% 46% 44% 35% 36%
Calculation based on 2007
population Census
Calculation based on 2006
population Census
Calculation based on 2007
HSA population
Death
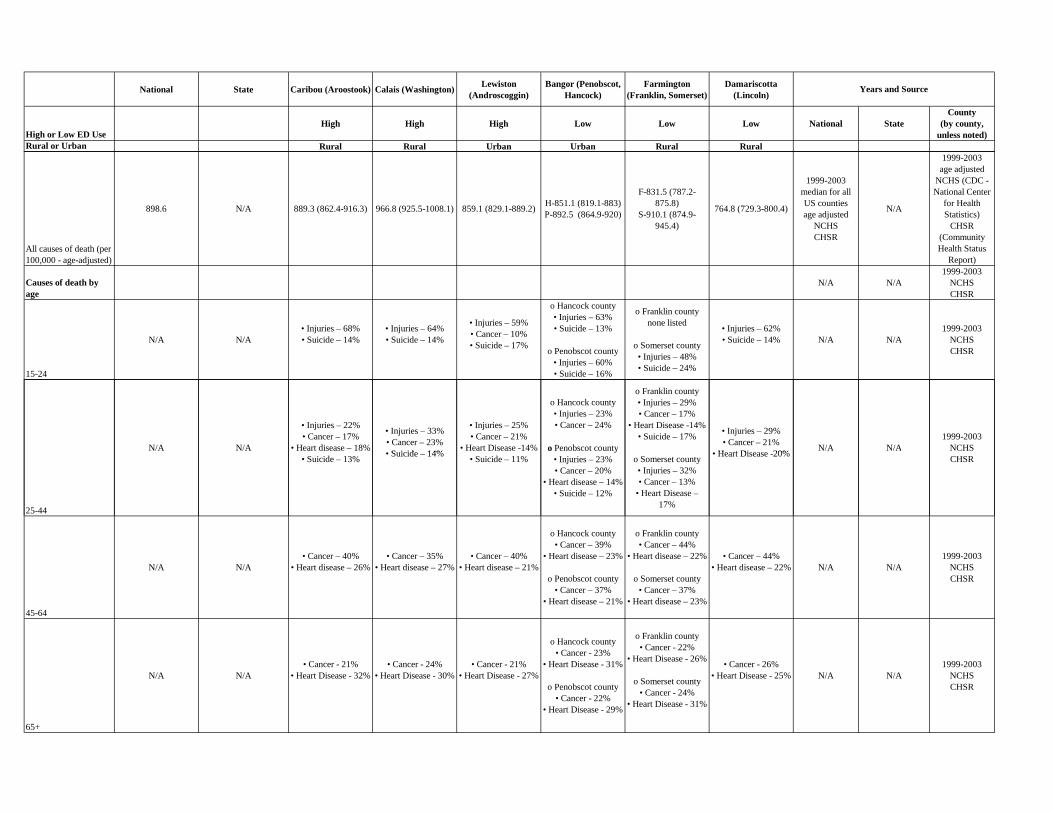
National State Caribou (Aroostook) Calais (Washington) Lewiston (Androscoggin)
Bangor (Penobscot, Hancock)
Farmington (Franklin, Somerset)
Damariscotta (Lincoln)
High or Low ED UseHigh High High Low Low Low National State
County (by county,
unless noted)Rural or Urban Rural Rural Urban Urban Rural Rural
Years and Source
All causes of death (per 100,000 - age-adjusted)
898.6 N/A 889.3 (862.4-916.3) 966.8 (925.5-1008.1) 859.1 (829.1-889.2) H-851.1 (819.1-883)P-892.5 (864.9-920)
F-831.5 (787.2-875.8)
S-910.1 (874.9-945.4)
764.8 (729.3-800.4)
1999-2003median for all US countiesage adjusted
NCHSCHSR
N/A
1999-2003age adjusted
NCHS (CDC - National Center
for Health Statistics)
CHSR (Community Health Status
Report)
Causes of death by age
N/A N/A1999-2003
NCHSCHSR
15-24
N/A N/A• Injuries – 68%• Suicide – 14%
• Injuries – 64%• Suicide – 14%
• Injuries – 59%• Cancer – 10%• Suicide – 17%
o Hancock county• Injuries – 63%• Suicide – 13%
o Penobscot county• Injuries – 60%• Suicide – 16%
o Franklin countynone listed
o Somerset county• Injuries – 48%• Suicide – 24%
• Injuries – 62%• Suicide – 14% N/A N/A
1999-2003NCHSCHSR
N/A N/A
• Injuries – 22%• Cancer – 17%
• Heart disease – 18%
• Injuries – 33%• Cancer – 23%• Suicide 14%
• Injuries – 25%• Cancer – 21%
• Heart Disease -14%
o Hancock county• Injuries – 23%• Cancer – 24%
o Penobscot county
o Franklin county• Injuries – 29%• Cancer – 17%
• Heart Disease -14%• Suicide – 17% • Injuries – 29%
• Cancer – 21%• Heart Disease 20% N/A N/A
1999-2003NCHS
25-44
• Suicide – 13% • Suicide – 14% • Suicide – 11%y
• Injuries – 23%• Cancer – 20%
• Heart disease – 14%• Suicide – 12%
o Somerset county• Injuries – 32%• Cancer – 13%
• Heart Disease – 17%
• Heart Disease -20% CHSR
45-64
N/A N/A• Cancer – 40%
• Heart disease – 26%• Cancer – 35%
• Heart disease – 27%• Cancer – 40%
• Heart disease – 21%
o Hancock county• Cancer – 39%
• Heart disease – 23%
o Penobscot county• Cancer – 37%
• Heart disease – 21%
o Franklin county• Cancer – 44%
• Heart disease – 22%
o Somerset county• Cancer – 37%
• Heart disease – 23%
• Cancer – 44%• Heart disease – 22% N/A N/A
1999-2003NCHSCHSR
65+
N/A N/A• Cancer - 21%
• Heart Disease - 32%• Cancer - 24%
• Heart Disease - 30%• Cancer - 21%
• Heart Disease - 27%
o Hancock county• Cancer - 23%
• Heart Disease - 31%
o Penobscot county• Cancer - 22%
• Heart Disease - 29%
o Franklin county• Cancer - 22%
• Heart Disease - 26%
o Somerset county• Cancer - 24%
• Heart Disease - 31%
• Cancer - 26%• Heart Disease - 25% N/A N/A
1999-2003NCHSCHSR

National State Caribou (Aroostook) Calais (Washington) Lewiston (Androscoggin)
Bangor (Penobscot, Hancock)
Farmington (Franklin, Somerset)
Damariscotta (Lincoln)
High or Low ED UseHigh High High Low Low Low National State
County (by county,
unless noted)Rural or Urban Rural Rural Urban Urban Rural Rural
Years and Source
Infant Mortality (deaths per 1000 live births)
6.8 5.5 4.9 3.9 4.1 H-4.4P-5.6
F-5.1S-4.4 4.2
2001-2005 Maine CDC
report (2008)
2001-2005 Maine CDC report
(2008)
1999-2003NCHSCHSR
Breast Cancer (Female)
24.5 (24.4,24.6) 23.4 (21.9,24.9) 17.8 (12.0,23.9) 26.2 (17.5, 38.1) 27.6 (22.2,33.9) H-25.9 (19.0,34.8)P-28.3 (23.6,33.8)
F-28.5 (18.5,42.4)S-19.3 (13.3,27.4) 20.3 (13.3,30.2)
2002-2006 National Vital
Statistics public use data file; calculated by
National Cancer Institute
2002-2006 National Vital
Statistics public use data file; calculated by
National Cancer Institute
2002-2006 National Vital
Statistics public use data file; calculated by
National Cancer Institute
Colon and Rectum Cancer
18.2 (18.1,18.3) 18.7 (17.8,19.7) 22.9 (18.8, 27.6) 24.2 (18.2,31.7) 16.0 (13.0,19.5) H-18.9 (14.6,24.2)P-18.2 (15.3,21.4)
F-22.7 (15.9,31.4)S-17.8 (13.3,23.3) 15.5 (11.1,21.4)
2002-2006 National Vital
Statistics public use data file; calculated by
National Cancer Institute
2002-2006 National Vital
Statistics public use data file; calculated by
National Cancer Institute
2002-2006 National Vital
Statistics public use data file; calculated by
National Cancer Institute
172
211.1 (2005)182.7 (2005) 209.3 191.7 150.6 H-179.1
P-164.4F-136.9S-184.9 124.4
1999-2003NCHSCHSR
2005 Maine CDC Burden of
Chronic Disease Report
2005 Maine CDC
Burden of Chronic Disease Report ("diseases of the
heart")
1999-2003NCHSCHSR
Death measures - causes of death ( age adjusted to year 2000 standard; per 100,000 pop)
Coronary Heart Disease
Report ("diseases of the
heart")
heart")
Lung and Bronchus Cancer
53.4 (53.3,53.5) 61.9 (60.1,63.7) 64.4 (57.5,72.0) 75.7 (64.8,88.1) 66.4 (60.1,73.3) H-58.3 (50.5,67.1)P-65.9 (60.4,71.8)
F-50.7 (40.5,62.7)S-69.3 (60.3,79.4) 57.2 (48.2,67.6)
2002-2006 National Vital
Statistics public use data file; calculated by
National Cancer Institute
2002-2006 National Vital
Statistics public use data file; calculated by
National Cancer Institute
2002-2006 National Vital
Statistics public use data file; calculated by
National Cancer Institute
Motor Vehicle Injury
14.8 13.8 (+/-0.9) 18.8 23.5 15.4 H-15.4P-14.7
F-16S-21.1 18.1
1999-2003NCHSCHSR
2001-2005 Maine CDC
Health Indicator Report
1999-2003NCHSCHSR
Stroke
53 42.8 (2005) 57.8 68.8 53.2 H-59.9P-64
F-62.1S-54.5 45.6
1999-2003NCHSCHSR
2005 Maine CDC
Burden of Chronic Disease Report
1999-2003NCHSCHSR
Suicide
10.8 13.9 (+/-1) 11 14.9 8.2 H-9.8P-13.7
F-13.1S-14.7 9.5
1999-2003NCHSCHSR
2001-2005ages 10+
Maine CDC Health Indicator
Report
1999-2003NCHSCHSR

National State Caribou (Aroostook) Calais (Washington) Lewiston (Androscoggin)
Bangor (Penobscot, Hancock)
Farmington (Franklin, Somerset)
Damariscotta (Lincoln)
High or Low ED UseHigh High High Low Low Low National State
County (by county,
unless noted)Rural or Urban Rural Rural Urban Urban Rural Rural
Years and Source
Unintentional Injury
37.3 41.1 (2005) 14.9 26.9 18.8 H-26.5P-19.6
F-20.8S-24.3 20.9
1999-2003NCHSCHSR
2005 Maine CDC
Burden of Chronic Disease Report
1999-2003
Adult depression (moderate/severe)
N/A 7.6% (+/-1) 5.8% (+/-3.3)7.8% (=/-3.1) (Washington,
Hancock)
5.6% (=/-2)(Franklin, Oxford,
Androscoggin)
13.3% (+/-3.9) (Penobscot, Piscataquis)
5.6% (=/-2)(Franklin, Oxford,
Androscoggin)
6.1% (+/-2.2) (Lincoln, Sagadahoc,
Knox, Waldo)N/A
2004-2006Maine CDC
Health Indicator Report
2004-2006Maine CDC
Health Indicator Report
Substance Abuse Admissions (all ages) per 100,000
N/A 1320 12751141
(Washington, Hancock)
901(Franklin, Oxford,
Androscoggin)
1391 (Penobscot, Piscataquis)
901 (Franklin, Oxford,
Androscoggin)
878(Lincoln, Sagadahoc,
Knox, Waldo)N/A
2006BRFSS
Maine CDC District Health Profle (2007)
2006BRFSS
Maine CDC District Health Profle (2007)
Recent Drug Users (within past month) N/A N/A 5335 2403 7959 H-3901
P-11537F-2426S-3713 2501 N/A N/A 2005
CHSR
Recent Drug Users (within past month)
8.1% 9.6% (8.31-11.08) 7% 7% 7% 8% 8% 7% 2006-2007SAMHSA
2006-2007SAMHSA
Calculation based on 2005
population Census
Have Major Depression N/A N/A 5275 2389 7549 H-3883P-10453
F-2116S-3653 2574 N/A N/A 2005
CHSR
Have Major Depression
7.65% 8.98% (7.03-11.40) 7% 7% 7% 7% 7% 7% 2004-2005SAMHSA
2004-2005SAMHSA
Calculation based on 2005
population Census
Health Statistics
Substance Abuse and Mental Illness
Smokers
20.1 21% (+/- 1.6) 24.3% 27.5% 24.7% H-22.5%P-24.5%
F-20.1%S-26.5% 17.2%
2006adults
Maine CDC Health Indicator
Report
2006adults
Maine CDC Health Indicator
Report
2000-2007CDC BRFSS
CHSR
Obesity
34% 25.2% 15.4% 25.0% 24.6% H-17.7%P-22.6%
F-22%S-23.2% 16.8% 2005-2006
NCHS
2008obese ages 20+
CDC US Obesity Trends - BRFSS
2000-2007CDC BRFSS
CHSR
High Blood Pressure
32% 25.4% (+/-1.6) 24.6% 32.4% 25.1% H-15.1%P-23.5%
F-24.6%S-29.8% 27.7%
2003-2006ages 20+
Health United States (2008)
2005Maine CDC
Health Indicator Report
2000-2007CDC BRFSS
CHSR
Diabetes
10% 7.3 (+/-0.6) 10.0% 6.6% 6.7% H-5.8%P-8.5%
F-9.3%S-9.8% 4.3%
2003-2006diagnosed & undiagnosed
Health United States (2008)
2004-2006adults
Maine CDC Health Indicator
Report
2000-2007CDC BRFSS
CHSR
High Cholesterol
16% 36.4 %(+/-2) 29.3% (includes Caribou - VanBuren) 31.3% 28.5% 27.9% 28.2% 27.7%
2003-2006ages 20+
Health United States (2008)
2005adults
Maine CDC Health Indicator
Report
By HSAMaine Quality Forum Charts
Health Statistics
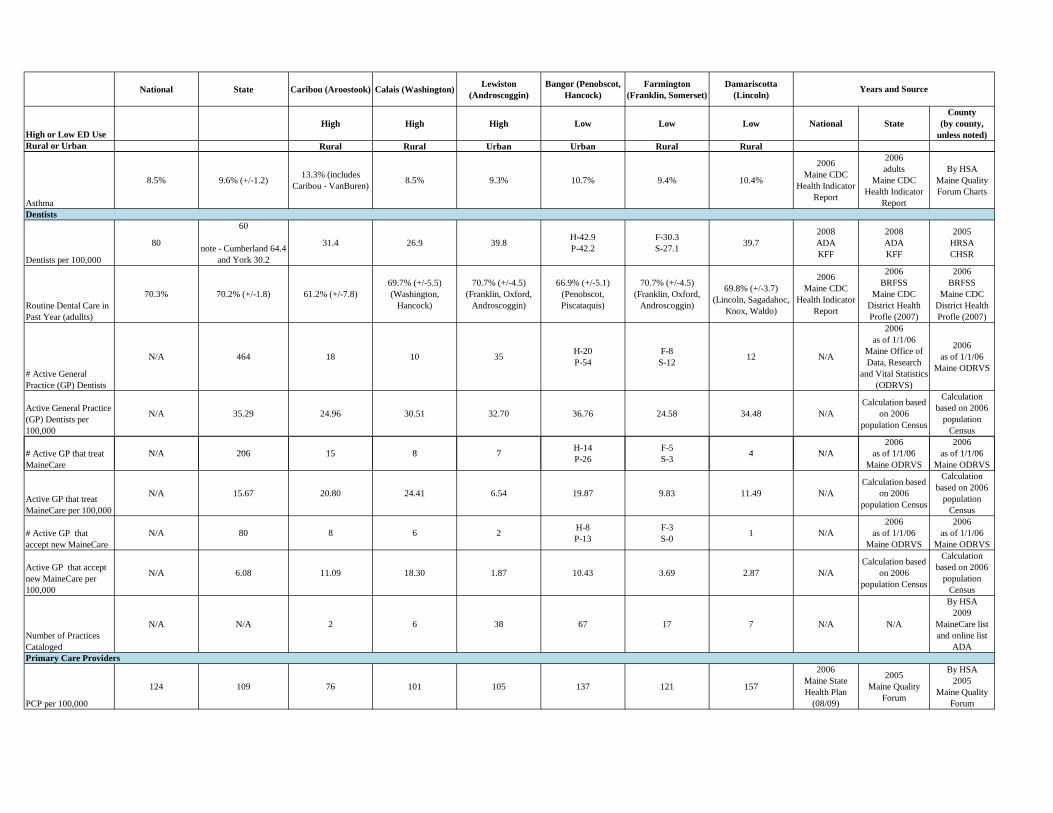
National State Caribou (Aroostook) Calais (Washington) Lewiston (Androscoggin)
Bangor (Penobscot, Hancock)
Farmington (Franklin, Somerset)
Damariscotta (Lincoln)
High or Low ED UseHigh High High Low Low Low National State
County (by county,
unless noted)Rural or Urban Rural Rural Urban Urban Rural Rural
Years and Source
Asthma
8.5% 9.6% (+/-1.2) 13.3% (includes Caribou - VanBuren) 8.5% 9.3% 10.7% 9.4% 10.4%
2006Maine CDC
Health Indicator Report
2006adults
Maine CDC Health Indicator
Report
By HSAMaine Quality Forum Charts
Dentists per 100,000
80
60
note - Cumberland 64.4 and York 30.2
31.4 26.9 39.8 H-42.9P-42.2
F-30.3S-27.1 39.7
2008ADAKFF
2008ADAKFF
2005HRSACHSR
Routine Dental Care in Past Year (adullts)
70.3% 70.2% (+/-1.8) 61.2% (+/-7.8)69.7% (+/-5.5)(Washington,
Hancock)
70.7% (+/-4.5)(Franklin, Oxford,
Androscoggin)
66.9% (+/-5.1)(Penobscot, Piscataquis)
70.7% (+/-4.5)(Franklin, Oxford,
Androscoggin)
69.8% (+/-3.7)
(Lincoln, Sagadahoc, Knox, Waldo)
2006Maine CDC
Health Indicator Report
2006BRFSS
Maine CDC District Health Profle (2007)
2006BRFSS
Maine CDC District Health Profle (2007)
# Active General Practice (GP) Dentists
N/A 464 18 10 35 H-20P-54
F-8S-12 12 N/A
2006as of 1/1/06
Maine Office of Data, Research
and Vital Statistics (ODRVS)
2006as of 1/1/06
Maine ODRVS
Active General Practice (GP) Dentists per 100,000
N/A 35.29 24.96 30.51 32.70 36.76 24.58 34.48 N/ACalculation based
on 2006 population Census
Calculation based on 2006
population Census
# Active GP that treat N/A 206 15 8 7 H-14 F-5 4 N/A2006
as of 1/1/062006
as of 1/1/06
Dentists
# Active GP that treat MaineCare
N/A 206 15 8 7 P-26 S-3 4 N/A as of 1/1/06Maine ODRVS
as of 1/1/06Maine ODRVS
Active GP that treat MaineCare per 100,000
N/A 15.67 20.80 24.41 6.54 19.87 9.83 11.49 N/ACalculation based
on 2006 population Census
Calculation based on 2006
population Census
# Active GP that accept new MaineCare
N/A 80 8 6 2 H-8P-13
F-3S-0 1 N/A
2006as of 1/1/06
Maine ODRVS
2006as of 1/1/06
Maine ODRVS
Active GP that accept new MaineCare per 100,000
N/A 6.08 11.09 18.30 1.87 10.43 3.69 2.87 N/ACalculation based
on 2006 population Census
Calculation based on 2006
population Census
Number of Practices Cataloged
N/A N/A 2 6 38 67 17 7 N/A N/A
By HSA2009
MaineCare list and online list
ADA
PCP per 100,000
124 109 76 101 105 137 121 157
2006Maine State Health Plan
(08/09)
2005Maine Quality
Forum
By HSA2005
Maine Quality Forum
Primary Care Providers

National State Caribou (Aroostook) Calais (Washington) Lewiston (Androscoggin)
Bangor (Penobscot, Hancock)
Farmington (Franklin, Somerset)
Damariscotta (Lincoln)
High or Low ED UseHigh High High Low Low Low National State
County (by county,
unless noted)Rural or Urban Rural Rural Urban Urban Rural Rural
Years and Source
Specialists per 100,000
N/A N/A 45.06 38.87 67.57 H-50.32P-95.19
F-30.3S-34.84 59.59 N/A N/A
2005BRFSS
Supplement (2006)
Number of Practices Cataloged
N/A N/A 7 8 35 34 15 5 N/A N/A
By HSA2009
MaineCare list and online list
MMA
# School Based Health Centers
1709 27 0 2 (Calais Mid/HS)
8 (Lewiston Mid/HS; Auburn Mid/HS;
Monmouth Elem/Mid/HS;
Livermore Elem)
2 (Brewer Mid/HS)5 (Dental outreach to Livermore Mid/HS; Jay Elem/Mid/HS)
3 (SAU #74 Schools Elem/Lincoln
Academy HS/Matanawcook
Academy)
2004-2005National
Assembly on School-Based Health Care
2009Maine Assembly on School-Based
Health Care (2009)
Maine Children's Alliance (2009)
By HSA2009
Maine Assembly on School-
Based Health Care (2009)
Maine Children's
Alliance (2009)
2009Maine DHHS OMHS Mental
Health Resources (includes
By HSA2009
Maine DHHS OMHS Mental
Health Resources (includes
counseling
Resources
# Mental Health Agencies
N/A 293 3 3 21 18 10 3 N/A (includes counseling, crisis, residential, leisure, medication clinic,
etc.) Count by agencies in each
town.
counseling, crisis,
residential, leisure,
medication clinic, etc.) Count by
agencies in each town.
# Mental Health Agencies - Crisis Services
N/A 32 1 0 1 3 1 0
2009Maine DHHS OMHS Mental
Health Resources Count by agencies
in each town.
2009Maine DHHS OMHS Mental
Health Resources Count by
agencies in each town.
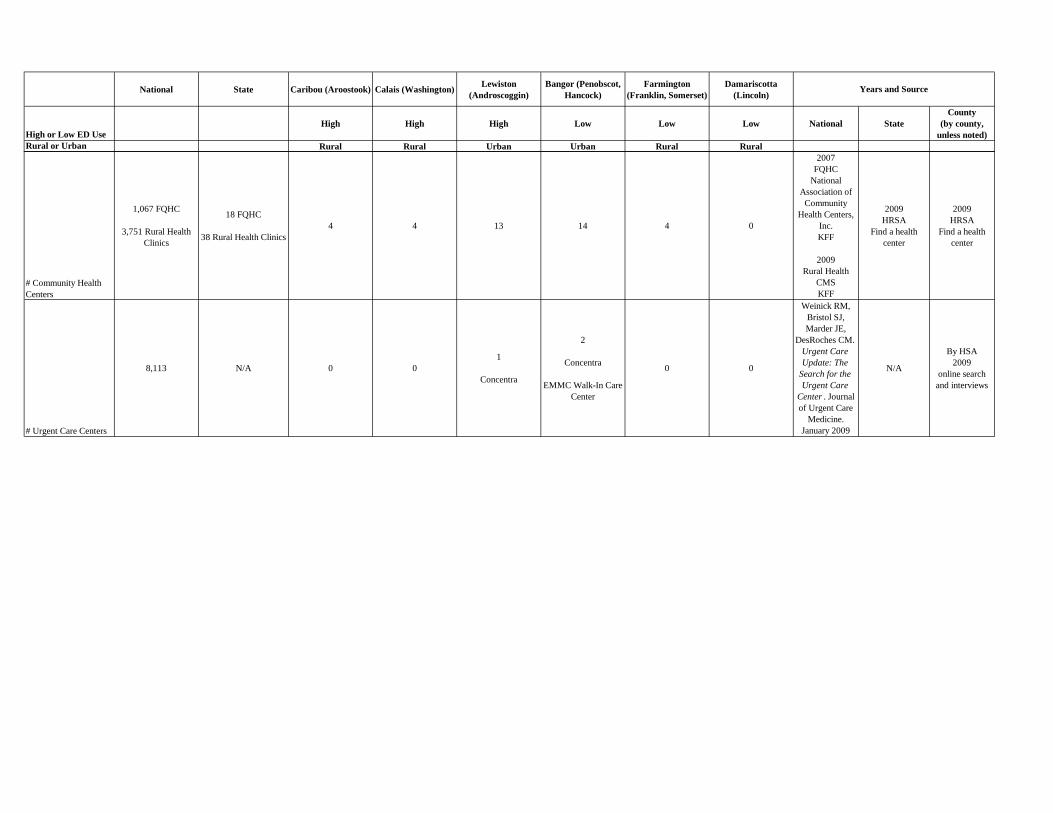
National State Caribou (Aroostook) Calais (Washington) Lewiston (Androscoggin)
Bangor (Penobscot, Hancock)
Farmington (Franklin, Somerset)
Damariscotta (Lincoln)
High or Low ED UseHigh High High Low Low Low National State
County (by county,
unless noted)Rural or Urban Rural Rural Urban Urban Rural Rural
Years and Source
# Community Health Centers
1,067 FQHC
3,751 Rural Health Clinics
18 FQHC
38 Rural Health Clinics4 4 13 14 4 0
2007FQHC
National Association of
Community Health Centers,
Inc.KFF
2009Rural Health
CMSKFF
2009HRSA
Find a health center
2009HRSA
Find a health center
# Urgent Care Centers
8,113 N/A 0 01
Concentra
2
Concentra
EMMC Walk-In Care Center
0 0
Weinick RM, Bristol SJ, Marder JE,
DesRoches CM. Urgent Care Update: The
Search for the Urgent Care
Center . Journal of Urgent Care
Medicine. January 2009
N/A
By HSA2009
online search and interviews

2010 Maine Hospital Emergency Department Use Statewide for Selected Age Groups Requested by Payer: Top 30 Outpatient Emergency Department
Volume
For this report the top 30 volume diagnoses in total and the top 30 diagnosis within each payer type were determined.
Age Group Payer Diagnosis Description Outpatient Emergency Department
Visits
Emergency Department
Visits Resulting in
Inpatient Hospitalization
<1 Commercial UNSPECIFIED OTITIS MEDIA 366 0 <1 Commercial ACUTE URIS OF UNSPECIFIED SITE 302 7 <1 Commercial FEVER 251 7 <1 Commercial UNSPEC VIRAL INF CCE & UNS SITE 120 4 <1 Commercial CONTUS FACE SCALP&NECK EXCEPT EYE 88 0 <1 Commercial VOMITING ALONE 78 0 <1 Commercial ACUT BRONCHIOLITIS-OTH INF ORGNSMS 68 8 <1 Commercial CROUP 67 3 <1 Commercial FUSSY INFANT 55 0 <1 Commercial UNSPECIFIED CONJUNCTIVITIS 54 0 <1 Commercial COUGH 51 0 <1 Commercial UNS NONINF GASTROENTERIT&COLITIS 48 1 <1 Commercial HEAD INJURY, UNSPECIFIED 47 0 <1 Commercial OBSERVATION FOLLOWING OTH ACCIDENT 39 0 <1 Commercial OBSERVATION OTH SPEC SUSPECTED COND 39 0 <1 Commercial PNEUMONIA, ORGANISM UNSPECIFIED 30 4 <1 Commercial RASH&OTH NONSPECIFIC SKIN ERUPTION 26 0 <1 Commercial DIARRHEA 26 2 <1 Commercial ACUTE BRONCHIOLITIS DUE TO RSV 25 30 <1 Commercial BRONCHITIS NOT SPEC AS ACUT/CHRONIC 25 0 <1 Commercial RESPIRATORY SYNCYTIAL VIRUS 23 0 <1 Commercial UTI SITE NOT SPECIFIED 23 3 <1 Commercial FLU W/OTH RESPIRATORY MANIFESTS 22 1 <1 Commercial UNSPECIFIED CONSTIPATION 21 0 <1 Commercial INTESTINAL INF DUE OTH ORGANISM NEC 18 7 <1 Commercial CANDIDIASIS OF MOUTH 18 0 <1 Commercial UNSPECIFIED ACUTE CONJUNCTIVITIS 18 0 <1 Commercial ASTHMA, UNSPECIFIED, UNSPECIFIED 18 3 <1 Commercial FEBRILE CONVULSIONS SIMPLE UNSPEC 16 2 <1 Commercial DEHYDRATION 15 6 <1 Medicaid ACUTE URIS OF UNSPECIFIED SITE 1253 8 <1 Medicaid UNSPECIFIED OTITIS MEDIA 1126 2 <1 Medicaid FEVER 557 7 <1 Medicaid UNSPEC VIRAL INF CCE & UNS SITE 428 6 <1 Medicaid VOMITING ALONE 264 2

2010 Maine Hospital Emergency Department Use Statewide for Selected Age Groups Requested by Payer: Top 30 Outpatient Emergency Department
Volume
For this report the top 30 volume diagnoses in total and the top 30 diagnosis within each payer type were determined.
Age Group Payer Diagnosis Description Outpatient Emergency Department
Visits
Emergency Department
Visits Resulting in
Inpatient Hospitalization
<1 Medicaid UNSPECIFIED CONJUNCTIVITIS 193 0 <1 Medicaid FUSSY INFANT 192 0 <1 Medicaid UNS NONINF GASTROENTERIT&COLITIS 178 2 <1 Medicaid PNEUMONIA, ORGANISM UNSPECIFIED 158 13 <1 Medicaid ACUT BRONCHIOLITIS-OTH INF ORGNSMS 143 21 <1 Medicaid OBSERVATION OTH SPEC SUSPECTED COND 131 0 <1 Medicaid COUGH 128 0 <1 Medicaid CONTUS FACE SCALP&NECK EXCEPT EYE 126 2 <1 Medicaid CANDIDIASIS OF MOUTH 105 0 <1 Medicaid DIAPER OR NAPKIN RASH 105 0 <1 Medicaid CROUP 104 3 <1 Medicaid RASH&OTH NONSPECIFIC SKIN ERUPTION 103 0 <1 Medicaid UNSPECIFIED CONSTIPATION 91 2 <1 Medicaid DIARRHEA 86 2 <1 Medicaid HEAD INJURY, UNSPECIFIED 80 0 <1 Medicaid TEETHING SYNDROME 68 0 <1 Medicaid INTESTINAL INF DUE OTH ORGANISM NEC 65 8 <1 Medicaid BRONCHITIS NOT SPEC AS ACUT/CHRONIC 63 0 <1 Medicaid ABDOMINAL PAIN, UNSPECIFIED SITE 57 0 <1 Medicaid ACUTE BRONCHIOLITIS DUE TO RSV 54 31 <1 Medicaid UNSPECIFIED VIRAL EXANTHEM 53 0 <1 Medicaid ASTHMA, UNSPECIFIED, UNSPECIFIED 51 3 <1 Medicaid OTHER DISEASES NASAL CAVITY&SINUSES 50 0 <1 Medicaid CONTCT DERMATIT&OTH ECZEMA-UNS CAUS 50 0 <1 Medicaid ESOPHAGEAL REFLUX 48 5 <1 Medicare ACUTE URIS OF UNSPECIFIED SITE 16 0 <1 Medicare UNSPECIFIED OTITIS MEDIA 13 0 <1 Medicare FEVER 10 0 <1 Medicare DIAPER OR NAPKIN RASH 3 0 <1 Medicare FUSSY INFANT 3 0 <1 Medicare CROUP 2 0 <1 Medicare ACUT BRONCHIOLITIS-OTH INF ORGNSMS 2 0 <1 Medicare UNSPECIFIED CONSTIPATION 2 0 <1 Medicare UNSPECIFIED FETAL&NEONATAL JAUNDICE 2 0 <1 Medicare COUGH 2 0

2010 Maine Hospital Emergency Department Use Statewide for Selected Age Groups Requested by Payer: Top 30 Outpatient Emergency Department
Volume
For this report the top 30 volume diagnoses in total and the top 30 diagnosis within each payer type were determined.
Age Group Payer Diagnosis Description Outpatient Emergency Department
Visits
Emergency Department
Visits Resulting in
Inpatient Hospitalization
<1 Medicare VOMITING ALONE 2 0 <1 Medicare CONTUS FACE SCALP&NECK EXCEPT EYE 2 0 <1 Medicare OBSERVATION OTH SPEC SUSPECTED COND 2 0 <1 Medicare UNSPEC VIRAL INF CCE & UNS SITE 1 0 <1 Medicare CANDIDIASIS OF MOUTH 1 0 <1 Medicare UNSPECIFIED ACUTE CONJUNCTIVITIS 1 0 <1 Medicare OTOGENIC PAIN 1 0 <1 Medicare OTH SPEC CIRC SYSTEM DISORDERS 1 0 <1 Medicare ACUTE BRONCHITIS 1 0 <1 Medicare PNEUMONIA DUE TO RSV 1 0 <1 Medicare BRONCHITIS NOT SPEC AS ACUT/CHRONIC 1 0 <1 Medicare CNTC DERMATIT&ECZEM-FOOD CNTC-SKIN 1 0 <1 Medicare TOXIC ERYTHEMA 1 0 <1 Medicare TRANSIENT ALTERATION OF AWARENESS 1 0 <1 Medicare FEBRILE CONVULSIONS SIMPLE UNSPEC 1 0 <1 Medicare SWELLING MASS OR LUMP IN HEAD&NECK 1 0 <1 Medicare DIARRHEA 1 0 <1 Medicare ABDOMINAL PAIN, UNSPECIFIED SITE 1 0 <1 Medicare CONCUSSION WITH NO LOC 1 0
<1 Medicare OTHER SPEC OPEN WOUND OCULAR ADNEXA 1 0
<1 Other UNSPECIFIED OTITIS MEDIA 53 0 <1 Other ACUTE URIS OF UNSPECIFIED SITE 27 0 <1 Other FEVER 26 0 <1 Other CONTUS FACE SCALP&NECK EXCEPT EYE 15 0 <1 Other UNS NONINF GASTROENTERIT&COLITIS 11 0 <1 Other CROUP 9 0 <1 Other RASH&OTH NONSPECIFIC SKIN ERUPTION 9 0 <1 Other UNSPEC VIRAL INF CCE & UNS SITE 8 0 <1 Other PNEUMONIA, ORGANISM UNSPECIFIED 7 1 <1 Other COUGH 7 0 <1 Other FUSSY INFANT 6 0 <1 Other DIARRHEA 6 0 <1 Other RESPIRATORY SYNCYTIAL VIRUS 5 0 <1 Other ACUT BRONCHIOLITIS-OTH INF ORGNSMS 5 1

2010 Maine Hospital Emergency Department Use Statewide for Selected Age Groups Requested by Payer: Top 30 Outpatient Emergency Department
Volume
For this report the top 30 volume diagnoses in total and the top 30 diagnosis within each payer type were determined.
Age Group Payer Diagnosis Description Outpatient Emergency Department
Visits
Emergency Department
Visits Resulting in
Inpatient Hospitalization
<1 Other DIAPER OR NAPKIN RASH 5 0 <1 Other UNSPECIFIED CONJUNCTIVITIS 4 0 <1 Other UNSPECIFIED CONSTIPATION 4 0 <1 Other OTH SPEC CONDS ORIG PERINTL PERIOD 4 0 <1 Other VOMITING ALONE 4 0 <1 Other OBSERVATION FOLLOWING OTH ACCIDENT 4 0 <1 Other ASTHMA, UNSPECIFIED, UNSPECIFIED 3 0 <1 Other UTI SITE NOT SPECIFIED 3 0 <1 Other OBSERVATION OTH SPEC SUSPECTED COND 3 0 <1 Other INTESTINAL INF DUE OTH ORGANISM NEC 2 1 <1 Other ACUTE BRONCHIOLITIS DUE TO RSV 2 0 <1 Other PNEUMONIA DUE TO RSV 2 0 <1 Other CONTCT DERMATIT&OTH ECZEMA-UNS CAUS 2 0 <1 Other ALLERGIC URTICARIA 2 0 <1 Other FEEDING PROBLEMS IN NEWBORN 2 0 <1 Other FEEDING DIFFICULTIES&MISMANAGEMENT 2 0 <1 Uninsured ACUTE URIS OF UNSPECIFIED SITE 85 1 <1 Uninsured UNSPECIFIED OTITIS MEDIA 54 0 <1 Uninsured FEVER 32 0 <1 Uninsured UNSPEC VIRAL INF CCE & UNS SITE 23 1 <1 Uninsured FUSSY INFANT 16 0 <1 Uninsured VOMITING ALONE 14 0 <1 Uninsured CANDIDIASIS OF MOUTH 13 0 <1 Uninsured RASH&OTH NONSPECIFIC SKIN ERUPTION 13 0 <1 Uninsured OBSERVATION OTH SPEC SUSPECTED COND 12 0 <1 Uninsured UNSPECIFIED CONJUNCTIVITIS 11 0 <1 Uninsured CROUP 11 0 <1 Uninsured PNEUMONIA, ORGANISM UNSPECIFIED 10 0 <1 Uninsured COUGH 10 1 <1 Uninsured UNSPECIFIED FETAL&NEONATAL JAUNDICE 9 1 <1 Uninsured CONTUS FACE SCALP&NECK EXCEPT EYE 9 0 <1 Uninsured OTHER DISEASES NASAL CAVITY&SINUSES 8 0 <1 Uninsured UNS NONINF GASTROENTERIT&COLITIS 8 0 <1 Uninsured DIAPER OR NAPKIN RASH 8 0 <1 Uninsured ABDOMINAL PAIN, UNSPECIFIED SITE 8 0
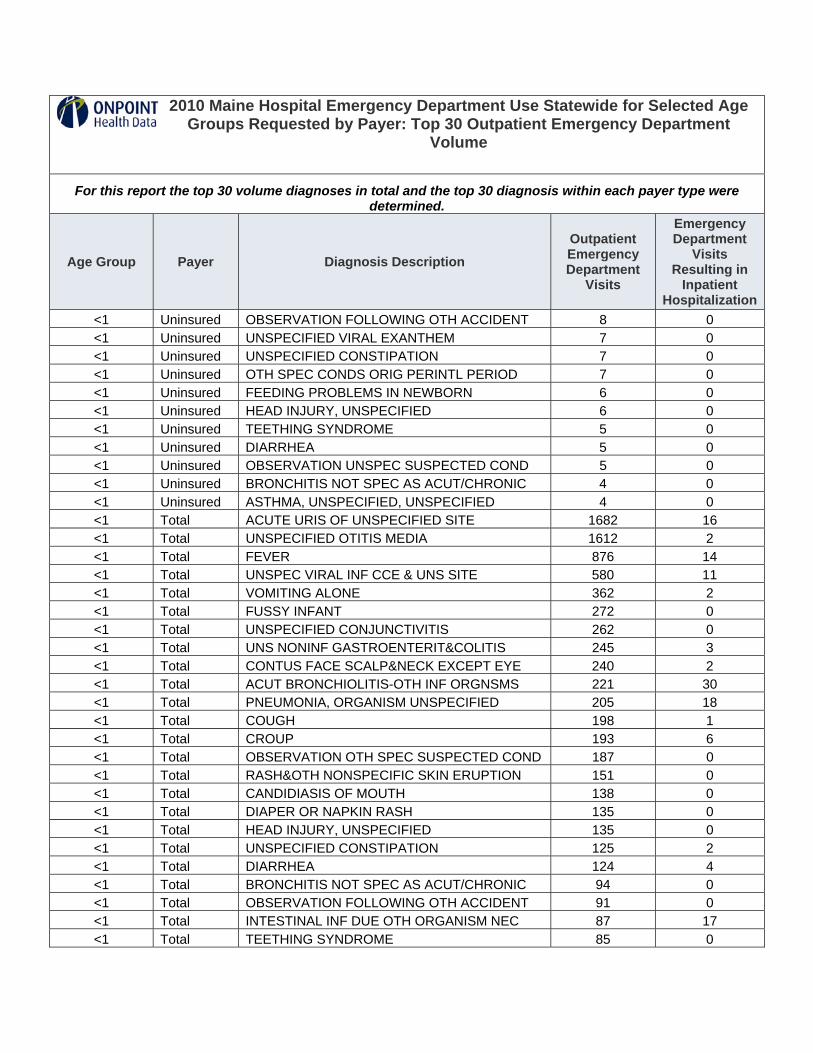
2010 Maine Hospital Emergency Department Use Statewide for Selected Age Groups Requested by Payer: Top 30 Outpatient Emergency Department
Volume
For this report the top 30 volume diagnoses in total and the top 30 diagnosis within each payer type were determined.
Age Group Payer Diagnosis Description Outpatient Emergency Department
Visits
Emergency Department
Visits Resulting in
Inpatient Hospitalization
<1 Uninsured OBSERVATION FOLLOWING OTH ACCIDENT 8 0 <1 Uninsured UNSPECIFIED VIRAL EXANTHEM 7 0 <1 Uninsured UNSPECIFIED CONSTIPATION 7 0 <1 Uninsured OTH SPEC CONDS ORIG PERINTL PERIOD 7 0 <1 Uninsured FEEDING PROBLEMS IN NEWBORN 6 0 <1 Uninsured HEAD INJURY, UNSPECIFIED 6 0 <1 Uninsured TEETHING SYNDROME 5 0 <1 Uninsured DIARRHEA 5 0 <1 Uninsured OBSERVATION UNSPEC SUSPECTED COND 5 0 <1 Uninsured BRONCHITIS NOT SPEC AS ACUT/CHRONIC 4 0 <1 Uninsured ASTHMA, UNSPECIFIED, UNSPECIFIED 4 0 <1 Total ACUTE URIS OF UNSPECIFIED SITE 1682 16 <1 Total UNSPECIFIED OTITIS MEDIA 1612 2 <1 Total FEVER 876 14 <1 Total UNSPEC VIRAL INF CCE & UNS SITE 580 11 <1 Total VOMITING ALONE 362 2 <1 Total FUSSY INFANT 272 0 <1 Total UNSPECIFIED CONJUNCTIVITIS 262 0 <1 Total UNS NONINF GASTROENTERIT&COLITIS 245 3 <1 Total CONTUS FACE SCALP&NECK EXCEPT EYE 240 2 <1 Total ACUT BRONCHIOLITIS-OTH INF ORGNSMS 221 30 <1 Total PNEUMONIA, ORGANISM UNSPECIFIED 205 18 <1 Total COUGH 198 1 <1 Total CROUP 193 6 <1 Total OBSERVATION OTH SPEC SUSPECTED COND 187 0 <1 Total RASH&OTH NONSPECIFIC SKIN ERUPTION 151 0 <1 Total CANDIDIASIS OF MOUTH 138 0 <1 Total DIAPER OR NAPKIN RASH 135 0 <1 Total HEAD INJURY, UNSPECIFIED 135 0 <1 Total UNSPECIFIED CONSTIPATION 125 2 <1 Total DIARRHEA 124 4 <1 Total BRONCHITIS NOT SPEC AS ACUT/CHRONIC 94 0 <1 Total OBSERVATION FOLLOWING OTH ACCIDENT 91 0 <1 Total INTESTINAL INF DUE OTH ORGANISM NEC 87 17 <1 Total TEETHING SYNDROME 85 0

2010 Maine Hospital Emergency Department Use Statewide for Selected Age Groups Requested by Payer: Top 30 Outpatient Emergency Department
Volume
For this report the top 30 volume diagnoses in total and the top 30 diagnosis within each payer type were determined.
Age Group Payer Diagnosis Description Outpatient Emergency Department
Visits
Emergency Department
Visits Resulting in
Inpatient Hospitalization
<1 Total ACUTE BRONCHIOLITIS DUE TO RSV 84 63 <1 Total ABDOMINAL PAIN, UNSPECIFIED SITE 83 1 <1 Total ASTHMA, UNSPECIFIED, UNSPECIFIED 76 6 <1 Total OTHER DISEASES NASAL CAVITY&SINUSES 71 0 <1 Total UNSPECIFIED VIRAL EXANTHEM 70 1 <1 Total UTI SITE NOT SPECIFIED 67 11
15-24 Commercial ACUTE PHARYNGITIS 1583 2 15-24 Commercial UNSPEC SITE ANKLE SPRAIN&STRAIN 1116 0 15-24 Commercial UTI SITE NOT SPECIFIED 859 1 15-24 Commercial NECK SPRAIN AND STRAIN 796 1 15-24 Commercial ABDOMINAL PAIN, UNSPECIFIED SITE 647 2 15-24 Commercial OPEN WOUND FINGER W/O MENTION COMP 643 0 15-24 Commercial ACUTE URIS OF UNSPECIFIED SITE 586 1 15-24 Commercial UNSPECIFIED OTITIS MEDIA 492 0 15-24 Commercial HEADACHE 492 0 15-24 Commercial CONTUS FACE SCALP&NECK EXCEPT EYE 492 1 15-24 Commercial UNSPEC VIRAL INF CCE & UNS SITE 451 3 15-24 Commercial CONTUSION OF HAND 399 0 15-24 Commercial BRONCHITIS NOT SPEC AS ACUT/CHRONIC 397 0 15-24 Commercial DEPRESSIVE DISORDER NEC 396 6 15-24 Commercial UNS NONINF GASTROENTERIT&COLITIS 395 7 15-24 Commercial ACUTE TONSILLITIS 381 3 15-24 Commercial SYNCOPE AND COLLAPSE 355 5 15-24 Commercial ABDOMINAL PAIN OTHER SPECIFIED SITE 341 6 15-24 Commercial STREPTOCOCCAL SORE THROAT 330 1 15-24 Commercial LUMBAR SPRAIN AND STRAIN 287 0 15-24 Commercial INFECTIOUS MONONUCLEOSIS 271 19 15-24 Commercial OPEN WND HND NO FNGR ALONE W/O COMP 270 0 15-24 Commercial NONDPND ALCOHL ABS UNS DRUNKENNESS 260 5 15-24 Commercial ACUTE BRONCHITIS 260 0 15-24 Commercial UNSPEC D/O TEETH&SUPPORTING STRCT 254 0 15-24 Commercial SPRAIN&STRAIN UNSPEC SITE KNEE&LEG 251 0 15-24 Commercial PAINFUL RESPIRATION 248 0 15-24 Commercial HEAD INJURY, UNSPECIFIED 248 2 15-24 Commercial UNSPECIFIED CONJUNCTIVITIS 247 0

2010 Maine Hospital Emergency Department Use Statewide for Selected Age Groups Requested by Payer: Top 30 Outpatient Emergency Department
Volume
For this report the top 30 volume diagnoses in total and the top 30 diagnosis within each payer type were determined.
Age Group Payer Diagnosis Description Outpatient Emergency Department
Visits
Emergency Department
Visits Resulting in
Inpatient Hospitalization
15-24 Commercial SPRAIN&STRAIN UNSPEC SITE WRIST 247 0 15-24 Medicaid ACUTE PHARYNGITIS 1899 0 15-24 Medicaid UNSPEC D/O TEETH&SUPPORTING STRCT 1755 0 15-24 Medicaid ACUTE URIS OF UNSPECIFIED SITE 1173 0 15-24 Medicaid UTI SITE NOT SPECIFIED 1170 5 15-24 Medicaid ABDOMINAL PAIN, UNSPECIFIED SITE 1060 2 15-24 Medicaid UNSPEC SITE ANKLE SPRAIN&STRAIN 1011 0
15-24 Medicaid OTH CURRENT MATERNAL CCE ANTEPARTUM 879 20
15-24 Medicaid DEPRESSIVE DISORDER NEC 800 19 15-24 Medicaid HEADACHE 799 4 15-24 Medicaid UNSPECIFIED OTITIS MEDIA 795 0 15-24 Medicaid BRONCHITIS NOT SPEC AS ACUT/CHRONIC 736 0 15-24 Medicaid UNSPEC VIRAL INF CCE & UNS SITE 622 1 15-24 Medicaid LUMBAGO 619 0 15-24 Medicaid AC APICAL PRDONTITIS PULPAL ORIGIN 604 0 15-24 Medicaid CONTUSION OF HAND 603 0 15-24 Medicaid UNSPECIFIED DENTAL CARIES 601 0 15-24 Medicaid ABDOMINAL PAIN OTHER SPECIFIED SITE 601 8 15-24 Medicaid UNS NONINF GASTROENTERIT&COLITIS 585 11 15-24 Medicaid OPEN WOUND FINGER W/O MENTION COMP 481 0 15-24 Medicaid LUMBAR SPRAIN AND STRAIN 479 0 15-24 Medicaid UNSPECIFIED BACKACHE 477 2 15-24 Medicaid PERIAPICAL ABSCESS WITHOUT SINUS 470 2 15-24 Medicaid CONTUS FACE SCALP&NECK EXCEPT EYE 460 1 15-24 Medicaid ANXIETY STATE, UNSPECIFIED 443 0 15-24 Medicaid NECK SPRAIN AND STRAIN 440 1 15-24 Medicaid ASTHMA UNSPECIFIED W/EXACERBATION 435 17 15-24 Medicaid STREPTOCOCCAL SORE THROAT 392 0 15-24 Medicaid UNSPEC SX ASSOC W/FE GENIT ORGN 387 0 15-24 Medicaid ASTHMA, UNSPECIFIED, UNSPECIFIED 386 1 15-24 Medicaid UNSPECIFIED SINUSITIS 382 0 15-24 Medicare UNSPEC D/O TEETH&SUPPORTING STRCT 79 0 15-24 Medicare DEPRESSIVE DISORDER NEC 51 1 15-24 Medicare ACUTE PHARYNGITIS 45 0

2010 Maine Hospital Emergency Department Use Statewide for Selected Age Groups Requested by Payer: Top 30 Outpatient Emergency Department
Volume
For this report the top 30 volume diagnoses in total and the top 30 diagnosis within each payer type were determined.
Age Group Payer Diagnosis Description Outpatient Emergency Department
Visits
Emergency Department
Visits Resulting in
Inpatient Hospitalization
15-24 Medicare UTI SITE NOT SPECIFIED 42 1 15-24 Medicare ACUTE URIS OF UNSPECIFIED SITE 38 0 15-24 Medicare HEADACHE 35 0 15-24 Medicare UNSPEC SITE ANKLE SPRAIN&STRAIN 35 0 15-24 Medicare ABDOMINAL PAIN, UNSPECIFIED SITE 30 0 15-24 Medicare CONTUS FACE SCALP&NECK EXCEPT EYE 30 0 15-24 Medicare ASTHMA UNSPECIFIED W/EXACERBATION 29 1 15-24 Medicare BRONCHITIS NOT SPEC AS ACUT/CHRONIC 27 0 15-24 Medicare OPEN WOUND FINGER W/O MENTION COMP 25 0 15-24 Medicare UNSPECIFIED OTITIS MEDIA 24 0 15-24 Medicare LUMBAGO 24 0 15-24 Medicare UNSPECIFIED BACKACHE 24 0 15-24 Medicare VOMITING ALONE 23 0 15-24 Medicare ANXIETY STATE, UNSPECIFIED 22 0
15-24 Medicare OTH CURRENT MATERNAL CCE ANTEPARTUM 22 1
15-24 Medicare UNSPEC SX ASSOC W/FE GENIT ORGN 21 0 15-24 Medicare UNSPECIFIED PSYCHOSIS 20 3 15-24 Medicare NAUSEA WITH VOMITING 20 0 15-24 Medicare ABDOMINAL PAIN OTHER SPECIFIED SITE 20 0 15-24 Medicare PAIN IN SOFT TISSUES OF LIMB 19 0 15-24 Medicare STREPTOCOCCAL SORE THROAT 18 0 15-24 Medicare UNSPEC VIRAL INF CCE & UNS SITE 18 0 15-24 Medicare OTHER CONVULSIONS 18 0 15-24 Medicare UNSPECIFIED DENTAL CARIES 17 0 15-24 Medicare UNS NONINF GASTROENTERIT&COLITIS 17 0 15-24 Medicare ABDOMINAL PAIN RIGHT LOWER QUADRANT 17 0 15-24 Medicare CONTUSION OF HAND 17 0 15-24 Other OPEN WOUND FINGER W/O MENTION COMP 690 0 15-24 Other UNSPEC SITE ANKLE SPRAIN&STRAIN 162 0 15-24 Other OPEN WND HND NO FNGR ALONE W/O COMP 155 0 15-24 Other LUMBAR SPRAIN AND STRAIN 126 0 15-24 Other ACUTE PHARYNGITIS 95 0 15-24 Other CONTUSION OF HAND 87 0 15-24 Other SPRAIN&STRAIN UNSPEC SITE WRIST 81 0

2010 Maine Hospital Emergency Department Use Statewide for Selected Age Groups Requested by Payer: Top 30 Outpatient Emergency Department
Volume
For this report the top 30 volume diagnoses in total and the top 30 diagnosis within each payer type were determined.
Age Group Payer Diagnosis Description Outpatient Emergency Department
Visits
Emergency Department
Visits Resulting in
Inpatient Hospitalization
15-24 Other LUMBAGO 79 0 15-24 Other NECK SPRAIN AND STRAIN 74 0 15-24 Other CONTUS FACE SCALP&NECK EXCEPT EYE 72 0 15-24 Other CONTUSION OF FINGER 71 0 15-24 Other SPRAIN&STRAIN UNSPEC SITE KNEE&LEG 67 0 15-24 Other SPRAIN&STRAIN UNS SITE SHLDR&UP ARM 66 0 15-24 Other THORACIC SPRAIN AND STRAIN 64 0 15-24 Other ATTENTION TO DRESSINGS AND SUTURES 60 0 15-24 Other UTI SITE NOT SPECIFIED 59 0 15-24 Other ABDOMINAL PAIN, UNSPECIFIED SITE 57 0 15-24 Other SUPERFICIAL INJURY OF CORNEA 57 0 15-24 Other HEADACHE 50 0 15-24 Other CONTUSION OF FOOT 50 0 15-24 Other UNS NONINF GASTROENTERIT&COLITIS 49 0 15-24 Other OPEN WND KNEE LEG&ANK W/O COMP 49 0 15-24 Other HEALTH EXAM DEFINED SUBPOPULATION 49 0
15-24 Other OPEN WOUND FOREARM W/O MENTION COMP 47 0
15-24 Other OPEN WOUND SCLP W/O MENTION COMP 45 0 15-24 Other DEPRESSIVE DISORDER NEC 43 0 15-24 Other CRUSHING INJURY OF FINGER 43 0 15-24 Other FB UNSPEC SITE EXTERNAL EYE 41 0
15-24 Other OTH CURRENT MATERNAL CCE ANTEPARTUM 40 2
15-24 Other UNSPECIFIED BACKACHE 40 0 15-24 Uninsured ACUTE PHARYNGITIS 605 0 15-24 Uninsured UNSPEC D/O TEETH&SUPPORTING STRCT 525 0 15-24 Uninsured UTI SITE NOT SPECIFIED 351 0 15-24 Uninsured UNSPEC SITE ANKLE SPRAIN&STRAIN 272 0 15-24 Uninsured ACUTE URIS OF UNSPECIFIED SITE 254 0 15-24 Uninsured OPEN WOUND FINGER W/O MENTION COMP 227 0 15-24 Uninsured NECK SPRAIN AND STRAIN 224 0 15-24 Uninsured DEPRESSIVE DISORDER NEC 219 3 15-24 Uninsured PERIAPICAL ABSCESS WITHOUT SINUS 214 0 15-24 Uninsured ABDOMINAL PAIN, UNSPECIFIED SITE 213 1 15-24 Uninsured UNSPECIFIED DENTAL CARIES 209 0

2010 Maine Hospital Emergency Department Use Statewide for Selected Age Groups Requested by Payer: Top 30 Outpatient Emergency Department
Volume
For this report the top 30 volume diagnoses in total and the top 30 diagnosis within each payer type were determined.
Age Group Payer Diagnosis Description Outpatient Emergency Department
Visits
Emergency Department
Visits Resulting in
Inpatient Hospitalization
15-24 Uninsured BRONCHITIS NOT SPEC AS ACUT/CHRONIC 201 0 15-24 Uninsured AC APICAL PRDONTITIS PULPAL ORIGIN 201 0 15-24 Uninsured HEADACHE 197 0 15-24 Uninsured UNSPECIFIED OTITIS MEDIA 194 0 15-24 Uninsured ACUTE BRONCHITIS 191 0 15-24 Uninsured UNSPEC VIRAL INF CCE & UNS SITE 187 1 15-24 Uninsured CONTUSION OF HAND 178 0 15-24 Uninsured UNS NONINF GASTROENTERIT&COLITIS 174 3 15-24 Uninsured LUMBAGO 172 0 15-24 Uninsured LUMBAR SPRAIN AND STRAIN 168 0 15-24 Uninsured CONTUS FACE SCALP&NECK EXCEPT EYE 165 1 15-24 Uninsured NONDPND ALCOHL ABS UNS DRUNKENNESS 163 2 15-24 Uninsured ACUTE TONSILLITIS 159 0 15-24 Uninsured ASTHMA UNSPECIFIED W/EXACERBATION 153 2 15-24 Uninsured OPEN WND HND NO FNGR ALONE W/O COMP 149 0 15-24 Uninsured STREPTOCOCCAL SORE THROAT 146 0 15-24 Uninsured ABDOMINAL PAIN OTHER SPECIFIED SITE 137 3 15-24 Uninsured ANXIETY STATE, UNSPECIFIED 128 1 15-24 Uninsured ASTHMA, UNSPECIFIED, UNSPECIFIED 118 0 15-24 Total ACUTE PHARYNGITIS 4226 2 15-24 Total UNSPEC D/O TEETH&SUPPORTING STRCT 2634 0 15-24 Total UNSPEC SITE ANKLE SPRAIN&STRAIN 2596 0 15-24 Total UTI SITE NOT SPECIFIED 2481 7 15-24 Total ACUTE URIS OF UNSPECIFIED SITE 2083 1 15-24 Total OPEN WOUND FINGER W/O MENTION COMP 2066 0 15-24 Total ABDOMINAL PAIN, UNSPECIFIED SITE 2007 5 15-24 Total HEADACHE 1573 4 15-24 Total NECK SPRAIN AND STRAIN 1550 2 15-24 Total UNSPECIFIED OTITIS MEDIA 1537 0 15-24 Total DEPRESSIVE DISORDER NEC 1508 29 15-24 Total BRONCHITIS NOT SPEC AS ACUT/CHRONIC 1396 0 15-24 Total UNSPEC VIRAL INF CCE & UNS SITE 1311 5 15-24 Total CONTUSION OF HAND 1284 0 15-24 Total UNS NONINF GASTROENTERIT&COLITIS 1220 21 15-24 Total CONTUS FACE SCALP&NECK EXCEPT EYE 1219 3
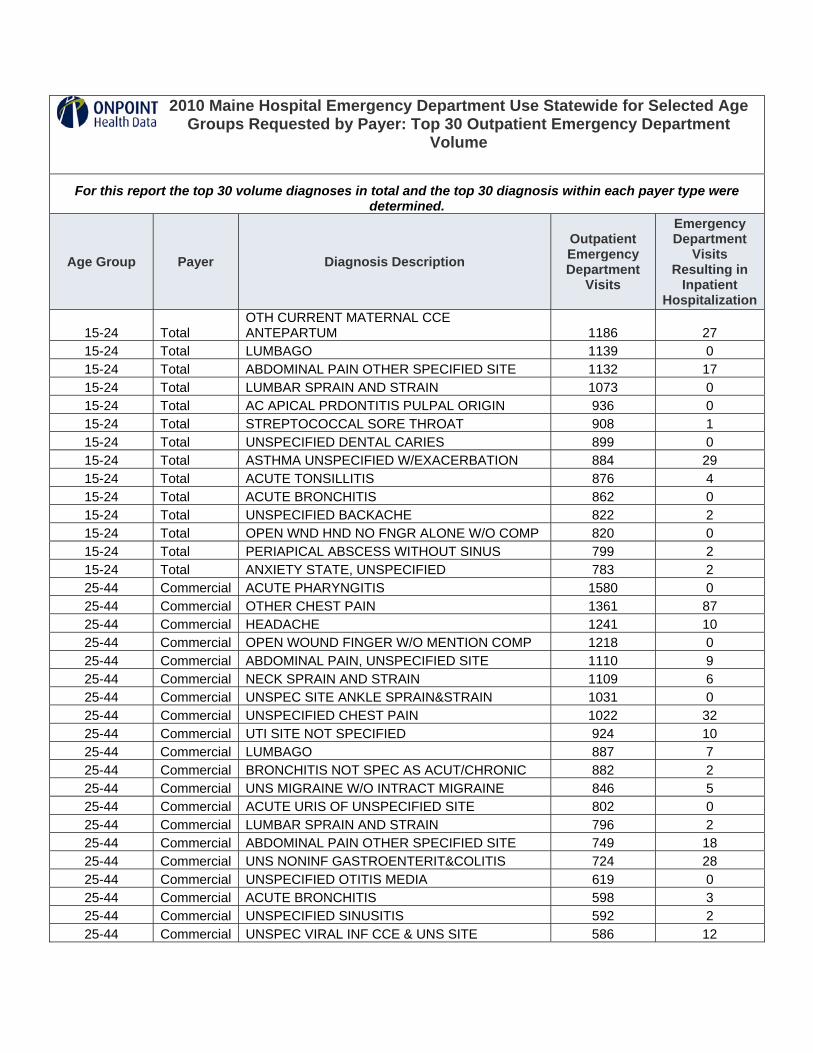
2010 Maine Hospital Emergency Department Use Statewide for Selected Age Groups Requested by Payer: Top 30 Outpatient Emergency Department
Volume
For this report the top 30 volume diagnoses in total and the top 30 diagnosis within each payer type were determined.
Age Group Payer Diagnosis Description Outpatient Emergency Department
Visits
Emergency Department
Visits Resulting in
Inpatient Hospitalization
15-24 Total OTH CURRENT MATERNAL CCE ANTEPARTUM 1186 27
15-24 Total LUMBAGO 1139 0 15-24 Total ABDOMINAL PAIN OTHER SPECIFIED SITE 1132 17 15-24 Total LUMBAR SPRAIN AND STRAIN 1073 0 15-24 Total AC APICAL PRDONTITIS PULPAL ORIGIN 936 0 15-24 Total STREPTOCOCCAL SORE THROAT 908 1 15-24 Total UNSPECIFIED DENTAL CARIES 899 0 15-24 Total ASTHMA UNSPECIFIED W/EXACERBATION 884 29 15-24 Total ACUTE TONSILLITIS 876 4 15-24 Total ACUTE BRONCHITIS 862 0 15-24 Total UNSPECIFIED BACKACHE 822 2 15-24 Total OPEN WND HND NO FNGR ALONE W/O COMP 820 0 15-24 Total PERIAPICAL ABSCESS WITHOUT SINUS 799 2 15-24 Total ANXIETY STATE, UNSPECIFIED 783 2 25-44 Commercial ACUTE PHARYNGITIS 1580 0 25-44 Commercial OTHER CHEST PAIN 1361 87 25-44 Commercial HEADACHE 1241 10 25-44 Commercial OPEN WOUND FINGER W/O MENTION COMP 1218 0 25-44 Commercial ABDOMINAL PAIN, UNSPECIFIED SITE 1110 9 25-44 Commercial NECK SPRAIN AND STRAIN 1109 6 25-44 Commercial UNSPEC SITE ANKLE SPRAIN&STRAIN 1031 0 25-44 Commercial UNSPECIFIED CHEST PAIN 1022 32 25-44 Commercial UTI SITE NOT SPECIFIED 924 10 25-44 Commercial LUMBAGO 887 7 25-44 Commercial BRONCHITIS NOT SPEC AS ACUT/CHRONIC 882 2 25-44 Commercial UNS MIGRAINE W/O INTRACT MIGRAINE 846 5 25-44 Commercial ACUTE URIS OF UNSPECIFIED SITE 802 0 25-44 Commercial LUMBAR SPRAIN AND STRAIN 796 2 25-44 Commercial ABDOMINAL PAIN OTHER SPECIFIED SITE 749 18 25-44 Commercial UNS NONINF GASTROENTERIT&COLITIS 724 28 25-44 Commercial UNSPECIFIED OTITIS MEDIA 619 0 25-44 Commercial ACUTE BRONCHITIS 598 3 25-44 Commercial UNSPECIFIED SINUSITIS 592 2 25-44 Commercial UNSPEC VIRAL INF CCE & UNS SITE 586 12

2010 Maine Hospital Emergency Department Use Statewide for Selected Age Groups Requested by Payer: Top 30 Outpatient Emergency Department
Volume
For this report the top 30 volume diagnoses in total and the top 30 diagnosis within each payer type were determined.
Age Group Payer Diagnosis Description Outpatient Emergency Department
Visits
Emergency Department
Visits Resulting in
Inpatient Hospitalization
25-44 Commercial PAINFUL RESPIRATION 558 6 25-44 Commercial UNSPEC D/O TEETH&SUPPORTING STRCT 526 0 25-44 Commercial PAIN IN SOFT TISSUES OF LIMB 496 2 25-44 Commercial UNSPECIFIED BACKACHE 494 2 25-44 Commercial OPEN WND HND NO FNGR ALONE W/O COMP 466 0 25-44 Commercial DIZZINESS AND GIDDINESS 462 3 25-44 Commercial ASTHMA UNSPECIFIED W/EXACERBATION 443 32 25-44 Commercial CELLULITIS&ABSCESS LEG EXCEPT FOOT 435 40 25-44 Commercial STREPTOCOCCAL SORE THROAT 426 3 25-44 Commercial PALPITATIONS 425 2 25-44 Medicaid UNSPEC D/O TEETH&SUPPORTING STRCT 2140 0 25-44 Medicaid LUMBAGO 1631 7 25-44 Medicaid HEADACHE 1462 5 25-44 Medicaid ABDOMINAL PAIN, UNSPECIFIED SITE 1248 17 25-44 Medicaid ACUTE PHARYNGITIS 1204 3 25-44 Medicaid UNS MIGRAINE W/O INTRACT MIGRAINE 1125 4 25-44 Medicaid BRONCHITIS NOT SPEC AS ACUT/CHRONIC 1087 0 25-44 Medicaid PERIAPICAL ABSCESS WITHOUT SINUS 979 2 25-44 Medicaid UTI SITE NOT SPECIFIED 975 10 25-44 Medicaid AC APICAL PRDONTITIS PULPAL ORIGIN 952 0 25-44 Medicaid DEPRESSIVE DISORDER NEC 951 40 25-44 Medicaid LUMBAR SPRAIN AND STRAIN 943 0 25-44 Medicaid UNSPECIFIED BACKACHE 934 0 25-44 Medicaid ACUTE URIS OF UNSPECIFIED SITE 923 0 25-44 Medicaid UNSPEC SITE ANKLE SPRAIN&STRAIN 896 0 25-44 Medicaid UNSPECIFIED DENTAL CARIES 878 0 25-44 Medicaid OTHER CHEST PAIN 857 57 25-44 Medicaid ABDOMINAL PAIN OTHER SPECIFIED SITE 819 12 25-44 Medicaid ANXIETY STATE, UNSPECIFIED 722 5 25-44 Medicaid NECK SPRAIN AND STRAIN 681 1 25-44 Medicaid UNSPECIFIED OTITIS MEDIA 676 0 25-44 Medicaid UNSPECIFIED CHEST PAIN 669 24 25-44 Medicaid PAIN IN SOFT TISSUES OF LIMB 635 0 25-44 Medicaid ACUTE BRONCHITIS 620 3 25-44 Medicaid OPEN WOUND FINGER W/O MENTION COMP 611 0

2010 Maine Hospital Emergency Department Use Statewide for Selected Age Groups Requested by Payer: Top 30 Outpatient Emergency Department
Volume
For this report the top 30 volume diagnoses in total and the top 30 diagnosis within each payer type were determined.
Age Group Payer Diagnosis Description Outpatient Emergency Department
Visits
Emergency Department
Visits Resulting in
Inpatient Hospitalization
25-44 Medicaid UNS NONINF GASTROENTERIT&COLITIS 593 18 25-44 Medicaid UNSPECIFIED SINUSITIS 558 0 25-44 Medicaid PAINFUL RESPIRATION 542 4 25-44 Medicaid ASTHMA UNSPECIFIED W/EXACERBATION 539 31 25-44 Medicaid ASTHMA, UNSPECIFIED, UNSPECIFIED 533 1 25-44 Medicare HEADACHE 487 2 25-44 Medicare DEPRESSIVE DISORDER NEC 465 16 25-44 Medicare UNSPEC D/O TEETH&SUPPORTING STRCT 437 0 25-44 Medicare UNS MIGRAINE W/O INTRACT MIGRAINE 430 1 25-44 Medicare LUMBAGO 375 3 25-44 Medicare ABDOMINAL PAIN, UNSPECIFIED SITE 329 5 25-44 Medicare OTHER CHEST PAIN 280 21 25-44 Medicare BRONCHITIS NOT SPEC AS ACUT/CHRONIC 275 2 25-44 Medicare UNSPECIFIED CHEST PAIN 257 9 25-44 Medicare ANXIETY STATE, UNSPECIFIED 251 0 25-44 Medicare UNSPECIFIED BACKACHE 240 2 25-44 Medicare OTHER CONVULSIONS 232 14 25-44 Medicare ACUTE PHARYNGITIS 216 0 25-44 Medicare UTI SITE NOT SPECIFIED 206 13 25-44 Medicare UNSPEC SITE ANKLE SPRAIN&STRAIN 203 1 25-44 Medicare ABDOMINAL PAIN OTHER SPECIFIED SITE 202 11 25-44 Medicare ACUTE URIS OF UNSPECIFIED SITE 188 0 25-44 Medicare PAIN IN SOFT TISSUES OF LIMB 179 0 25-44 Medicare PAINFUL RESPIRATION 174 6 25-44 Medicare LUMBAR SPRAIN AND STRAIN 173 0 25-44 Medicare AC APICAL PRDONTITIS PULPAL ORIGIN 166 0 25-44 Medicare UNSPECIFIED DENTAL CARIES 159 0 25-44 Medicare UNSPECIFIED OTITIS MEDIA 155 0 25-44 Medicare PERIAPICAL ABSCESS WITHOUT SINUS 155 1 25-44 Medicare OPEN WOUND FINGER W/O MENTION COMP 154 0 25-44 Medicare NONDPND ALCOHL ABS UNS DRUNKENNESS 137 1 25-44 Medicare ACUTE BRONCHITIS 137 1 25-44 Medicare ASTHMA UNSPECIFIED W/EXACERBATION 132 12 25-44 Medicare UNS NONINF GASTROENTERIT&COLITIS 126 13 25-44 Medicare BIPOLAR DISORDER UNSPECIFIED 124 7
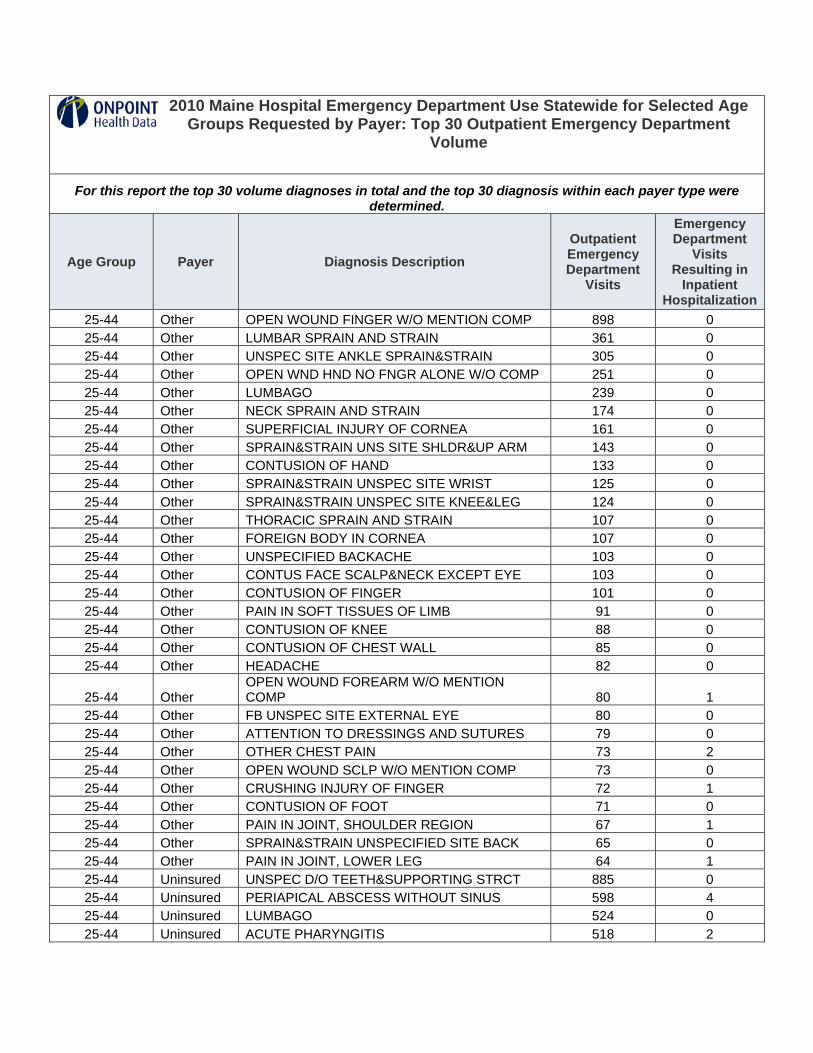
2010 Maine Hospital Emergency Department Use Statewide for Selected Age Groups Requested by Payer: Top 30 Outpatient Emergency Department
Volume
For this report the top 30 volume diagnoses in total and the top 30 diagnosis within each payer type were determined.
Age Group Payer Diagnosis Description Outpatient Emergency Department
Visits
Emergency Department
Visits Resulting in
Inpatient Hospitalization
25-44 Other OPEN WOUND FINGER W/O MENTION COMP 898 0 25-44 Other LUMBAR SPRAIN AND STRAIN 361 0 25-44 Other UNSPEC SITE ANKLE SPRAIN&STRAIN 305 0 25-44 Other OPEN WND HND NO FNGR ALONE W/O COMP 251 0 25-44 Other LUMBAGO 239 0 25-44 Other NECK SPRAIN AND STRAIN 174 0 25-44 Other SUPERFICIAL INJURY OF CORNEA 161 0 25-44 Other SPRAIN&STRAIN UNS SITE SHLDR&UP ARM 143 0 25-44 Other CONTUSION OF HAND 133 0 25-44 Other SPRAIN&STRAIN UNSPEC SITE WRIST 125 0 25-44 Other SPRAIN&STRAIN UNSPEC SITE KNEE&LEG 124 0 25-44 Other THORACIC SPRAIN AND STRAIN 107 0 25-44 Other FOREIGN BODY IN CORNEA 107 0 25-44 Other UNSPECIFIED BACKACHE 103 0 25-44 Other CONTUS FACE SCALP&NECK EXCEPT EYE 103 0 25-44 Other CONTUSION OF FINGER 101 0 25-44 Other PAIN IN SOFT TISSUES OF LIMB 91 0 25-44 Other CONTUSION OF KNEE 88 0 25-44 Other CONTUSION OF CHEST WALL 85 0 25-44 Other HEADACHE 82 0
25-44 Other OPEN WOUND FOREARM W/O MENTION COMP 80 1
25-44 Other FB UNSPEC SITE EXTERNAL EYE 80 0 25-44 Other ATTENTION TO DRESSINGS AND SUTURES 79 0 25-44 Other OTHER CHEST PAIN 73 2 25-44 Other OPEN WOUND SCLP W/O MENTION COMP 73 0 25-44 Other CRUSHING INJURY OF FINGER 72 1 25-44 Other CONTUSION OF FOOT 71 0 25-44 Other PAIN IN JOINT, SHOULDER REGION 67 1 25-44 Other SPRAIN&STRAIN UNSPECIFIED SITE BACK 65 0 25-44 Other PAIN IN JOINT, LOWER LEG 64 1 25-44 Uninsured UNSPEC D/O TEETH&SUPPORTING STRCT 885 0 25-44 Uninsured PERIAPICAL ABSCESS WITHOUT SINUS 598 4 25-44 Uninsured LUMBAGO 524 0 25-44 Uninsured ACUTE PHARYNGITIS 518 2
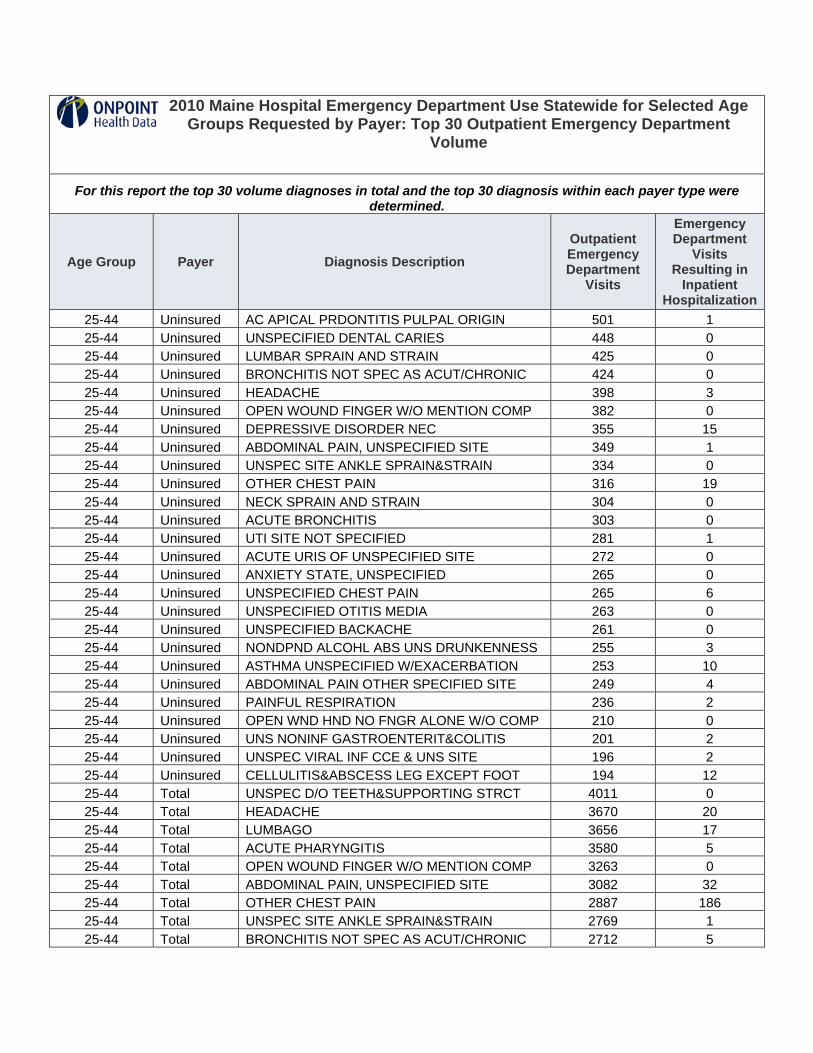
2010 Maine Hospital Emergency Department Use Statewide for Selected Age Groups Requested by Payer: Top 30 Outpatient Emergency Department
Volume
For this report the top 30 volume diagnoses in total and the top 30 diagnosis within each payer type were determined.
Age Group Payer Diagnosis Description Outpatient Emergency Department
Visits
Emergency Department
Visits Resulting in
Inpatient Hospitalization
25-44 Uninsured AC APICAL PRDONTITIS PULPAL ORIGIN 501 1 25-44 Uninsured UNSPECIFIED DENTAL CARIES 448 0 25-44 Uninsured LUMBAR SPRAIN AND STRAIN 425 0 25-44 Uninsured BRONCHITIS NOT SPEC AS ACUT/CHRONIC 424 0 25-44 Uninsured HEADACHE 398 3 25-44 Uninsured OPEN WOUND FINGER W/O MENTION COMP 382 0 25-44 Uninsured DEPRESSIVE DISORDER NEC 355 15 25-44 Uninsured ABDOMINAL PAIN, UNSPECIFIED SITE 349 1 25-44 Uninsured UNSPEC SITE ANKLE SPRAIN&STRAIN 334 0 25-44 Uninsured OTHER CHEST PAIN 316 19 25-44 Uninsured NECK SPRAIN AND STRAIN 304 0 25-44 Uninsured ACUTE BRONCHITIS 303 0 25-44 Uninsured UTI SITE NOT SPECIFIED 281 1 25-44 Uninsured ACUTE URIS OF UNSPECIFIED SITE 272 0 25-44 Uninsured ANXIETY STATE, UNSPECIFIED 265 0 25-44 Uninsured UNSPECIFIED CHEST PAIN 265 6 25-44 Uninsured UNSPECIFIED OTITIS MEDIA 263 0 25-44 Uninsured UNSPECIFIED BACKACHE 261 0 25-44 Uninsured NONDPND ALCOHL ABS UNS DRUNKENNESS 255 3 25-44 Uninsured ASTHMA UNSPECIFIED W/EXACERBATION 253 10 25-44 Uninsured ABDOMINAL PAIN OTHER SPECIFIED SITE 249 4 25-44 Uninsured PAINFUL RESPIRATION 236 2 25-44 Uninsured OPEN WND HND NO FNGR ALONE W/O COMP 210 0 25-44 Uninsured UNS NONINF GASTROENTERIT&COLITIS 201 2 25-44 Uninsured UNSPEC VIRAL INF CCE & UNS SITE 196 2 25-44 Uninsured CELLULITIS&ABSCESS LEG EXCEPT FOOT 194 12 25-44 Total UNSPEC D/O TEETH&SUPPORTING STRCT 4011 0 25-44 Total HEADACHE 3670 20 25-44 Total LUMBAGO 3656 17 25-44 Total ACUTE PHARYNGITIS 3580 5 25-44 Total OPEN WOUND FINGER W/O MENTION COMP 3263 0 25-44 Total ABDOMINAL PAIN, UNSPECIFIED SITE 3082 32 25-44 Total OTHER CHEST PAIN 2887 186 25-44 Total UNSPEC SITE ANKLE SPRAIN&STRAIN 2769 1 25-44 Total BRONCHITIS NOT SPEC AS ACUT/CHRONIC 2712 5

2010 Maine Hospital Emergency Department Use Statewide for Selected Age Groups Requested by Payer: Top 30 Outpatient Emergency Department
Volume
For this report the top 30 volume diagnoses in total and the top 30 diagnosis within each payer type were determined.
Age Group Payer Diagnosis Description Outpatient Emergency Department
Visits
Emergency Department
Visits Resulting in
Inpatient Hospitalization
25-44 Total LUMBAR SPRAIN AND STRAIN 2698 2 25-44 Total UNS MIGRAINE W/O INTRACT MIGRAINE 2641 15 25-44 Total UTI SITE NOT SPECIFIED 2422 34 25-44 Total NECK SPRAIN AND STRAIN 2392 8 25-44 Total UNSPECIFIED CHEST PAIN 2260 72 25-44 Total ACUTE URIS OF UNSPECIFIED SITE 2204 0 25-44 Total DEPRESSIVE DISORDER NEC 2194 93 25-44 Total PERIAPICAL ABSCESS WITHOUT SINUS 2096 8 25-44 Total ABDOMINAL PAIN OTHER SPECIFIED SITE 2069 45 25-44 Total UNSPECIFIED BACKACHE 2032 4 25-44 Total AC APICAL PRDONTITIS PULPAL ORIGIN 1954 1 25-44 Total UNSPECIFIED OTITIS MEDIA 1741 0 25-44 Total ACUTE BRONCHITIS 1691 7 25-44 Total UNSPECIFIED DENTAL CARIES 1690 0 25-44 Total UNS NONINF GASTROENTERIT&COLITIS 1686 64 25-44 Total ANXIETY STATE, UNSPECIFIED 1611 8 25-44 Total PAIN IN SOFT TISSUES OF LIMB 1595 3 25-44 Total PAINFUL RESPIRATION 1555 18 25-44 Total UNSPECIFIED SINUSITIS 1450 2 25-44 Total UNSPEC VIRAL INF CCE & UNS SITE 1415 18 25-44 Total ASTHMA UNSPECIFIED W/EXACERBATION 1389 86

APPENDIX 3.
Council on Health System Development ED Use Workgroup


APPENDIX 3.
EMERGENCY DEPT. USE WORKGROUP
Trish Riley, Chair Director, Governor’s Office of Health Policy Tim Beals Executive Director, Delta Ambulance Art Blank President/CEO, Mt. Desert Island Hospital, Member ACHSD Jay Bradshaw Public Safety Manager, Emergency Medical Services Rev. Bob Carlson President, Penobscot Community Health Care Carol Carothers Executive Director, NAMI-Maine Dr. Ken Christian Chief of ED, Maine Coast Memorial Hospital Dr. Josh Cutler Director, Maine Quality Forum, Member ACHSD Bob Downs Director of Operations and Development, Harvard Pilgrim Health
Care Geoff Green Deputy Commissioner, DHHS Chris Hastedt Public Policy Advisor, Maine Equal Justice Partners Dr. Scott Kemmerer Medical Director, Emergency Dept., MaineGeneral Medical
Center Dr. Maroulla Gleaton Ophthalmologist, Member ACHSD Anne Graham Maine Neurology, Member ACHSD Katie Fullam Harris Director, Government Relations, Anthem Blue Cross Blue Shield Tony Marple Director, OMS, DHHS Carol Minnis ER Nurse, Waterville Campus of MGMC Deb Nichols Schaller Anderson Dr. Brian Rines Psychologist, Chair ACHSD Dr. Erik Steele Chief Medical Officer, Eastern Maine Healthcare Systems Ron Welch Director, OAMHS, DHHS Dennise Whitley Director of Advocacy-Maine, American Heart Association Richard Willett CEO, Redington-Fairview General Hospital David Winslow Vice President of Financial Policy, Maine Hospital Association Dr. Wendy Wolf President and CEO, Maine Health Access Foundation
GOHPF 9-17-08