Embed Size (px)
Citation preview

51
ORIGINAL RESEARCH (AR) DOI: 10.4274/jems.2021.64872
Journal of ETA Maritime Science 2021;9(1):51-63
51-63
©Copyright 2021 by the Journal of ETA Maritime Science published by UCTEA Chamber of Marine Engineers
Analysis of Draught Survey Errors by Extended Fuzzy Analytic Hierarchy Process
Analysis of Draught Survey Errors by Extended Fuzzy Analytic Hierarchy Process
Refik Canımoğlu1, Umut Yıldırım2, Gani Mustafa İnegöl2
1Sakarya University of Applied Sciences, School of Maritime Vocational, Maritime Transportation and Management Program, Sakarya, Turkey
2Karadeniz Technical University, Surmene Faculty of Marine Sciences, Department of Maritime Transportation and Management Engineering, Trabzon, Turkey
Address for Correspondence: Umut Yıldırım, Karadeniz Technical University, Surmene Faculty of Marine Sciences, Department of Maritime Transportation and Management Engineering, Trabzon, TurkeyE-mail: [email protected] ID: orcid.org/0000-0002-3991-5457
1. IntroductionA draught survey is based on Archimedes’ principle and can be defined as a cargo calculation method, which is accepted in maritime transportation [1]. The main types of vessels for which a draught survey calculation is performed are bulk carriers [2]. However, a draught survey calculation is also used for all tankers in case of a difference between the vessel and shore figures or tank indicator failures and for stability calculations. According to United Nations Conference on Trade and Development, the major bulk commodities in 2018 are iron ore, grain, and coal, which in total corresponds to more than 40% of the total dry cargo shipments with 3.21 billion tons. Minor bulk and container shipments correspond to 25.8% and 24% of dry cargo shipments in the same year, respectively.
The remaining part is covered by other dry cargo like break bulks [3].Draught survey discrepancies can be avoided on a large scale if ideal conditions are provided before starting the survey. At any condition, the ship’s trim should not exceed the existing value in trim correction tables of the tanks. The ship should be upright for minimizing the tank’s sounding errors. All draught marks should be properly painted and visible [1]. During the survey, there should be no cargo, ballast, bunker, and crane or hatch cover operation. All equipment that will be used during the survey should be appropriately certified [2,4].Draught surveys should be conducted before and after cargo operations, which are known as the initial and final draught surveys for the determination of cargo quantity handled. To perform a draught survey, the vessel
Received: 19.12.2020Accepted: 04.03.2021
©Copyright 2021 by the Journal of ETA Maritime Science published by UCTEA Chamber of Marine Engineers
To cite this article: R. Canımoğlu, U. Yıldırım, G. M. İnegöl, “Analysis of Draught Survey Errors by Extended Fuzzy Analytic Hierarchy Process,”Journal of ETA Maritime Science, vol. 9, pp. 51-63, 2021.
AbstractBulk carriers and general cargo vessels have the largest number and tonnage among different types of ship fleets. According to the United Nations Conference on Trade and Development data in 2019, the tonnage of the global bulk carrier and general cargo vessel is 842,438,000 and 74,000,000 metric tons, respectively. The main cargo weight measurement method for bulk carriers and general cargo vessels is the draught survey calculation. In this study, a fuzzy analytic hierarchy process questionnaire was prepared based on previous studies and experts’ opinions. Responses from the experts were consolidated to determine the priority vector of the criteria of draught survey error sources. Expert evaluations showed that the major reasons of draught survey inconsistencies are problems occurring at draught reading and ballast measurement stages. Accordingly, the most effective alternatives to minimize the errors were found to be training and documentation, which are closely related to education. This study aims to determine the draught survey error causes and their priorities along with different means to reduce the errors from the experts’ opinions. This study will contribute to the literature by shedding light on draught survey errors in which studies in the academic literature are very limited.
KeywordsBulk cargo, Draught survey, Fuzzy AHP

52
Analysis of Draught Survey Errors by Extended Fuzzy Analytic Hierarchy Process
draughts should be read very carefully by the shore and seaside of the vessel. This procedure is performed on the draught marks on the fore, aft, and amidships at both the port and starboard. If the draught marks are not on the perpendiculars, draught corrections for calculating the draught values on the perpendiculars should be carried out. Using the estimated mean draught, a draught survey is accomplished by determining the necessary values such as displacement, ton per centimeter, longitudinal center of flotation, and moment to change trim one centimeter provided in the stability booklet of the ship [4]. In a draught survey, the difference between the loaded net displacement and empty net displacement calculated at the ports of destination and departure provides the cargo quantity [5,6].There are three elements of an unloaded vessel: lightship, constant, and variable weights (ballast, fuel, lube oil, fresh water, and store) of the vessel. Additionally, there is cargo on a loaded vessel [6]. The total of such weights determines the displacement of a vessel. Corrections and interpolations are required in numerous steps of a draught survey calculation, which increase the possibility of the introduction of an error. Moreover, the stakeholders feel compelled commercially to determine the amount of the merchandized load by a draught survey, and they might attempt to provide their own calculations in favor of their employers. Such factors increase the margin of error in a draught survey and have a negative impact on its reliability [7].As a dry bulk cargo constitutes a significant majority of international trade, the method to be used for the quantification of such loads should yield the most correct value, possibly with a minimum margin of error. The electronic quality shipping information system (EQUASIS) is an online information system for making safety-related maritime information more accessible by gathering relevant data from maritime industry professionals like ship owners, insurers, brokers, classification societies, and ports. According to an assessment in 2011 of a merchant fleet based on EQUASIS data, the world merchant fleet was comprised of 79,074 ships, among which 26,631 ships were solid bulk cargo and general cargo carriers. This figure accounts for 33.7% of the total fleet, surpassing all other ship types in this regard [8]. In this case, a margin of error is used in methods for the quantification of dry bulk loads. Minimizing this margin of error would have a tremendous impact on world trade.This study aims to obtain and prioritize the causes of draught survey errors and suggest the most effective alternatives for minimizing the errors from the perspective of the industry experts. Considering the mass of the cargo that is measured by draught survey, it is highly important to obtain the cargo
quantity with the least error possible. The presented paper can be used as a framework for studies about the reduction of draught survey errors.In this study, factors causing errors in a draught survey were analyzed based on the literature, and the hierarchical structure establishing the recommendations for reducing errors was assessed by the extended fuzzy analytic hierarchy process (FAHP) method.
2. Literature ReviewA draught survey is a manual calculation method based on observation. As a consequence, compensations are claimed based on cargo shortages of the differences in draught surveys. This scenario remains the main source of concern for shipowners and insurance clubs [9]. Therefore, marine insurance clubs require studies to be conducted on the discrepancies in draught surveys [10]. Shipowners are accountable for third parties, the environment, crew, and the cargo on their vessels. Thus, the compensations for the damages arising from cargo shortages are generally covered by the Protection & Indemnity Club (P&I Club) insurance.A bill of lading (B/L) of the transportation of cargo such as grains, coal, and mine, and the total load quantities discharged at the port of discharge are compared. Cargo shortage is claimed when the difference between these quantities is above the commercially acceptable limit (0.5%), which is highly common between the ports of discharge and loading [11]. This particularly occurs when cargos such as grains are measured based on the shore scale where the B/L document is issued according to the quantity measured onshore [12].In a circular note published in 2016, the Japan P&I Club performed a statistical study on cargo shortages and presented assessments of reasons and actions to be adopted to prevent them. In the analyses, a total of 10,594 cargo-related damage events were detected between 2008 and 2014. Moreover, it was observed that 2,183 (21%) of these events were related to cargo shortages. In the same period, the payment made for cargo damages from the budget of the Japan P&I Club was USD 121 million in total. USD 22.8 million (i.e., 19%) of this payment was owed to cargo shortages [11].Another study attempted to assess the potential errors in a draught survey using the AHP method [7], as it might afford solutions for multi-criteria complex problems. To attain the correct value in a draught survey, the factors considered as risks were assessed by pair-wise comparison. In the aforementioned study, the main criteria were reading the draughts, measuring the quantities of water in the vessel, measuring the density of seawater, and calculation stages. However, the study did not present alternatives for reducing errors. According to inferences by Xu et al. [7], the draught

53
Journal of ETA Maritime Science 2021;9(1):51-63
reading stage is the most significant stage of having a risk of error in a draught survey. Moreover, the most important factor among the sub-criteria in this stage is the surveyor. A surveyor should read the draughts carefully and objectively. Another important factor is the location where the draught survey is performed. The study stated that in recent years, reading draught (DR) marks using boats instead of ladders has considerably decreased disagreements and discrepancies in draught reading. It was also mentioned that the calculation should be performed during the measurement of the ballast quantity without ignoring the trim and list. Moreover, the survey should be initiated after the ideal surveying conditions are provided for the ship if its sounding table lacks the trim or list corrections. Xu et al. [7] mentioned the significance of using correct and licensed equipment for the measurement of seawater density and highlighted that using a computer-assisted calculation program might prevent calculation errors.It is necessary to pursue maritime operations safely and efficiently for the purpose of maintaining global trade [13]. This necessity leads to scientific research and projects in the maritime sector concerning ship operations, autonomous technologies, electronic navigation, and VR education. Based on the literature, it is noted that the number of academic researches on draught survey is limited, and most of the information/data in company circulars, draught survey reports, and ship stability booklets have not been studied extensively based on experts’ opinion by scientific perspective. These motivated this study’s investigation on draught survey errors. This study obtains and quantifies draught survey error causes and suggests alternatives for the reduction of errors using the FAHP method based on experts’ opinions. It is noted that presently, no article has analyzed draught survey errors and suggested alternatives from a scientific perspective in the literature. This study then fills this important gap in this field.
3. Analytical Hierarchy ProcessThe analytical hierarchy process (AHP) was first introduced by Myers and Alpert [14] in 1968 and was developed as a model by Saaty [15] in 1977, making it usable in solving decision-making problems. AHP can be explained as a decision-making and forecasting method that is used when a decision hierarchy can be defined, giving decision-making distributions. AHP is based on one-to-one comparisons on a decision hierarchy. As a result, their differences turn into percentages on their points. AHP is used in decision making in cases of certainty or uncertainty, multi-criteria, and multi-purpose, where many decision-makers can be found while choosing or ranking among many alternatives. AHP is a decision-making technique that measures all objective and subjective criteria by making a binary comparison and
determines the order of importance by finding the priorities of these criteria relative to each other [16].
3.1. Fuzzy Analytic Hierarchy ProcessThe FAHP can be considered as an advanced analytical method that is used for modeling unstructured problems in several scientific fields, which is derived from Saaty’s AHP method. The first study on FAHP was conducted by van Laarhoven and Pedrycz in 1983 [17]. Although AHP is consistent in considering both quantitative and qualitative criteria in multi-criteria decision-making problems, uncertain or fuzzy points in the determination of the decision-maker are demonstrated with the net numbers and fuzzy opinions of his/her being taken as to be certain in the assessment. As uncertain or fuzzy thoughts of the experts are part of the process, FAHP provides more realistic results than AHP [18]. Unclear and ambiguous points in AHP are improved using FAHP [19,20]. AHP is a multi-criterion method frequently used for solving problems [21]. However, it is criticized for using exact values in the assessment of experts’ opinions and for its inability to appropriately consider uncertainties and negligence of pair comparisons [22]. By contrast, fuzziness, especially uncertainty, is significant in a decision-making problem. Specifically, if the problem to be solved is uncertain, this uncertainty should be tolerated by the problem-solving method [23]. The decision-making process requires making a decision based on relevant alternatives [24,25]. Some of the decision criteria may be in conflict throughout the process. Therefore, alternatives should be analyzed with a methodology that can assess all the criteria simultaneously during the process. In the AHP method, the opinions of the decision-makers are assessed; however, this assessment using exact values raises concerns [26].
3.2. Fuzzy NumbersThe concept of fuzzy logic entered the literature in 1965 with the publication of Zadeh’s research articles on this subject. Fuzzy logic is defined as a mathematical order with strict rules for expressing and working with uncertainties [27]. Provisions involving people’s preferences are often ambiguous. Since it is not possible to predict individual preferences with exact numerical values, modeling full numerical data in real life is insufficient. For modeling to show a realistic approach, the criteria used in the problems should be evaluated and weighted with linguistic variables [28]. A fuzzy number can be simply defined as the fuzzy subsets of a real set. It is more appropriate to express the opinions of experts using linguistic terms because it is a more realistic option compared to using exact numbers. Linguistic terms in Table 1 represent triangular fuzzy numbers defining the interval of the determinations, which are used in the calculations of FAHP [26]. Triangular

54
Analysis of Draught Survey Errors by Extended Fuzzy Analytic Hierarchy Process
membership functions, defined by an overlap of fuzzy controllers are often used in fuzzy models because of the simplicity of using membership functions and the use of very limited information when converting language terms into numerical data. The simplest process for converting a linguistic term as numerical data is a model that determines the lower and upper limits of the membership function. However, in this model, the distribution of membership degrees is linear among the specified limits. For the membership values to be appropriate at the selected intermediate points distributed within these specified limits, additional information (optimum value) about membership values is required. When the probabilities that give the optimal values of the criteria presented in the created fuzzy problem are specified, triangular membership functions with overlapping levels reduce the error value to zero [29]. In a classical set, an element either belongs to the set or not. Specifically, the result is 1 if the element belongs to the set and 0 if the element does not belong to it. In classical sets, there are no intermediate values. Unlike classical sets, fuzzy sets have intermediate values.A triangular fuzzy number can be represented by (l/m, m/u) or (l, m, u) where l, m, and u correspond to the smallest possible value, the most possible value, and the largest possible value, respectively. If A is a triangular fuzzy number, the membership function can be defined as follows (formula 1) [26,29]:
μ A (x) =
⎧
⎪ ⎨
⎪
⎩
0, x < l
x − l _ m − l , l ≤ x ≤ m
u − x _ u − m , m ≤ x ≤ u
0, x > u
(1)
Figure 1 shows the membership function of fuzzy set A.
Figure 1. Triangular membership function [28,30]
3.3. Chang’s Extent Analysis Method
The extent analysis method developed by Chang (1996) has been used in numerous decision-making problems that employ FAHP [31]. Here, the significance levels of the necessary real numbers were calculated using a method based on Zadeh’s extension principle [29,32]. According to the extended analysis, each alternative is assessed to achieve the goal of a criterion. The extent expression in the definition signifies the extent to which each object in the alternative section achieves the goals individually. The values of the extent analysis are triangular fuzzy numbers expressed as Mjg i (j=1, 2, ..., m; i=1, 2, ..., n) [33]. A one-to-one coverage analysis is performed with targets for each object, where X={x1, x2, x3, …, xn} is the object set and G={g1, g2, g3, …, gn} is the goal set. Coverage analysis values for each object are shown as follows (formula 2).
M gi 1 , M
gi 2 , … M
gi m , i = 1,2, … , M
gi j ( j = 1,2, … m ) (2)
Here, the parameters of M gi j ( j = 1, 2, … , m ) are triangular
fuzzy numbers. a, b and c are the lowest possible, the highest possible, and the largest possible numbers, respectively.A matrix is generated after the hierarchy is designed, and the opinions of the experts are obtained. Based on the generated matrix, the synthesis value (Si) of the option is calculated by the following equation 3:
S i= ∑
j=1 m M
gi j ⨂ [ ∑
i=1 n ∑
j=1 m M
gi j ] −1 , (3)
where (formula 4 and 5)
∑ j=1 m M
gi j = ( ∑
j=1 m l
j , ∑
j=1 m m
j , ∑
j=1 m u
j ) (4)
[ ∑ i=1 n ∑
j=1 m M
gi j ] −1 = ( 1 _ ∑
i=1 n u
i ,
1 _ ∑ i=1 n m
i ,
1 _ ∑ i=1 n l
i ) (5)
The importance levels of the decision elements in the hier-archy are determined by comparing the calculated synthe-sis values. However, because the synthesis values are trian-gular fuzzy numbers, some points should be considered in the comparisons. When M1 = (l1, m1, u1) and M2 = (l2, m2, u2) are two triangular fuzzy numbers, the possibility degree of the M2 ≥ M1 equation is expressed with the formula 6 below [34,35].
Table 1. Triangular fuzzy number values [20]
StatusTriangular fuzzynumbers (TFN)
Reverse of TFN
Equally preferred 1. 1. 1 1. 1. 1
Moderately preferred 2/3. 1. 3/2 2/3. 1. 3/2
Strongly preferred 3/2. 2. 5/2 2/5. 1/2. 2/3
Very strongly preferred 5/2. 3. 7/2 2/7. 1/3. 2/5
Absolutely preferred 7/2. 4. 9/2 2/9. 1/4. 2/7
55
Journal of ETA Maritime Science 2021;9(1):51-63
V ( M 2 ≥ M
1 ) = sup [min ( μ
M 1 (x) , μ
M 2 (y) ) ] , ( y ≥ x ) (6)
Sup in formula 5 means superiority value. The (x, y) pair x>y is indefinitely bounded to belong to M. If x is greater than y and limited to M, then the value of the vector will be the upper value of the minimum value between μ
M 1 and
μ M
2 . Equation (6) is a form of y ≥x inequality expressed ac-
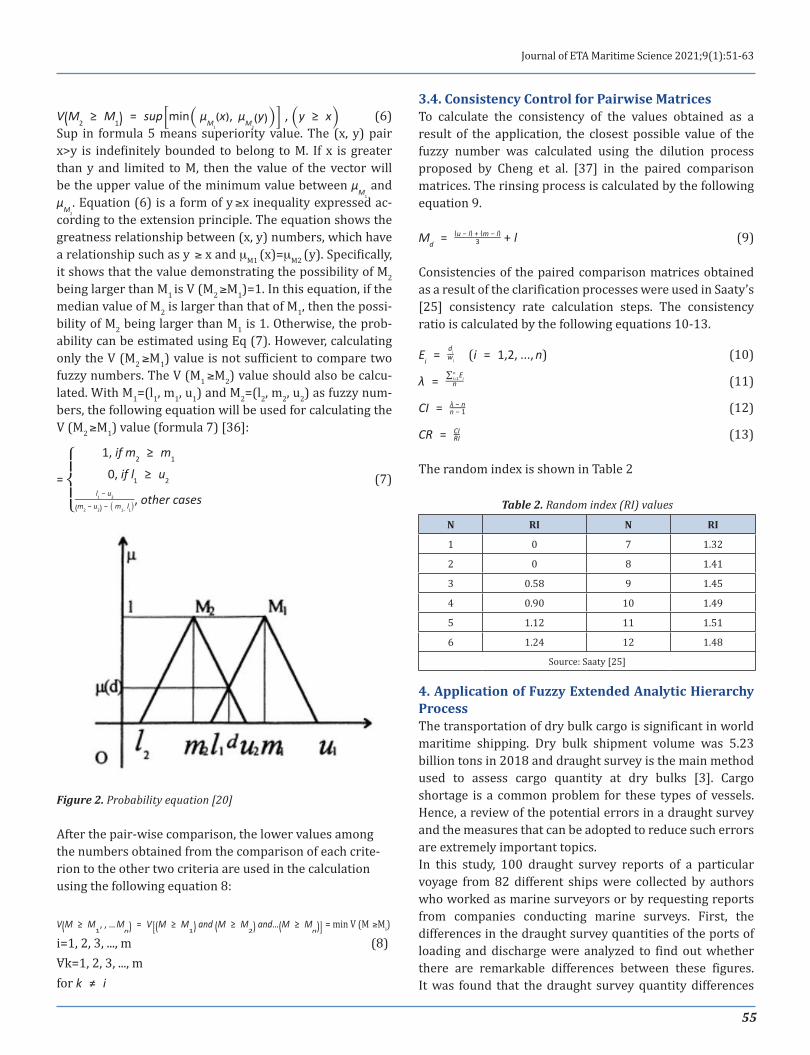
cording to the extension principle. The equation shows the greatness relationship between (x, y) numbers, which have a relationship such as y ≥ x and mM1 (x)=mM2 (y). Specifically, it shows that the value demonstrating the possibility of M2 being larger than M1 is V (M2 ≥M1)=1. In this equation, if the median value of M2 is larger than that of M1, then the possi-bility of M2 being larger than M1 is 1. Otherwise, the prob-ability can be estimated using Eq (7). However, calculating only the V (M2 ≥M1) value is not sufficient to compare two fuzzy numbers. The V (M1 ≥M2) value should also be calcu-lated. With M1=(l1, m1, u1) and M2=(l2, m2, u2) as fuzzy num-bers, the following equation will be used for calculating the V (M2 ≥M1) value (formula 7) [36]:
=
⎧
⎪ ⎨
⎪
⎩
1, if m 2 ≥ m 1
0, if l 1 ≥ u 2 l 1 − u 2 _ ( m 2 − u 2 ) − ( m 1− l 1 ) , other cases
(7)
Figure 2. Probability equation [20]
After the pair-wise comparison, the lower values among the numbers obtained from the comparison of each crite-rion to the other two criteria are used in the calculation using the following equation 8:
V (M ≥ M 1
, , … M n
) = V [ (M ≥ M 1
) and (M ≥ M 2
) and… (M ≥ M n
) ] = min V (M ≥Mi)
i=1, 2, 3, ..., m (8)k=1, 2, 3, ..., m
for k ≠ i
3.4. Consistency Control for Pairwise MatricesTo calculate the consistency of the values obtained as a result of the application, the closest possible value of the fuzzy number was calculated using the dilution process proposed by Cheng et al. [37] in the paired comparison matrices. The rinsing process is calculated by the following equation 9.
M d = (u − l) + (m − l) _ 3 + l (9)
Consistencies of the paired comparison matrices obtained as a result of the clarification processes were used in Saaty’s [25] consistency rate calculation steps. The consistency ratio is calculated by the following equations 10-13.
E i = d
i _ w i ( i = 1,2, ..., n ) (10)
λ = ∑ i=1 n E
i _ n (11)
CI = λ − n _ n − 1 (12)
CR = CI _ RI (13)
The random index is shown in Table 2
Table 2. Random index (RI) valuesN RI N RI
1 0 7 1.32
2 0 8 1.41
3 0.58 9 1.45
4 0.90 10 1.49
5 1.12 11 1.51
6 1.24 12 1.48
Source: Saaty [25]
4. Application of Fuzzy Extended Analytic Hierarchy ProcessThe transportation of dry bulk cargo is significant in world maritime shipping. Dry bulk shipment volume was 5.23 billion tons in 2018 and draught survey is the main method used to assess cargo quantity at dry bulks [3]. Cargo shortage is a common problem for these types of vessels. Hence, a review of the potential errors in a draught survey and the measures that can be adopted to reduce such errors are extremely important topics.In this study, 100 draught survey reports of a particular voyage from 82 different ships were collected by authors who worked as marine surveyors or by requesting reports from companies conducting marine surveys. First, the differences in the draught survey quantities of the ports of loading and discharge were analyzed to find out whether there are remarkable differences between these figures. It was found that the draught survey quantity differences

56
Analysis of Draught Survey Errors by Extended Fuzzy Analytic Hierarchy Process
between loading and discharging ports were between 0.20-0.50% at 18 voyages and more than 0.50% at 9 voyages. The authors were then convinced that this issue should be investigated (Table 3).In the second phase, the opinions of 7 experts with at least 6 years of bulk carrier experience onboard were obtained, and a decision hierarchy was constructed for the error sources and solution recommendations. Based on the decision hierarchy, a fuzzy AHP questionnaire was prepared by comparing the main criteria, sub-criteria, and alternatives for each set of criteria. In the third phase, the questionnaire was applied to a group of expert consisting of masters, officers, and draught surveyors (a total of 15 persons) with at least six years of experience onboard. The group comparison matrix was then created using the geometric mean (Table 4).A total of 17 comparison matrices were generated, including comparisons of the main criteria, sub-criteria of each main criterion, and alternatives for each sub-criterion. Thus, priority degrees of the main criteria, sub-
criteria, and alternatives were calculated using the fuzzy AHP methodology. According to the decision hierarchy formed (Figure 3), there are four main causes for the discrepancies in the draught survey. These errors at the time of draught reading are: errors at the time of ballast water measurement, errors related to the lack of training of the surveyor (LTS), and errors in the calculation step. The main criteria were divided into sub-criteria and the error causes were elaborated. In this study, the alternatives identified are training and documentation (TD), standardization in draught surveys (SDS), and control of the government agency (CG). After the application of the questionnaires and obtaining the final results from the experts’ opinions, results were discussed with the experts who answered the questionnaires. Evaluation of the findings and conclusions with experts revealed that the results obtained from the study matches with those of the practice, indicating that our study is consistent.
Table 3. Information about ships in which draught survey reports were collectedDeadweight Quantity Cargo Quantity Draught survey differences Quantity
1000-5000 5 Steel scrap 66 0-0.2% 73
5000-20000 21 Coal 6 0.2-0.5% 18
20000-50000 32 Grain 6 0.5-1% 4
More than 50000 42 Other bulk 22 More than 1% 5
Figure 3. Hierarchical structure of the study

57
Journal of ETA Maritime Science 2021;9(1):51-63
4.1. Criteria and Sub-criteria for Error Sources in Draught SurveyCriterion and sub-criterion effecting draught survey accuracy are obtained by referring to expert opinions. There are 4 main criteria and a total of 12 sub-criteria that consist the decision hierarchy as shown in Figure 3.DR: This is a criterion involving the difficulties encountered at the time of draught reading and the errors that might potentially arise from these difficulties. The visual status of the draught marks (VSD), unfavorable weather conditions (WC), and in some cases, the reckoning of the fore, mean, and aft draughts on the seaward side (RDS) if they cannot be read are among the most common difficulties in draught reading [1,2,6,7].Ballast measurement (BM): Measurement of the quantity of ballast water on a ship is a stage that might influence the consistency in a draught survey. The inability to measure
the density of the ballast water (EDB), errors at the time of sounding the tanks (SE), and ignoring of the list on the ship (ILS) while estimating the volume of the ballast water as a sounding value are among the main error sources that can be potentially encountered in the measurement of the ballast water quantity [1,2,6,7].LTS: The lack of knowledge of the surveyors in the draught survey stages and calculations (LTT), lack of familiarity with marine terms (UMF), not knowing the purpose and rationale of the processes in general, and failure to perform a correct and reasonable survey by considering the ethical values (LET) are the error sources that decrease the consistency and accuracy of the draught survey [11].Displacement calculation (DC): The DC errors that can be made by the surveyors involved in a draught survey are the errors in trim corrections (TCE) and draught corrections (DCE) and can yield an incorrect density of the seawater (EDSW) [2,7].
4.2. Alternatives for Draught Survey Error SourcesThree alternatives have been obtained based on experts’ opinions: TD, SDS, and CG.TD: It is recommended that the draught surveyors receive a training whose curriculum is determined by relevant international institutions and that they perform their duties after receiving a certificate. SDS: It is recommended that certain standards are set for the observation and equipment used in a draught survey. CG: It is recommended that a completely impartial public officer, who has no commercial expectation or concern and is familiar with the draught survey rules and calculations, attends the draught survey with the surveyors who act in favor of the parties involved such as the buyer, seller, charterer, or shipowner.
5. Comparison Matrices and Priority VectorsBased on expert assessment, 17 matrices were generated, which includes 1 matrix comparing the main criteria, 4 matrices comparing the sub-criteria, and 12 matrices comparing the alternatives for each sub-criterion.The process of determining the priority vectors started after the matrices were generated. The priority vector of the main criteria was calculated using Table 5:W’=(1, 0.72, 0.49, 0.31)T.The obtained values for the priority weights of the main criteria after normalization were as follows:W’=(0.40, 0.29, 0.19, 0.12)T.According to the obtained data, draught reading, BM, LTS’s, and DC have impacts, which are represented by the weights of 0.40, 0.29, 0.2, and 0.12, respectively, on the errors that occur in the draught survey.
Table 4. Information about the experts who contributed to this study
Expert profiles contributed to preparation of the decision hierarchy
No Rank Sea service (Years)
Draught surveyor experience (Years)
1 Master 13 5
2 Master 10 3
3 Chief officer 6 2
4 Chief officer 7 5
5 Chief officer 7 3
6 Chief officer 8 4
7 Chief officer 6 8
Expert profiles rated the pairwise comparison matrix
No Rank Sea service (Years)
Draught surveyor experience (Years)
8 Master 16 No
9 Master 14 No
10 Master 10 No
11 Master 9 1
12 Chief officer 7 6
13 Chief officer 6 2
14 Chief officer 8 1
15 Chief officer 8 1
16 Chief officer 6 4
17 Chief officer 9 No
18 Chief officer 6 1
19 Chief officer 8 No
20 Chief officer 6 3
21 Chief officer 6 2
22 Chief officer 7 1

58
Analysis of Draught Survey Errors by Extended Fuzzy Analytic Hierarchy Process
The priority vectors of the sub-criteria of the main criterion draught readings were calculated using Table 6:WDR=(0.54, 0.23, 0.23)T.Based on the calculations, unfavorable WC, VSD, and the inability to read the fore and aft draughts on the seaward side have effects as represented by the weights of 0.54, 0.23, and 0.23, respectively, on the errors that occur during draught reading.The priority vectors of the sub-criteria of the main criterion BM were calculated using Table 6:WBM=(0.29, 0.46, 0.25)T.According to the data obtained, the errors in measuring the EDB, sounding errors, and ILS have impacts as represented by the weights of 0.29, 0.46, and 0.25, respectively, on the errors that occur in the BM.The priority vectors of the sub-criteria of the main criterion of the LTS were calculated using Table 6:WLTS=(0.38, 0.42, 0.2)T.The lack of ethics training, lack of technical training, and unfamiliarity with the maritime field contribute with the weights of 0.38, 0.42, and 0.2, respectively, to the errors due to the LTS.The priority vectors of the sub-criteria of the main criterion of DC were calculated using Table 6:WDC=(0.34, 0.2 0.46)T.According to the data obtained, TCE, DCE, and errors in measuring the density of seawater have impacts with weights of 0.34, 0.2 and 0.46, respectively, on the errors that occur in the DC.The priority vectors of the alternatives for the errors related to the draught reading were calculated for TD, standardization of draught surveys, and control of the government agency as follows using Table 7:WWC=(0.33, 0.65, 0.03)T,WVSD=(0.19, 0.69, 0.03)T,WRDS=(0.23, 0.72, 0.05)T. The priority vectors of the alternatives for errors related to the BM were calculated for TD, standardization of draught surveys, and control of the government agency as follows using Table 7:WEDB=(0.13, 0.13, 0.74)T,
WSE=(0.53, 0.06, 0.41)T,WILS=(0.46, 0.2, 0.34)T.The priority vectors of the alternatives for the errors related to the LTS were calculated for TD, standardization of draught surveys, and control of the government agency as follows using Table 7:WLET=(0.62, 0.06, 0.31)T,WLTT=(0.93, 0.07, 00)T,WUMF=(0.89, 0, 0.11)T.
Table 5. Fuzzy pair-wise comparison matrix for the main criteriaDR BM LTS DC
DR (1.00-1.00-1.00) (1.14-1.59-2.11) (1.36-1.82-2.36) (1.14-1.44-1.80)
BM (0.47-0.63-0.87) (1.00-1.00-1.00) (0.87-1.26-1.78) (1.14-1.59-2.11)
LTS (0.42-0.55-0.74) (0.56-0.79-1.14) (1.00-1.00-1.00) (0.87-1.26-1.78)
DC (0.56-0.69-0.87) (0.47-0.63-0.87) (0.56-0.79-1.14) (1.00-1.00-1.00)
CR=0.059
DR: Reading draught, BM: Ballast measurement, LTS: Lack of training of the surveyor, DC: Displacement calculation
Table 6. Fuzzy pair-wise comparison matrices for the sub-criterion of draught reading, ballast measurement, surveyor
training, and displacement calculation criteriaWC VSD RDS
WC (1.00-1.00-1.00) (1.14-1.59-2.11) (1.21-1.44-1.70)
VSD (0.47-0.63-0.87) (1.00-1.00-1.00) (0.74-1.00-1.36)
RDS (0.59-0.69-0.82) (0.74-1.00-1.36) (1.00-1.00-1.00)
CR=0.064
EDB SE ILS
EDB (1.00-1.00-1.00) (0.56-0.79-1.14) (0.76-1.00-1.31)
SE (0.87-1.26-1.78) (1.00-1.00-1.00) (1.14-1.59-2.11)
ILS (0.76-1.00-1.31) (0.47-0.63-0.87) (1.00-1.00-1.00)
CR=0.081
LET LTT UMF
LET (1.00-1.00-1.00) (0.56-0.79-1.14) (1.14-1.59-2.11)
LTT (0.87-1.26-1.78) (1.00-1.00-1.00) (1.04-1.44-1.99)
UMF (0.47-0.63-0.87) (0.50-0.69-0.97) (1.00-1.00-1.00)
CR=0.048
TCE DCE EDSW
TCE (1.00-1.00-1.00) (1.14-1.26-1.36) (0.56-0.79-1.14)
DCE (0.74-0.79-0.87) (1.00-1.00-1.00) (0.50-0.69-0.97)
EDSW (0.87-1.26-1.78) (1.04-1.44-1.99) (1.00-1.00-1.00)
CR=0.031
WC: Weather conditions, VSD: The visual status of the draught marks, RDS: The reckoning of the fore, mean, and aft draughts on the seaward, ILS:
Ignoring of the list on the ship side, TCE: The errors in trim corrections, DCE: Draught corrections, EDB: Errors in measuring the density of the
ballast water, SE: Sounding errors, LET: Lack of ethical training, LTT: Lack of technical training, UMF: Unfamiliarity with the maritime field, EDSW: Errors
in measuring the density of sea water

59
Journal of ETA Maritime Science 2021;9(1):51-63
Table 7. Fuzzy pair-wise comparison matrix for the alternatives with respect to draught reading, ballast measurement, surveyor training, and displacement calculation criteria
TD SDS CG
Draught reading criterion
Comparison of alternatives of sub-criterion EDB
TD (1.00-1.00-1.00) (0.87-1.00-1.14) (0.74-0.79-0.87)
SDS (0.87-1.00-1.14) (1.00-1.00-1.00) (0.74-0.79-0.87)
CG (1.14-1.26-1.36) (1.14-1.26-1.36) (1.00-1.00-1.00)
CR=0.032
Comparison of alternatives of sub-criterion SE
TD (1.00-1.00-1.00) (1.52-1.59-1.65) (0.87-1.26-1.78)
SDS (0.61-0.63-0.66) (1.00-1.00-1.00) (0.50-0.69-0.97)
CG (0.56-0.79-1.14) (1.04-1.44-1.99) (1.00-1.00-1.00)
CR=0.004
Comparison of alternatives of sub-criterion ILS
TD (1.00-1.00-1.00) (1.04-1.44-1.99) (0.87-1.26-1.78)
SDS (0.50-0.69-0.97) (1.00-1.00-1.00) (0.74-0.79-0.87)
CG (0.56-0.79-1.14) (1.14-1.26-1.36) (1.00-1.00-1.00)
CR=0.031
Ballast measurement criterion
TD SDS CG
Comparison of alternatives of sub-criterion WC
TD (1.00-1.00-1.00) (0.56-0.79-1.14) (1.14-1.26-1.36)
SDS (0.87-1.26-1.78) (1.00-1.00-1.00) (1.52-2.00-2.56)
CG (0.74-1.26-1.78) (0.39-0.50-0.66) (1.00-1.00-1.00)
CR=0.029
Comparison of alternatives of sub-criterion VSD
TD (1.00-1.00-1.00) (0.42-0.55-0.74) (1.00-1.14-1.33)
SDS (1.36-1.82-2.36) (1.00-1.00-1.00) (1.16-1.59-2.16)
CG (0.75-0.87-1.00) (0.46-0.63-0.86) (1.00-1.00-1.00)
CR=0.031
Comparison of alternatives of sub-criterion RDS
TD (1.00-1.00-1.00) (0.42-0.55-0.74) (1.00-1.26-1.55)
SDS (1.36-1.82-2.36) (1.00-1.00-1.00) (1.36-1.82-2.36)
CG (0.64-0.79-1.00) (0.42-0.55-0.74) (1.00-1.00-1.00)
CR=0.031
Surveyor training criterion
TD SDS CG
Comparison of alternatives of sub-criterion LET
TD (1.00-1.00-1.00) (1.16-1.59-2.16) (1.14-1.59-2.11)
SDS (0.46-0.63-0.86) (1.00-1.00-1.00) (0.66-0.69-0.74)
CG (0.47-0.63-0.87) (1.36-1.44-1.52) (1.00-1.00-1.00)
CR=0.031
Comparison of alternatives of sub-criterion LTT
TD (1.00-1.00-1.00) (1.78-2.29-2.80) (1.78-2.29-2.80)
SDS (0.36-0.44-0.56) (1.00-1.00-1.00) (0.87-1.26-1.78)
CG (0.36-0.44-0.56) (0.56-079-1.14) (1.00-1.00-1.00)
CR=0.033

60
Analysis of Draught Survey Errors by Extended Fuzzy Analytic Hierarchy Process
The priority vectors of the alternatives for the errors related to the DC were calculated for TD, standardization of draught surveys, and control of the government agency as follows using Table 7:WTCE=(0.89, 0, 0.11)T,WDCE=(0.89, 0, 0.11)T,WEDSW=(0.33, 0.22, 0.44)T.After the weight vectors of all the main criteria, sub-criteria, and alternatives for the criteria were obtained, the overall priority vectors of the alternatives were calculated. In this step, based on the sub-criteria, the priority vectors of the main criteria of the alternatives were calculated by multiplying the priority vectors of the sub-criteria by those of the alternatives (Table 8).After the weights of the alternatives were determined by the main criteria, those based on the goal were calculated as shown in Table 9 following the directions in Table 8.Based on the calculation, to solve the problem of the error sources in the draught survey, TD alternative has
a prioritized significance with a priority weight of 0.44. Standardization in the draught survey (0.33) and control of the government agency (0.23) are identified as the best alternatives for problem solving.
6. DiscussionOur study reveals that the errors occurring in the draught reading stage are the main source of draught survey errors with 0.40 priority weight. It is followed by BM (0.29), lack of training (0.19), and DC errors (0.12) by weight vector order. Two major factors with priority weights of 0.40 and 0.29 have a big impact on draught survey errors. This means that corrective actions for these factors will have a great impact on the reliability of draught surveys. In parallel with a previous study conducted by Xu et al. [7], the draught reading stage is found to be the main source of draught survey errors. However, the priority weight of the draught reading stage in our study is found to be lower compared to the aforementioned study.Similar to the Japan P&I Club loss prevention bulletin
Table 7. ContinuedSurveyor training criterion
TD SDS CG
Comparison of alternatives of sub-criterion UMF
TD (1.00-1.00-1.00) (1.04-1.44-1.99) (0.87-1.26-1.78)
SDS (0.50-0.69-0.97) (1.00-1.00-1.00) (1.00-1.00-1.00)
CG (0.56-0.79-1.14) (1.00-1.00-1.00) (1.00-1.00-1.00)
CR=0.031
Displacement calculation
TD SDS CG
Comparison of alternatives of sub-criterion TCE
TD (1.00-1.00-1.00) (1.99-2.52-3.04) (1.14-1.59-2.11)
SDS (0.33-0.40-0.50) (1.00-1.00-1.00) (0.66-0.69-0.74)
CG (0.47-0.63-0.87) (1.36-1.44-1.52) (1.00-1.00-1.00)
CR=0.018
Comparison of alternatives of sub-criterion DCE
TD (1.00-1.00-1.00) (1.99-2.52-3.04) (1.14-1.59-2.11)
SDS (0.33-0.40-0.50) (1.00-1.00-1.00) (0.66-0.69-0.74)
CG (0.47-0.63-0.87) (1.36-1.44-1.52) (1.00-1.00-1.00)
CR= 0.018
Comparison of alternatives of sub-criterion EDSW
TD (1.00-1.00-1.00) (0.87-1.00-1.14) (0.87-1.00-1.14)
SDS (0.87-1.00-1.14) (1.00-1.00-1.00) (0.74-0.79-0.87)
CG (0.87-1.00-1.14) (1.14-1.26-1.36) (1.00-1.00-1.00)
CR= 0.075
TD: Training and documentation, SDS: Standardization in draught surveys, CG: Control of the government agency, ILS: Ignoring of the list on the ship side, WC: Weather conditions, VSD: The visual status of the draught marks, RDS: The reckoning of the fore, mean, and aft draughts on the seaward, EDB: Errors
in measuring the density of the ballast water, SE: Sounding errors, LET: Lack of ethical training, LTT: Lack of technical training, UMF: Unfamiliarity with the maritime field, EDSW: Errors in measuring the density of sea water, TCE: The errors in trim corrections, DCE: Draught corrections

61
Journal of ETA Maritime Science 2021;9(1):51-63
[11], it is denoted that different surveyors may interpret readings and calculations differently, which may bring out big variations in final results.In similar to the UK P&I Club 2008 draught survey bulletin [2], our study shows that the measurement of ballast water quantity is a considerable source of errors that may end up with unacceptable inaccuracies. Additionally, in the same bulletin, it is recommended that draughts should be read from both sides of the vessel. As mentioned in the bulletin, it is a fact that reading the offside draught marks onto a service boat will provide a more stable and reliable draught reading. This is in parallel with our findings.In parallel to our study, Isbester [6] indicates that rough sea conditions will make accurate draught reading difficult or impossible to obtain. Our study reveals that an inaccuracy in the draught reading stage has the greatest effect on draught survey errors and the main source of draught reading errors is rough seas. Isbester [6] also points out that the wrong measurement of seawater or ballast water density may cause remarkable errors in draught surveys. These issues are also evaluated in our study and errors during the measurement of both ballast water density and seawater density, which were found to affect the accuracy of draught surveys.ECE [1] indicates that careless repainting of draught marks can cause an erroneous reading. This error source is related to the VSD that is evaluated as a cause of inaccuracy at the draught reading stage in our research, showing similar indications between the two papers.In our study, unlike the previous research conducted by Xu et al. [7], the education effect on draught survey errors is ranked A. The “LTS” criterion is found to be the third main source of draught survey errors with 0.2 priority weight. Ethical and technical problems occurring due to surveyors are commonly mentioned factors affecting draught survey accuracy in the literature. However, quantifying their effects on the draught survey accuracy was a gap that is answered by our study from the experts’ perspectives.Contrary to previous studies, alternatives for improving draught survey reliability are suggested. Effects of suggested alternatives are analyzed using the fuzzy AHP method and the priority weights of the alternatives are quantified. The proposed prioritized alternatives can be a guide for minimizing draught survey errors, as they include the potential contribution that each alternative can offer to the improvement of the problem.Limitations of the study: Officers and masters contributed to our study by their opinions based on their work experience in ships with a deadweight between 3,000-82,000 MT. Draught surveyors with sea service experience contributed to our study by their opinions based on working as surveyors in Turkish Ports only.
Table 8. Weight factors of the alternatives determined by the main criteria
Priority vectors for the main criterion of reading draughts
WC VSD RDS Priority vector
Importance level 0.22 0.09 0.09
TD 0.33*0.22 0.19*0.09 0.23*0.09 0.11
SDS 0.65*0.22 0.69*0.09 0.72*0.09 0.27
CG 0.03*0.22 0.12*0.09 0.05*0.09 0.02
Priority vectors for the main criterion of ballast measurement
EDB SE ILS Priority vector
Importance level 0.08 0.13 0.07
TD 0.13*0.08 0.53*0.13 0.46*0.07 0.11
SDS 0.13*0.08 0.06*0.13 0.20*0.07 0.03
CG 0.74*0.08 0.41*0.13 0.34*0.07 0.14
Priority vectors for the main criterion of lack of training of surveyors
LET LTT UMF Priority vector
Importance level 0.07 0.08 0.04
TD 0.62*0.07 0.93*0.08 0.49*0.04 0.14
SDS 0.06*0.07 0.07*0.08 0.24*0.04 0.02
CG 0.31*0.07 0*0.08 0.27*0.04 0.03
Priority vectors for the main criterion of displacement calculation
TCE DCE EDSW Priority vector
Importance level 0.04 0.02 0.06
TD 0.89*0.04 0.89*0.02 0.33*0.06 0.08
SDS 0*0.04 0*0.02 0.22*0.06 0.01
CG 0.11*0.04 0.11*0.02 0.44*0.06 0.03
TD: Training and documentation, SDS: Standardization in draught surveys, CG: Control of the government agency, WC: Weather conditions, VSD: The visual status of the draught marks, RDS: The reckoning of the fore, mean, and aft draughts on the seaward, EDB: Errors in measuring the density of the ballast water, SE: Sounding errors, LET: Lack of ethical training, LTT:
Lack of technical training, UMF: Unfamiliarity with the maritime field, EDSW: Errors in measuring the density of sea water, TCE: The errors in
trim corrections, DCE: Draught corrections
Table 9. Weight factors of the alternatives determined by the goal
DR BM LTS DC Total weights
TD 0.11 0.11 0.14 0.08 0.44
SDS 0.27 0.03 0.02 0.01 0.33
CG 0.02 0.14 0.03 0.03 0.23
TD: Training and documentation, SDS: Standardization in draught surveys, CG: Control of the government agency, DR: Reading draught, BM: Ballast
measurement, LTS: Lack of training of the surveyor, DC: Displacement calculation

62
Analysis of Draught Survey Errors by Extended Fuzzy Analytic Hierarchy Process
7. ConclusionsConsidering the alternatives suggested, it is concluded that corrective actions against human errors will decrease existing errors and increase draught survey reliability. A well-planned training program giving both ethical and technical education and competency to the surveyors is the main solution for this issue. The surveyors who receive draught survey training should be awarded a card serving as a certificate of authorization, and those who do not hold a certificate of competency should be prevented from participating in draught surveys.Preparing a standard draught survey program for vessels and surveyors and performing draught survey calculations in such programs to prevent operational errors would improve the accuracy of the calculation.Warnings such as fines or suspended entry to ports for a specific duration should be imposed on the surveyors or crew members who act in a misleading manner or repeatedly make incorrect calculations. Because there is no penal sanction on the surveyors or crew members who act in a misleading manner, setting standards in this regard would have an impact in dissuading such behaviors.For ignoring malicious manipulations from surveyors working on behalf of different parties, stevedores and other participants to draught surveys, a public officer who has no commercial relationship with any of the parties at the ports and who cannot be pressured might be assigned to control the readiness and compliance of the conditions and parties to the survey by accompanying the survey step and also for performing the draught survey calculation for official records. Every surveyor should have their own equipment that will be used during the survey and their certificates should be checked by all surveyors. Any surveyor with invalid equipment or certificate should not be allowed to participate in the draught survey.Standards should be set for the WC required for a draught survey. DR of seaside marks on a boat should be set compulsory for both the safety and accuracy of the survey. In case the cargo quantity is assessed by a shore scale, the responsible party should also send a surveyor for the draught survey to check the cargo quantity. Else, it should be accepted by the rules that the ship has no responsibility on the cargo quantity at any port related to that particular voyage to ignore malicious stevedore manipulations.As researches about draught survey errors and their sources are very limited in the academic literature, the authors of this study believe that it is necessary to focus on this issue and enlighten the dark spots. In this research, draught survey errors were analyzed by the fuzzy AHP method that is based on experts’ opinions. For this reason, the study’s determinations of draught survey error sources are limited
with experts’ opinions and perspectives. It is recommended to research on the P&I official cargo shortage case reports (where cargo quantity is assessed by draught survey) to determine human and technical factors in draught survey errors for a more comprehensive content.
Authorship Contributions Concept design: R. Canımoğlu, U. Yıldırım, Data Collection or Processing: R. Canımoğlu, Analysis or Interpretation: R. Canımoğlu, U. Yıldırım, G. M. İnegöl, Literature Review: R. Canımoğlu, U. Yıldırım, G. M. İnegöl, Writing, Reviewing and Editing R. Canımoğlu, U. Yıldırım, G. M. İnegöl.Funding: The authors declared that this study received no financial support.
References[1] “Economic and Social Council. Code of Uniform Standards and
Procedures for the Performance of Draught Surveys of Coal Cargoes.” ECE, 1992. [Retrieved 17 December 2019 from]. https://www.unece.org/fileadmin/DAM/ie/se/pdfs/ece_energy_19e.pdf.
[2] “UK P&I Club, Carefully to Carry,” Cargo Measurement, London: UK P&I Club.
[3] “Review of Maritime Transport,” UNCTAD, 2019. Retrieved January 12th, 2021, from https://unctad.org/system/files/official-document/rmt2019_en.pdf
[4] IIMS. “Unit 5 Draught Surveying,” [Retrieved January 16th, 2021, from] https://www.academia.edu/33673828/UNIT_5_Draught_Surveying
[5] C. B. BARRASS, and D.R, “Ship Stability for Masters and Mates,” Oxford: Elsevier Ltd, ISBN: 13:987-0-7506-6784-5. DERRETT, 2006.
[6] J. Isbester, “Bulk Carrier Practice,” London: ISBN: 1870077164. The Nautical Institute; 1993.
[7] G. Xu, K. Zhao, Z. Zuo, G. Liu, B. Jian, Y. Lın, et al. “Assessing Risk of Draught Survey by AHP Method,” China: AIP Conference Proceedings; 2018.
[8] Ö. Uğurlu, “Application of Fuzzy Extended AHP Methodology for Selection of Ideal Ship for Oceangoing Watchkeeping Officers,” International Journal of Industrial Ergonomics, vol. 47, pp. 132-140, May 2015.
[9] IIMS (1996) “Code of Practice for Draught Surveys. International Institute of Marine Surveyors,” Witherby & Company Ltd; 0 edition, London: January 1, 1998.
[10] West of England P&I Club (2018). “Inaccuracies in Draught Surveys,” [Retrieved December 18th, 2019] from https://www.westpandi.com/getattachment/08717f3d-c72d-43f8-a872-3efcbf4345f9/loss-prevention-bulletins_inaccuracies-in-draught-surveys_v2_lr-1-.pdf?disposition=attachment
[11] Japan P&I Club, “Preventing Cargo Shortage,” P&I Loss Prevention Bulletin vol. 37, Tokyo: Japan P&I Club, 2016.
[12] UK P&I Club, “Cargo Measurement,” Retrieved July 20, 2019 from https://www.ukpandi.com/fileadmin/uploads/uk-pi/LP%20Documents/Carefully_to_Carry/C2C_Articles_2018/Cargo_Measurement.pdf

63
Journal of ETA Maritime Science 2021;9(1):51-63
[13] J. Ernstsen, and S. Nazir, “Consistency in the development of performance assessment methods in the maritime domain,” WMU Journal of Maritime Affairs, vol. 17, pp. 71-90, February 2018.
[14] J. H. Myers, and M. I. Alpert, “Determinant Buying Attitudes: Meaning and Measurement,” Journal of Marketing, vol. 32, pp. 13-20, 1968.
[15] T. L. Saaty, “A scaling method for priorities in hierarchical structures.” Journal of Mathematical Psychology, vol. 15, pp. 234-281, June 1997.
[16] E. W. L. Cheng, H. Li, and D. C. K. Ho, “Analytic Hierarchy Proses (AHP) a Defective Tool When Used Improperly,” Measuring Business Excellence, vol. 6, pp. 33-37, December 2002.
[17] P. J. M. van Laarhaven, and W. Pedrycz, “A Fuzzy Extension of Saaty’s Priority Theory, ” Fuzzy Sets and Systems, vol. 11, pp. 229-241, 1983.
[18] T. L. Saaty, Decision Making for Leaders: The Analytical Hierarchy Process for Decisions in a Complex World. Pennsylvania: Lifetime Learning Publications, 1982.
[19] Y. M. Wang, T. Elhag, and Z. Hua, “A Modified Fuzzy Logarithmic Least Squares Method for Fuzzy Analytic Hierarchy Process,” Fuzzy Sets and Systems, vol. 157, pp. 3055-3071, 2007.
[20] D.Y. Chang, “Applications of the extent analysis method on fuzzy AHP,” European Journal of Operational Research, vol. 95, pp. 649-655, December 1996.
[21] N. Gedik, “Assessment of the Importance of Competence Criteria for Persons Who Will Work as Electro-Technical Officer on Board.” Journal of ETA Maritime Science, vol. 5, pp. 140-152, 2017.
[22] C. R. Wu, C. W. Chang, and H. L. Lin, “Evaluating The Organizational Performance Of Taiwanese Hospitals Using The Fuzzy Analytic Hierarchy Process,” The Journal of American Academy of Business, vol. 9, pp. 201-210, 2006.
[23] D.Y. Chang, “Extent analysis and synthetic decision,” Optimization Techniques and Applications, vol. 95, pp. 52-355, 1992.
[24] L. Mıkhaılov, “Deriving Priorities from Fuzzy Pairwise Comparison Judgements,” Fuzzy Sets and Systems, vol. 134, pp. 365-385, March 2003.
[25] T.L. Saaty, “How to make a decision: the analytic hierarchy process,” European Journal of Operational Research, vol. 48, pp. 9-26, September 1990.
[26] Y. M. Wang, Y. Luo, Z. Hua, “On the extent analysis method for fuzzy AHP and its applications,” European Journal of Operational Research, vol, 186, pp. 735-747, April 2008.
[27] L. A. Zadeh, “Fuzzy Sets,” Information and Control, vol. 8, pp. 338-353, June 1965.
[28] H. M. Hsu, and C. T. Chen, “Fuzzy credibility relation method for multiple criteria decision-making problems,” Information Sciences, vol. 96, pp. 79-91, January 1997.
[29] J. J. Buckley, “Fuzzy Hierarchical Analysis,” Fuzzy Sets and Systems, vol. 17, pp. 233-247, December 1985.
[30] W. Perdycz, “Why triangular membership functions?” Fuzzy Sets and Systems, vol. 64, pp. 21-30, May 1994.
[31] A. H. Lee, W. C. Chen, and C. J. Chang, “A fuzzy AHP and BSC Approach for Evaluating Performance of IT Department in the Manufacturing Industry in Taiwan,” Expert Systems with Applications, vol. 34, pp. 96-107, January 2008.
[32] S. Köse, M. Özkök, F.B. Demirel, and E. Köse, “Performance Indicators Considered for Selection of Agency in Maritime Industry,” Transportation Journal, vol. 57, pp. 238-257, 2018.
[33] C. W. Chang C. R. Wu, C. T. Lin, and H. C. Chen, “Evaluating and controlling silicon wafer slicing quality using fuzzy analytic hierarchy and sensitivity,” International Journal of Advanced Manufacturing Technology, vol. 36, pp. 322-333, March 2008.
[34] K. Zhu, Y. Jıng, and D. Chang, “A discussion on Extent Analysis Method and Applications of Fuzzy AHP,” European Journal of Operational Research, vol. 116, pp. 450-456, July 1999.
[35] F. T. S. Chang, and N. Kumar “Global Supplier Development Considering Risk Factors Using Fuzzy Extended AHP-Based Approach,” Omega, vol. 35, pp. 417-431, August 2007.
[36] N. B. Chang, Y. H. Chang, and H. W. Chen, “Fair Fund Distribution for a Municipal Incinerator Using GIS-Based Fuzzy Analytic Hierarchy Process,” Journal of Environmental Management, vol. 90, pp. 441-454, Jan 2007.
[37] A. C. Cheng, C. J. Chen, and C. Y. Chen, “A fuzzy multiple criteria comparison of technology forecasting methods for predicting the new materials development,” Technological Forecasting and Social Change, vol. 75, pp. 131-141, January 2008.