Embed Size (px)
Citation preview

March 2000 Economic Information ReportEIR 00-1
Analysis of Cut Foliage Businessesin Florida, 1997
Alan W. Hodges, Loretta N. Satterthwaite and John J. Haydu
Food & Resource Economics DepartmentAgricultural Experiment StationsCooperative Extension ServiceInstitute of Food & Agricultural Sciences
ii
ANALYSIS OF CUT FOLIAGE BUSINESSES IN FLORIDA, 1997
Alan W. Hodges, Loretta N. Satterthwaite and John J. HayduUniversity of Florida, Institute of Food & Agricultural Sciences
Food & Resource Economics Department, Gainesville, FLand Mid-Florida Research and Education Center, Apopka, FL
Revised March 28, 2000
ABSTRACT
Information is presented on sales, production,costs, assets and liabilities, and efficiencyindicators for 12 cut foliage businesses inFlorida for the year of 1997, and changes inbusiness performance from the previous year. The average firm had annual sales of $902thousand (K), used 45 acres of productionarea, employed 23 full-time equivalent (FTE)persons, and managed $1.158 million (M) inowned and leased capital. Value produced peracre of growing area averaged $15.3K. Totalsales per FTE person averaged $38.9K. Totalcapital managed per FTE and per acre ofgrowing space averaged $50.0K and $25.8K,respectively. Managed capital turnoveraveraged 0.78. Total costs averaged $892Kand total costs per acre of production areaaveraged $14.4K. As a share of total sales,expenses averaged 41 percent for employeelabor, 13 percent for materials, 18 percent forfinished products brokered, 3 percent forequipment/facilities, 12 percent foradministrative overhead, 7 percent for capital,and 5 percent for management/owners. Netincome, including owner/managementcompensation, averaged $166K and net profitmargin averaged 16 percent. Rate of returnon assets and rate of return on net worth were18.8 and 34.7 percent, respectively. Overallbusiness profitability was markedly improved in1997 over the previous year for the same firmssampled. Similar information is presented forlarge-, medium-, and small-sized firms, as wellas highly profitable firms.
KEY WORDS: cut foliage, fernery,ornamental plant products, business analysis,sales, costs, returns, efficiency, Florida.
ACKNOWLEDGMENTS
This report was made possible by the ownersand managers of cooperating firms who madetheir records available on a confidential basisfor analysis and averaging. Assistance wasprovided by University of Florida ExtensionOrnamental Horticulture Agents LindaLandrum, Diane Dilger and Austin Tilton, andCut Foliage Extension Specialist Dr. RobertStamps. Data collection and analysis wasunderwritten, in part, by Farm Credit ofDeLand, FL.

iii
TABLE OF CONTENTS
ABSTRACT . . . . . . . . . . . . . . . . . . . . . . . . . . ii
ACKNOWLEDGMENTS . . . . . . . . . . . . . . . . ii
INTRODUCTION . . . . . . . . . . . . . . . . . . . . 1The Cut Foliage Industry . . . . . . . . . 1The University of Florida Business
Analysis Program . . . . . . . . . 1
PROCEDURES . . . . . . . . . . . . . . . . . . . . . . 1Sample of Firms and Industry Groups
Analyzed . . . . . . . . . . . . . . . 1Information Collected and Reported 2Accounting and Measurement
Conventions . . . . . . . . . . . . . 2
RESULTS . . . . . . . . . . . . . . . . . . . . . . . . . . 2Income and Value Produced . . . . . . 2
Annual Sales . . . . . . . . . . . . 2Plant Inventory Change and
Total Value Produced 2Total Income . . . . . . . . . . . . 3Monthly Sales . . . . . . . . . . . 3
Resources Used . . . . . . . . . . . . . . . 3Land . . . . . . . . . . . . . . . . . . . 3Labor . . . . . . . . . . . . . . . . . . 3Capital Managed . . . . . . . . . 3
Productivity, Efficiency and Intensity Indicators . . . . . . . . . . . . . . . 4Value Produced per Acre . . . 4Value Produced per Worker . 4Capital Managed per Acre . . 4Growing Area Managed per
Worker . . . . . . . . . . . 4Managed Capital Turnover . . 4
Expenses and Cost Efficiency . . . . . 5Employee Expenses . . . . . . 5Materials Expenses . . . . . . . 5Finished Product Purchases 5Facility and Equipment
Expenses . . . . . . . . . 5Administrative Overhead
Expenses . . . . . . . . . 5Capital Costs . . . . . . . . . . . . 5Management/Owner
Compensation . . . . . 6Total Costs . . . . . . . . . . . . . . 6Cost as a Share of Sales . . . 6Cost per Acre . . . . . . . . . . . . 6
Net Returns and Profitability . . . . . . 8Net Firm Income . . . . . . . . . 8Net Margin . . . . . . . . . . . . . . 8Rate of Return on Assets . . . 8Rate of Return on Net Worth 8
Balance Sheet and Financial Ratios 9Assets . . . . . . . . . . . . . . . . . 9Liabilities . . . . . . . . . . . . . . . 9Net Worth . . . . . . . . . . . . . . 9Leverage . . . . . . . . . . . . . . . 9Quick Ratio . . . . . . . . . . . . . 9
Changes in Business PerformanceBetween 1996 and 1997 . . 11
REFERENCES . . . . . . . . . . . . . . . . . . . . . 11
APPENDIX. Florida Cut Foliage BusinessAnalysis Worksheet . . . . . . . . . . . . 12
LIST OF TABLES
Table 1. Income and value produced forFlorida cut foliage businesses, 1997 3
Table 2. Productive resources used by Floridacut foliage businesses, 1997. . . . . . 4
Table 3. Resource productivity, efficiency anduse intensity indicators for Florida cutfoliage businesses, 1997 . . . . . . . . . 5
Table 4. Operating expenses for Florida cutfoliage businesses, 1997 . . . . . . . . . 7
Table 5. Cost efficiency indicators for Floridacut foliage businesses, 1997 . . . . . . 8
Table 6. Net returns and profitability for Floridacut foliage businesses, 1997 . . . . . . 9
Table 7. Assets, liabilities and net worth forFlorida cut foliage businesses, 1997 10
Table 8. Financial ratios for Florida cut foliagebusinesses, 1997 . . . . . . . . . . . . . 10
Table 9. Percentage change in business performance for Florida cut foliage businesses, 1996-97 . . . . . . . . . . . 11
LIST OF FIGURES
Figure 1. Sales of cut foliage by United Statesand Florida growers, 1985–97. . . . . 1
Figure 2. Average monthly sales per firm forFlorida cut foliage businesses, 1997. 3
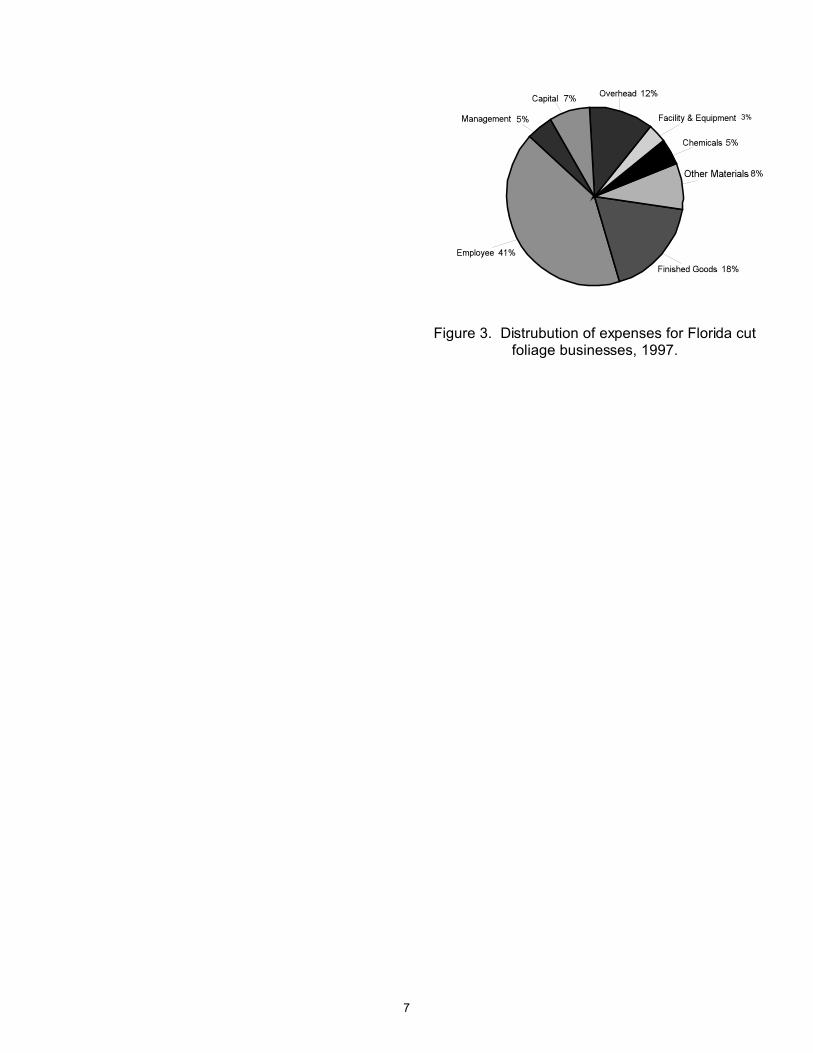
Figure 3. Distribution of expenses for Floridacut foliage businesses, 1997. . . . . . 6

iv

1
Figure 1. Cut foliage sales for Florida and theUnited States, 1985–97.
ANALYSIS OF CUT FOLIAGEBUSINESSES IN FLORIDA, 1997
Alan W. Hodges1, Loretta N. Satterthwaite2
and John J. Haydu
INTRODUCTION
The Cut Foliage Industry
The state of Florida is the largest producer ofcultivated ornamental cut foliage products inthe U.S. with total farmgate sales in 1997 of$86 million from 130 wholesale producers and7,382 acres in production (NASS, 1998). Leatherleaf fern (Rumohra adiantiformis) is themost important cut foliage product in Florida,accounting for 69 percent of all cut foliagesales and 63 percent of production area. Other cut foliage crops produced in Florida,include several species of ornamentalasparagus (Asparagus spp.), Japanesepittosporum (Pittosporum tobira), English ivy(Hedera helix) and aspidistra (Aspidistraelatior) (Stamps and Conover, 1986). Sales ofcut foliage by growers in Florida and otherstates over the period 1985–97 are shown inFigure 1. The cut foliage industry in Floridagrew rapidly during the 1970s and early 1980s,then slowed in the latter 1980s and 1990s(NASS, 1999). Sales were down sharply in1997 from the previous year.
The University of Florida Business
Analysis Program
Information in this report was collected as partof the University of Florida's ongoing BusinessAnalysis and Planning Program for the state’shorticultural industries (Hodges et al, 1997). Since the 1960s, this program has gatheredand analyzed confidential production andaccounting records from wholesale nurseries
in Florida to compile industry average financialperformance benchmarks. In 1996, theBusiness Analysis Program included the cutfoliage industry for the first time (Hodges et al.,1998). This report presents results for asecond year (1997).
PROCEDURES
Sample of Firms and Industry GroupsAnalyzed. Information for this report wascollected from twelve (12) wholesale cutfoliage grower firms in Florida for the 1997fiscal year. Firms were located in Volusia,Lake and Putnam counties. The firmsparticipated in the program on a voluntarybasis and in exchange received a report withinformation similar to that presented in thispaper. The sample of businesses analyzed inthis report is believed to represent firms withabove-average management quality, by virtueof their willingness to participate in qualityimprovement programs such as this. Recordswere compiled and analyzed separately forthree different groups of firms based upon totalannual sales: large firms had sales of $1million or greater; medium firms had sales of$500 to $999 thousand; small firms had salesof less than $500 thousand. Results for asubgroup of seven firms with rates of return onnet worth of at least 30 percent were alsoanalyzed and reported separately as as "highly
1 Coordinator of Economic Analysis, University of
Florida, Food & Resource Economics
Department, PO Box 110240, Gainesville FL
32611, tel 352-392-1881 x312, fax 352-392-
3646, email [email protected] Senior Statistician and Extension Economist,
respectively, University of Florida, Mid-Florida
Research and Education Center, Apopka, FL.
2
profitable" firms.
Information Collected and Reported. Datagathered from participating firms includedmonthly sales, other income, expensesitemized in 26 categories, assets and liabilities,inventory values, value of leased property,production area, and labor hours or number offull-time persons employed. Information wasgathered through personal interviews withmanagement, from company financialstatements, income tax forms, and otherproduction records. Data was transcribed tostandard worksheet forms (see Appendix) andentered into computer spreadsheets foranalysis. Results were calculated as weightedaverages for firms in each group, so largerfirms had greater influence on the results byvirtue of their greater production or financialvalues.
Accounting and Measurement Conventions. A number of accounting conventions wereadopted for this analysis in order tostandardize the collection of information fromdifferent firms. Because most of these firmsoperate under a cash-based accountingsystem, sales and expenses reflect collectionsand disbursements made during the period,respectively. Sales of finished productspurchased brokered for other firms werededucted from total sales to yield own-productsales. All assets and liabilities were evaluatedto represent a mid-year position by averagingthe beginning and ending values for the period(Jan. 1 to Dec. 31). Investments in buildings,site improvements, machinery and equipmentwere taken at book value, i.e. original cost lessaccumulated depreciation. Leased capitalassets in land, buildings, and equipment wereestimated at current market value. Investments in land were generally valued atthe original purchase price, rather than thecurrent appreciated values. Depreciationexpenses on fixed assets were taken fromcompany depreciation schedules, which werecomputed according to the IRS AcceleratedCost Recovery System (ACRS) method (3, 5,or 7 years) for equipment, and straight-line ordouble declining balance methods (10 to 20years) for buildings and improvements. Product inventories were accounted for on anaccrual basis, where changes in inventory
values were added to sales to calculate totalvalue of production and total income. Inventories were also included among ownedcapital investments. In addition to book valuesor computed field values for inventories, plantinventories included an additional 25 percentof annual sales to adjust for the value of theestablished crop beds, which take 9 months to1 year to begin producing and 2 to 3 years toreach full production. In cases where assetswere personally owned by corporate officersand leased exclusively to the company, theseassets were taken at book value rather thanmarket value, and debts to corporate officerswere not included among company liabilitieswhen there was no intention to repay thesedebts. In some cases, lease payments forland were taken as compensation formanagement. For firms that did not havecurrent records available on their growingarea, the net usable growing space wasestimated at 70 percent of the overallproduction area.
RESULTS
Income and Value Produced
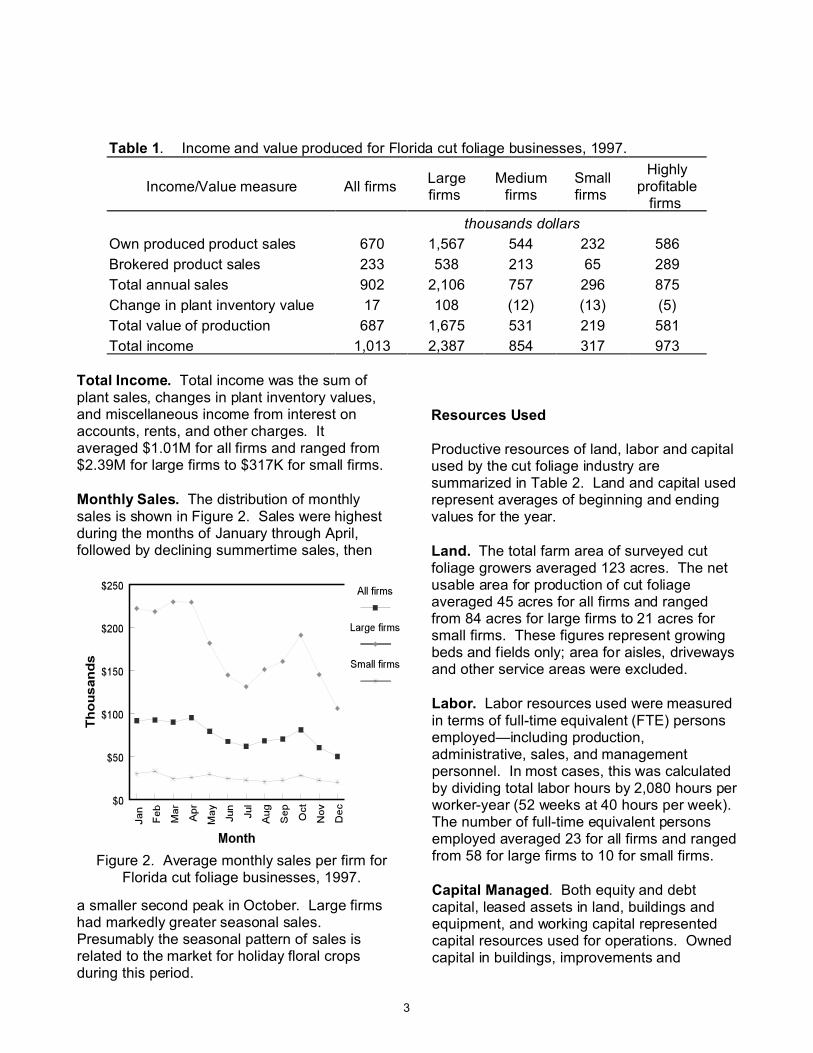
Annual Sales. Total annual sales averaged$902 thousand (K) for all firms and rangedfrom $2.11 million (M) for large firms to $296Kfor small firms as shown in Table 1. Sales ofown products grown by firms averaged $670Kor 74% of total sales, while sales of finishedproducts purchased for immediate resale("brokered") were $233K. Highly profitablefirms and medium firms had a slightly higherpercentage of brokered sales.
Plant Inventory Change and Total ValueProduced. Changes in plant inventory valuesduring 1997(Jan. 1 to Dec. 31) were positivefor the overall industry average at $17K, andincreased $108K for large firms, but decreasedfor all other groups. Total value produced, ameasure of productive effort calculated as thesum of own plant sales and change in plantinventory value, averaged $687K for all firmsand ranged from $1.68M for large firms to$219K for small firms.
3
Figure 2. Average monthly sales per firm forFlorida cut foliage businesses, 1997.
Table 1. Income and value produced for Florida cut foliage businesses, 1997.
Income/Value measure All firms Largefirms
Mediumfirms
Smallfirms
Highlyprofitable
firms
thousands dollars
Own produced product sales 670 1,567 544 232 586
Brokered product sales 233 538 213 65 289
Total annual sales 902 2,106 757 296 875
Change in plant inventory value 17 108 (12) (13) (5)
Total value of production 687 1,675 531 219 581
Total income 1,013 2,387 854 317 973
Total Income. Total income was the sum ofplant sales, changes in plant inventory values,and miscellaneous income from interest onaccounts, rents, and other charges. Itaveraged $1.01M for all firms and ranged from$2.39M for large firms to $317K for small firms.
Monthly Sales. The distribution of monthlysales is shown in Figure 2. Sales were highestduring the months of January through April,followed by declining summertime sales, then
a smaller second peak in October. Large firmshad markedly greater seasonal sales. Presumably the seasonal pattern of sales isrelated to the market for holiday floral cropsduring this period.
Resources Used
Productive resources of land, labor and capitalused by the cut foliage industry aresummarized in Table 2. Land and capital usedrepresent averages of beginning and endingvalues for the year.
Land. The total farm area of surveyed cutfoliage growers averaged 123 acres. The netusable area for production of cut foliageaveraged 45 acres for all firms and rangedfrom 84 acres for large firms to 21 acres forsmall firms. These figures represent growingbeds and fields only; area for aisles, drivewaysand other service areas were excluded.
Labor. Labor resources used were measuredin terms of full-time equivalent (FTE) personsemployed—including production,administrative, sales, and managementpersonnel. In most cases, this was calculatedby dividing total labor hours by 2,080 hours perworker-year (52 weeks at 40 hours per week). The number of full-time equivalent personsemployed averaged 23 for all firms and rangedfrom 58 for large firms to 10 for small firms.
Capital Managed. Both equity and debtcapital, leased assets in land, buildings andequipment, and working capital representedcapital resources used for operations. Ownedcapital in buildings, improvements and

4
equipment were assessed at book value, whileleased assets were taken at market value. Total capital managed averaged $1.16M for allfirms and ranged from $2.27M for large firmsto $605K for small firms. As a share of totalmanaged capital, land represented the largestcomponent at 42 percent, followed by growingplants in inventory at 30 percent,buildings/installations at 12 percent and otherworking capital (supply inventory, accountsreceivable, cash on hand) at 12 percent.
Table 2. Productive resources used by Florida cut foliage businesses, 1997.
ResourceAll
firmsLarge firms
Mediumfirms
Smallfirms
Highlyprofitable
firms
Total farm area (acres) 123 214 116 73 95
Net usable production area* (acres) 45.0 83.8 45.7 21.1 37.7
Number persons employed (FTE**) 23.2 57.8 14.4 9.5 21.8
Total owned capital (1000$) 883 1,732 695 524 760
Capital leased (1000$) 275 537 321 81 217
Total capital managed*** (1000$) 1,158 2,269 1,016 605 977
* Net usable production area excludes roads within fernery. ** Full-time equivalent person represents 2,080 hours per year. *** Capital managed is capital owned, both equity and debt capital, plus capital leased.
Productivity, Efficiency and Intensity
Indicators
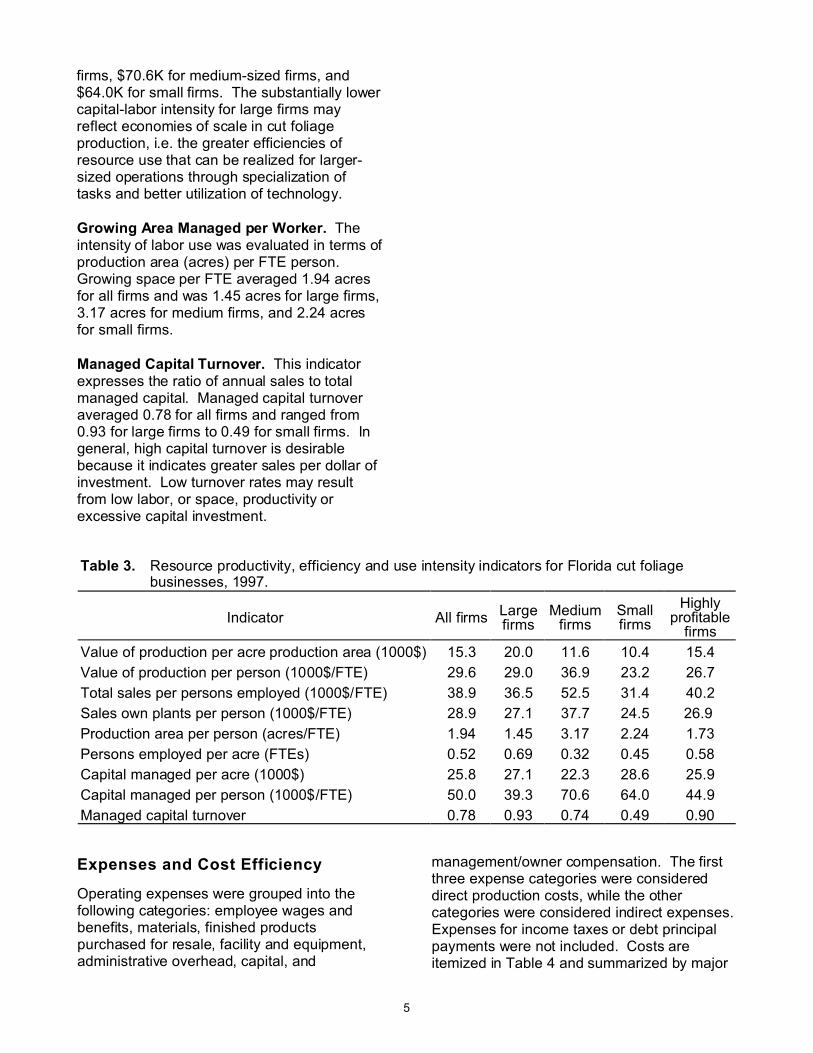
Value Produced per Acre. The productivity ofcut foliage operation space was measured bythe value of production (annual sales of ownproduct plus inventory change) per acre ofgrowing space. Value produced per acreaveraged $15.3K per acre and ranged from$20.0K for large firms to $10.4K for small firms(Table 3). Highly profitable firms produced anintermediate value of $15.4K per acre,demonstrating that high values of this indicatorare not necessary for profitable operations. Space productivity is affected by productionarea layout and space utilization efficiency(renovation), plant growth rates and survival,and inventory turnover.
Value Produced per Worker. Laborproductivity was measured in terms of salesand value produced per full-time equivalent(FTE) worker, i.e. per 2,080 labor hours. Forall firms, value of production averaged $29.6K
per FTE, or $14.25 per hour worked. Thisvalue was $29.0K per FTE for large firms,$36.9K for medium-sized firms, and $23.2K forsmall firms. Variations in labor productivitymay result from differences in investment forlabor-saving equipment, labor managementpractices, and practices affecting cropturnover.
Capital Managed per Acre. The intensity ofcapital use in relation to production space wasmeasured as the ratio of capital managed togrowing area (acres). Capital managed peracre of growing area averaged $25.8K for allfirms and was $27.1K for large firms, $22.3Kfor medium-sized firms, and $28.6K for smallfirms. Capital managed per acre for highlyprofitable firms was close to the average.
Capital Managed per Worker. The intensityof capital use in relation to labor wasmeasured as the ratio of managed capital(owned plus leased) to number of personsemployed. This measure averaged $50.0K perFTE for all firms and was $39.3K for large
5
firms, $70.6K for medium-sized firms, and$64.0K for small firms. The substantially lowercapital-labor intensity for large firms mayreflect economies of scale in cut foliageproduction, i.e. the greater efficiencies ofresource use that can be realized for larger-sized operations through specialization oftasks and better utilization of technology.
Growing Area Managed per Worker. Theintensity of labor use was evaluated in terms ofproduction area (acres) per FTE person. Growing space per FTE averaged 1.94 acresfor all firms and was 1.45 acres for large firms,3.17 acres for medium firms, and 2.24 acresfor small firms.
Managed Capital Turnover. This indicatorexpresses the ratio of annual sales to totalmanaged capital. Managed capital turnoveraveraged 0.78 for all firms and ranged from0.93 for large firms to 0.49 for small firms. Ingeneral, high capital turnover is desirablebecause it indicates greater sales per dollar ofinvestment. Low turnover rates may resultfrom low labor, or space, productivity orexcessive capital investment.
Table 3. Resource productivity, efficiency and use intensity indicators for Florida cut foliagebusinesses, 1997.
Indicator All firms Largefirms
Mediumfirms
Smallfirms
Highlyprofitable
firms
Value of production per acre production area (1000$) 15.3 20.0 11.6 10.4 15.4
Value of production per person (1000$/FTE) 29.6 29.0 36.9 23.2 26.7
Total sales per persons employed (1000$/FTE) 38.9 36.5 52.5 31.4 40.2
Sales own plants per person (1000$/FTE) 28.9 27.1 37.7 24.5 26.9
Production area per person (acres/FTE) 1.94 1.45 3.17 2.24 1.73
Persons employed per acre (FTEs) 0.52 0.69 0.32 0.45 0.58
Capital managed per acre (1000$) 25.8 27.1 22.3 28.6 25.9
Capital managed per person (1000$/FTE) 50.0 39.3 70.6 64.0 44.9
Managed capital turnover 0.78 0.93 0.74 0.49 0.90
Expenses and Cost Efficiency
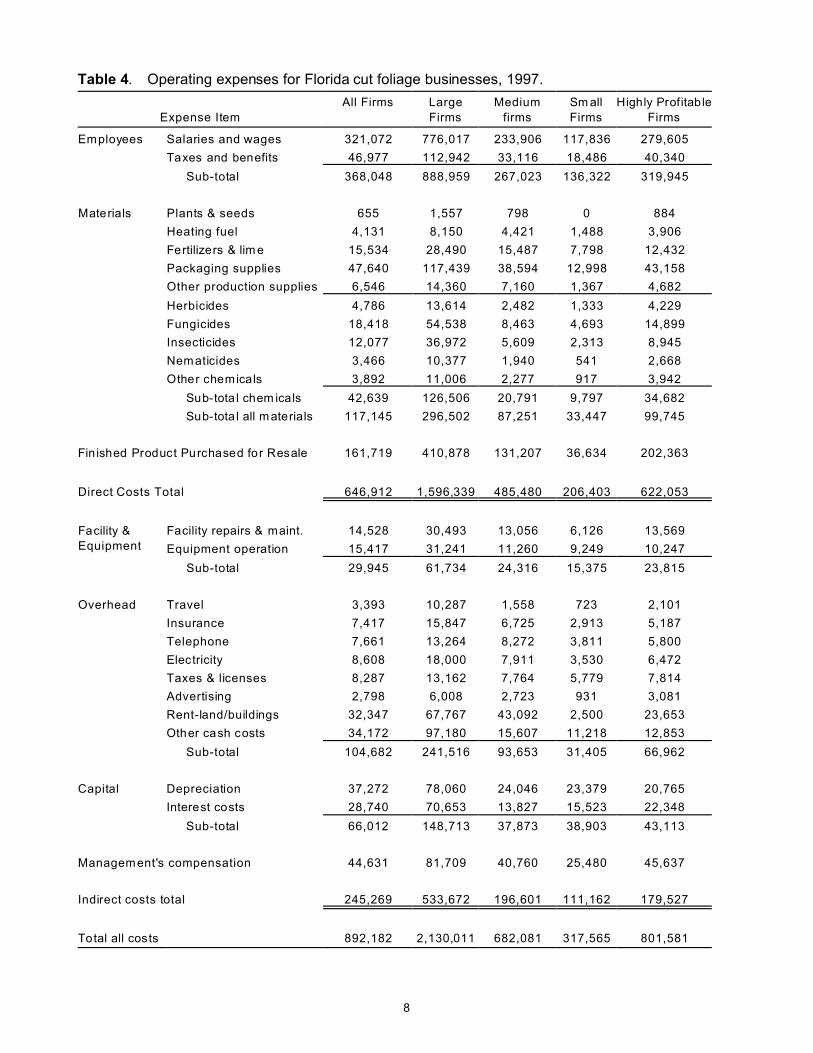
Operating expenses were grouped into thefollowing categories: employee wages andbenefits, materials, finished productspurchased for resale, facility and equipment,administrative overhead, capital, and
management/owner compensation. The firstthree expense categories were considereddirect production costs, while the othercategories were considered indirect expenses. Expenses for income taxes or debt principalpayments were not included. Costs areitemized in Table 4 and summarized by major
6
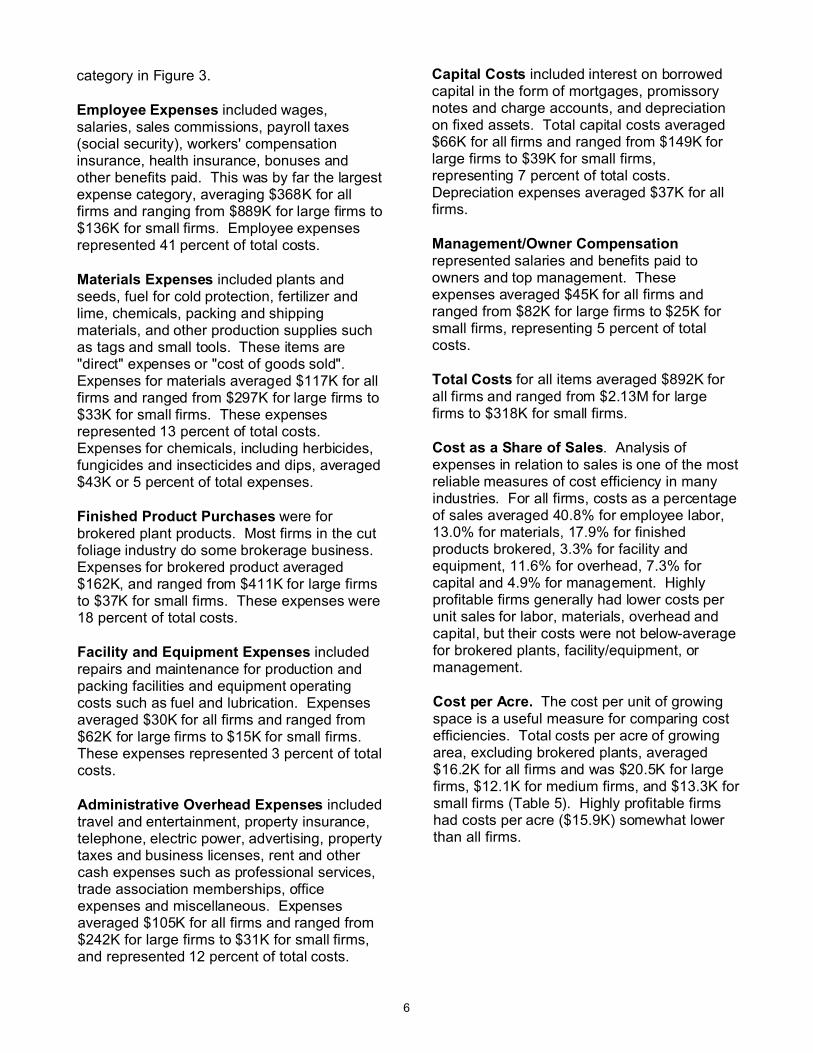
category in Figure 3.
Employee Expenses included wages,salaries, sales commissions, payroll taxes(social security), workers' compensationinsurance, health insurance, bonuses andother benefits paid. This was by far the largestexpense category, averaging $368K for allfirms and ranging from $889K for large firms to$136K for small firms. Employee expensesrepresented 41 percent of total costs.
Materials Expenses included plants andseeds, fuel for cold protection, fertilizer andlime, chemicals, packing and shippingmaterials, and other production supplies suchas tags and small tools. These items are"direct" expenses or "cost of goods sold". Expenses for materials averaged $117K for allfirms and ranged from $297K for large firms to$33K for small firms. These expensesrepresented 13 percent of total costs. Expenses for chemicals, including herbicides,fungicides and insecticides and dips, averaged$43K or 5 percent of total expenses.
Finished Product Purchases were forbrokered plant products. Most firms in the cutfoliage industry do some brokerage business. Expenses for brokered product averaged$162K, and ranged from $411K for large firmsto $37K for small firms. These expenses were18 percent of total costs.
Facility and Equipment Expenses includedrepairs and maintenance for production andpacking facilities and equipment operatingcosts such as fuel and lubrication. Expensesaveraged $30K for all firms and ranged from$62K for large firms to $15K for small firms. These expenses represented 3 percent of totalcosts.
Administrative Overhead Expenses includedtravel and entertainment, property insurance,telephone, electric power, advertising, propertytaxes and business licenses, rent and othercash expenses such as professional services,trade association memberships, officeexpenses and miscellaneous. Expensesaveraged $105K for all firms and ranged from$242K for large firms to $31K for small firms,and represented 12 percent of total costs.
Capital Costs included interest on borrowedcapital in the form of mortgages, promissorynotes and charge accounts, and depreciationon fixed assets. Total capital costs averaged$66K for all firms and ranged from $149K forlarge firms to $39K for small firms,representing 7 percent of total costs. Depreciation expenses averaged $37K for allfirms.
Management/Owner Compensationrepresented salaries and benefits paid toowners and top management. Theseexpenses averaged $45K for all firms andranged from $82K for large firms to $25K forsmall firms, representing 5 percent of totalcosts.
Total Costs for all items averaged $892K forall firms and ranged from $2.13M for largefirms to $318K for small firms.
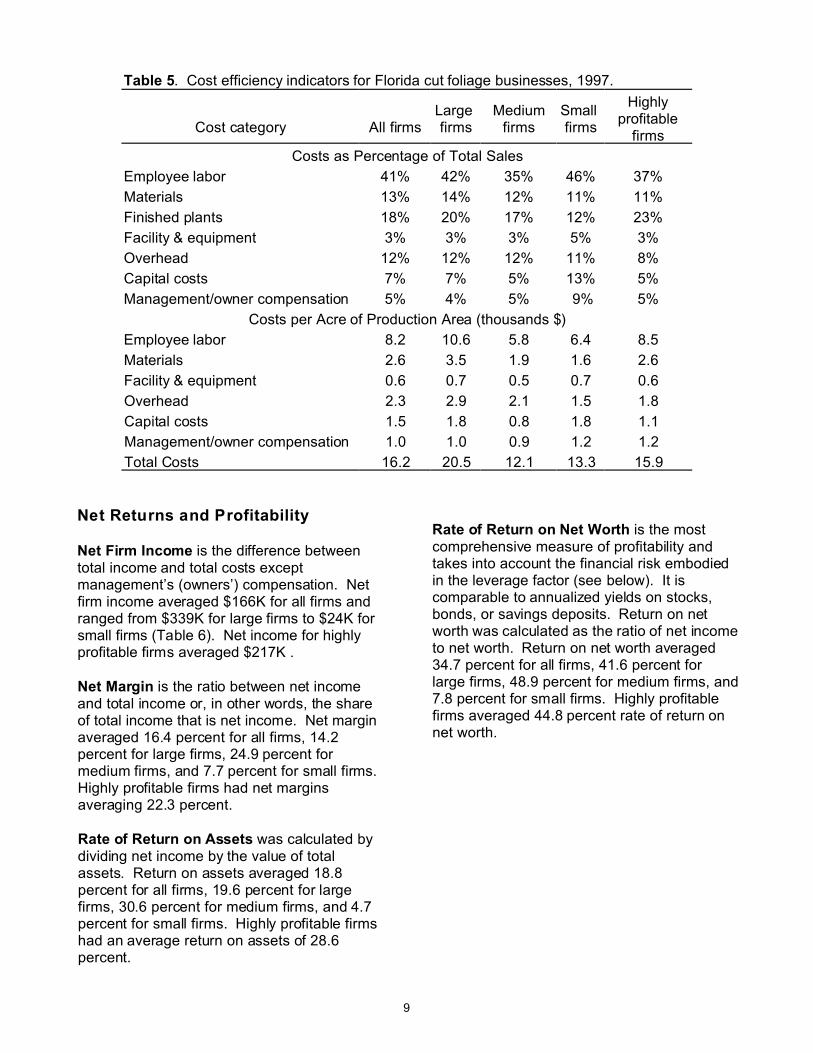
Cost as a Share of Sales. Analysis ofexpenses in relation to sales is one of the mostreliable measures of cost efficiency in manyindustries. For all firms, costs as a percentageof sales averaged 40.8% for employee labor,13.0% for materials, 17.9% for finishedproducts brokered, 3.3% for facility andequipment, 11.6% for overhead, 7.3% forcapital and 4.9% for management. Highlyprofitable firms generally had lower costs perunit sales for labor, materials, overhead andcapital, but their costs were not below-averagefor brokered plants, facility/equipment, ormanagement.
Cost per Acre. The cost per unit of growingspace is a useful measure for comparing costefficiencies. Total costs per acre of growingarea, excluding brokered plants, averaged$16.2K for all firms and was $20.5K for largefirms, $12.1K for medium firms, and $13.3K forsmall firms (Table 5). Highly profitable firmshad costs per acre ($15.9K) somewhat lowerthan all firms.
7
Figure 3. Distrubution of expenses for Florida cutfoliage businesses, 1997.
8
Table 4. Operating expenses for Florida cut foliage businesses, 1997.
Expense Item
All Firms Large
Firms
Medium
firms
Sm all
Firms
Highly Profitable
Firms
Employees Salaries and wages 321,072 776,017 233,906 117,836 279,605
Taxes and benefits 46,977 112,942 33,116 18,486 40,340
Sub-total 368,048 888,959 267,023 136,322 319,945
Materials Plants & seeds 655 1,557 798 0 884
Heating fuel 4,131 8,150 4,421 1,488 3,906
Fertilizers & lim e 15,534 28,490 15,487 7,798 12,432
Packaging supplies 47,640 117,439 38,594 12,998 43,158
Other production supplies 6,546 14,360 7,160 1,367 4,682
Herbicides 4,786 13,614 2,482 1,333 4,229
Fungicides 18,418 54,538 8,463 4,693 14,899
Insecticides 12,077 36,972 5,609 2,313 8,945
Nematicides 3,466 10,377 1,940 541 2,668
Other chemicals 3,892 11,006 2,277 917 3,942
Sub-tota l chem icals 42,639 126,506 20,791 9,797 34,682
Sub-tota l all materials 117,145 296,502 87,251 33,447 99,745
Finished Product Purchased for Resale 161,719 410,878 131,207 36,634 202,363
Direct Costs Total 646,912 1,596,339 485,480 206,403 622,053
Facility &
Equipment
Facility repairs & maint. 14,528 30,493 13,056 6,126 13,569
Equipment operation 15,417 31,241 11,260 9,249 10,247
Sub-total 29,945 61,734 24,316 15,375 23,815
Overhead Travel 3,393 10,287 1,558 723 2,101
Insurance 7,417 15,847 6,725 2,913 5,187
Telephone 7,661 13,264 8,272 3,811 5,800
Electricity 8,608 18,000 7,911 3,530 6,472
Taxes & licenses 8,287 13,162 7,764 5,779 7,814
Advertising 2,798 6,008 2,723 931 3,081
Rent-land/buildings 32,347 67,767 43,092 2,500 23,653
Other cash costs 34,172 97,180 15,607 11,218 12,853
Sub-total 104,682 241,516 93,653 31,405 66,962
Capital Depreciation 37,272 78,060 24,046 23,379 20,765
Interest costs 28,740 70,653 13,827 15,523 22,348
Sub-total 66,012 148,713 37,873 38,903 43,113
Management's compensation 44,631 81,709 40,760 25,480 45,637
Indirect costs total 245,269 533,672 196,601 111,162 179,527
Total all costs 892,182 2,130,011 682,081 317,565 801,581
9
Table 5. Cost efficiency indicators for Florida cut foliage businesses, 1997.
Cost category All firmsLarge firms
Mediumfirms
Small firms
Highlyprofitable
firms
Costs as Percentage of Total Sales
Employee labor 41% 42% 35% 46% 37%
Materials 13% 14% 12% 11% 11%
Finished plants 18% 20% 17% 12% 23%
Facility & equipment 3% 3% 3% 5% 3%
Overhead 12% 12% 12% 11% 8%
Capital costs 7% 7% 5% 13% 5%
Management/owner compensation 5% 4% 5% 9% 5%
Costs per Acre of Production Area (thousands $)
Employee labor 8.2 10.6 5.8 6.4 8.5
Materials 2.6 3.5 1.9 1.6 2.6
Facility & equipment 0.6 0.7 0.5 0.7 0.6
Overhead 2.3 2.9 2.1 1.5 1.8
Capital costs 1.5 1.8 0.8 1.8 1.1
Management/owner compensation 1.0 1.0 0.9 1.2 1.2
Total Costs 16.2 20.5 12.1 13.3 15.9
Net Returns and Profitability
Net Firm Income is the difference betweentotal income and total costs exceptmanagement’s (owners’) compensation. Netfirm income averaged $166K for all firms andranged from $339K for large firms to $24K forsmall firms (Table 6). Net income for highlyprofitable firms averaged $217K .
Net Margin is the ratio between net incomeand total income or, in other words, the shareof total income that is net income. Net marginaveraged 16.4 percent for all firms, 14.2percent for large firms, 24.9 percent formedium firms, and 7.7 percent for small firms. Highly profitable firms had net marginsaveraging 22.3 percent.
Rate of Return on Assets was calculated bydividing net income by the value of totalassets. Return on assets averaged 18.8percent for all firms, 19.6 percent for largefirms, 30.6 percent for medium firms, and 4.7percent for small firms. Highly profitable firmshad an average return on assets of 28.6percent.
Rate of Return on Net Worth is the mostcomprehensive measure of profitability andtakes into account the financial risk embodiedin the leverage factor (see below). It iscomparable to annualized yields on stocks,bonds, or savings deposits. Return on networth was calculated as the ratio of net incometo net worth. Return on net worth averaged34.7 percent for all firms, 41.6 percent forlarge firms, 48.9 percent for medium firms, and7.8 percent for small firms. Highly profitablefirms averaged 44.8 percent rate of return onnet worth.

10
Table 6. Net returns and profitability for Florida cut foliage businesses, 1997
Measure All firmsLarge firms
Mediumfirms
Small firms
Highlyprofitable
firms
Net Income: total income less total costsexcept management’s compensation(thousands $)
166 339 213 24 217
Net Margin: ratio of net income to total income
16.4% 14.2% 24.9% 7.7% 22.3%
Return on Assets: ratio of net income tototal assets
18.8% 19.6% 30.6% 4.7% 28.6%
Return on Net Worth: ratio of net incometo net worth
34.7% 41.6% 48.9% 7.8% 44.8%
Balance Sheet and Financial Ratios
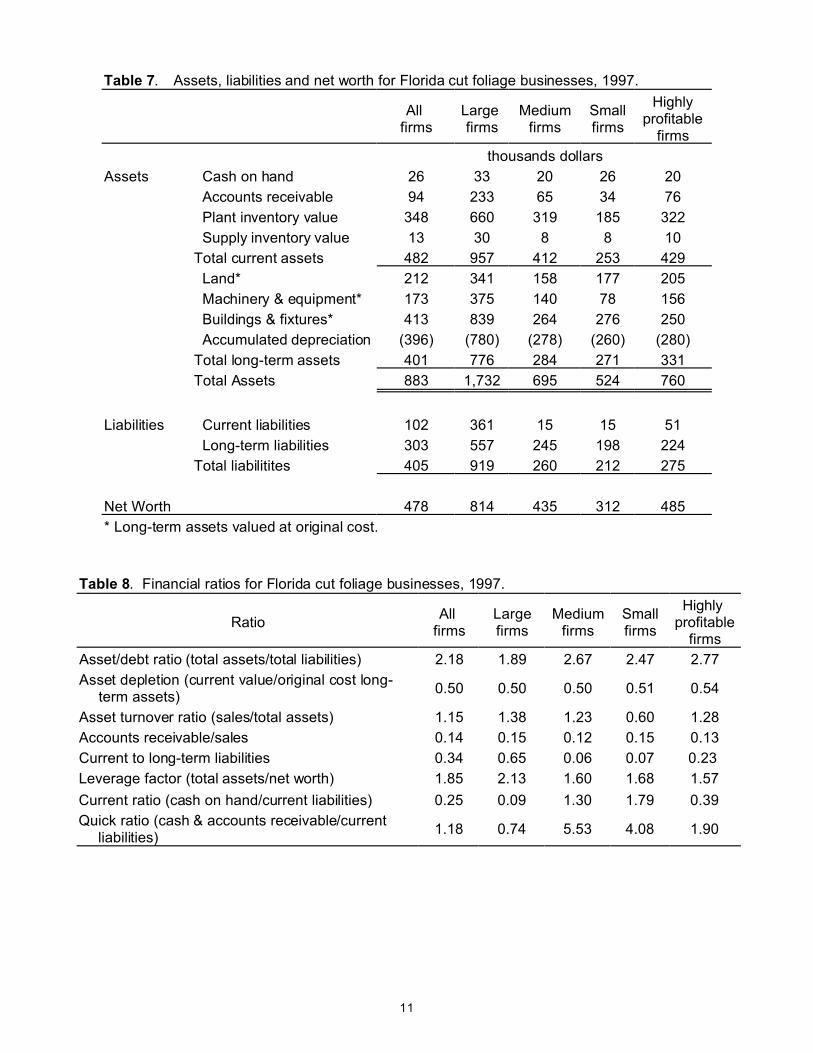
Assets and liabilities were taken to representthe mid-year financial position of firms,calculated as an average of beginning andending balance sheet values as summarized inTable 7.
Assets. Total assets averaged $883K for allfirms and ranged from $1.73M for large firmsto $524K for small firms. Currentassets—including cash on hand, accountsreceivable, and plant and supplyinventories—averaged $482K for all firms andranged from $957K for large firms to $253K forsmall firms. Long-term assets—includinginvestments in buildings, machinery, land andaccumulated depreciation—averaged $401Kfor all firms and ranged from $776K for largefirms to $271K for small firms.
Liabilities. Total liabilities averaged $405K forall firms and ranged from $919K for large firmsto $212K for small firms. Current liabilities,including accounts payable and other liabilitiespayable within one year, averaged $102K forall firms and ranged from $361K for large firmsto $15K for medium and small firms. Long-term liabilities, including notes payable andmortgages, averaged $303K for all firms andranged from $557K for large firms to $198K forsmall firms.
Net Worth. Net worth or equity is thedifference between total assets and totalliabilities and represents the value of theowners’ share of assets. Net worth averaged
$478K for all firms and ranged from $814K forlarge firms to $312K for small firms.
Leverage. This measure expresses the ratiobetween total assets and net worth and is anindicator of long-term solvency. Higher valuesindicate greater risk, with potential for greaterreturns and greater losses. The leverage ratioaveraged 1.85 for all firms, 2.13 for large firms,1.60 for medium firms, 1.68 for small firms,and 1.57 for highly profitable firms (Table 8). Generally, leverage factors below 1.0 areconsidered to represent a very safe financialposition. The impact of financial leverage onprofitability can be understood as a multiplier: leverage multiplied by the rate of return tocapital assets equals the rate of return on networth.
Quick Ratio. The quick ratio is a measure ofa firm's ability to meet short-term debts. It wascalculated by dividing cash and accountsreceivable by current liabilities. Cash andaccounts receivable are the most liquid ofcurrent assets, which are usually available onshort notice, but inventories are not included inthis measure because they may not beimmediately salable. A value for this ratiobelow 1.0 would indicate an illiquid position. The quick ratio averaged 1.18 for all firms, 4.08 for small firms, 5.53 for medium firms,and 0.74 for large firms. Highly profitable firmshad a quick ratio of 1.90.
11
Table 7. Assets, liabilities and net worth for Florida cut foliage businesses, 1997.
All firms
Large firms
Mediumfirms
Smallfirms
Highlyprofitable
firms
thousands dollars
Assets Cash on hand 26 33 20 26 20
Accounts receivable 94 233 65 34 76
Plant inventory value 348 660 319 185 322
Supply inventory value 13 30 8 8 10
Total current assets 482 957 412 253 429
Land* 212 341 158 177 205
Machinery & equipment* 173 375 140 78 156
Buildings & fixtures* 413 839 264 276 250
Accumulated depreciation (396) (780) (278) (260) (280)
Total long-term assets 401 776 284 271 331
Total Assets 883 1,732 695 524 760
Liabilities Current liabilities 102 361 15 15 51
Long-term liabilities 303 557 245 198 224
Total liabilitites 405 919 260 212 275
Net Worth 478 814 435 312 485
* Long-term assets valued at original cost.
Table 8. Financial ratios for Florida cut foliage businesses, 1997.
RatioAll
firmsLargefirms
Mediumfirms
Smallfirms
Highly profitable
firms
Asset/debt ratio (total assets/total liabilities) 2.18 1.89 2.67 2.47 2.77
Asset depletion (current value/original cost long-term assets)
0.50 0.50 0.50 0.51 0.54
Asset turnover ratio (sales/total assets) 1.15 1.38 1.23 0.60 1.28
Accounts receivable/sales 0.14 0.15 0.12 0.15 0.13
Current to long-term liabilities 0.34 0.65 0.06 0.07 0.23
Leverage factor (total assets/net worth) 1.85 2.13 1.60 1.68 1.57
Current ratio (cash on hand/current liabilities) 0.25 0.09 1.30 1.79 0.39
Quick ratio (cash & accounts receivable/currentliabilities)
1.18 0.74 5.53 4.08 1.90

12
Changes in Business Performance
Between 1996 and 1997
The 12 cut foliage firms analyzed in this reportalso provided comparable information for theprevious year (1996). Changes in thebusiness analysis results between 1996 and1997 for these 12 firms are summarized inTable 9. In general, business conditions weremarkedly improved, with net income and netmargin increasing by over 100 percent in spiteof a marginal decrease in total sales andincome. This was due to a significantdecrease in total expenses. Production areaincreased while labor employed decreasedslightly. Total assets, total liabilities and networth were also decreased. Results forproduction efficiency indicators were mixed,with own product sales per acre increasingwhile sales per FTE decreased an equivalentamount.
Table 9. Changes in business indicators for12 cut foliage businesses in Florida from 1996to 1997.
MeasurePercentage
change 1996to 1997
Total Sales -8.2
Total Income -1.7
Production Area (acres) 7.9
Labor Employed (FTE) -1.6
Sales per FTE -6.6
Own Product Sales per Acre 6.6
Total Expenses -11.6
Total Assets -11.0
Total Liabilities -3.6
Net Worth -16.5
Net Income 108.4
Net Margin 111.9
Rate of Return on Net Worth 149.6
REFERENCES
Hodges, A.W., L.N. Satterthwaite and J.J.Haydu. 1998. Business Analysis of CutFoliage Businesses in Florida, 1996. Economic Information Report EIR98-2. University of Florida, Food & ResourceEconomics Department, Gainesville.
Hodges, A.W., L.N. Satterthwaite and J.J.Haydu. 1997. Business Analysis ofOrnamental Plant Nurseries in Florida,1995. Economic Information Report EIR97-3. University of Florida, Food & ResourceEconomics Department, Gainesville.
National Agricultural Statistics Service. 1998. Floricultural Crops 1997 Summary. Sp Cr6-1(97). U.S. Department of Agriculture,Washington, D.C.
National Agricultural Statistics Service. 1999. Census of Agriculture, 1997, Vol. 1,Geographic Area Series, Part 9, FloridaState and County Data, AC97-A-9. U.S.Department of Agriculture, Washington,DC.
Stamps, R.H. and C.A. Conover. 1986. Cutfoliage production in Florida. HortScience21(2):177–178, 343.
1313
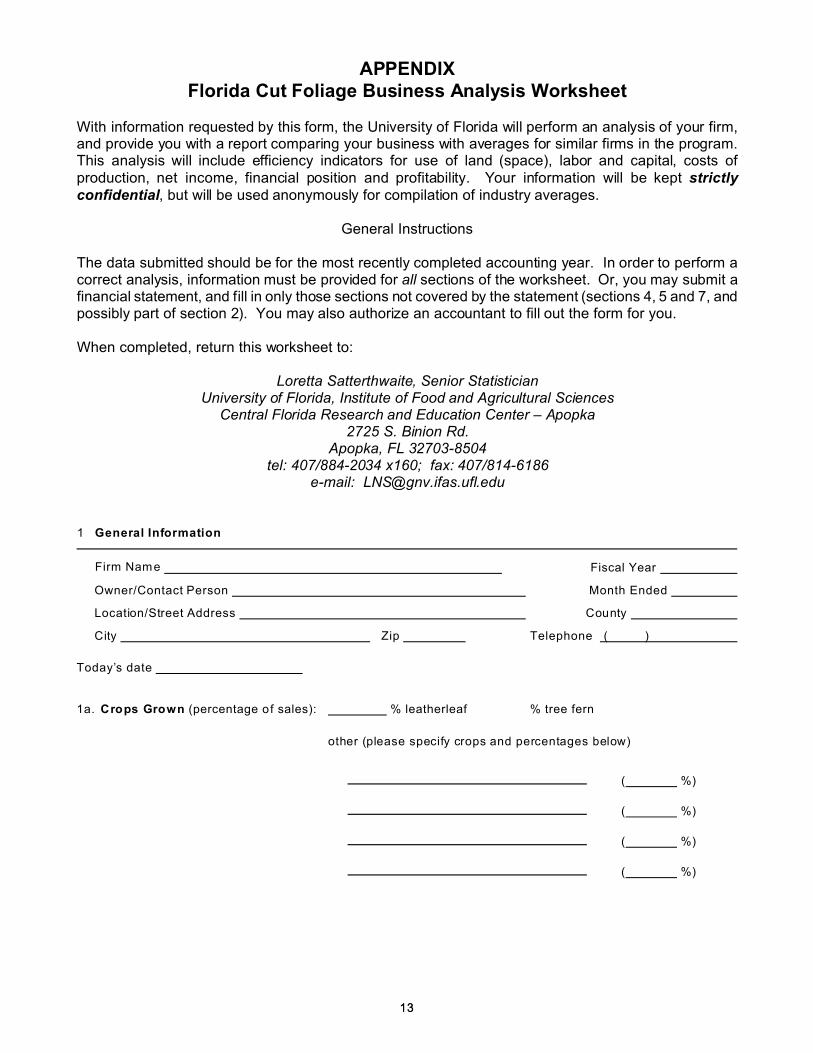
APPENDIXFlorida Cut Foliage Business Analysis Worksheet
With information requested by this form, the University of Florida will perform an analysis of your firm,and provide you with a report comparing your business with averages for similar firms in the program.This analysis will include efficiency indicators for use of land (space), labor and capital, costs ofproduction, net income, financial position and profitability. Your information will be kept strictlyconfidential, but will be used anonymously for compilation of industry averages.
General Instructions
The data submitted should be for the most recently completed accounting year. In order to perform acorrect analysis, information must be provided for all sections of the worksheet. Or, you may submit afinancial statement, and fill in only those sections not covered by the statement (sections 4, 5 and 7, andpossibly part of section 2). You may also authorize an accountant to fill out the form for you.
When completed, return this worksheet to:
Loretta Satterthwaite, Senior StatisticianUniversity of Florida, Institute of Food and Agricultural Sciences
Central Florida Research and Education Center – Apopka2725 S. Binion Rd.
Apopka, FL 32703-8504tel: 407/884-2034 x160; fax: 407/814-6186
e-mail: [email protected]
1 General Information
Firm Name Fiscal Year
Owner/Contact Person Month Ended
Location/Street Address County
City Zip Telephone ( )
Today’s date
1a. Crops Grown (percentage of sales): % leatherleaf % tree fern
other (please specify crops and percentages below)
( %)
( %)
( %)
( %)

1414
2. Income
A. Total crop sales . . . . . . . . . . . . . . . . . . . . . . . . . . . . . . . . . . . . . . . . . $
By month or quarter
Jan $ Apr $ July $ Oct $
Feb $ May $ Aug $ Nov $
Mar $ June $ Sep $ Dec $
Qtr $ Qtr $ Qtr $ Qtr $
B. Value of crops resold from outside purchases1 . . . . . . . . . . . . . . . . . $
C. Value of crop from off-site production1 . . . . . . . . . . . . . . . . . . . . . . . . $
D. Miscellaneous income . . . . . . . . . . . . . . . . . . . . . . . . . . . . . . . . . . . . $
3. Fiscal Year Information
Beginning Balance Ending Balance
A. Value of Supplies in Inventory . . . . . . . . . . . . . . $ $
B. Value of Plants in Inventory2 (includes cooler) . . $ $
C. Original Cost of Land Owned . . . . . . . . . . . . . . . $ $
D. Current Assets, including Accounts Receivable3 $ $
E. Cash on Hand . . . . . . . . . . . . . . . . . . . . . . . . . . $ $
F. Current Liabilities, including Accounts Payable $ $
G. Long-Term Debt4 . . . . . . . . . . . . . . . . . . . . . . . . $ $
4. Current Market Value of Leased Property5
Beginning Balance Ending Balance
A. Current Value of Land Leased . . . . . . . . . . . . . . $ $
B. Value of Machinery and Equipment Leased . . . . $ $
C. Value of Buildings/Installations Leased . . . . . . . $ $
1 This amount will be deducted from total sales to give net company-produced crop sales. Outside purchases are from other growers;off-site production means owned, but not included in acreage or expenses.
2 Plant inventory valued at wholesale price, adjusted for percentage of completion of crops in production. For example, if fernery haseven turnover, inventory averages 50% finished, so inventory value would be the wholesale price discounted 50%.
3 Current assets less cash on hand, item E.
4 Debt due beyond the current fiscal year, including mortgages and notes payable. Debt to officers in closely held (family) corporations(which is more like a capital investment by the owners than a debt) normally is not included.
5 Assets leased to closely held (family) corporation by stockholders may be treated, at the participant’s option, either as leased capital
(this section) or as owned capital (sections 3 and 6).

1515
5. Production Area
Enter acreage in use at beginning and end of fiscal year for:
Beginning of Year Ending of Year
A. Total farm area (owned & leased)6 . . . . . . . . . . . . .
B. Production area (shade & hammock)7 . . . . . . . . . . .
C. Acreage renovated this year . . . . . . . . . . . . . . . . . .
6. Capital Assets and Depreciation8
Original Cost AccumulatedDepreciation
Depreciationthis year
A. Machinery & Equipment9 . . . . . . $ $ $
B. Buildings & Installations10 . . . . . $ $ $
Total . . . . . . . . . . . . . . . . . . . . . . . . $ $ $
7. Work Time11
Total Payroll Hours or Full-time Equivalents
A. Hourly workers . . . . . . . . . . . . . . . . . . . . . . . . . .
B. Non-hourly workers . . . . . . . . . . . . . . . . . . . . . .
Total . . . . . . . . . . . . . . . . . . . . . . . . . . . . . . . . . . . .
6 All area used for fernery, including roads, offices, packing sheds and parking, as well as growing areas.
7 Net growing area, excluding driveways, walkways, and other non-productive space. Use the facing page as a workspace for listing,if needed.
8 A depreciation schedule or detailed balance sheet may be submitted in lieu of filling out this section. Use separate sheet to list items,
if needed.
9 Equipment used specifically for business operations. If unsure about proper category for any item, please list it on the facing page.
10 Includes land improvements, wells, irrigation, fences, paving, office furniture and office equipment, as well as buildings.
11 Enter total hours for all workers, including casual labor, part-time labor, piece-work laborers, clerical, salespersons, family members,
and manager(s). For non-hourly workers or in cases where records are not available, time may be estimated in terms of full-timeequivalents (2,080 hours/year; 52 weeks @ 40 hours/week).
1616
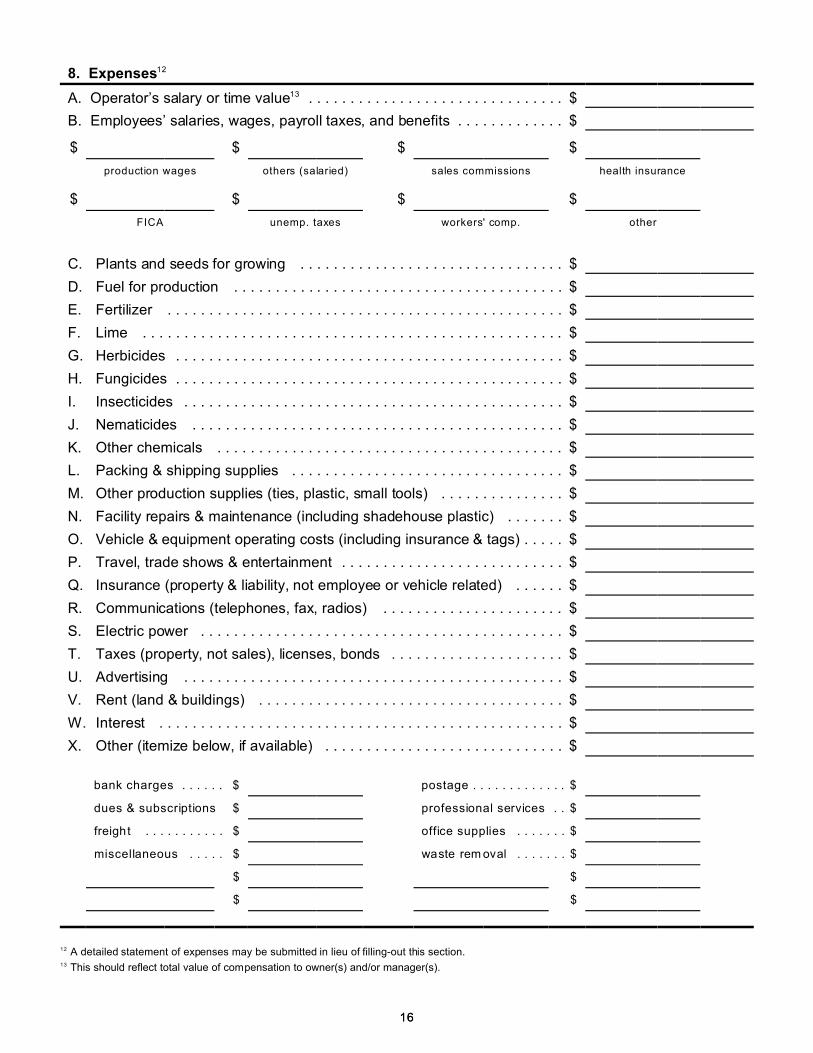
8. Expenses12
A. Operator’s salary or time value13 . . . . . . . . . . . . . . . . . . . . . . . . . . . . . . . $
B. Employees’ salaries, wages, payroll taxes, and benefits . . . . . . . . . . . . . $
$ $ $ $
production wages others (salaried) sales commissions health insurance
$ $ $ $
FICA unemp. taxes workers' comp. other
C. Plants and seeds for growing . . . . . . . . . . . . . . . . . . . . . . . . . . . . . . . . $
D. Fuel for production . . . . . . . . . . . . . . . . . . . . . . . . . . . . . . . . . . . . . . . . $
E. Fertilizer . . . . . . . . . . . . . . . . . . . . . . . . . . . . . . . . . . . . . . . . . . . . . . . . $
F. Lime . . . . . . . . . . . . . . . . . . . . . . . . . . . . . . . . . . . . . . . . . . . . . . . . . . . $
G. Herbicides . . . . . . . . . . . . . . . . . . . . . . . . . . . . . . . . . . . . . . . . . . . . . . . $
H. Fungicides . . . . . . . . . . . . . . . . . . . . . . . . . . . . . . . . . . . . . . . . . . . . . . . $
I. Insecticides . . . . . . . . . . . . . . . . . . . . . . . . . . . . . . . . . . . . . . . . . . . . . . $
J. Nematicides . . . . . . . . . . . . . . . . . . . . . . . . . . . . . . . . . . . . . . . . . . . . . $
K. Other chemicals . . . . . . . . . . . . . . . . . . . . . . . . . . . . . . . . . . . . . . . . . . $
L. Packing & shipping supplies . . . . . . . . . . . . . . . . . . . . . . . . . . . . . . . . . $
M. Other production supplies (ties, plastic, small tools) . . . . . . . . . . . . . . . $
N. Facility repairs & maintenance (including shadehouse plastic) . . . . . . . $
O. Vehicle & equipment operating costs (including insurance & tags) . . . . . $
P. Travel, trade shows & entertainment . . . . . . . . . . . . . . . . . . . . . . . . . . . $
Q. Insurance (property & liability, not employee or vehicle related) . . . . . . $
R. Communications (telephones, fax, radios) . . . . . . . . . . . . . . . . . . . . . . $
S. Electric power . . . . . . . . . . . . . . . . . . . . . . . . . . . . . . . . . . . . . . . . . . . . $
T. Taxes (property, not sales), licenses, bonds . . . . . . . . . . . . . . . . . . . . . $
U. Advertising . . . . . . . . . . . . . . . . . . . . . . . . . . . . . . . . . . . . . . . . . . . . . . $
V. Rent (land & buildings) . . . . . . . . . . . . . . . . . . . . . . . . . . . . . . . . . . . . . $
W. Interest . . . . . . . . . . . . . . . . . . . . . . . . . . . . . . . . . . . . . . . . . . . . . . . . . $
X. Other (itemize below, if available) . . . . . . . . . . . . . . . . . . . . . . . . . . . . . $
bank charges . . . . . . $ postage . . . . . . . . . . . . . $
dues & subscriptions $ professional services . . $
freight . . . . . . . . . . . $ office supplies . . . . . . . $
miscellaneous . . . . . $ waste rem oval . . . . . . . $
$ $
$ $
12 A detailed statement of expenses may be submitted in lieu of filling-out this section.13 This should reflect total value of compensation to owner(s) and/or manager(s).