Embed Size (px)
Citation preview

986
______________________________________________________________ DOI: https://doi.org/10.33258/birci.v4i1.1718
Analysis Factors Affecting the Demand and Supply of Local
Chicken Meat in Pakpak Bharat Regency
Mizanul Akbar1, Hasnudi2, Tavi Supriana3
1,2,3Universitas Sumatera Utara, Indonesia
I. Introduction
Efforts to Increase Health Degrees in Indonesia until now have not been considered to
have an Continuation of Health Development Continuation, this is when compared to
neighboring Countries Health Degrees in Indonesia are still considered low. One indicator of
the success of development for the development of an ideal nation is the establishment and
organization of a good health system, in this discussion covering physical and psychological
aspects which are added with spiritual conditions, personality and empowerment. This aspect
discusses the discussion space on health development which is interrelated with other aspects.
(Shinta et al, 2020)
Food needs are basic human needs that must be met. The food needs, among others,
come from food products of animal origin. Animal protein is needed to improve the quality of
human resources. Animal protein is found in foods such as eggs, meat, milk, fish and poultry.
One of the livestock meats that is easily available is chicken meat. Chicken meat is one of the
Abstract
Food needs are basic human needs that must be met. One of the food needs comes from animal sources, the source of meat most consumed
in Pakpak Bharat is local chicken. From the consumer side, the factors that affect the demand for local chicken include: the price of
local chickens, the price of tilapia, population and income, and factors
that affect the demand for local chicken include: the price of local chicken, the price of local chicken feed and the price of local chicken
seeds. The purpose of this study is to analyze the factors that affect the demand and supply of local chickens in Pakpak Bharat Regency in
2010 - 2019, to forecast the production of local chicken in Pakpak
Bharat Regency in 2020-2029. Data analysis was performed using the Ordinary Least Square (OLS) method with multiple linear regression
estimation models using the help of the SPSS 20 program. The
estimation results of the demand model are variables of tilapia meat prices (X2), population (X3), and per capita income (X4) has a
positive and significant effect on the demand for local chicken (Y), while the price variable for local chicken meat (X1) has a negative
and significant effect on the demand for local chicken meat (Y). The
estimation results of the model offer variable price for local chicken meat (X1) have a positive and significant effect on the supply of local
chickens (Y), while for the variable price of local chicken feed (X2) and the price of local chicken seeds (X3) have a negative and
significant effect on offering local chicken meat (Y). Simultaneously,
all variables of the demand and supply of local chicken meat have a positive effect. Resultthe projection trend of local chicken production
in Pakpak Bharat Regency in 2020-2029 is a positive trend or has
increased every year.
Keywords
local chicken demand; local
chicken supply; local chicken
production forecasting

Budapest International Research and Critics Institute-Journal (BIRCI-Journal) Volume 4, No. 1, February 2021, Page: 986-998
e-ISSN: 2615-3076 (Online), p-ISSN: 2615-1715 (Print) www.bircu-journal.com/index.php/birci
email: [email protected]
987
meats that are widely consumed by the public both in the form of meat and its processed
products.
Meat is widely consumed by people because it has a good taste and high nutrient
content. One of the most common sources of meat consumed by Indonesians is chicken.
Chicken meat provides a very large contribution to the fulfillment of animal protein needs.
About 62% of national meat consumption comes from chicken.
Local chicken is a domestic resource owned by the Indonesian people which are
generally maintained by farmers in rural areas. The actors in the demand for local chickens
are consumers, while those who offer local chickens are the Local chicken breeders. In
conducting supply and demand, consumers and breeders are influenced by several factors.
From the consumer side, these factors include the price of local chicken itself, the price of
substituted meat, income, and the number of dependents, and from the farmer it depends on
the amount of local chicken supply in each region.
The increase in the contribution of local chicken meat as a source of animal protein can
be approached from the demand and supply side. From the demand side, the lack of demand
for local chicken meat is predictable because some people still consider it a luxury
consumption, so that the demand is only on certain days (big days). According to data
(Animal Husbandry and Animal Health Statistics, 2017) the consumption of local chicken
meat is 626,000 Kg / capita / year while the consumption of purebred chickens is
5,110,000Kg / capita / year (Animal Husbandry and Animal Health Statistics, 2017).
Broadly speaking, there are three types of livestock that have the highest population in
Pakpak Bharat, namely local chickens, pigs and ducks. Local chicken is the animal product in
the livestock sector with the highest population in Pakpak Bharat, when compared to other
types of livestock (BPS, 2019). The price of local chicken is classified as high in Pakpak
Bharat Regency with the condition of the people's income per capitas. Meanwhile, the price
of chicken will certainly affect the demand for local chicken meat itself.
Demand is a description of the number of products that buyers as consumers will buy at
certain times and situations. Time periods can be categorized in years or months. While the
situation that is considered in demand is the price of the product itself, the price of other
products, consumer income and other things (Arsyad, 2000). Consumers will certainly make
a decision to make a purchase by considering the things above as well.
The relatively high price of local chicken meat and the low purchasing power of the
community (low per capita income) are also predicted to be factors that influence the lack of
demand for local chicken meat. The relatively cheaper price of tilapia also affects consumers
in changing the type of protein source.
Although the community's demand for local chickens fluctuates, at certain times the
demand for local chickens is very high, such as for celebrations, holidays and so on. There
will always be a tendency for local chicken demand at any time, because the market potential
for local chickens is quite large. When the price of meat increases, the community will
substitute the meat for local chicken so that the demand will increase.
The population of local chickens in Pakpak Bharat Regency is 133,517 tails (Pakpak
Bharat Regency in Figures, 2018) while the population of Pakpak Bharat Regency is 47,183
people (Pakpak Bharat Regency in Figures, 2018) which is estimated to also have a fairly
high consumption need for local chicken meat or their products are sold outside the district.
This can be seen from the increase in the population growth of local chickens from 2014 to
2018 which is greater when compared to the population growth chart in Pakpak Bharat
Regency in 2014 - 2018.
The number of local chickens offered from year to year has increased. The chicken
seller / trader can choose between selling the chicken for money or holding the product for

988
his own use. The seller's desire or unwillingness to hold on to his product determines the
demand for his own product, while supply is a supply that is manifested in a mathematical
relationship with the factors that influence it, namely chicken prices, feed costs and seed
prices.
So from the description above the writer is interested in conducting research on the
factors that influence the demand and supply of local chicken in Pakpak Bharat Regency,
given the important role of local chicken as a national meat supplier in general and also for
Pakpak Bharat Regency because local chicken is part of the typical food.
II. Review of Literatures
2.1 Local Chicken Farming Sector in Pakpak Bharat Regency
The livestock sector which is also included in agribusiness is one of the phenomena that
will grow rapidly when the land base becomes limited. The demands of an integrated farming
system are becoming increasingly rational in line with the very limited demands for
efficiency and effectiveness in the use of land, labor, capital and other production factors.
The livestock sub-sector as one of the agricultural sub-sectors plays a role in meeting the
nutritional needs of the community's protein and one of the protein sources can be obtained
from chicken meat (Arifin, 2004 in Kurniati, 2014). The largest population of meat sources in
Pakpak Bharat is local chicken. The highest number of local chickens in 2017 was in Sitellu
Teli Urang Jehe Subdistrict, namely 30,827 tails and the smallest local chickens were in
Pagindar District 2,735 tails.
Table 1. Local chicken Population from The Largest According to District in Pakpak Bharat
Regency 2016 - 2017
No. Districts Year 2016 Year 2017
1. Sitellu Teli Urang Jehe 29.872 30.827
2. Salak 28.077 29.041
3. Sitellu Tali Urang Julu 17.850 18.654
4. Tinada 14.353 15.199
5. Kerjaan 14.369 15.075
6. Siempat Rube 13.326 14.265
7. Pergetteng-getteng Sengkut 6.684 7.721
8. Pagindar 1.992 2.735
Total 126.523 133.517
Source: Central Bureau of Statistics of Pakpak Bharat Regency, 2016 - 2017
2.2 Local Chicken
Local chicken is a type of poultry that is still natural in the sense that the word has not
received genetic improvement treatment. In terms of economic benefits, local chickens are
relatively few compared to purebred chickens, both in egg production and in the ability to
produce meat. However, local chickens are already popular among the consumer community
as a popular type of meat and egg producer. On that basis, the encouragement of this demand
also affects the development of local chicken rearing (Sayuti, 2002).
Local chicken is a local poultry whose population is spread throughout Indonesia. Local
poultry has great potential to be developed because it has a very
important role in fulfilling family nutrition adequacy, increasing family income and being
used as savings for breeders (Dewat and Sihombing, 2012).

989
The local chicken farm in Pakpak Bharat Regency has great prospects. According to
Utomo (2015), the increase in population from year to year, the level of community income
and public education will also lead to an increase in demand for animal products, especially meat.
On the other hand, it will also have a positive impact on breeders. The increasing demand for
chicken meat can also increase the income of chicken farmers. In his study, it was found that the
farm with the highest chicken population had the highest income. Meanwhile, Kurniati's (2014)
study shows that in general the chicken farming sector plays a role in the regional economy
because it is a basic sector, so that it can meet the needs of its own region.
2.3 Demand and Supply of Local Chicken The demand for local chickens generally comes from residents with high incomes. This
is also mentioned in the study of Nurtini et.al (1998) in Hadini et al. (2011) stated that in the
high income group, which is relatively more capable of choosing, they prefer local chicken to
broiler meat. This is also related to the health preference that local chicken meat tends to be
less fatty than broiler chicken meat. In Rosmiyati (2002), it is stated that the economic value
of local chickens tends to increase from year to year due to the production of local chickens
that are free from drug residues, antibiotics and so on. The increase in prices for these two types of inputs should lead to a decrease in supply
for broilers. An increase in input prices will cause production costs to increase, this increased
production cost will cause a decrease in the level of production produced by farmers, thus the
supply will also decrease (Tomek & Robinson, 1972 in Hartono, 2012).
2.4 Demand Theory The amount of demand (quantity demanded) of a product is the number of products that
buyers are willing and able to pay (Mankiw, 2006). There are many variables that affect the
amount of demand for a product. Mankiw (2006) states that the price of the product, income,
the price of the related product, tastes, expectations and the number of buyers are several
factors that can determine the size of the amount of demand. The law of demand states that, if
everything is left the same, when the price of a product increases, the quantity demanded will
decrease, and when the price falls, the quantity demanded will increase. So it can be said that
the quantity demanded is negatively related to price. As seen in Figure 2, the demand curve
(D = demand) decreases from left to right. The horizontal axis with q / t (quantity per unit of
time) is the quantity axis or the number of products, while the vertical axis is P (price) or
product price (Siahaan, 2011).
Another thing that most determines demand is of course taste, but economists usually
do not try to explain people's tastes because tastes are based on historical as well as
psychological forces that are outside the realm of economics. However, economists examine
what happens when people's tastes change (Mankiw, 2006). Rohim (2017) there are several
things that can affect demand, such as: 1. The price of the product itself, as a law of demand that the amount of demand for a product
will increase when the price of the product decreases and vice versa.
2. The price of substituted products, namely the price of the product that can replace the
product's position.
3. Consumer income, increased consumer income related to the purchasing power of consumers
for a product.
4. Consumer tastes, tastes or related preferences also have an influence on the demand for a
product. The demand for local chickens is higher due to the health preferences of consumers,
that local chickens are free of drug, antibiotic and other residues.
5. Population, although it is stated in Sukirno (2008) that an increase in population does not
automatically cause demand to increase. However, this is usually followed by the development
990
of job opportunities so that people's income increases. Nuraini (2014) states that as income
increases, the people's purchasing power also increases.
Apart from the five factors above, there are many other factors that can influence the
demand for a product. Such as estimated future prices, income distribution, producer efforts
to increase sales and so on.
2.5 Supply Theory The supply (quantity supplied) of a product is the amount of product that the seller is
willing and able to sell (Mankiw, 2006). There are many things that determine the amount of
product offered, but when we analyze how the market works, one of the determinants is the
price of the product. Besides that, it is also stated that: input prices, technology, expectations,
and the number of sellers can affect the amount of supply. The law of supply states that, if
everything is left the same, when the price of a product increases, the quantity of supply will
increase, and when the price falls, the quantity of supply will also decrease. It can be said that
the amount of supply is positively related to price (Siahaan, 2011).
The supply curve is a curve that shows the relationship between the price level of a
particular product and the quantity of that product offered by the seller. This curve is made on
the basis of real data regarding the relationship between the price level of the product and the
number of product offers stated in the list of offers (supply table). The supply function is an
equation that shows the relationship between the number of products offered by the seller and
all the factors that influence it (Nuhfil and Kardono. Makr Economic Theory: Graphic and
Mathematical Approaches. (Malang: Faculty of Economics, Brawijaya University, 2004).
III. Research Methods
The research area was determined purposively (intentionally), namely in Pakpak Bharat
Regency. The basis for the appointment of Pakpak Bharat Regency as the research location is
because Pakpak Bharat Regency is one of the production centers for local chicken meat in
North Sumatra Province. Data used in this research is time series data with a range of 2010 -
2019 which were analyzed with the help of the SPSS (Statistical Package for Social Science)
Version 20 program. To conduct an analysis on the identification of the first problem, in the
form of analyzing the growth trend of local chickens in Pakpak Bharat Regency. This trend is
seen from the graph formed by the production data of local chicken meat in Pakpak Bharat
Regency in the period 2010 - 2019. Meanwhile, to analyze the identification of the second
problem which looks at the factors that influence the demand and supply of local chicken
meat simultaneously and Partially tested using multiple linear regression models, utilizing the
SPSS program with the model equation for local chicken demand as follows:
Where: Qd = Demand for local chicken (Kg / capita / year)
a0 = Demand constant
a1-n = Free variable regression coefficient of demand
P1 = Price of local chicken (Rp / Kg)
P2 = Price of tilapia fish (Rp / Kg)
P3 = total population (soul)
P4 = income per capita (IDR / month)
e1 = Bully error
While the equation of the Local chicken Offer model is as follows:
Qd = a0 + a1P1 + a2P2 + a3P3 + a4P4 +e1

991
Where: Qs = Village Chicken Meat Offer (Kg / capita / year)
a0 = Supply Constant
a1-n = free variable regression coefficient of supply
P1 = Price of local chicken (Rp / Kg)
P2 = Price of local chicken feed (Rp / Kg)
P3 = Price of local chicken seeds (tails)
e1 = Bully error
The t test is a partial test of the effect of independent variables on the dependent
variable. The significant level of local chicken (α) used in social science is 5% (Firdaus,
2011). Testing Criteria: If sig. t ≤ 0.05 then H0 is rejected and H1 is accepted. If sig. t> 0.05, then H0 is accepted and H1 is rejected. The activity of analyzing data in this study includes
several basic stages that must be passed, in the form of a classic assumption test (Sutrisno, 2004).
IV. Result and Discussion
4.1 Growth Trend of Local Chickens in Pakpak Bharat Regency
In 2010 - 2019 the total production of Local chicken meat was 141,570 kg or an annual
average of 14,157 kg with an average growth of 31.7% for 10 years. The growth condition of
local chickens in Pakpak Bharat Regency in the period 2010-2019 in Pakpak Bharat Regency
has fluctuated from 2010-2019 which tends to increase every year which means experiencing
a positive trend. Based on data from the Pakpak Bharat Regency Agriculture Office (2019), it
shows that the highest local chicken production in 2019 was 18,600 kg and the lowest local
chicken production in 2012 was 9,960 kg. The average production of local chickens from
2010 to 2019 was 14,157 kg and you can see that the prospect of local chicken development
is quite good in Pakpak Bharat Regency because the curve trend is positive, meaning that it
has increased every year.
4.2 Factors Affecting the Demand for Local Chicken Meat in Pakpak Bharat Regency
From the data analysis method, it is known that the variables that can influence the
demand for Local chicken meat in Pakpak Bharat Regency are the price of local chicken meat
(X1), the price of tilapia meat (X2), population (X3), per capita income (X4). From the
independent variables or independent variables, it will be seen how much influence it has on
the demand for local chicken meat as the dependent or dependent variable. To test its effect,
it is necessary to test with the multiple linear regression method using SPSS 20 either
partially or simultaneously.
a. Classical Assumption Test Results (Normality Test)
The table below shows that the data in this study were normally distributed. This can be
seen from the results of Kolmogorov-Smirnov calculations, namely: the price of village
chicken meat (X1), the price of tilapia meat (X2), population (X3), per capita income (X4),
and the demand for local chicken meat (Y) obtained value asymp.sig of 0.345> 0.05 means
that all variables are normally distributed. So that this research can be continued to the next
test.
Qs = a0 + a1P1 + a2P2 + a3P3 + e1

992
Table 2. Normality Test Results
One-Sample Kolmogorov-Smirnov Test
Unstandardized
Residual
N 10
Normal Parametersa,b Mean 0E-7
Std. Deviation ,01285347
Most Extreme Differences
Absolute ,296
Positive ,296
Negative -,139
Kolmogorov-Smirnov Z ,936
Asymp. Sig. (2-tailed) ,345
a. Test distribution is Normal.
b. Calculated from data.
Source: Data processed with SPSS 20
b. Autocorrelation Test
The autocorrelation test is done by looking at the comparison of the calculated Durbin-
Watson value (dw) with the Durbin-Watson table value (dL and du). Where the Durbin-
Watson value (dw) obtained from the regression results is 2.3646 while the dL and dU values
can be seen in the Durbin-Watson table at a significance of 0.05. With n = 10, k = 5, then the
Degree of Freedom (df) is used, namely df1 = k = 5 and df2 = n-k = 5, so that the values of
dL = 0.3760 and du = 2.4137 are obtained.
Table 3. Autocorrelation Test Results of Model Summaryb
Model R R Square Adjusted R
Square
Std. Error of the
Estimate Durbin-Watson
1 ,988a ,976 ,957 ,01724473 2,3646
a. Predic4tors: (Constant), x4, x3, x2, x1
b. Dependent Variabel: y
Source: Data processed with SPSS 20
It can be concluded that the value of dw (Durbin-Watson) is 2.364 located in the area of
4–dU≤ dw≤ dU (1,5863≤ 2,3646 ≤ 2,4137). This proves that there is no autocorrelation in the
regression model for Kampung meat demand in Pakpak Bharat Regency.
c. Multicollinearity Test
The multicollinearity test in this study was carried out by looking at the Tolerance
value and the Variance Inflating Factor (VIF) value. If the tolerance value approaches 1, and
the VIF is between numbers 1 to 10, multicollinearity does not occur (Santoso, 2000).

993
Table 4. Multicollinearity Test Results of Coefficientsa
Model
Unstandardized
Coefficients
Standardized
Coefficients t Sig.
Collinearity
Statistics
B Std. Error Beta Tolerance VIF
(Constant) -9,239 1,070 -8,632 ,000
Local Chicken
Prices (X1) -,104 ,028 -,370 -3,755 ,013 ,496 2,017
The price of Tilapia
meat (X2) ,068 ,026 ,190 2,585 ,049 ,892 1,121
Total population
(X3) 2,765 ,247 ,892 11,218 ,000 ,762 1,313
Income per capita
(X4) ,212 ,049 ,408 4,370 ,007 ,551 1,815
a. Dependent Variabel: y
Source: Data processed with SPSS 20
Based on table 4 the independent variable has a VIF value between 1 - 10, and a
tolerance value less than 1, so the data does not occur multicollinearity.
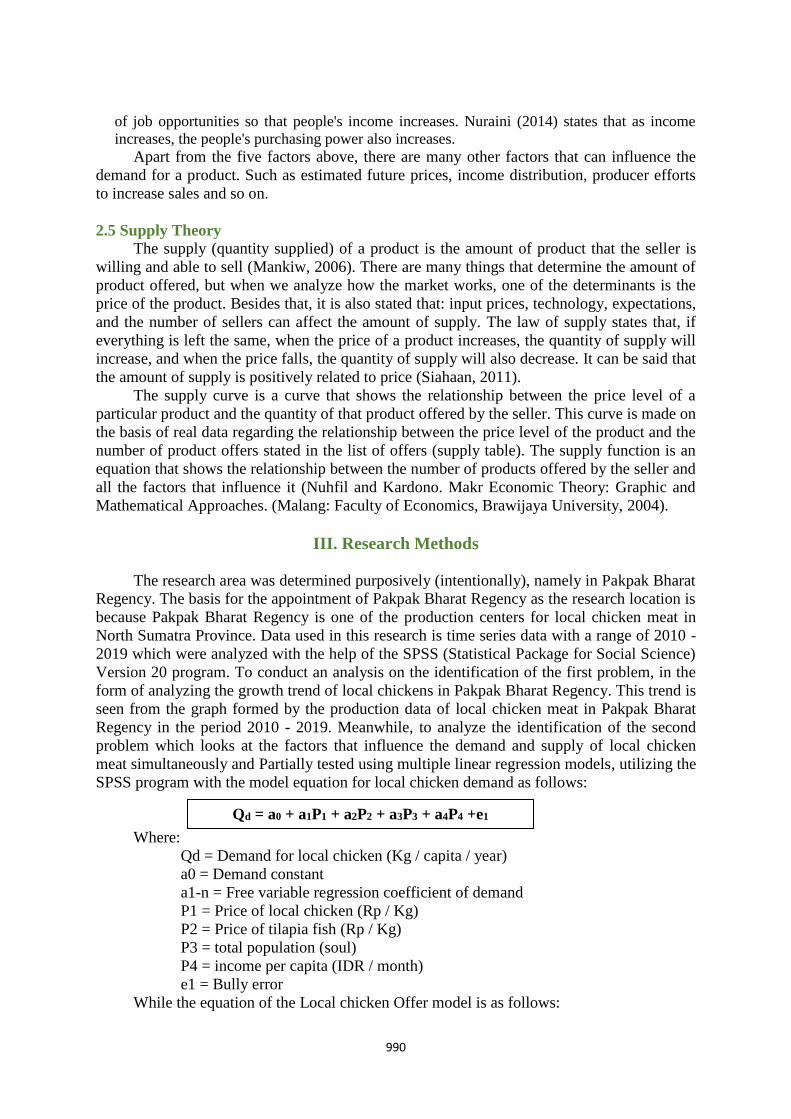
d. Heteroscedasticity Test According to Ghozali (2001) the basis for decision making for the heteroscedasticity test is:
a) If there is a certain pattern, such as the existing dots forming a certain regular pattern
(wavy, melting, then narrowing), it indicates that heteroscedasticity has occurred.
b) If there is no clear pattern, and the dots spread above and below the 0 on the Y axis, then
there is no heteroscedasticity.
Source: Data processed with SPSS 20
Figure 1. Position of the Scatterplot in the Heteroscedasticity Test
From the scatter plot in Figure 1, it can be seen that the dots spread out with an unclear
pattern above and below the number 0 on the Y axis. So in the regression model for Local
chicken meat supply in Pakpak Bharat Regency there is no heteroscedasticity problem.

994
d. Multiple Linear Regression Calculation Table 5. Results of Multiple Linear Regression Calculations of Coefficientsa
Model Unstandardized Coefficients
Standardized
Coefficients t Sig.
B Std. Error Beta
(Constant) 3,843 ,255 15,084 ,000
Price of local chicken
meat (X1) ,352 ,026 ,747 13,691 ,000
Price of local chicken
feed (X2) -,075 ,028 -,132 -2,649 ,038
Price of local chicken
seeds (X3) -,139 ,023 -,231 -6,029 ,001
a. Dependent Variabel: Y
Source: Data processed with SPSS 20
From the results of data processing in table 5, the regression equation can be made as
follows:
Y = a + b1X1 + b2X2+ b3X3+ ei
Y = 3,843 + 0,352 X1 – 0,075 X2 – 0,139 X3 + ei
The explanation of the multiple linear regression equation can be described as follows:
a. The constant value (a) is 3,843, meaning that if the independent variable is the price of
local chicken meat (X1), the price of local chicken feed (X2), local chicken seed (X3) is
constant, the offer of local chicken meat increases by 3843 kg.
b. The regression coefficient value of the village chicken meat price variable (b1) is 0.352,
meaning that if the price of local chicken meat (X1) increases by Rp. 1000, - / kg while the
other variables are constant, the offer of local chicken meat will increase by 352 kg.
c. The regression coefficient value of the price of local chicken feed (b2) is -0.075, meaning
that if the price of local chicken feed (X2) increases by Rp. 1000, - / kg while the other
variables are constant, then the offer of Local chicken meat will decrease by 75 kg.
d. The value of the regression coefficient variable for the price of local chicken seeds (b3) is
-0.139, meaning that if the price of local chicken seeds (X3) increases by Rp. 1000, - / kg
while the other variables are constant, the offer of Local chicken meat will decrease by
139 kg.
e. Partial Hypothesis Testing (t-test) Table 6. Results of the t test calculation of Coefficientsa
Model Unstandardized Coefficients
Standardized
Coefficients t Sig.
B Std. Error Beta
(Constant) 3,843 ,255 15,084 ,000
Local chicken Prices
(X1) ,352 ,026 ,747 13,691 ,000
Feed Prices (X2) -,075 ,028 -,132 -2,649 ,038
Price of local chicken
seeds (X3) -,139 ,023 -,231 -6,029 ,001
Dependent Variabel: Y
Source: Data processed with SPSS 20

995
Based on the t value and the significance value of the SPSS output above, it can be
described as follows:
1. Based on the results of the study, it shows that the variable price of local chicken meat
(X1) obtained the value of t count = 13.691 with the price of t tablepada df = n-k (10–4) =
6 at the significant level of 0.05, which is equal to 0.717. From this explanation, it can be
concluded that the value of tcount> ttable (13.691> 0.717) and sig. Probability 0.000
<0.05. Thus H01 is accepted and Ha1 is accepted, explaining that there is a positive and
significant effect of the price of Local chicken meat (X1) on the offer of Local chicken
meat (Y).
2. Based on the results of the study showed that the variable price of local chicken feed (X2)
obtained the value of t count = -2.649 with the price of t tablepada df = n-k (1 –4) = 6 at
the significant level of 0.05 was equal to 0.717. From this explanation, it can be concluded
that the value of t count <t table (-2.649 <0.717) and sig. probability 0.038 <0.05. Thus
Ho1 is rejected and Ha1 is accepted, explaining that there is a negative and significant
effect of the price of local chicken feed (X2) on the offer of Local chicken meat (Y).
3. Based on the results of the study showed that the variable price of village chicken seeds
(X3) obtained the value of t count = -6.029 with the price of t tablepada df = n - k (10 - 4)
= 6 at the significant level of 0.05 was equal to 0.717. From this explanation, it can be
concluded that the value of t count <t table (-6.029 <0.717) and sig. Probability 0.001
<0.05. Thus Ho1 is rejected and Ha1 is accepted, explaining that there is a negative and
significant effect of the price of Local chicken seed (x3) on the offer of Local chicken
meat (Y)
e. Simultaneous Hypothesis Testing (Test - F) Table 7. The Result of Simultaneous Test - F of ANOVAa
Model Sum of
Squares Df Mean Square F Sig.
Regression ,254 3 ,085 320,700 ,000b
Residual ,002 6 ,000
Total ,256 9
a. Dependent Variabel: Y
b. Predictors: (Constant), X3, X2, X1
Source: Data processed with SPSS 20
Simultaneous testing (F test) was carried out by comparing Fcount and Ftable with dk
comparison = k (number of variables studied) and dk denominator = nk-1 at a significant
level of 95% and alpha 5%, i.e. dk numerator = 3 and dk denominator = 4, then the amount is
6,59. Based on the results of the analysis above, it is obtained that Fcount = 320.700 with a
significant amount of 0.000, and the value of Fcount> Ftable (320.700> 6.59) and sig.
probability 0.000 <0.05, because Fcount> Ftable, and the significance level is smaller than
alpha (0.000 <0.05) means that the hypothesis is accepted, so there is a positive and
significant influence between the price of local chicken meat (X1), the price of local chicken
feed ( X2), the price of local chicken seeds (X3), on the offer of local chicken meat in Pakpak
Bharat Regency.

996
f. Coefficient of Determination (R2) Table 8. Results of the calculation of the coefficient of determination
Model Summaryb
Model R R Square Adjusted R Square Std. Error of the
Estimate
1 ,997a ,994 ,991 ,01625539
a. Predictors: (Constant), X3, X2, X1
c. Dependent Variabel: Y
Source: Data processed with SPSS 20
Based on the output, the R square number is 0.994 or 99.4%, thus showing that the
price of local chicken meat (X1), the price of local chicken feed (X2), the price of local
chicken seeds (X3) together have an influence on the dependent variable namely the offer of
local chicken meat in Pakpak Bharat Regency (Y) of 99.4%, and the remaining 0.6% of the
offer of local chicken in Pakpak Bharat Regency is influenced by other variables that are not
included in this research model, which can become further research.
4.4 Projection Trend of Local Chickens Production Growth in Pakpak Bharat Regency
in 2020 - 2029
Forecasting analysis of local chicken production in Pakpak Bharat Regency in 2020-
2029 was obtained by doing through Trend (long-term motion) using the Least Squares
Method (least squares method) through the SPSS program using Simple Linear Regression,
using data on chicken meat production in Pakpak Regency Bharat in 2010 - 2019, obtained
the trend equation (attachment):
Q* = a + bx*
Q* = 14157 + 266,33 x*
From the equation obtained, it can be seen that the production of local chickens for
2020-2029 by replacing the x value in the equation with the x value that has been determined
for that year. The equation obtained shows a positive trend, every year there is an increase in
the production of local chickens by 296.33 Kg.
Table 9. Forecasting Results of Village Chicken Production in Pakpak Bharat Regency Year
2020-2029
Year Free –arange Chicken Production (Kg)
2020 17417
2021 18009
2022 18602
2023 19195
2024 19787
2025 20380
2026 20973
2027 21565
2028 22158
2029 22751
Source: Researcher's Calculation Results (2020)

997
Based on table 9 above, it can be seen that each year there is an increase of 296.33 Kg,
where in 2020 the forecasting of Local chicken production is estimated at 17,417 Kg and it is
estimated that in 2029 it will be 22,751 Kg.
V. Conclusion
Based on the results of the analysis that has been carried out regarding the factors that
affect the demand and supply of Local chicken meat in Pakpak Bharat Regency, the
following conclusions are obtained:
1. Simultaneously and partially the price of local chicken meat, tilapia meat price, population
and income per capita have a significant effect on the demand for local chicken meat in
Pakpak Bharat Regency.
2. Simultaneously and partially the price of local chicken meat, feed price, and seed price
have a significant effect on the supply of local chickens in Pakpak Bharat Regency.
3. The production of local chickens in Pakpak Bharat Regency has a positive trend, meaning
that there is an increase from year to year (2020 – 2029
References
Arsyad, L. (2000). Ekonomi Manajerial. Yogyakarta: BPFE-Yogyakarta.
Badan Pusat Statistik. 2010 - 2019. Pakpak Bharat dalam angka. Kabupaten Pakpak Bharat:
BPS.
Dewanti, R. and Ginda S. (2012). Analisis Pendapatan Usaha Peternakan Ayam Buras (Studi
Kasus di Kecamatan Tegalombo, Kabupaten Pacitan). Buletin Peternakan, 36 (1):
48-56.
Direktorat Jenderal Peternakan dan Kesehatan Hewan. (2017). Buku Statistik Peternakan dan
Kesehatan Hewan Tahun 2017. Jakarta: Direktorat Jenderal Peternakan dan
Kesehatan Hewan.
Hadini, H.A., Sudi N., Endang S. (2011). Analisis Permintaan dan Prediksi Konsumsi Serta
Produksi Daging Broiler di Kota Kendari Propinsi Sulawesi Tenggara. Buletin
Peternakan, 35 (3): 202-207.
Hanani, N. and Kardono. (2004). Teori Ekonomi Makro: Pendekatan Grafis dan Matematis.
Malang: Fakultas Ekonomi Universitas Brawijaya.
Hartono, G. (2012). Analisis Penawaran Ayam Pedaging (Broiler) di Tingkat Petani. Majalah
Ilmiah Peternakan, 10 (3): 1-16.
Kurniati, S.A. (2014). Peran Sektor Peternakan Ayam Pedaging dalam Perekonomian
Kabupaten Kuantan Singingi Propinsi Riau. Jurnal Peternakan Indonesia, 16 (3): 170-
178.
Mankiw, N.G. (2006). Pengantar Ekonomi. Erlangga. Jakarta.
Nuraini, M. (2014). Analisis Faktor-Faktor Penentu Persistensi Laba. Skripsi. Semarang:
Universitas Diponegoro Semarang.
Rohim, A. (2017). Analisa Faktor yang Mempengaruhi Permintaan Daging Ayam Broiler di
Pasar Tradisional Kecamatan Citeureup Kabupaten Bogor. Skripsi. Bogor: Fakultas
Ekonomi dan Manajemen IPB.
Sayuti, R. (2002). Prospek Pengembangan Agribisnis Ayam Kampung sebagai Usaha
Ekonomi di Pedesaan. FAE, 20 (1): 40-49.
Siahaan, Ronald. (2011). Analisis Faktor-Faktor Yang Mempengaruhi Permintaan
dan Penawaran Daging Sapi di Sumatera Utara. Tesis. Medan. USU.

998
Shinta, H. et al. (2020). Potential Stunting in Riverside Peoples (Study on Pahandut Urban
Village, Palangka Raya City). Budapest International Research and Critics Institute-
Journal (BIRCI-Journal). P. 1618-1625
Sukirno, S. (2008). Pengantar Teori Mikro Ekonomi. Jakarta: PT. Raja Grafindo Persada.
Sutrisno. H. (2004). Analisis Regresi. Yogyakarta: Ando Offset.
Utomo, H.R., H. Setiyawan, S.I, Santoso. (2015). Analisis Profitabilitas Usaha Peternakan
Ayam Broiler dengan Pola Kemitraan di Kecamatan Limbangan Kabupaten Kendal.
Animal Agriculture Journal, 4 (1): 7-14.