Embed Size (px)
Citation preview

DRAFT
44
MALAYSIAN RATING CORPORATION BERHAD (Company No.: 364803 V)
SIME DARBY BERHAD
2009 New Rating and Annual Review Preliminary Rating Date Rating Action Rating Outlook September 2009 Assigned (i) AAAID
(ii) MARC-1ID /AAAID Stable
Issues (i) RM4,500 million Islamic Medium Term Notes
Programme (IMTN Programme) (ii) RM500 million Islamic Commercial Papers / Islamic
Medium Term Notes Programme (ICP/IMTN Programme) with a combined limit of RM4,500 million
Tenure (i) 20 years
(ii) 7 years
Issue Date To be determined
Facility Agent/
Lead Arranger
Maybank Investment Bank Berhad
Trustee Mayban Trustees Berhad Existing Ratings Date Rating Action Rating Outlook September 2009 Affirmed (iii) MARC-1ID /AAAID
(iv) MARC-1ID
Stable
Issues (iii) RM1,500 million Murabahah Commercial Papers / Murabahah Medium Term Notes Programme (iv) RM150 million Underwritten Murabahah Commercial Papers Facility
Contact Analysts Katherine Hee Cheui May [email protected] Nisha Joan Fernandez [email protected]
Elea Nor Zainal [email protected] Rajan Paramesran [email protected]
(603) 2092 5398
KDN NO: PP9914/09/2010(025456) CD 52249
CR
ED
IT A
NA
LYSIS
Co
rpo
rate
De
bt
C
on
glo
me
rate
CR
ED
IT A
NA
LYSIS
Publication Date: October 20, 2009
This credit analysis report is published in relation to the press announcement made on September 30, 2009.
MARC Analysis Sime Darby Berhad
1
MALAYSIAN RATING CORPORATION BERHAD
CREDIT ANALYSIS
CORPORATE DEBT / CONGLOMERATE
2009 New Rating and Annual Review
SIME DARBY BERHAD
Strengths
• Good revenue diversification and stable base for future earnings; • Favourable financial flexibility and liquidity; and • Increased operational scale in its oil palm plantation and property development businesses. Challenges/Risks
• Pressure on near-term credit protection measures from growth-related spending and subdued growth prospects; and
• Exposure to commodity price volatility and industry cyclicality.
Rationale MARC has assigned preliminary ratings of AAAID and MARC-1ID/AAAID to Sime Darby Berhad’s (Sime Darby) proposed Islamic debt programmes comprising RM4.5 billion Islamic Medium Term Notes (IMTN) and RM500 million Islamic Commercial Papers/Islamic Medium Term Notes (ICP/IMTN) respectively with a combined limit of RM4.5 billion. The ratings carry a stable outlook.
The rating actions incorporate the conglomerate’s reduced integration risk after almost two years of operation since its large-scale merger in November 2007, the current sizeable scale of its oil palm plantation and property development operations, its strong market positions in its automotive and industrial equipment business lines and sound financial profile. Although its unaudited financial results for the financial year ended June 30, 2009 (FY2009) was down substantially from FY2008, the ratings reflect MARC’s expectations that Sime Darby’s consolidated balance sheet and cash flow coverage will become progressively stronger as the operating climate in its core business lines improves over the intermediate term. The ratings also reflect Sime Darby’s favourable financial flexibility and the strong liquidity it has consistently maintained relative to leverage. The proceeds from the new issuance will potentially be partly utilised for the refinancing of the outstanding RM1.0 billion Murabahah Commercial Papers/Murabahah Medium Term Notes (MCP/MMTN Programme) currently rated MARC-1ID / AAAID and RM150 million Murabahah Commercial Papers (MCP) currently rated MARC-1ID. The balance of the proceeds is expected to be utilised for group’s working capital requirements and general corporate purposes, future investments and/or capital expenditure. Sime Darby is the world’s largest oil palm plantation group and Malaysia’s largest property developer by landbank. Sime Darby has maintained strong niche-market leading positions in the industrial, motor, energy and utilities sectors. It is the third largest automobile dealer group globally for German automaker, BMW, and one of the world’s largest dealers for heavy equipment maker, US-based Caterpillar Inc. The geographical diversity of Sime Darby’s operations and the range of customers and industries continue to mitigate its exposure to downturns in specific sectors. Nevertheless, the group’s financial performance has been impacted by the current economic crisis.

MARC Analysis Sime Darby Berhad
2
For FY2009, the group’s revenue and pre-tax profit dropped by 9.0% and 41.0% to RM31.0 billion (FY2008: RM34.0 billion) and RM3.1 billion (FY2008: RM5.2 billion), respectively. The lower result was mainly due to weaker performance of the plantation division as a result of lower average crude palm oil (CPO) prices. However, despite lower CPO and palm kernel prices, Sime Darby’s net profit after tax and minority interests of RM2.3 billion for FY2009 exceeded the group’s revised Key Performance Indicator (KPI) of RM1.9 billion by 20%, from the earlier announced KPI of RM3.7 billion, mainly due to improvements in industrial, property and motor divisions amid a lower global demand. The plantation division contributed more than half of the group’s profit before interest and tax (PBIT), as compared to its FY2008’s contribution of 70.4% attributed to the lower CPO prices, apart from lower production as a result of lower fresh fruit bunches (FFB) yield. The industrial and property divisions were the second and
third largest contributors of PBIT, respectively in FY2009. The group’s capital structure continues to be characterised by a low level of net debt, with a consolidated debt-to-equity ratio (DE) of 0.25 times as of June 30, 2009. With full drawdown of the proposed combined limit of RM4.5 billion Islamic debt programmes and retirement of its outstanding RM1.0 billion MCP/MMTN Programme and RM150 million MCP, the group’s DE will increase to 0.41 times on a pro forma basis. However, the group intends to draw down the Islamic programme progressively. While its
capital spending requirements of RM7.0 billion over the next two to three years are expected to exceed annual operating cash flow in FY2010 and FY2011, Sime Darby would need to maintain its debt structure and liquidity within the agency’s tolerance range in order to retain the current ratings. The group would need to keep its DE at below 0.50 times and to maintain a satisfactory liquidity cushion in the form of cash and cash equivalents to retain the current ratings. Sime Darby’s cash and cash equivalents had risen to RM3.3 billion as of June 30, 2009 against near-term debt maturities and short-term borrowings of RM3.6 billion (including the outstanding RM1.0 billion
MCP/MMTN Programme and RM150.0 million MCP) which Sime Darby plans to refinance with proceeds from the issuance of notes under the proposed Islamic debt programme. MARC believes that the proposed facilities will augment Sime Darby’s financial flexibility by allowing it to proactively addressing its debt maturities. The stable ratings outlook incorporate some weakening of Sime Darby’s near-term credit measures from historical levels given the lack of free cash flow generation expected. However, if business conditions and an operating performance prove to be significantly below MARC’s expectations, this could pressure the current ratings or outlook. One of the main challenges Sime Darby will foreseeably face is to receive strong dividends flow from its subsidiaries amid slower growth prospects.
Exhibit 1: Financial Highlights
FYE 30 June FY2009* 2008 2007
Revenue (RM in million) 31,014 34,045 28,230
Pre-tax profit (RM in million) 3,072 5,206 3,573
Operating profit margin (%) 10.16 15.09 12.72
CFO interest coverage (times) 2.93 13.27 9.68
Debt-to-equity (times) 0.25 0.22 0.31
Shareholders’ funds (RM in million) 22,006 22,205 19,554
*Unaudited results CFO – Cash flow generated from operations after tax but before interest Note: Shareholders’ funds is inclusive of Minority Interest

MARC Analysis Sime Darby Berhad
3
BUSINESS DESCRIPTION
Company background
Sime Darby Berhad is the merged entity of three Malaysian corporations: Kumpulan Sime Darby, Kumpulan Guthrie Berhad (Guthrie) and Golden Hope Plantations Berhad (Golden Hope). The merger exercise, announced in November 2006 and completed in November 2007, was by way of issuance of Redeemable Convertible Preference Shares (RCPS A) in Sime Darby to the shareholders of the acquired companies on the basis of one RCPS A to one ordinary share of Sime Darby or cash payment of RM5.25 per RCPS A on the expiry date. A total of 5.95 billion shares in Sime Darby were issued and RM401.01
million in cash was paid. The merger has fortified Sime Darby’s position in key sectors of the domestic economy: plantation, property, motors, industrial, energy and utilities. Non-core businesses are placed under healthcare and others. The merger has resulted in Sime Darby emerging as the world’s leading oil palm plantation group with significant presence in downstream palm oil activities; and a dominant player in property development with sizeable landbank in the country. In the motor division, Sime Darby holds
distributorship and dealership of well known motor brands such as BMW and in the industrial division, it holds the Caterpillar rights in 12 countries. Despite the benefits accrued from the enlarged size, the challenges facing Sime Darby is avoiding diseconomies of scale to maximise value throughout the group, particularly in improving yields and cost efficiency in the plantation division where, prior to the merger, Kumpulan Sime Darby, Golden Hope and Guthrie were significant players in the plantation sector.
A breakdown of revenue and profit before interest and tax (PBIT) for the businesses is illustrated below:
Exhibit 2: Segment Results for Unaudited FY2009 and FY2008 FY2009*(RM million) FY2008 (RM million)
Segment Revenue % PBIT % Revenue % PBIT %
Plantation 10,658 34 1,719 52 13,162 39 3,877 70
Industrial 7,870 25 862 26 7,223 21 696 13 Motors 7,510 24 178 5 7,926 23 158 3 Property 1,408 4 462 14 1,420 4 443 8 Energy and Utilities 2,939 10 41 1 3,165 9 229 4 General Trading, Services & Others 629 2 10 <1 1,149 3 104 2
*Unaudited results
Segment Main Activity
Plantation Oil palm and rubber cultivation and palm oil refining and fractionation Industrial Sales and servicing of heavy equipment Motors Assembly, distribution of vehicles, retails and the provision of after-sale services Property Property development, management and investment, and provision of golf and other
recreational services Energy and Utilities Engineering design and fabrication, system integration, power generation, treatment
and supply of treated water, and ownership and management of port facilities Healthcare and Others Provision of healthcare services, travel and insurance broking, bedding operations,
marketing of industrial products

MARC Analysis Sime Darby Berhad
4
1. PLANTATION DIVISION
PALM OIL INDUSTRY OUTLOOK
Palm oil inventory rose to its highest level for calendar year 2009 in September as production recovers in Sabah and Sarawak. East Malaysian crops were affected by heavy rainfall early this year but improved month-on-month production since June 2009 indicates that East Malaysian palm trees are in recovery mode. Total output rose 10.2% quarter-on-quarter from 4.13 million MT in 2Q2009 to 4.54 million MT in 3Q2009. Though production in Peninsular Malaysia has been declining on a monthly basis since July 2009 from 0.95 million MT to 0.87 million MT in September (reduction of 0.08 million MT), Sabah and
Sarawak’s production rose by 0.16 million MT and 0.04 million MT respectively, offsetting the reduction in Peninsular Malaysia. Exports in 3Q2009 increased by 10.4% from 2Q2009 led by strong demand from key importing countries, namely, China, India and Pakistan. Despite recording quarter-on-quarter increase in exports in 3Q2009, monthly export data from July to September indicates monthly reduction in exports. Exports in September dropped marginally by 5,037 MT from August. Despite increase in shipment to China
(+0.28 million MT), the EU (+0.47 million MT) and Pakistan (+0.32 million MT), decline in shipment to India (-0.27 million MT), the US (-0.52 million MT) and Ukraine (-0.35 million MT) offset the higher demand from China, EU and Pakistan. Increased stocks and increased production in 3Q2009 led to lower average CPO prices compared with 2Q2009. Palm oil industry data – 2Q2009 and 3Q2009 3Q2009
(‘000 MT) 2Q2009
(‘000 MT) Q-o-Q change (%)
Production 4,544 4,125 +10.2 Export 4,088 3,702 +10.4 Stock 4,326 4,073 +6.2 Average Price (RM/MT) 2,250.2 2,530.0 -11.1
Source: MPOB
Sales of US soya oil in September 2009 have nearly doubled last year’s pace, exceeding 14 million tonnes compared with 7.5 million tonnes a year ago. The larger sales reflect continued strong foreign demand, particularly from China, in response to limited supplies from South America due to damaged crops in Argentina and Brazil, the second and third largest soya oil producer after US.
Source: MPOB
CPO price and prices of competing oils have been range bound for the past few months. SGS reported that Malaysia’s palm oil shipment for the first 10 days of October increased by 3.9% from the same period in September 2009 indicating that demand is still strong. However, increased production data

MARC Analysis Sime Darby Berhad
5
and higher inventories coupled with impact of strong palm oil production from Indonesia over the past couple of months may place a lid on palm oil prices. Dow Jones’ pre-report survey regarding monthly Crop Production and World Agricultural Supply and Demand Estimates for October 2009 indicates that predicted soybean yields would be higher than 42.7 bu/acre, which is a record high achieved in 20061. The prediction of record high yields is based on this year’s record number of planted soybean acres. MARC does not expect prices of CPO to increase further in 4Q2009 on the back of higher expected output of soya oil, continued high production of palm oil in East Malaysia and growing palm oil inventory levels. The price direction of CPO going forward would still be dependent on soya bean crop output from the US, development of South American crops for 2010 and El Nino weather updates.
BUSINESS RISK ANALYSIS
Competitive position
Sime Darby through its wholly-owned subsidiary Sime Darby Plantation Sdn Bhd (SDPSB) benefits from an extensive experience and technical expertise of the personnel in Golden Hope and Guthrie, two of the
country’s largest plantation which have been involved oil palm cultivation as well as downstream activities in oil and fats and oleochemicals production alongside other agri-business activities including the cultivation of rubber. Oil palm plantation
Largest oil palm plantation area and healthy maturity profile
With about 650,000 hectares (ha) of plantation land in 208 estates in Malaysia and Indonesia, of which 81.6% is planted with oil palm trees - Malaysian and Indonesian oil palm plantations represent 326,699 ha and 203,488 ha respectively as of March 31, 2009 – the group plans to continue expanding its plantations landbank to one million ha by 2011. Nearly 90% of its planted area is matured and Exhibit 3 indicates that approximately 18.8% and 59.6% of the oil palm trees planted are aged between four to eight years and nine to 18 years respectively.
Exhibit 3: Oil Palm Trees Maturity Profile as of March 31, 2009
0 20,000 40,000 60,000 80,000 100,000 120,000 140,000 160,000 180,000
4-8 years
9-18 years
19-25 years
Above 25 years
Immature (< 3 years)
Matu
rity
ha
Malaysia Indonesia
1 CME Group/Chicago Board of Trade companies, article “Output numbers will not drive feed prices” dated October 7, 2009
MARC Analysis Sime Darby Berhad
6
Replanting programs in place for oil palm trees above 25 years The group’s replanting policy is 4% of planted area annually. However, actual implementation may vary according to weather conditions, among other factors. MARC notes that 69.4% of the group’s oil palm trees have reached prime or peak production period age between 9 and 25 years old, 9.9% of the oil palm trees are immature (less than three years), while only 2% of the oil palm trees are aged above 25 years as of March 31, 2009. Replanting programs (Exhibit 21, Appendix II) are in place for palms above 25 years of age to sustain an even age profile of its palm trees, going forward. The estimated planting cost-to-maturity for the Malaysian plantation and Indonesian plantation stood at RM10,000 per ha and RM12,200 per ha respectively as of March 31, 2009, though planting cost-to-maturity may vary
according to agronomic conditions i.e. terrain and soil type. Reduced FFB yield and production due to weather conditions and tree stress As of March 31, 2009 or nine-month financial results, total fresh fruit bunches (FFB) harvested dropped by 7.1% to 7.38 million metric tonnes (MT) from 7.94 million MT in the same period last year. SDPSB’s Malaysian plantation contributed 72.0% of the total FFB produced (5.31 million MT) while the remaining
2.08 million MT FFB was from its Indonesian estates. FFB from third party estates or suppliers for milling accounted for approximately 10% of the total FFB production for the period under review. Average FFB yield per mature hectare for Malaysian and Indonesian estates stood at 17.60 MT/ha (9MFY2008: 18.00 MT/ha) and 11.70 MT/ha (9MFY2008:14.20 MT/ha) respectively. The lower yield performance was primarily due to adverse weather conditions and biological tree stress during the period under review. While this is to some extent affect its other peers as well, MARC opines that there could have been some setbacks in its plantation’s operations, particularly its Indonesian estates, arising from the merger.
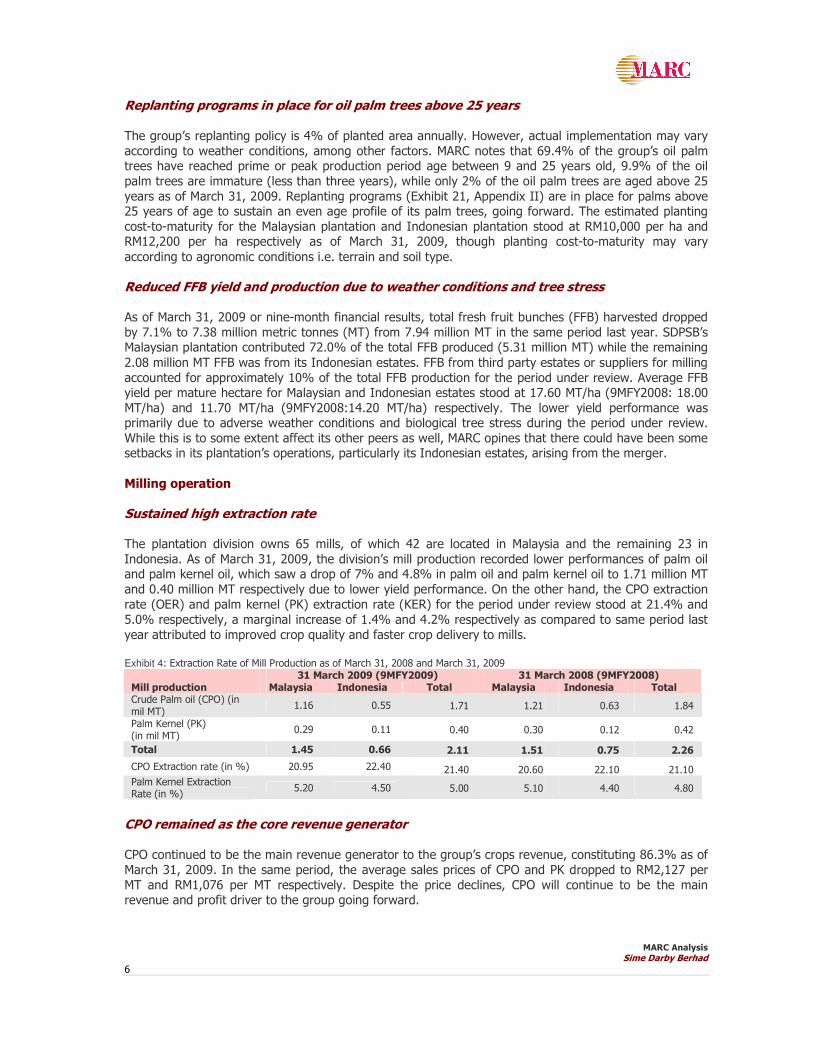
Milling operation Sustained high extraction rate The plantation division owns 65 mills, of which 42 are located in Malaysia and the remaining 23 in Indonesia. As of March 31, 2009, the division’s mill production recorded lower performances of palm oil and palm kernel oil, which saw a drop of 7% and 4.8% in palm oil and palm kernel oil to 1.71 million MT and 0.40 million MT respectively due to lower yield performance. On the other hand, the CPO extraction rate (OER) and palm kernel (PK) extraction rate (KER) for the period under review stood at 21.4% and 5.0% respectively, a marginal increase of 1.4% and 4.2% respectively as compared to same period last year attributed to improved crop quality and faster crop delivery to mills. Exhibit 4: Extraction Rate of Mill Production as of March 31, 2008 and March 31, 2009
31 March 2009 (9MFY2009) 31 March 2008 (9MFY2008) Mill production Malaysia Indonesia Total Malaysia Indonesia Total Crude Palm oil (CPO) (in mil MT)
1.16 0.55 1.71 1.21 0.63 1.84
Palm Kernel (PK) (in mil MT)
0.29 0.11 0.40 0.30 0.12 0.42
Total 1.45 0.66 2.11 1.51 0.75 2.26
CPO Extraction rate (in %) 20.95 22.40 21.40 20.60 22.10 21.10 Palm Kernel Extraction Rate (in %)
5.20 4.50 5.00 5.10 4.40 4.80
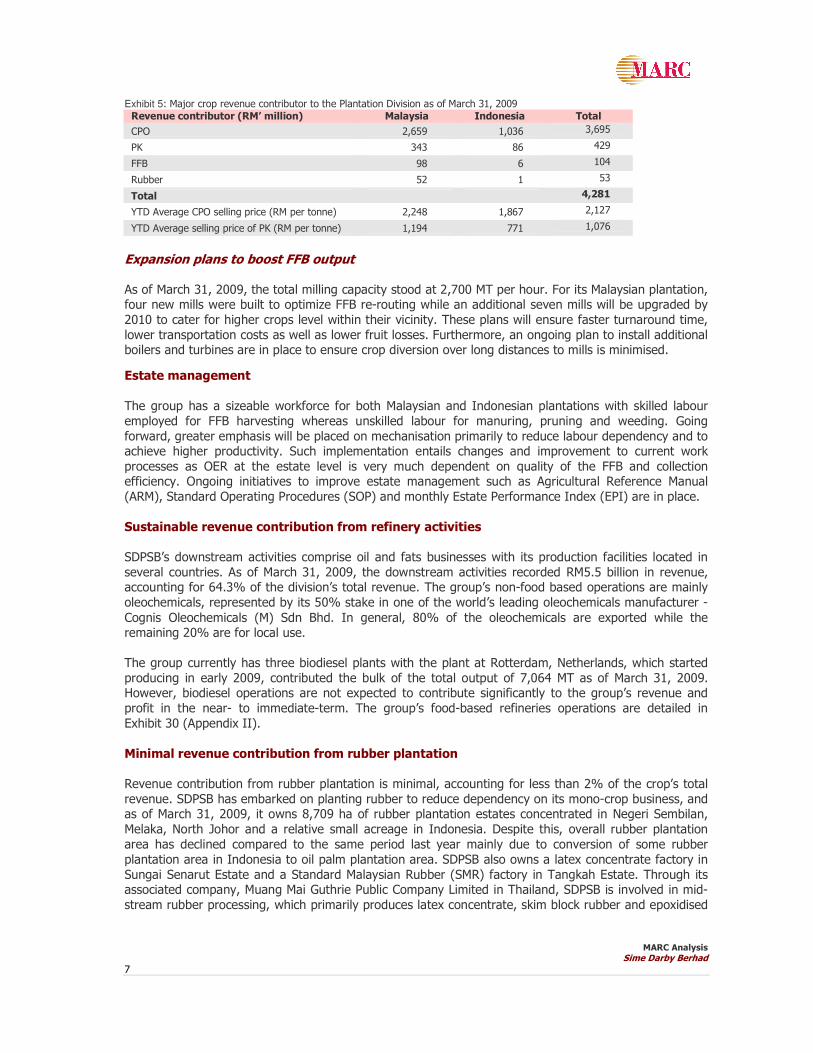
CPO remained as the core revenue generator CPO continued to be the main revenue generator to the group’s crops revenue, constituting 86.3% as of March 31, 2009. In the same period, the average sales prices of CPO and PK dropped to RM2,127 per MT and RM1,076 per MT respectively. Despite the price declines, CPO will continue to be the main revenue and profit driver to the group going forward.
MARC Analysis Sime Darby Berhad
7
Exhibit 5: Major crop revenue contributor to the Plantation Division as of March 31, 2009
Revenue contributor (RM’ million) Malaysia Indonesia Total
CPO 2,659 1,036 3,695
PK 343 86 429
FFB 98 6 104
Rubber 52 1 53
Total 4,281
YTD Average CPO selling price (RM per tonne) 2,248 1,867 2,127
YTD Average selling price of PK (RM per tonne) 1,194 771 1,076
Expansion plans to boost FFB output As of March 31, 2009, the total milling capacity stood at 2,700 MT per hour. For its Malaysian plantation, four new mills were built to optimize FFB re-routing while an additional seven mills will be upgraded by 2010 to cater for higher crops level within their vicinity. These plans will ensure faster turnaround time, lower transportation costs as well as lower fruit losses. Furthermore, an ongoing plan to install additional boilers and turbines are in place to ensure crop diversion over long distances to mills is minimised.
Estate management
The group has a sizeable workforce for both Malaysian and Indonesian plantations with skilled labour employed for FFB harvesting whereas unskilled labour for manuring, pruning and weeding. Going forward, greater emphasis will be placed on mechanisation primarily to reduce labour dependency and to achieve higher productivity. Such implementation entails changes and improvement to current work processes as OER at the estate level is very much dependent on quality of the FFB and collection efficiency. Ongoing initiatives to improve estate management such as Agricultural Reference Manual (ARM), Standard Operating Procedures (SOP) and monthly Estate Performance Index (EPI) are in place.
Sustainable revenue contribution from refinery activities
SDPSB’s downstream activities comprise oil and fats businesses with its production facilities located in several countries. As of March 31, 2009, the downstream activities recorded RM5.5 billion in revenue, accounting for 64.3% of the division’s total revenue. The group’s non-food based operations are mainly oleochemicals, represented by its 50% stake in one of the world’s leading oleochemicals manufacturer -
Cognis Oleochemicals (M) Sdn Bhd. In general, 80% of the oleochemicals are exported while the remaining 20% are for local use. The group currently has three biodiesel plants with the plant at Rotterdam, Netherlands, which started producing in early 2009, contributed the bulk of the total output of 7,064 MT as of March 31, 2009. However, biodiesel operations are not expected to contribute significantly to the group’s revenue and profit in the near- to immediate-term. The group’s food-based refineries operations are detailed in Exhibit 30 (Appendix II). Minimal revenue contribution from rubber plantation
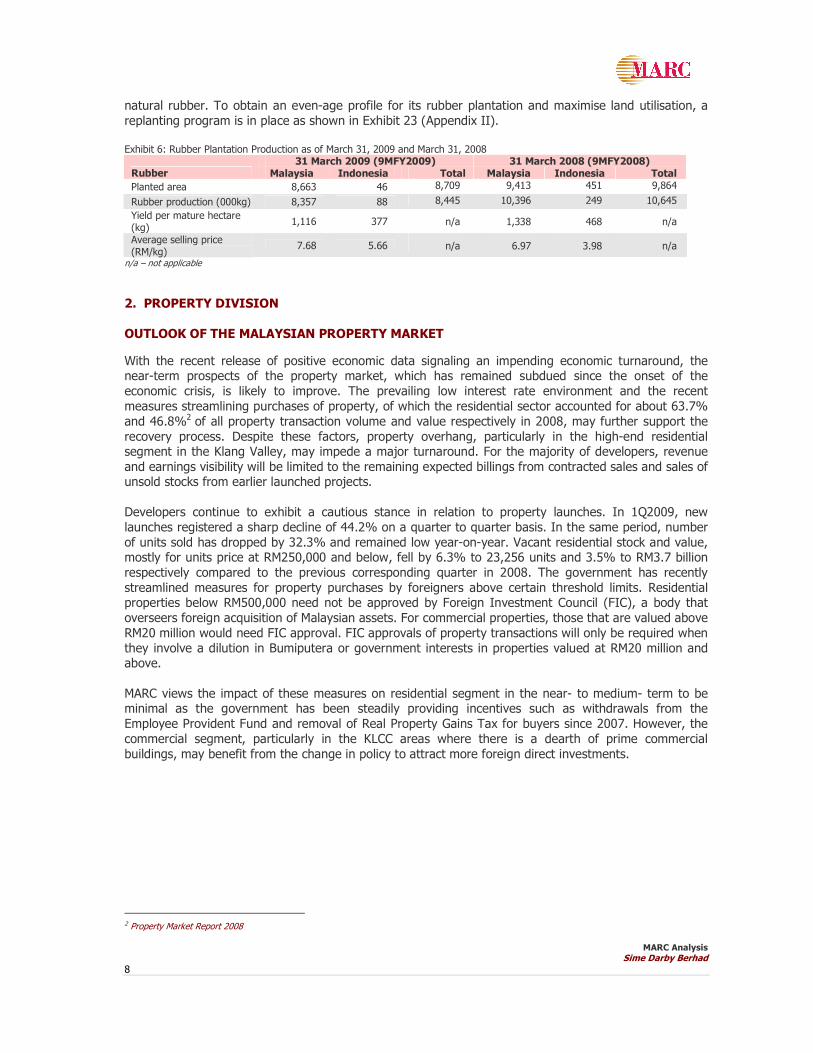
Revenue contribution from rubber plantation is minimal, accounting for less than 2% of the crop’s total revenue. SDPSB has embarked on planting rubber to reduce dependency on its mono-crop business, and as of March 31, 2009, it owns 8,709 ha of rubber plantation estates concentrated in Negeri Sembilan, Melaka, North Johor and a relative small acreage in Indonesia. Despite this, overall rubber plantation area has declined compared to the same period last year mainly due to conversion of some rubber plantation area in Indonesia to oil palm plantation area. SDPSB also owns a latex concentrate factory in Sungai Senarut Estate and a Standard Malaysian Rubber (SMR) factory in Tangkah Estate. Through its associated company, Muang Mai Guthrie Public Company Limited in Thailand, SDPSB is involved in mid-stream rubber processing, which primarily produces latex concentrate, skim block rubber and epoxidised
MARC Analysis Sime Darby Berhad
8
natural rubber. To obtain an even-age profile for its rubber plantation and maximise land utilisation, a replanting program is in place as shown in Exhibit 23 (Appendix II). Exhibit 6: Rubber Plantation Production as of March 31, 2009 and March 31, 2008
31 March 2009 (9MFY2009) 31 March 2008 (9MFY2008) Rubber Malaysia Indonesia Total Malaysia Indonesia Total
Planted area 8,663 46 8,709 9,413 451 9,864
Rubber production (000kg) 8,357 88 8,445 10,396 249 10,645
Yield per mature hectare (kg)
1,116 377 n/a 1,338 468 n/a
Average selling price (RM/kg)
7.68 5.66 n/a 6.97 3.98 n/a
n/a – not applicable
2. PROPERTY DIVISION
OUTLOOK OF THE MALAYSIAN PROPERTY MARKET
With the recent release of positive economic data signaling an impending economic turnaround, the near-term prospects of the property market, which has remained subdued since the onset of the economic crisis, is likely to improve. The prevailing low interest rate environment and the recent measures streamlining purchases of property, of which the residential sector accounted for about 63.7% and 46.8%2 of all property transaction volume and value respectively in 2008, may further support the recovery process. Despite these factors, property overhang, particularly in the high-end residential segment in the Klang Valley, may impede a major turnaround. For the majority of developers, revenue and earnings visibility will be limited to the remaining expected billings from contracted sales and sales of unsold stocks from earlier launched projects. Developers continue to exhibit a cautious stance in relation to property launches. In 1Q2009, new launches registered a sharp decline of 44.2% on a quarter to quarter basis. In the same period, number of units sold has dropped by 32.3% and remained low year-on-year. Vacant residential stock and value, mostly for units price at RM250,000 and below, fell by 6.3% to 23,256 units and 3.5% to RM3.7 billion respectively compared to the previous corresponding quarter in 2008. The government has recently streamlined measures for property purchases by foreigners above certain threshold limits. Residential properties below RM500,000 need not be approved by Foreign Investment Council (FIC), a body that overseers foreign acquisition of Malaysian assets. For commercial properties, those that are valued above RM20 million would need FIC approval. FIC approvals of property transactions will only be required when they involve a dilution in Bumiputera or government interests in properties valued at RM20 million and above. MARC views the impact of these measures on residential segment in the near- to medium- term to be minimal as the government has been steadily providing incentives such as withdrawals from the Employee Provident Fund and removal of Real Property Gains Tax for buyers since 2007. However, the commercial segment, particularly in the KLCC areas where there is a dearth of prime commercial buildings, may benefit from the change in policy to attract more foreign direct investments.
2 Property Market Report 2008
MARC Analysis Sime Darby Berhad
9
BUSINESS RISK ANALYSIS
Overview
Sime Darby’s property division is led by Sime Darby Property Berhad (SDPB) which was established to hold the property arms of the enlarged merged entity. In Malaysia, the main development is strategically located in Klang Valley, SDPB also operates in seven other countries, namely Singapore, Australia, Vietnam, China, Indonesia, Phillipines and the United Kingdom. Property Development
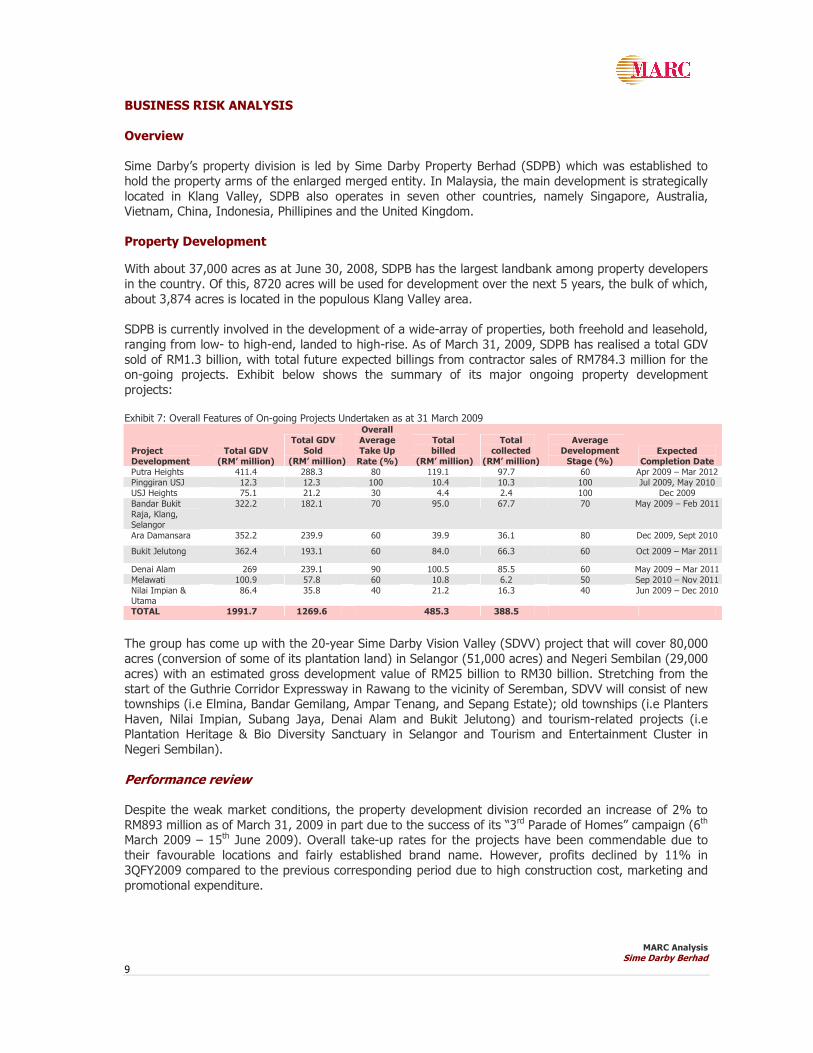
With about 37,000 acres as at June 30, 2008, SDPB has the largest landbank among property developers in the country. Of this, 8720 acres will be used for development over the next 5 years, the bulk of which, about 3,874 acres is located in the populous Klang Valley area. SDPB is currently involved in the development of a wide-array of properties, both freehold and leasehold, ranging from low- to high-end, landed to high-rise. As of March 31, 2009, SDPB has realised a total GDV sold of RM1.3 billion, with total future expected billings from contractor sales of RM784.3 million for the on-going projects. Exhibit below shows the summary of its major ongoing property development projects: Exhibit 7: Overall Features of On-going Projects Undertaken as at 31 March 2009
Project Development
Total GDV (RM’ million)
Total GDV Sold
(RM’ million)
Overall Average Take Up
Rate (%)
Total billed
(RM’ million)
Total collected
(RM’ million)
Average Development Stage (%)
Expected Completion Date
Putra Heights 411.4 288.3 80 119.1 97.7 60 Apr 2009 – Mar 2012 Pinggiran USJ 12.3 12.3 100 10.4 10.3 100 Jul 2009, May 2010 USJ Heights 75.1 21.2 30 4.4 2.4 100 Dec 2009
Bandar Bukit Raja, Klang, Selangor
322.2 182.1 70 95.0 67.7 70 May 2009 – Feb 2011
Ara Damansara 352.2 239.9 60 39.9 36.1 80 Dec 2009, Sept 2010
Bukit Jelutong 362.4 193.1 60 84.0 66.3 60 Oct 2009 – Mar 2011
Denai Alam 269 239.1 90 100.5 85.5 60 May 2009 – Mar 2011 Melawati 100.9 57.8 60 10.8 6.2 50 Sep 2010 – Nov 2011
Nilai Impian & Utama
86.4 35.8 40 21.2 16.3 40 Jun 2009 – Dec 2010
TOTAL 1991.7 1269.6 485.3 388.5
The group has come up with the 20-year Sime Darby Vision Valley (SDVV) project that will cover 80,000 acres (conversion of some of its plantation land) in Selangor (51,000 acres) and Negeri Sembilan (29,000 acres) with an estimated gross development value of RM25 billion to RM30 billion. Stretching from the start of the Guthrie Corridor Expressway in Rawang to the vicinity of Seremban, SDVV will consist of new townships (i.e Elmina, Bandar Gemilang, Ampar Tenang, and Sepang Estate); old townships (i.e Planters Haven, Nilai Impian, Subang Jaya, Denai Alam and Bukit Jelutong) and tourism-related projects (i.e Plantation Heritage & Bio Diversity Sanctuary in Selangor and Tourism and Entertainment Cluster in Negeri Sembilan). Performance review Despite the weak market conditions, the property development division recorded an increase of 2% to RM893 million as of March 31, 2009 in part due to the success of its “3rd Parade of Homes” campaign (6th March 2009 – 15th June 2009). Overall take-up rates for the projects have been commendable due to their favourable locations and fairly established brand name. However, profits declined by 11% in 3QFY2009 compared to the previous corresponding period due to high construction cost, marketing and promotional expenditure.

MARC Analysis Sime Darby Berhad
10
Asset Management
SDPB manages the group internal offices such as Wisma Sime Darby, Wisma Consplant, Wisma Guthrie, Wisma UEP and Guthrie Pavillion in Malaysia, Sime Darby Centre, Performance Centre and Sime Darby Enterprise Centre in Singapore with responsibility for tenancy and maintenance management of office buildings, industrial properties, shop offices, staff holiday bungalows and sporting facilities (Bayuemas Oval and Indoor Bowls Stadium).
Overall average occupancy rates for commercial properties, particularly office space is more than 90% as of March 31, 2009. The high occupancy rate for commercial properties can be attributed to strong and stable tenant mix which includes government departments, internal Sime offices, educational institutions, multinational corporations among others. The occupancy rate is expected to remain stable as tenancy agreements will only expire in the next 2 to 3 years. In addition, the average rental rate of RM3.42psf for commercial property is in line with the average market rental rate for the industry.
However, tenancy and rental rates for Singapore properties have declined due to the impact of the economic recession in Singapore. Occupancy rate stands at 63.5% for 9MFY2009, from 100% recorded in the corresponding period. Average rental rate for the period under review stands at S$2.83psf or RM6.80 (at the exchange rate of S$1=RM2.4). Hospitality & Leisure
In view of the weak global economy, its hospitality & leisure operations, which are mainly in Malaysia, Singapore, Australia and Vietnam, have registered declining occupancy rate and average room rate since September 2008. For the nine months ending March 31, 2009, the average occupancy rate declined by 7.7%, while the average room rates rose by 7.6%. Service apartments, in particular was affected as most companies scaled back on corporate travel and budget for accommodation. Among the properties in its portfolio, only Quest Subiaco in Perth improved its performance benefitting from inter- and intra-state tourists travel. The performance of the two other Australian hotels and service apartments, Karri Valley Resorts and Quest Margaret River registered a marginal decline in occupancy rates to 64.2% and 64.3% respectively. In contrast, Sinagapore-based Darby Park Executive Suites, recorded the largest decline in occupancy rate of 18.5% to 76.47% for the period under review. This is expected to improve in line with the anticipated pick-up in tourism activity in 2010 due to the opening of two integrated resorts next year. For Malaysian hotels, namely Hotel Equitorial Melaka, Genting View Resort and Harvard Suasana Hotel, the occupancy rate remained poor with an average of 48.9% in 9MFY2009. Its Sime Darby Convention Center (SDCC) has maintained its revenue in 9MFY2009 at RM4.09 million (9MFY2008: RM4.07 million). Future Plans Using its considerable landbank, SDPB plans to lead the property industry as a sustainable community builder rather than just a property or township developer. Internationally, SDPB will be seeking more investment opportunities in China and has identified several projects for the next 3 years. In addition, SDPB also intends to strengthen its asset turnover by acquiring undervalued assets or projects, both locally and internationally.

MARC Analysis Sime Darby Berhad
11
3. MOTORS DIVISION
MALAYSIAN AUTOMOTIVE INDUSTRY OUTLOOK
Despite the improving economic prospects, MARC attaches a negative outlook on the local automotive industry due to tightened hire-purchase lending by financial institutions, the weak secondary market, and poor new model visibility. These factors will continue to affect the demand for motor vehicles leading to stagnant total industry volume (TIV) growth in the near term. The TIV recorded a decline of 5% year-on-year (y-o-y) in February to 36,675 units and a 3% m-o-m
contraction versus sales of 37,801 units in January. This is the fifth consecutive monthly decline. The strong growth in TIV by 12.5% y-o-y to 548,115 units in 2008 is unlikely to be sustained this year as consumers are likely to defer consumption. The Malaysian Automobile Association (MAA) forecasts a 12% decline in TIV to 480,000 units this year but predicts a rebound in sales to 490,000 units in 2010 followed by a sustained upward trend to 556,500 units in 2013. Nevertheless, falling loan approvals and smaller financing margins remain the main concerns under the
current economic climate. Auto loan approvals from major banks have contracted 22.88% q-o-q in 4Q2008 and seem to be on a downtrend since peaking in 2Q2008. In a bid to lend a boost to the second biggest sector in the economy, the government has set aside an additional RM200 million to the Automotive Development Fund and are offering RM5,000 as trade-in for cars at least 10 years old of any model upon purchase of new Proton or Perodua cars, under the second stimulus package. There are an estimated 4.8 million cars on the road that are eligible for the incentive. The passenger vehicle market and commercial vehicle market accounts for 91% and 9% of the total
industry respectively as at 2008. The two national car manufacturers, Perodua and Proton have a total market share of 55%, while foreign car manufacturers, Toyota and Honda account for 25% of the local market. Aside from passenger vehicles, demand for commercial vehicles is expected to weaken further as the transport-related industries refrain from major capital spending amid the current downturn. CHINA AUTOMOTIVE INDUSTRY OUTLOOK Amid the challenging global automotive environment that has led to the recent collapse of Chrysler and General Motor, the Chinese is seeking to acquire ailing car manufacturers to expand their market share. For the first half of 2009, China achieved total vehicle sales of 6.1 million, up 17.7% from previous year3, surpasses that of the US’s 4.8 million vehicle sales. The Chinese government’s stimulus plan of four trillion yuan (US$585 billion) to jump start the economy coupled with its favourable automotive stimulus policies, particularly the 50% purchase tax cut on engine replacement car of under 1.6 litres has boost the passenger vehicle sales by 15% or 3,000,580 units in the first five months of 2009. Also, the government is cultivating local research and development by encouraging production and use of environmental friendly vehicles through subsidy distributions. China’s overall resilient economic foundation and efficient government policies help to drive auto revenues, going forward.
3 www.dailyfinance.com

MARC Analysis Sime Darby Berhad
12
BUSINESS RISK ANALYSIS
Exhibit 28 of Appendix II and Exhibit 8 below summarise Sime Darby’s motor vehicle main subsidiaries and contribution by geographic segments. Exhibit 8: Motor Division Revenue Breakdown by Geographic Segment
9MFY2009 FY2008 FY2007 FY2006 RM Millions
Malaysia 863.2 1,580 1,461 1,864.7 Hong Kong and PRC 2,170.7 2,251 1,727 2,386.2 Singapore 1,106.7 1,473 1,288 1,552.7
Australia 416.6 766 756 656.5 New Zealand 663.8 1,453 1,391 1,423.4 Thailand 175.8 248 232 254.4 Others4 110.6 155 162 149.8 Total 5,507.4 7,926 7,017 8,287.7
Source: Sime Darby’s management
Motor Division – Sales Volume by Geographic Segment 9MFY2009 FY2008 FY2007 FY2006
Units Sold Malaysia 6,939 15,695 14,673 19,236 Hong Kong and PRC 8,931 13,578 9,549 10,042 Singapore 5,359 8,139 7,606 5,938 Australia 4,836 8,059 8,649 7,114 New Zealand 5,567 9,530 9,683 5,397 Thailand 1,641 2,447 2,708 3,145 Total 33,273 57,448 52,868 50,872
Source: Sime Darby’s management
Financial performance review For 9MFY2009, the division recorded revenue of RM5.3 billion or 23% of the group’s total revenue
(9MFY2008: RM6.0 million). Hong Kong and PRC lead the sales chart of 40% or RM2.2 million followed by Singapore. Malaysian operations however, posted lower revenue of RM863.2 million than the corresponding period against a backdrop of a more subdued economy. Malaysian Division
Summary of major contributions by Malaysian operations: Exhibit 9: Major Contributors - Malaysian Operations
Revenue (RM million) Company
Business 9MFY2009 FY2008 FY2007 FY2006
Hyundai- Sime Darby Motors Sdn Bhd
Sales and distribution of passenger and light commercial vehicles through a network of 60 showrooms and 45 workshops, provision of back-up service and spare parts for its product range
178.5 496.7 473.6 765.8
Sime Darby Auto ConneXion (M) Sdn Bhd
Dealer for Hyundai, Land Rover, Alfa Romeo and distribution of Ford motor vehicles and spare parts, retails of motor vehicles and spare parts, and provision of after sales services
138.5 168.3 184.3 229.9
Land Rover Malaysia Import and distribution of Land Rover vehicles and spare parts
30.8 70.4 88.9 76.1
4 Prior to FY2006, car rental was classified under General Trading, Services & Others division (now known as Healthcare & Others). Subsequently, it was reclassified under Group Motor division from FY2006 onwards.

MARC Analysis Sime Darby Berhad
13
Hyundai Division Hyundai-Sime Darby Motors Sdn Bhd is the sole distributor of completely built-up (CBU) Hyundai vehicles. The group also holds the rights to assemble and distribute Hyundai medium commercial vehicles. Hyundai’s best seller is Getz 1.4 litres which accounts for 26.4% of total units sold in FY2008. The group’s assembly plant through Inokom Corporation Sdn Bhd (Inokom), has increased its capacity by 25% to 30,000 units per annum from 24,000 units in FY2008 following a rationalisation plan. Both its BMW and Land Rover vehicle assembling has been transferred to Inokom which has enabled optimum utilisation of the plant’s operating capacity in the wake of weaker demand for Hyundai. Recently, Inokom
has secured a RM2.0 million contract assembly for completely knock-down (CKD) trucks from Quasar Industrial Vehicle Sdn Bhd. Auto Bavaria Division (ABD)
Incorporated in August 2003, BMW Malaysia Sdn Bhd is a 51:49 joint-venture between BMW Holdings BV, a subsidiary of Bayerische Motoren Werke Aktiengesellschaft (BMW AG), and Auto Bavaria Sdn Bhd
(ABSB), a wholly-owned subsidiary of Sime Darby Motors Sdn Bhd. ABD Malaysia markets BMW, which represents about 70% of premium segment total sales in the Klang Valley, and MINI and provides comprehensive retail and after-sales services through a network of nine outlets in Malaysia. The number of new vehicle sales trended down by 15% to 807 units in the first three months ended March 31, 2009, compared to the same period in 2008. The premium car segment is marginally affected by the slowdown in global demand. Under the ABD’s used vehicle segment, sales performance dropped marginally by 6%, however it’s newly launched programme, BMW Premium Selection (BPS) unit which
adhers to a set of stringent criteria is projected to capture a larger market share in the secondary segment. China Operations and Hong Kong SAR
Summary of contributions by Hong Kong and PRC regions:
Exhibit 10: Breakdown of Units Sold and Revenue for the Hong Kong and PRC Regions 9MFY2009 FY2008 FY2007 FY2006
Units HKD mil Units HKD mil Units HKD mil Units HKD mil Hong Kong Region
New Vehicles 3,722 1,195.8 6,938 2,118.2 5,600 1,514.8 5,626 1,663.3
Parts & Services* 426.9 563.3 521.6 - 508.3 PRC Region New Vehicles 4,503 2,791.2 5,616 3,389.7 2,281 1,151.5 4,416 2,483.3 Parts & Services 255.0 267.5 195.3 - 95.4 Total HK and PRC 8,225 4,668.9 12,554 6,338.7 7,881 3,383.2 10,042 4,750.3 Used Cars 691 163.0 996 198.4 1,668 395.1 1,355 236.3 Motorbikes 15 1.4 28 3.3 27 3.4 34 3.9 TOTAL 8,931 4,833.3 13,578 6,540.4 9,576 3,781.7 11,431 4,990.5
* Include Insurance
Stable contribution year-on-year
Hong Kong and mainland China’s revenue stood at HK$4.8 billion for 9MFY2009, with a total sales volume of 8,931 units (FY2008: 13,578 units). The management projected the sales in the mainland to increase by 12% in FY2009, concentrating sales volume at the lower-end segment, aided by incentives given by the Chinese government. The group has venture into an electric vehicle project in collaboration with the Hong Kong government, which involves a feasibility trial on the Mitsubishi i-MiEV. The group is also in the process of evaluating the use of commercial electric vehicle. The group’s business in Hong Kong SAR and the PRC is mainly represented by companies listed in Exhibit 29 of Appendix II.

MARC Analysis Sime Darby Berhad
14
4. INDUSTRIAL DIVISION
INDUSTRIAL/HEAVY EQUIPMENT INDUSTRY OUTLOOK
Australia, where the Sime Darby group has significant operations in this division, has been relatively less severely affected by the global economic slowdown. Nevertheless, the near- to medium-term growth in this division is unlikely to match the double-digit pace in recent years.
Australia and Asia Pacific Operations
Australia’s Queensland state, which is the driver of demand for heavy equipment, saw production of minerals decline by 14% in 1Q2009 compared from the previous quarter. Of this, 76% of this decline is attributed to the decline in coal sales5. In addition, earnings will likely remain weak consonant with the forecast 34.2% and 10.9% decline in energy and mineral exports respectively in 2009-2010 compared to the 2008-2009 period6. China remains the largest importer of Australia’s minerals and energy which benefited from a significant
surge in China’s demand for commodity imports in 1H2009. However, this drastic surge is largely due to stockpiling by China, particularly in the state reserve bureaus and government rather than a significant increase in underlying demand for domestic consumption purposes and exports. Thus, even though short-term prospects might seem to be improving, the sustainability of China’s imports for minerals and energy will inevitably be dependent on the recovery of the global economy. MARC views the outlook for the base-metals, mining and steel industries in Asia Pacific over the next 12 to 18 months to be negative.
Malaysia
The three main industries supporting demand for heavy equipment are oil, gas and marine; forestry and agriculture; and building construction. Dominated by several franchise holders namely Sime Darby’s 100%-owned, Sime Darby Industrial Sdn Bhd (formerly known as Tractors Malaysia (1982) Sdn Bhd) (SDI), Tan Chong Group, and Oriental Hitachi, the heavy equipment sector is characterized by strong brand name, huge capital requirement and a strong distribution network (for both parts and services). Given the weakened economic conditions, government initiatives such as the RM67 billion stimulus package will continue to be the main driver of these underlying industries and thus the demand for machine and equipment sales. Singapore
Sales of machinery and equipment in Singapore are mainly supported by its marine, oil and gas and construction industries. Although a turnaround as reflected by the 20.9% growth in 2Q2009 (1Q2009: -12.7%) has emerged, Singapore’s economy has been forecast to contract between 4% and 6% in 2009. Under the S$20.5 billion Resiliency Package announced on January 22, 2009, the government has increased public construction spending to between S$18 billion and S$20 billion in 2009 from S$15 billion and S$6 billion contracted in 2008 and 2007 respectively. Despite the government incentive, contractors will likely remain cautious in the near-term as take-off of the projects may be slow.
5 State of the sector (June Quarter 2009), Queensland Resources Council 6 Australia’s Exports Fact Sheet, Australian Government

MARC Analysis Sime Darby Berhad
15
BUSINESS RISK ANALYSIS
Overview
Australia is the largest contributor for the industrial and heavy equipment sector, accounting for 54% of revenue in 3QFY2009. Other countries supporting revenue are Singapore, Malaysia and China, each accounting for 14%, 13% and 12% of revenue respectively for 3QFY2009.
Australia and Asia Pacific Operations
Despite the challenging economic conditions, Sime Darby group’s exclusive distributor of Caterpillar (in Queensland and Northern Territory) to the mining industry, the Hastings Deering Group of Companies (HDAL) recorded higher sales and better margins for 9MFY2009 owing to sharp rebound in the first quarter of the year. Malaysia Operations
SDI is the sole domestic dealer of Caterpillar for which it has built a reputation for delivering quality service and providing support facilities to the region through its fully integrated computerized parts inventory system. In addition, it also manufactures and assembles certain heavy equipment components for Caterpillar Terberg Tractors Malaysia Sdn Bhd (Terberg Tractors), a joint-venture with Terberg Benschop B.V. (Terberg) and SDI. Terberg Tractors has the sole and exclusive right to manufacture, market, distribute, sell and service Terberg terminal tractors for 42 countries in the Asia Pacific region. As part of the technical co-operation, Terberg has transferred its research and development as well as expertise in manufacturing terminal tractors, while SDI acts as the regional marketing and manufacturing
base. Total revenue in 9MFY2009 for SDI operations rose by 4.37% to RM771.8 million (9MFY2008: RM739.5 million), compared to the previous corresponding period, mainly from sales to oil, gas and marine industry (33%), and agriculture (38%). Pre-tax profits increased by 2.3% to record RM53.3 million in 9MFY2008. The breakdown of revenue by sectors is shown in Exhibit 34 of Appendix II. However, demand for heavy equipment from the construction and mining industry declined by 5%, accounting for 15% of 9MFY2009 revenue. Singapore Operations
The heavy equipment division is undertaken by wholly-owned subsidiary, Tractors Singapore Pte Ltd. (TSL), which supplies mainly to the marine/petroleum industries (for engine generators) followed by the construction industry. In view of the current recession, shipyards have held off ordering new engines while the company has received order cancellations from the marine and petroleum industries in 6MFY2009 and 9MFY2009. Notwithstanding these, total revenue recorded by TSL for 9MFY2009 was S$336.4 million against S$283.5 million for the same period last year with the marine and oil and gas sectors accounting for more than 70% of revenue. For full year, TSL’s financial performance is expected to be strong on the back of its long order book. Hong Kong and Greater China Operations
The heavy equipment business in China is undertaken by its wholly-owned subsidiary, China Engineers Limited (CEL), the exclusive distributor of Caterpillar products in Hong Kong, Macau and seven provinces in China. CEL which services the construction and power industries in Hong Kong and China is also a major supplier of Caterpillar Shipbuilding Generator Sets for the building services sector in China. The group has acquired Elco Power Systems Limited (Elco), the exclusive dealer of Perkins engines in China,
MARC Analysis Sime Darby Berhad
16
Hong Kong and Macau, will provide more options for its customers namely in the infrastructure industry, copper and non-ferrous metal mining sector and shipyard industry.
CEL’s group revenue grew by 33.3% for 9MFY2009 compared to the previous corresponding period due to better reception of the new rental sales model. However, profit before tax declined by 62.7% due to higher funding cost for the increase in inventory holding at the beginning of 2009 which is expected to return to normal by December 31, 2009.
5. ENERGY AND UTILITIES DIVISION
ENERGY
Oilfield Support Services Sector
MARC attaches a mixed outlook on its rated oilfield service providers, underpinned by signs of slower-than-expected replenishment of order book and growing pressures by some oil majors to drive down costs and improve efficiency on the back of volatile oil price. As a result, oil majors are delaying capital expenditure plans in more costly oilfields that would have a negative impact on worldwide oilfield support service providers, especially those involved in the crowded and lower range products.
The recovery in demand would hinge largely on the speed of economic recovery in US, as well as
sustained economic growth of key growing economies namely, China and India. Moderating the uncertainty surrounding the worldwide demand outlook for the local support companies would be Petronas’ expected increase in capital expenditure in 2009 for exploration and development by 10-20% against 2008 of RM37.6 billion. Overview
The energy division comprises oil and gas, engineering services and power divisions while its utilities division ventured into infrastructure related projects. For 9MFY2009, the energy and utilities division was ranked fourth in terms of revenue and profit contribution to the group by reporting RM2.3 billion and RM83.8 million, respectively.
Oil and gas business unit Its wholly-owned subsidiary, Sime Darby Engineering Sdn Bhd (SDE) with a fully integrated 128-acre fabrication yard with an annual capacity of 55,000 MT in Pasir Gudang, Johor provides engineering, procurement, installation and commissioning (EPIC) service for both major local and international oil and gas players. Its oil and gas unit remains the major contributor for energy and utilities division with a 79.5% of total revenue of RM254 million for three months ended March 31, 2009, and as of the date, its order book value stood at RM1.1 billion, supported by Kumang project (awarded by Petronas Carigali Sdn Bhd in October 2008) and outstanding Maersk Oil Qatar project. Currently, the unit is in the process of tendering contracts worth about US$1 billion, primarily in Middle East and Asia Pacific countries. Latest Development On August 3, 2009, Sime Darby announced the takeover Ramunia Holdings Berhad (Ramunia) assets for a purchase consideration of RM560 million in cash. The proposed acquisition will put SDE as the largest fabricator in Malaysia in terms of yard size which will increase to 284 acres from 128 acres, and capacity increase to 105,000 MT from 55,000 MT. This will in turn, enhance its competitive position in bidding for local and international contracts and enable it to undertake deep water fabrication structures.
MARC Analysis Sime Darby Berhad
17
Power business unit
Sime’s power plants, located in Malaysia and Thailand, has a combined annual power capacity of 600MW. Its power plant in Malaysia is located in Port Dickson, Negeri Sembilan undertaken by Port Dickson Power Berhad (PD Power) which generates 440MW per annum.
Malaysian unit The PD Power plant supplies its electrical energy to Tenaga Nasional Berhad (TNB) under a 21-year Power Purchase Agreement (PPA), expiring in January 2016. Correspondingly, Petronas Gas supplied gas
for the plant under the same period and any volatility in gas prices are passed through to TNB. The operation and maintenance of the PD Power plant is managed by JanaUrus PDP Sdn Bhd, a wholly-owned subsidiary of Sime Darby. On March 1, 2009, the operation and maintenance of the plant was transferred to Sime Darby O&M, a division of Sime Darby Energy Sdn. Bhd. Thailand unit
Its two plants are owned by Laem Chabang Power Co Ltd (LCP) and Sime LCP Power Company Limited (SLP). The LCP power plant operates under the programme recommended by the Thai’s government for the use of cogeneration power, with 60% of its power output sold to Electricity General Authority of Thailand (EGAT), Thailand’s national utility company under a 21-year PPA expiring on July 16, 2022. The remaining power outputs and its entire steam production are channeled to industrial usage within the Laem Chabang Industrial Estates. Gas for the LCP power plant is supplied by Petroleum Authority of Thailand, and any increases in gas prices are passed through to EGAT. The economic downturn has impacted the overall demand of LCP power plant with gross output reduced 640.7 Gigawatt hour (GWh)
in FY2008 (FY2007: 697.8 GWh). SLP, a wholly-owned subsidiary of Sime Darby, supplies electricity and steam to industrial customers within the Laem Chabang Industrial Estates. The operation and maintenance for both LCP and SLP are managed by Sime O&M (Thailand) Co. Ltd., a subsidiary of Sime Darby Energy Sdn Bhd. Going forward, the group is looking into greenfield project and renewable energy in other countries. The power plants performance indexes as of March 31, 2009 are detailed in Exhibit 35 of Appendix II.
UTILITIES
China market dominates utilities businesses
Sime Darby Utilities division continues to maintain a significant presence in China through its investments in Weifang Port located on the south coast of Bohai Sea in Shandong province and a 50-year water supply concession to Shandong province industrial zones, expiring in July 2050. Lower activities in Weifang port As of March 31, Weifang port’s 2009 year-to-date total handled cargo increased by 2.3% to 7 million tonnes, meanwhile vessel calls decreased by 7.7% to 1,990 vessel calls. The earlier strong performance and higher number of shippers with larger vessel size has causes an increase in throughput despite lesser vessel call. Weifang port is presently undergoing three times 10,000 tonne berth expansion (RMB1.2 billion) which is expected to complete by end-2009. As of June 30, 2009, the overall expansion progress stood at 70%. Its Weifang water performance follow suit with actual water consumption for March 2009 declined to 56,573 m3 from 77,030 m3 in June 2008, affected by lower consumption by most industrial user. Nonetheless, the group is in the process of commissioning second water treatment plant with expected daily capacity of 140,000 m3 from its current capacity of 80,000 m3. The division continues to seek new

MARC Analysis Sime Darby Berhad
18
business opportunities and undertake expansion plans at Shandong province, its strongest market base. In Malaysia, Sime Darby Water Resources Sdn Bhd was set up to undertake development of groundwater locally. 6. HEALTHCARE AND OTHERS
This division is formerly known as General Trading, Services and Others. The healthcare segment contributes the bulk of the division’s revenue of RM193.2 million in 9MFY2009 (9MFY2008: RM174.1million), followed by travel of RM131.0 million (9MFY2008: RM137.2 million) and bedding
segment of RM116.3 million (9MFY2008: 137.4 million). Healthcare’s stable performance is mainly attributed to client loyalty coupled with its ongoing investments in latest medical technology to maintain its position as one of the leading healthcare provider in the country. The group has divested its Sime Darby Travel Sdn Bhd, its travel segment on May 13, 2009. This division contributed 2% or RM523.9 million to the group’s total revenue in 9MFY2009.
RISKS AND CHALLENGES
Managing execution and synergies risk
Among the many challenges facing Sime Darby post-meger, managing execution risk is critical to derive
synergies from the enlarged entity and to avoid diseconomies of scale. This is more important in its plantation division, where prior to the merger Golden Hope and Guthrie have had strong track record with fairly entrenched work processes which has to be synchronized throughout the division to maximize yields and improve cost efficiency. (Sime Darby has drawn up a road map for the transformation process as shown in Appendix IV.) The key risks are set below: Plantation Division
Price fluctuation/volatility of palm oil products Palm oil product prices vary on a daily basis due to the supply and demand conditions in the world oils and fats markets as well as the vagaries of weather. To mitigate default risk, the group adopts a minimal forward sales strategy, with the bulk of transactions currently dealt through letters of credit. Average cost of production As of March 31, 2009, total cost of production for estates and mills increased by 38.5% to RM997 per MT (9MFY2008: RM720 per MT) due to increase in fertiliser cost and transportation costs as a result of high crude oil prices during the period. The bulk of estate operation costs is for fertiliser purchase which is derived from crude oil. Nevertheless, MARC notes that the fertiliser prices have come down to about 12% since early 2009 which has lowered the average cost of production to around RM1,000 per tonne. In fact, in the first half of 2009, the average cost of production among local palm oil companies seemed stable at RM1,100 to RM1,200 per tonne7 for efficient planters. Further, to mitigate cost issues, the group is venturing into providing organic fertilisers as well as reducing diesel usage by generating electricity through biogas and biomass, going forward. These measures would enable the group to maintain strong profit margins. Uncontrollable risk inherent in oil palm Oil palm trees are subjected to physiological stress on a cyclical basis stemming from age and tree condition, environment, weather and pest attacks. A combination of these factors could adversely affect
7 “Fertiliser prices have fallen 12%”, The Star, dated July 3, 2009

MARC Analysis Sime Darby Berhad
19
the operations, production and yield of the plantation division. As FFB yields decline with a palm tree’s age, a continuous monitor of the maturity profile of the oil palm tree would enable the division to mitigate this risk. In addition, several measures such as integrated pest management systems are in placed to minimise the susceptibility of oil palm to pests, diseases or plants pathogens. Heavy reliance on palm oil The plantation division is exposed to monoculture risk. With 82% of its land planted with oil palms tree, any adverse developments such as a switch in consumer demand or development of a better substitute would impact its viability. However, MARC views the above risk as minimal.
Property Division
Property industry is highly susceptibility to economic slowdown The weak property market sentiment arising from the challenging economic conditions has impacted many developers who have delayed the launching of new offerings and are offering 10%-20% discounts
and other incentives to attract buyers. As a result, not only the near-term earnings and profitability margins are likely to be affected but this also cannot be used as a long-term strategy to sustain demand. Singapore’s high-end property market is showing some signs of recovery, after the steep declines in rental and value which reached a low of around S$2000psf in prime areas during the crisis, compared to pre-crisis levels of S$5000psf. While the property market has also seen a similar pick-up in China, MARC notes that there is heightened risk of an impending property market bubble given their drastic surge in bank lending of 7.36 trillion yuan in 1H2009.
Fairly strong brand name With a 40-year combined experience in the property industry, SDPB has established a strong reputation for quality development, incorporating attractive features that buyers seek in its projects. Among the top five property developers in Malaysia in terms of sales and the largest in terms of landbank, its major property development projects such as Bukit Jelutong, Putra Heights and Ara Damansara are being well-received, as evidenced by an average take-up rate of 90%. Construction Risk There have been no major complaints on SDPB’s ability to complete projects on time. Construction is fully sub-contracted which provides protection from raw material prices hike and compensation claims arising from delays in project completion. The current panel of sub-contractors and suppliers has proven to be reliable, with strong reputation within the industry. Furthermore, any price hike is mitigated by entering into fixed-price supply contracts with suppliers with whom the group has been able to negotiate better rates owing to its strong financial position. Motor Division
Regulatory risk
Should the Malaysian government phase-out the Approved Permits (AP) policy which has enabled AP holders to import luxury cars, the group’s financial wherewithal and relatively large network of branches would enable it to withstand the competition. In China, government policy of supporting low-emission and fuel-efficient cars as well as a 50% sales tax reduction for engine replacement of cars having engine capacity of under 1.6 litres have helped to sustain the Sime Darby’s competitive position in the country.

MARC Analysis Sime Darby Berhad
20
Sustaining market position As a longstanding holder of premium brands franchises with entrenched market position and with ongoing investments in multi-franchising networks and expansion of existing one-stop service centres, the division would be able to sustain its current market position. In addition, government incentives domestically as well as in China will aid the automotive sector to recover from the downturn. Industrial Division
Dependence on cyclical industries Given the demand for heavy equipment is highly correlated to the economic growth, sales in the division is expected to recover in line with economic recovery. However, the diversity of these industries which the division serves is viewed positively in the long-run as it provides some insulation from industry-specific risk. Ability to retain the distribution rights
Of all the equipment distributed by this division, Caterpillar heavy equipment forms the backbone of its Industrial division. According to the distribution agreement, Caterpillar has the right to terminate the distributorship at their prerogative by giving a 90-day notice period. Nonetheless, MARC takes comfort from the fact Sime Darby has been the distributor for Caterpillar since 1929. Competitive position The group’s major competitor in the heavy equipment industry is UMW group which supplies the Komatsu range for the domestic market. The operating margin of Sime Darby’s Industrial division was at 9.5% and UMW at 10.2% in FY2008. Approval Permits (AP) Importing heavy equipment into Malaysia continues to be hampered by several factors among which are the requirement of Approval Permits8(AP), import licenses for heavy equipment used in the construction sector, import duties ranging from 5% to 20% and sales tax for selected models. However, the removal of the APs for 29 tariff lines effective January 1, 2008 and another 6 lines effective January 2009, has provided the group with some leeway to import heavy equipment. MARC notes that duty on new equipment imported from Indonesia and Thailand is exempted or reduced via Common Effective Preferential Tariff (CEPT) and from Japan by Malaysia Japan Economic Partnership Agreement (MJEPA) arrangement. Energy and Utilities Division
Oil price volatility affects demand Although oil prices have improved in tandem with positive signs for the global economy, global oil exploration and development spending continues to remain lackluster, thereby affecting oilfield service providers, particularly involved in fabrication. Notwithstanding this, Sime Darby’s sizeable current order book value of RM1.1 billion (as of March 31, 2009) as well as significant value of future tender projects will provide sufficient buffer in the near term.
8 MARC notes that thus far, there has been no problem in obtaining APs
MARC Analysis Sime Darby Berhad
21
For its power division, the volatility in fuel costs and the current weak market may affect its performance, specifically the LCP power plant, as 40% of its power output and the entire steam production is sold to industrial customers, all of whom are vulnerable to the current downturn.
ISSUE STRUCTURE RISK ANALYSIS
Refinancing/Liquidity Risk
Refinancing risk is inherent due to the bullet repayment structure of the facilities. Sime Darby’s
immediate liquidity position is adequate in relation to its near-term debt maturities and short-term borrowings. Further, given its strong balance sheet, adequate financial flexibility and sizeable unencumbered assets, the group should be able to meet its immediate debt service requirements. Interest Rate Risk
The short-term nature of the ICPs exposes the company to fluctuations in finance cost over the tenure of
the programme. Nevertheless, with the Overnight Policy Rate (OPR) at a low 2.00%, the company’s exposure on potential high repricing risk in the near- to intermediate-term is minimised.
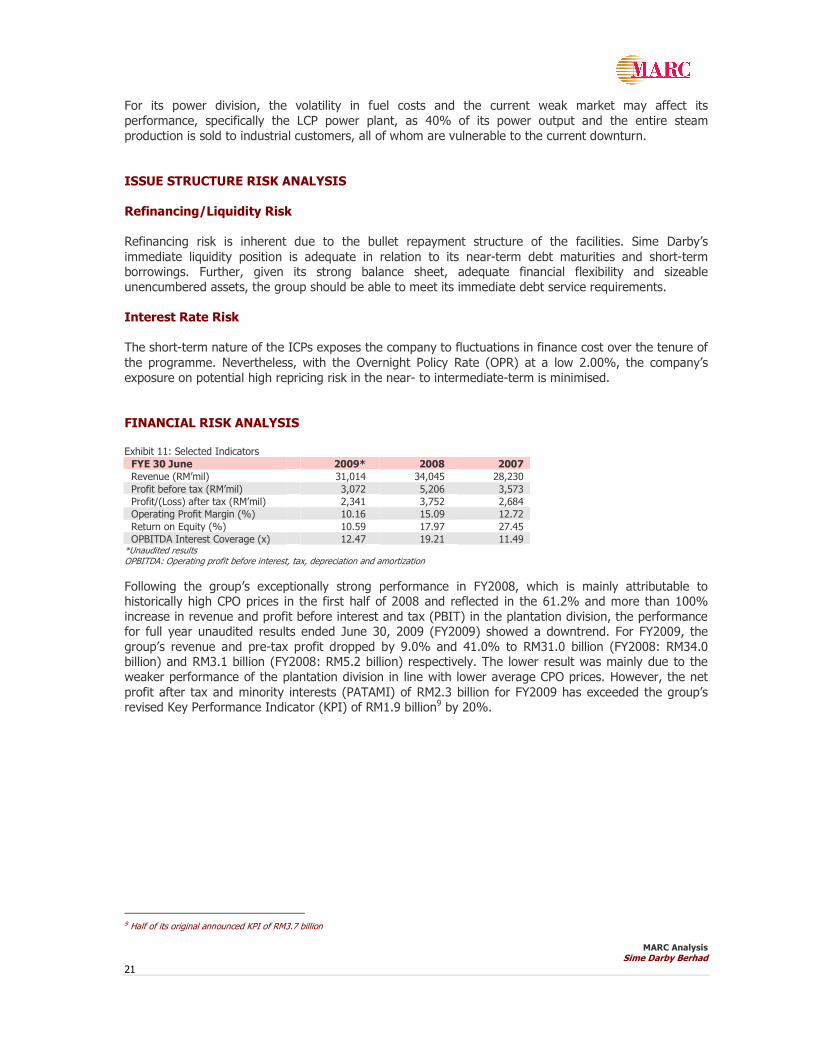
FINANCIAL RISK ANALYSIS Exhibit 11: Selected Indicators
FYE 30 June 2009* 2008 2007
Revenue (RM’mil) 31,014 34,045 28,230
Profit before tax (RM’mil) 3,072 5,206 3,573
Profit/(Loss) after tax (RM’mil) 2,341 3,752 2,684
Operating Profit Margin (%) 10.16 15.09 12.72
Return on Equity (%) 10.59 17.97 27.45
OPBITDA Interest Coverage (x) 12.47 19.21 11.49 *Unaudited results OPBITDA: Operating profit before interest, tax, depreciation and amortization
Following the group’s exceptionally strong performance in FY2008, which is mainly attributable to historically high CPO prices in the first half of 2008 and reflected in the 61.2% and more than 100% increase in revenue and profit before interest and tax (PBIT) in the plantation division, the performance for full year unaudited results ended June 30, 2009 (FY2009) showed a downtrend. For FY2009, the group’s revenue and pre-tax profit dropped by 9.0% and 41.0% to RM31.0 billion (FY2008: RM34.0 billion) and RM3.1 billion (FY2008: RM5.2 billion) respectively. The lower result was mainly due to the weaker performance of the plantation division in line with lower average CPO prices. However, the net
profit after tax and minority interests (PATAMI) of RM2.3 billion for FY2009 has exceeded the group’s revised Key Performance Indicator (KPI) of RM1.9 billion9 by 20%.
9 Half of its original announced KPI of RM3.7 billion

MARC Analysis Sime Darby Berhad
22
Exhibit 12: Major Business Segment PBIT Contributors for FY2009 (unaudited) and FY2008
0
500
1,000
1,500
2,000
2,500
3,000
3,500
4,000
Plantation Property Industrial Motors Energy &
Utilities
General trading,
services &
others
Major Business Segment PBIT Contributors
FY2009* (unaudited) FY2008
Exhibit 13: Segment Results for Unaudited FY2009 and FY2008
FY2009* (RM’ million) FY2008 (RM’ million)
Revenue PBIT Revenue PBIT Plantation 10,658 1,719 13,162 3,877 Industrial 7,870 862 7,223 696 Motors 7,510 179 7,926 158
Property 1,408 462 1,420 443 Energy and Utilities 2,939 41 3,165 229 General Trading, Services & Others 629 10 1,149 105
*Unaudited results
Plantation The plantation division’s PBIT dropped significantly by 56% to RM1.7 billion in FY2009 (FY2008: RM3.9 billion) in tandem with lower average CPO prices of RM2,177 per tonne compared to RM2,885 per tonne in the previous fiscal year. In addition, the division had lower FFB yield of 20.6 tonnes per mature
hectare against 21.7 tonnes in the previous year. Industrial The industrial division’s PBIT rose 24% to RM862 million (FY2008: RM696 million) on account of higher sales and better margins generated in Australia as well as higher demand from the marine and oil and gas sectors in Singapore. Despite the economic slowdown, the segment is expected to remain as one of the division major earners with sustained demand for heavy equipment and machineries overseas, albeit
at lower growth levels, going forward. Motor Despite a difficult environment for consumer related businesses, the motor division recorded a 13% increase in PBIT to RM179 million (FY2008: RM158 million) attributed to the better performance from its China operations as well as the dividends of RM50.4 million from BMW Malaysia during the year,
countering the lower profits from other regions amidst overall economic slowdown. The motor division is expected to experience some slowdown in the near- to immediate-term due to the global financial crisis which impact consumers’ spending. However, sustaining market position of its auto luxury segment would in a way moderate the impact. Property The property division’s PBIT increased marginally by 4% to RM462 million (FY2008: RM443 million) arising from the “Parade of Homes” campaign and the gain from disposal of properties of RM89.2 million
MARC Analysis Sime Darby Berhad
23
(FY2008: RM2.7 million). The division’s operating performance is expected to be challenging in the near- to immediate-term in the current weak market conditions.
Energy and Utilities The energy and utilities division recorded a significant drop in PBIT by 82% to RM40.8 million (FY2008: RM228.6 million) mainly attributable to cost escalation incurred on fabrication and engineering projects as a result of higher off-shore costs driven largely by volatile oil prices, apart from the Port Dickson Power Berhad’s one-off contribution for windfall tax. Going forward, this division is expected to remain favourable given the recent proposed acquisition of Ramunia’s assets which will increase the division’s capacity, particularly in the engineering segment. Healthcare and Others The division recorded a significant drop in PBIT by 91% to RM10.0 million (FY2008: RM104.5 million). The poor performance was largely due to the lower gain of RM16.2 million arising from the disposal of non-core businesses as compared to RM76.0 million realised in FY2008. Going forward, as a non-core division with minimal earnings contribution, its healthcare services is viewed to be an area of potential growth and will likely emerge as a core business.
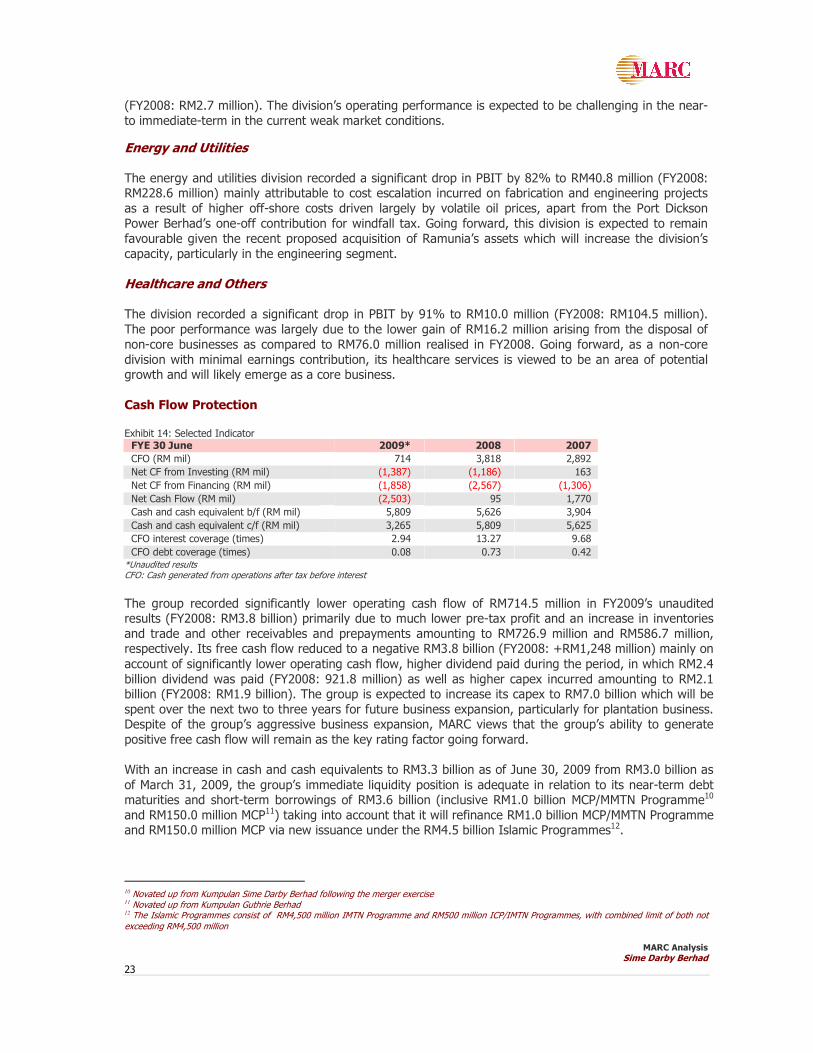
Cash Flow Protection Exhibit 14: Selected Indicator FYE 30 June 2009* 2008 2007
CFO (RM mil) 714 3,818 2,892
Net CF from Investing (RM mil) (1,387) (1,186) 163
Net CF from Financing (RM mil) (1,858) (2,567) (1,306)
Net Cash Flow (RM mil) (2,503) 95 1,770
Cash and cash equivalent b/f (RM mil) 5,809 5,626 3,904
Cash and cash equivalent c/f (RM mil) 3,265 5,809 5,625
CFO interest coverage (times) 2.94 13.27 9.68
CFO debt coverage (times) 0.08 0.73 0.42 *Unaudited results CFO: Cash generated from operations after tax before interest
The group recorded significantly lower operating cash flow of RM714.5 million in FY2009’s unaudited results (FY2008: RM3.8 billion) primarily due to much lower pre-tax profit and an increase in inventories and trade and other receivables and prepayments amounting to RM726.9 million and RM586.7 million, respectively. Its free cash flow reduced to a negative RM3.8 billion (FY2008: +RM1,248 million) mainly on
account of significantly lower operating cash flow, higher dividend paid during the period, in which RM2.4 billion dividend was paid (FY2008: 921.8 million) as well as higher capex incurred amounting to RM2.1 billion (FY2008: RM1.9 billion). The group is expected to increase its capex to RM7.0 billion which will be spent over the next two to three years for future business expansion, particularly for plantation business. Despite of the group’s aggressive business expansion, MARC views that the group’s ability to generate positive free cash flow will remain as the key rating factor going forward. With an increase in cash and cash equivalents to RM3.3 billion as of June 30, 2009 from RM3.0 billion as
of March 31, 2009, the group’s immediate liquidity position is adequate in relation to its near-term debt maturities and short-term borrowings of RM3.6 billion (inclusive RM1.0 billion MCP/MMTN Programme10 and RM150.0 million MCP11) taking into account that it will refinance RM1.0 billion MCP/MMTN Programme and RM150.0 million MCP via new issuance under the RM4.5 billion Islamic Programmes12.
10
Novated up from Kumpulan Sime Darby Berhad following the merger exercise 11
Novated up from Kumpulan Guthrie Berhad 12
The Islamic Programmes consist of RM4,500 million IMTN Programme and RM500 million ICP/IMTN Programmes, with combined limit of both not exceeding RM4,500 million

MARC Analysis Sime Darby Berhad
24
Sensitivity Analysis Snapshot of the cash flow projections of the group from FY2010 to FY2013 are as follows: Exhibit 15: Snapshot of Cash Flow Projections and Projected FSCR Ratio FYE 30 June (RM’ mil) 2010 2011 2012 2013 CF from Operations 4,027 4,050 4,810 4,782
CF from Investing (6,574) (4,079) (3,231) (456) CF from Financing 1,970 (134) (1,386) (2,874) Net Cash Flow (577) (163) 192 1,453 Cash and cash equivalent c/f 2,615 2,452 2,644 4,097 FSCR 4.50 5.46 7.49 5.08
Cashflow Projections The group’s cash flow projections13 were prepared only from FY2010 to FY2013 with the following key assumptions are made:
• CPO price estimated at RM2,000 per MT for Malaysia and RM1,850 per MT for Indonesia; • 8% - 10% y-o-y PBIT growth for plantation division mainly from improvement in efficiency and
new downstream operations; • The outstanding RM1.0 billion MCP/MMTN Programme and RM150 million MCP will be refinanced in
FY2010 from the new issuance under the RM4.5 billion Islamic Programmes, in which the new facility will be drawdown progressively or as needed throughout its tenure;
• No further repayment of the amount issued under the new programme during the first four financial years except for the refinancing amount and other long-term borrowings.
The results of the sensitivity analysis under various scenarios are shown below: Exhibit 16: Results of Sensitivity Analysis
FSCR (x) Scenario Minimum Average
Base Case 5.08 6.01
Case 1: Reduction in PBIT by 30% 1.34 2.81
Case 2: Reduction in PBIT by 50% (1.15) 0.67
Case 3: Redemption of RM1.0 billion in FY2013 and reduction in PBIT by 20% 1.54 3.52
Case 4: CPO prices dropped by RM700/MT per annual 1.25 2.52
Case 5: CPO prices dropped by RM800/MT per annual 0.70 2.03
The group’s cash flow protection measures are fairly strong under the base case scenario since there is no further repayment of borrowings apart from that of Sime Darby’s RM1.0 billion MCP/MMTN Programme and RM150 million which are to be retired in the first year of issuance along with other long-term borrowings. The sensitivity analyses reveal that the cash flow is vulnerable to reduction in CPO prices by RM800/MT per annual14 or more.
Capital Structure/Financial Flexibility Exhibit 17: Selected Indicators
FYE 30 June FY2009* 2008 2007 Debt-to-Equity (x) 0.25 0.22 0.31 Long-Term Debt-to-Equity (x) 0.09 0.14 0.19
Short-Term Debt-to-Equity (x) 0.16 0.07 0.12
Total Liabilities to Total Assets (x) 0.38 0.38 0.41 Equity includes Shareholders’ Funds and Minority Interests *Unaudited results
13 The projected cash flows do not incorporate all the coming acquisitions and future plans 14 Every RM100.00 change in CPO prices will change the PBIT by RM200 million per annual.
MARC Analysis Sime Darby Berhad
25
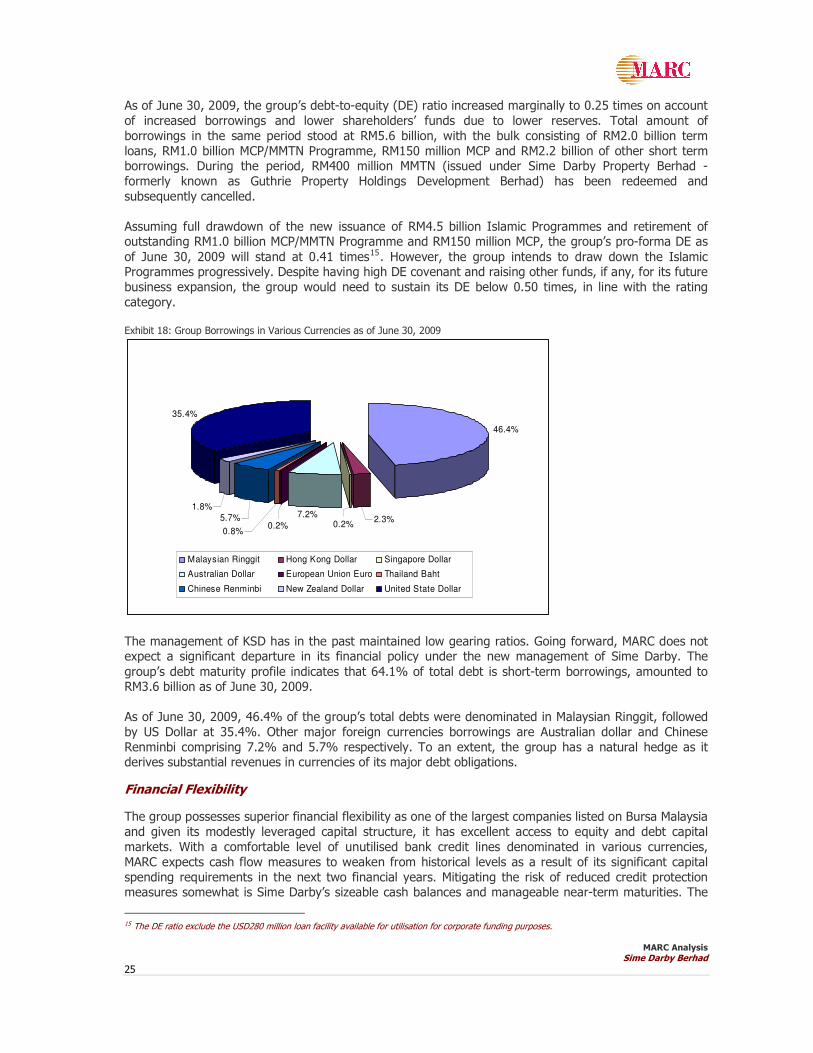
As of June 30, 2009, the group’s debt-to-equity (DE) ratio increased marginally to 0.25 times on account of increased borrowings and lower shareholders’ funds due to lower reserves. Total amount of borrowings in the same period stood at RM5.6 billion, with the bulk consisting of RM2.0 billion term loans, RM1.0 billion MCP/MMTN Programme, RM150 million MCP and RM2.2 billion of other short term borrowings. During the period, RM400 million MMTN (issued under Sime Darby Property Berhad - formerly known as Guthrie Property Holdings Development Berhad) has been redeemed and subsequently cancelled. Assuming full drawdown of the new issuance of RM4.5 billion Islamic Programmes and retirement of outstanding RM1.0 billion MCP/MMTN Programme and RM150 million MCP, the group’s pro-forma DE as
of June 30, 2009 will stand at 0.41 times15. However, the group intends to draw down the Islamic Programmes progressively. Despite having high DE covenant and raising other funds, if any, for its future business expansion, the group would need to sustain its DE below 0.50 times, in line with the rating category. Exhibit 18: Group Borrowings in Various Currencies as of June 30, 2009
46.4%
7.2%
35.4%
1.8%
5.7% 2.3%0.2%
0.8%0.2%
Malaysian Ringgit Hong Kong Dollar Singapore Dollar
Australian Dollar European Union Euro Thailand Baht
Chinese Renminbi New Zealand Dollar United State Dollar
The management of KSD has in the past maintained low gearing ratios. Going forward, MARC does not expect a significant departure in its financial policy under the new management of Sime Darby. The
group’s debt maturity profile indicates that 64.1% of total debt is short-term borrowings, amounted to RM3.6 billion as of June 30, 2009. As of June 30, 2009, 46.4% of the group’s total debts were denominated in Malaysian Ringgit, followed by US Dollar at 35.4%. Other major foreign currencies borrowings are Australian dollar and Chinese Renminbi comprising 7.2% and 5.7% respectively. To an extent, the group has a natural hedge as it derives substantial revenues in currencies of its major debt obligations.
Financial Flexibility
The group possesses superior financial flexibility as one of the largest companies listed on Bursa Malaysia and given its modestly leveraged capital structure, it has excellent access to equity and debt capital markets. With a comfortable level of unutilised bank credit lines denominated in various currencies, MARC expects cash flow measures to weaken from historical levels as a result of its significant capital spending requirements in the next two financial years. Mitigating the risk of reduced credit protection measures somewhat is Sime Darby’s sizeable cash balances and manageable near-term maturities. The
15 The DE ratio exclude the USD280 million loan facility available for utilisation for corporate funding purposes.
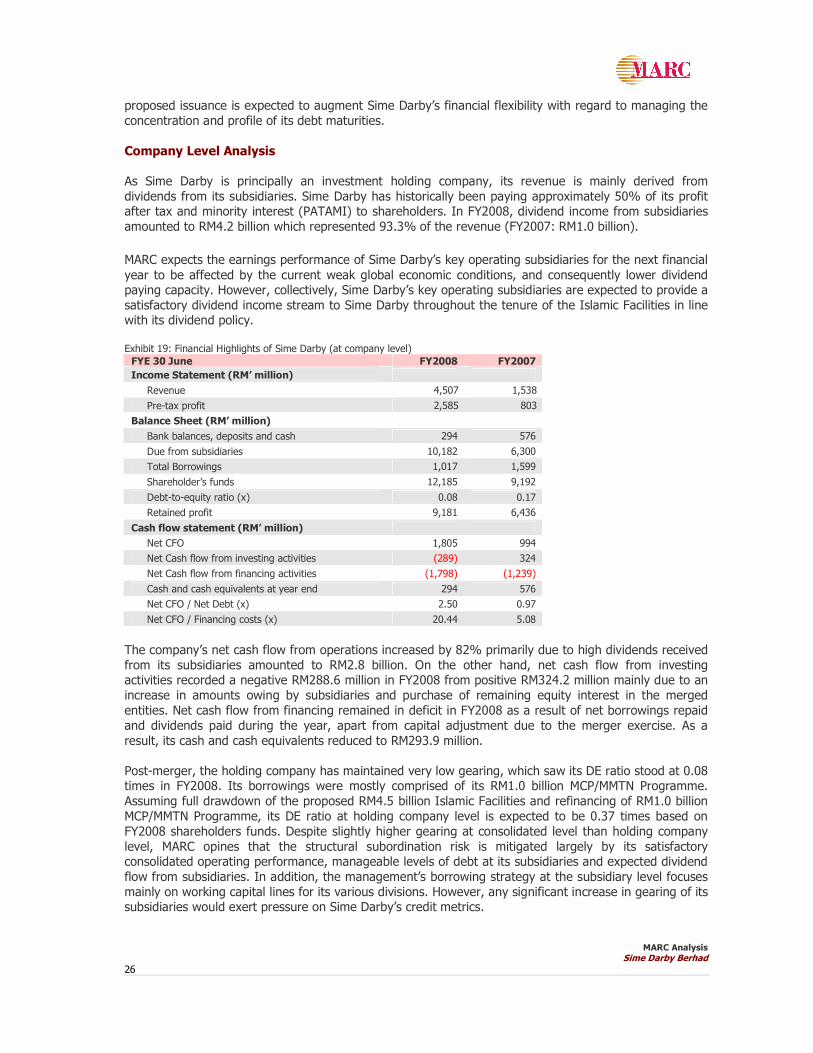
MARC Analysis Sime Darby Berhad
26
proposed issuance is expected to augment Sime Darby’s financial flexibility with regard to managing the concentration and profile of its debt maturities.
Company Level Analysis
As Sime Darby is principally an investment holding company, its revenue is mainly derived from dividends from its subsidiaries. Sime Darby has historically been paying approximately 50% of its profit after tax and minority interest (PATAMI) to shareholders. In FY2008, dividend income from subsidiaries amounted to RM4.2 billion which represented 93.3% of the revenue (FY2007: RM1.0 billion).
MARC expects the earnings performance of Sime Darby’s key operating subsidiaries for the next financial
year to be affected by the current weak global economic conditions, and consequently lower dividend paying capacity. However, collectively, Sime Darby’s key operating subsidiaries are expected to provide a satisfactory dividend income stream to Sime Darby throughout the tenure of the Islamic Facilities in line with its dividend policy. Exhibit 19: Financial Highlights of Sime Darby (at company level)
FYE 30 June FY2008 FY2007
Income Statement (RM’ million)
Revenue 4,507 1,538
Pre-tax profit 2,585 803
Balance Sheet (RM’ million)
Bank balances, deposits and cash 294 576
Due from subsidiaries 10,182 6,300
Total Borrowings 1,017 1,599
Shareholder’s funds 12,185 9,192
Debt-to-equity ratio (x) 0.08 0.17
Retained profit 9,181 6,436
Cash flow statement (RM’ million)
Net CFO 1,805 994
Net Cash flow from investing activities (289) 324
Net Cash flow from financing activities (1,798) (1,239)
Cash and cash equivalents at year end 294 576
Net CFO / Net Debt (x) 2.50 0.97
Net CFO / Financing costs (x) 20.44 5.08
The company’s net cash flow from operations increased by 82% primarily due to high dividends received from its subsidiaries amounted to RM2.8 billion. On the other hand, net cash flow from investing activities recorded a negative RM288.6 million in FY2008 from positive RM324.2 million mainly due to an increase in amounts owing by subsidiaries and purchase of remaining equity interest in the merged entities. Net cash flow from financing remained in deficit in FY2008 as a result of net borrowings repaid and dividends paid during the year, apart from capital adjustment due to the merger exercise. As a result, its cash and cash equivalents reduced to RM293.9 million. Post-merger, the holding company has maintained very low gearing, which saw its DE ratio stood at 0.08 times in FY2008. Its borrowings were mostly comprised of its RM1.0 billion MCP/MMTN Programme. Assuming full drawdown of the proposed RM4.5 billion Islamic Facilities and refinancing of RM1.0 billion MCP/MMTN Programme, its DE ratio at holding company level is expected to be 0.37 times based on FY2008 shareholders funds. Despite slightly higher gearing at consolidated level than holding company level, MARC opines that the structural subordination risk is mitigated largely by its satisfactory consolidated operating performance, manageable levels of debt at its subsidiaries and expected dividend flow from subsidiaries. In addition, the management’s borrowing strategy at the subsidiary level focuses mainly on working capital lines for its various divisions. However, any significant increase in gearing of its subsidiaries would exert pressure on Sime Darby’s credit metrics.

MARC Analysis Sime Darby Berhad
27
MANAGEMENT AND OTHER QUALITATIVE FACTORS
Given that the shareholders of Sime Darby are government-linked entities and the significant importance the conglomerate exerts on the Malaysian economy, its 13-member board consists of prominent personalities who have served with the government in key positions and/or have extensive corporate experiences. The chairman of the board is former Malaysia’s Deputy Prime Minister, Tun Musa bin Hitam while the President and Group Chief Executive is Dato’ Seri Ahmad Zubir bin Haji Murshid. Other board members appointed include those who had held key positions in Guthrie, Kumpulan Sime Darby and Golden Hope. The senior management team is helmed by Dato’ Seri Ahmad Zubir, supported by key personnel from the group’s component companies prior to the merger which, to a large extent provide
operational continuity in order to ensure smooth transition. Sime Darby has embarked on a strategy to divest its non-core businesses/assets in order to utilise resources more efficiently as well as extracting more value with the divestments. The focus of divestments, however, may shift towards streamlining existing core assets. MARC also notes that although the group’s size and diversified business portfolio provide a strong buffer against market fluctuations and unfavourable economic conditions, the group may face several challenges arising from
its enlarged group structure. These could include synchronizing operations and management practice within the enlarged entity to further improve operational efficiency and to derive greater synergy.
MARC Analysis Sime Darby Berhad
28
CORPORATE INFORMATION
BOARD OF DIRECTORS
Independent Non-Executive Chairman Non-Independent Non-Executive Deputy Chairman Independent Non-Executive Director Non-Independent Non-Executive Director Non-Independent Non-Executive Director Independent Non-Executive Director Senior Independent Non-Executive Director Independent Non-Executive Director Non-Independent Non-Executive Director Independent Non-Executive Director Non-Independent Non-Executive Director Non-Independent Non-Executive Director President & Group Chief Executive
Tun Musa bin Hitam Tun Dato’ Seri Ahmad Sarji bin Abdul Hamid Dr Arifin Mohamad Siregar Tan Sri Samsudin Osman Tan Sri Dato’ Dr. Wan Mohd. Zahid bin Mohd. Noordin Tan Sri Datuk Dr. Ahmad Tajuddin bin Ali Raja Dato’ Seri Arshad bin Raja Tun Uda Datuk Seri Panglima Sheng Len Tao Dato’ Sri Mohamed bin Sulaiman Dato’ Henry Sackville Barlow Dato’ Dr. Abdul Halim bin Ismail Datin Paduka Zaitoon Dato’ Othman Dato’ Seri Ahmad Zubir bin Haji Murshid
GROUP SECRETARY Norzilah Megawati Abdul Rahman
SUBSTANTIAL SHAREHOLDERS (as of July 31, 2009)
Amanah Raya Nominees (Tempatan) Sdn Bhd (in trust for Skim Amanah Saham Bumiputera) 36.38% Employees Provident Fund Board 14.62% Permodalan Nasional Berhad 14.92%
MANAGEMENT TEAM
President & Group Chief Executive Dato’ Seri Ahmad Zubir bin Haji Murshid Group Chief Operating Officer Dato’ Abd Wahab Maskan Group Chief Financial Officer Tong Poh Keow
Executive Vice President of the Plantation division Dato’ Azhar bin Abdul Hamid Executive Vice President of the Property division Dato’ Tunku Putra Badlishah Ibni Tunku Annuar
Executive Vice President of the Motors division Dato’ Lawrence Lee
Executive Vice President of the Industrial division Scott William Cameron Executive Vice President of the Energy & Utilities division Dato’ Mohamad Shukri bin Baharom
Executive Vice President - China Operations Dato’ Louis Lu Desheng
Executive Vice President of Group Strategy and Business Development (also responsible for Healthcare business)
Hisham Hamdan
Executive Vice President of Group Corporate Services (also responsible for Commodity Trading & Marketing and Allied Products & Services)
Dato’ Sekhar Krishnan
Executive Vice President of Group Human Resource Tuan Haji Mohamed Ishak Abdul Hamid Senior Vice President/Head of Group Corporate Assurance Nik Muhammad Hanafi Nik Abdullah
HEAD OFFICE SIME DARBY BERHAD
19th Floor, Wisma Sime Darby Jalan Raja Laut, 50350 Kuala Lumpur
CONTACT
Telephone (603) 2691 4122 Facsimile (603) 2382 1075 Home Page www.simedarby.com
LISTING
Main Board of the Bursa Malaysia Securities Berhad
MARC Analysis Sime Darby Berhad
29
Appendix 1
ISSUE STRUCTURE AND TERMS
A summary of the salient terms and conditions of the proposed issuance is set out below:- Facility and Issue Size
(1) RM4,500 million Islamic Medium Term Note Programme (IMTN Programme) (2) RM500 million Islamic Commercial Papers / Islamic Medium Term Note Programme (ICP/IMTN
Programme) Collectively known as “Islamic Programmes”. The combined limit of the Islamic Programmes shall not
exceed RM4,500 million. Tenor of the Facility
(1) 20 years from the date of first issuance which shall be made within two (2) years from the date of approval by the SC
(2) Seven (7) years from the date of first issuance which shall be made within two (2) years from the date of approval by the SC
Syariah Adviser Maybank Islamic Berhad Underwriter(s) and amount underwritten
May be underwritten
Coupon/Profit Rate (%)
IMTN In the case of IMTNs with Periodic Distributions, the rate shall be determined and agreed prior to each issuance of the IMTNs. ICP
The ICPs will be issued without Periodic Distributions.
Security/Collateral None
Sinking Fund
None Details on Utilisation of Proceeds
To finance the group’s working capital requirements and general corporate purposes, and/or to finance future investments and/or capital expenditure and/or, if required, to refinance debt obligations (whether
in whole or in part) of the group. In any case, all utilisation of funds under the Islamic Programmes shall be Syariah compliant. Financial Covenant Throughout the tenure of the Islamic Programmes: Debt to Equity ratio of not more than 1.75:1. This is to be certified by any one of the authorised signatories of the Issuer (as authorized by the board of directors of the Issuer) in relation to the Issuer’s
latest consolidated annual audited financial statements upon request by the Trustee, Facility Agent or Rating Agency.
MARC Analysis Sime Darby Berhad
30
For the purposes of calculating the Debt to Equity ratio, the term “Debt” and “Equity” shall mean as follows:- Debt means, in relation to the Issuer, an amount calculated in accordance with the approved accounting principles, practices and policies in Malaysia, by reference to the Issuer’s latest annual audited financial statements on a consolidated basis equal to the aggregate of: (a) bank overdrafts and any part of any borrowings maturing within 12 months; (b) the principal amount of any bonds or debentures whether issued for cash or for consideration
other than cash;
(c) the liabilities under any liabilities in the nature of borrowings; (d) net exposure under any hedging agreements determined on a market to market basis; (e) all financial guarantees (including standby letters of credit) for borrowed monies; and (f) performance bonds (excluding the performance bonds in relation to the oil and gas, infrastructure,
energy and engineering industries) which have been called.
Equity means the total consolidated shareholders’ funds of the Issuer including subordinated advances/loans from its shareholders, if any. For avoidance of doubt, any double counting will be disregarded.

MARC Analysis Sime Darby Berhad
31
Appendix 2 Exhibit 20: Sime Darby Plantation Sdn Bhd’s Plantation Profile as of March 31, 2009 Malaysia Indonesia Total planted area CROP Ha % Ha % Ha %
Oil Palm
� Immature area 26,739 8.18 25,508 12.54 52,247 9.85
� Mature Area 299,960 91.82 177,980 87.47 477,940 90.15
Total oil palm area 326,699 100 203,488 100 530,187 100
Rubber
� Immature area 1,374 15.86 - - 1,374 15.86
� Mature area 7,289 84.14 - - 7,289 84.14
Total rubber area 8,663 100 - - 8,663 100
Total Planted area 335,362 100 203,488 100 538,850 100
Exhibit 21: Oil Palm Plantation Replanting Programme for FY2009 and budgeted to FY2013 Replanting program FY2009 FY2010 FY2011 FY2012 FY2013
Malaysia Plantation
Oil palm to oil palm (ha) 7,211 11,205 13,521 13,741 13,741
Total immature (including the above) in the replanting process (ha)
28,849 25,566 39,086 38,467 38,467
Indonesia Plantation
Oil palm to oil palm (ha) - - 424 261 261
New planting of oil palm (ha) 14,994 9,457 2,873 371 371
Total immature (including the above) in the replanting process (ha)
33,615 30,598 21,290 15,420 15,420
TOTAL IMMATURE IN THE REPLANTING PROCESS (ha)
62,464 56,164 60,376 53,887 53,887
Exhibit 22: Fresh Fruit Bunches (FFB) production as of March 31, 2009 and 2008
31 March 2009 (9MFY2009) 31 March 2008 (9MFY2008) Crop production Malaysia Indonesia Total Malaysia Indonesia Total Internal FFB Production (in million MT)
5.31 2.08 7.38 5.44 2.49 7.94
External FFB Purchased (in million MT)
0.45 0.38 0.83 0.62 0.41 1.03
FFB Yield per mature hectare
17.60 11.70 15.40 18.00 14.20 16.50
Exhibit 23: Rubber Plantation Replanting Programme for FY2008/09 and budgeted to FY2012/13 Replanting program 2008/09 09/10 10/11 11/12 12/13
Malaysia Plantation
Rubber to oil palm (ha) 309 62 - 91 143
Rubber to rubber (ha) 774 789 524 548 89
Total area (ha) 1,083 851 524 638 232
Indonesia Plantation
Rubber to oil palm (ha) - - - - -
Rubber to rubber (ha) - - - - -
Total area (ha) - - - - -
Exhibit 24: Workforce of Malaysia and Indonesia plantation as of March 31, 2009 and 2008
As at 31 March 2009 Workers Malaysia Indonesia Total
Harvesters (skilled) 13,623 8,438 22,061
Field workers (unskilled) 11,337 9,088 20,425
Mill workers 2,318 4,749 7,067
Total 27,278 22,275 49,553
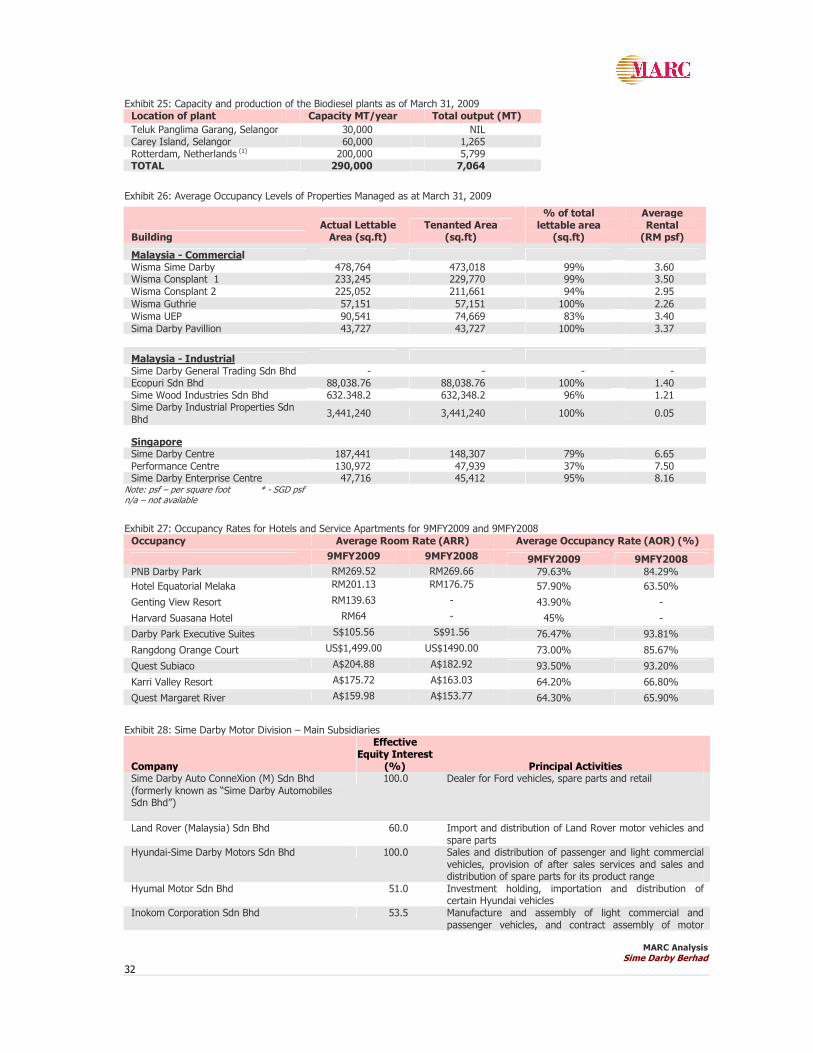
MARC Analysis Sime Darby Berhad
32
Exhibit 25: Capacity and production of the Biodiesel plants as of March 31, 2009 Location of plant Capacity MT/year Total output (MT)
Teluk Panglima Garang, Selangor 30,000 NIL Carey Island, Selangor 60,000 1,265 Rotterdam, Netherlands (1) 200,000 5,799 TOTAL 290,000 7,064
Exhibit 26: Average Occupancy Levels of Properties Managed as at March 31, 2009
Note: psf – per square foot * - SGD psf n/a – not available
Exhibit 27: Occupancy Rates for Hotels and Service Apartments for 9MFY2009 and 9MFY2008
Occupancy Average Room Rate (ARR) Average Occupancy Rate (AOR) (%)
9MFY2009 9MFY2008 9MFY2009 9MFY2008
PNB Darby Park RM269.52 RM269.66 79.63% 84.29%
Hotel Equatorial Melaka RM201.13 RM176.75 57.90% 63.50%
Genting View Resort RM139.63 - 43.90% -
Harvard Suasana Hotel RM64 - 45% -
Darby Park Executive Suites S$105.56 S$91.56 76.47% 93.81%
Rangdong Orange Court US$1,499.00 US$1490.00 73.00% 85.67%
Quest Subiaco A$204.88 A$182.92 93.50% 93.20%
Karri Valley Resort A$175.72 A$163.03 64.20% 66.80%
Quest Margaret River A$159.98 A$153.77 64.30% 65.90%
Exhibit 28: Sime Darby Motor Division – Main Subsidiaries
Company
Effective Equity Interest
(%) Principal Activities Sime Darby Auto ConneXion (M) Sdn Bhd
(formerly known as “Sime Darby Automobiles Sdn Bhd”)
100.0 Dealer for Ford vehicles, spare parts and retail
Land Rover (Malaysia) Sdn Bhd 60.0 Import and distribution of Land Rover motor vehicles and spare parts
Hyundai-Sime Darby Motors Sdn Bhd 100.0 Sales and distribution of passenger and light commercial vehicles, provision of after sales services and sales and distribution of spare parts for its product range
Hyumal Motor Sdn Bhd 51.0 Investment holding, importation and distribution of certain Hyundai vehicles
Inokom Corporation Sdn Bhd 53.5 Manufacture and assembly of light commercial and passenger vehicles, and contract assembly of motor
Building Actual Lettable Area (sq.ft)
Tenanted Area (sq.ft)
% of total lettable area
(sq.ft)
Average Rental (RM psf)
Malaysia - Commercial Wisma Sime Darby 478,764 473,018 99% 3.60 Wisma Consplant 1 233,245 229,770 99% 3.50
Wisma Consplant 2 225,052 211,661 94% 2.95
Wisma Guthrie 57,151 57,151 100% 2.26
Wisma UEP 90,541 74,669 83% 3.40
Sima Darby Pavillion 43,727 43,727 100% 3.37
Malaysia - Industrial
Sime Darby General Trading Sdn Bhd - - - - Ecopuri Sdn Bhd 88,038.76 88,038.76 100% 1.40 Sime Wood Industries Sdn Bhd 632.348.2 632,348.2 96% 1.21 Sime Darby Industrial Properties Sdn
Bhd 3,441,240 3,441,240 100% 0.05
Singapore
Sime Darby Centre 187,441 148,307 79% 6.65
Performance Centre 130,972 47,939 37% 7.50 Sime Darby Enterprise Centre 47,716 45,412 95% 8.16

MARC Analysis Sime Darby Berhad
33
Company
Effective Equity Interest
(%) Principal Activities vehicles
Hyumal Trading Sdn Bhd 51.0 Sales of certain Hyundai and Inokom vehicles and provision of after sales services
Auto Bavaria Division (Division of SD Motor Division Sdn Bhd)
100.0 Retailer of BMW/Mini vehicles and spare parts; service centres
Sime Darby Auto Imports Sdn Bhd 100.0 Importer of BMW, MINI and Ford vehicles Sime Darby Auto Italia Sdn Bhd 100.0 Distribution of Alfa Romeo vehicles, spare parts and
provision of after sales services
Exhibit 29: Major Motor Operations in PRC and Hong Kong as 31 March 2009
Company Principal Activities Principal Place of Business
BMW Concessionaires (HK) Limited Distributor and dealer for BMW & MINI motor vehicles Hong Kong
BMW Concessionaires (Macau) Limited Distributor and dealer for BMW & MINI motor vehicles Macau
Warwick Motors Ltd Distributor and dealer for Land Rover motor vehicles Hong Kong
Goodwood Motors Ltd Distributor and dealer for Rolls Royce motor vehicles Hong Kong
Island Motors Limited Distributor and dealer for Suzuki motor vehicles Hong Kong
Universal Cars Ltd Distributor and dealer for Mitsubishi passenger and commercial vehicles
Hong Kong
Auto France Hong Kong Limited Distributor and dealer Peugeot, Mitsubishi, Ford, Suzuki and Land Rover
Hong Kong
Harper Engineering (Macau) Ltd BMW motor dealership Macau
Shenzhen Bow Chuang Vehicle Trading Company Limited
BMW motor dealership China
Hainan Bao Yue Automobiles Trading Co
Ltd BMW motor dealership China
Shantou Bow Yue Vehicle Trading Co Ltd BMW motor dealership China
Yunnan Bow Yue Vehicle Trading Co Ltd Rolls Royce and Lamborghini motor dealership China Shanghai Sime Darby Motor Commerce Co. Ltd.
BMW motor dealership China
Guangzhou Bow Yue Vehicle Trading Co.
Ltd BMW motor dealership China
Chengdu Bow Yue Vehicle Co. Ltd Distributor and dealer for BMW & MINI motor vehicles China
Exhibit 30: Companies Under the Food-Based Refineries Company name Location Activities Targeted markets Unimills B.V. Netherlands Oil and fats blend manufacturers Europe, North Africa, and the
Middle East Golden Jomalina Food Industries
Sdn Bhd
Malaysia � Complete range of semi-refined and fully refined palm oil products
� Produces consumer products, ranging from vegetable ghee, shortening and dough fat to industrial margarine and cooking oil
Austral Edible Oil Sdn Bhd
Malaysia Operates a refinery and a palm kernel crushing plant in Bintulu, Sarawak
China, the Middle East and India
Kempas Edible Oil Sdn Bhd
Malaysia Manufacturers of palm oil-based vegetable oil and specialty fats in Pasir Gudang, Johor
Thailand, Europe, Japan Middle East, Russia, Ukraine, Mauritius and Algeria, where 90% its
produce is exported
Sime Darby Edible Products Limited
Singapore Manufactures and markets all types of oils, namely sunflower oil, soya bean oil, ground nut oil, canola oil and dairy products
About 85% of products exported to Middle east, African countries and other countries in Asia and
remaining 15% sold in domestic market
Morakot Industries Public Company Limited
Thailand Refiner and manufacturer of cooking oil under ‘Morakot’ brand
20% of products exported to China, Cambodia, Laos, Vietnam and Myanmar while the remaining 80% sold in domestic market

MARC Analysis Sime Darby Berhad
34
Golden Hope Nhabe Edible Oils Ltd
Ho Chi Minh City
� Consumer packed cooking oils under the “Marvela” brand
� sells shortening and dough fat to industrial customers
80% sold in domestic market while the rest export to Cambodia and Laos
Hudson and Knight (Proprietary) Limited
South Africa � Operates a refinery and bakery fats business
� Produces and sells cooking fats and frying oil through the “Holsum” and “Crispa” brand
Almost entire products sold domestic, South Africa
Exhibit 31: Selected Indicators
RM million Australia PNG* SI* Caltrac 9MFY2009 9MFY2008 9MFY2009 9MFY2008 9MFY2009 9MFY2008 9MFY2009 9MFY2008 Revenue 3149 3005 171 177.7 4.8 9.5 169 194 Pre-tax profit
375 310 32 45.1 1.16 1.0 28 28
Net profit
262 216 22 31.6 0.82 0.44 17.2 20
*PNG - Papua New Guinea *SI – Solomon Island
Exhibit 32: Market Share of Dealership in Respective Territories
Market Share (%) 9MFY2009 FY2008
Australia 33.0 26.8
PNG 48.3 26.0
Caltrac 23.6 20.0
Exhibit 33: Malaysia’s Operations Brand Brand Purpose Caterpillar Agricultural Equipment Case New Holland Agricultural Equipment Kubota Agricultural Equipment Terberg Benschop BV Terminal Tractors Textron Turfcare Equipment – Golf Courses
Exhibit 34: Major Revenue Contributors to the Industrial Division by Industry/Sector in Malaysia Sector (%) 9MFY2009 9MFY2008
Oil, Gas & Marine 33 28
Forestry & Agriculture 38 37
Building Construction & Paving, Construction & Mining
15 20
Power & Manufacturing 9 10
Others 5 6
Exhibit 35: Port Dickson Power Plant and Laem Chabang Power Plant
31 March 2009 31 March 2008
Performance index Port Dickson Power Plant
Laem Chabang Power Plant, Thailand
Port Dickson Power Plant
Laem Chabang
Power Plant, Thailand
Capacity Payment (%) 88 17 91 17 Energy Payment (%) 12 66 9 63 Gross output (GWh) 171,578 641 160,640 698 Net output (GWh) 164,677 629 156,912 678 Overall availability (%) 99 99* 99 100**
Steam production (tonnes/hour)
- 239,672 - 240,715
Average actual heat rate (btu/kwh)
12,434 6,838 12,410 6,768
* as of FY2008 ** as of FY2007

MARC Analysis Sime Darby Berhad
35
Appendix 3
TRANSFORMATION MANAGEMENT & SYNERGIES
The road map is in three phases with the following key objectives: Establish the platform (2007 – 2008) (i) Establish the new organisation, management team and key performance indicator for all business
units.
(ii) Integrate the plantation and property business. Drive focused portfolio to full value (2008 – 2009)
(ii) Maximise value from the integration of plantation and property business units. (iii) Transform the plantation and property business units into industry leaders.
Explore new frontiers (by 2010)
(i) Sime Darby to be fully integrated and position to embark on growth (ii) Business units to complement each other for complementary growth. To achieve the above objectives, Sime Darby would need to derive synergies that can be achieved by integrating and streamlining its business operations. Specific areas identified by Sime Darby for cost and revenue synergies are as follows:
Plantation Division
(a) Cost Synergies Optimising mill routing and capacity utilization Pre-merger, each company has its own respective mills, some of which are located near to each
other. Not all FFB processed at the nearest mill belong to Sime Darby. Post merger, FFB can be sent to the nearest mill of the enlarged group. For example, FFB from Guthrie’s former estate can now be sent to the nearest mill belonging to KSB.
Fertiliser optimization As the second largest cost component is fertiliser, Sime Darby aims to achieve cost saving in the
application and purchase of fertiliser through benchmarking and centralised procurement. Economies of scale and rationalization Sime Darby hopes to achieve cost savings in areas such as transport and logistic network,
consolidated estate and mill management and procurement of herbicides through rationalisation and economies of scale.
(b) Revenue Synergies
Adoption of best practices in estate management As noted in the previous section on the plantation division, each of the former component companies has different FFB yields. Sime Darby hopes to achieve higher overall yield through sharing of best practices in estate management.

MARC Analysis Sime Darby Berhad
36
Adoption of best practice in mill management Similarly, the mills of each of the former component companies have different OER and KER yields. With the adoption of best practices, Sime Darby hopes to improve the productivity of its mills.
Property Division
(a) Cost Synergies Economies of scale from subcontracting Sime Darby hopes the enlarged property division would be in a better position to negotiate for
lower pricing from their contractors and consultants. This could result in lower construction cost and higher profit margins.
Best practices Sime Darby hopes the enlarged property division would be able to share internal costing data and
best practices in property management and construction to achieve cost savings. (b) Revenue Synergies Price optimization Sime Darby hopes with the use of internal benchmarking and access to an enlarged pool of
marketing data, the property division would be able to achieve optimum pricing for its properties. Corporate Services Streamlining and rationalization Sime Darby hopes to achieve cost savings by rationalising and streamlining its support functions such as information technology, human resources, finance and other corporate functions.

MARC Analysis Sime Darby Berhad
37

MARC Analysis Sime Darby Berhad
38

MARC Analysis Sime Darby Berhad
39

MARC Analysis Sime Darby Berhad
40

MARC Analysis Sime Darby Berhad
41

MARC Analysis Sime Darby Berhad
42
RATING SYMBOLS & DEFINITIONS
ISLAMIC CAPITAL MARKET INSTRUMENT RATINGS
MARC’s Long-Term Ratings are assigned to Islamic capital market instruments with maturities of more than one year. These ratings specifically assess the likelihood of timely payment of the instrument issued under the various Islamic financing contract(s).
Investment Grade:
AAAID Extremely strong ability to make payment on the instrument issued under the Islamic financing contract(s).
AAID Very strong ability to make payment on the instrument issued under the Islamic financing contract(s). Risk is slight
with degree of certainty for timely payment marginally lower than for instruments accorded the highest rating.
AID Strong ability to make payment on the instrument issued under the Islamic financing contract(s). However, risks
are greater in periods of business and economic stress than for instruments with higher ratings.
BBBID Adequate ability to make payment on the instrument issued under the Islamic financing contract(s). Vulnerable to
moderately adverse developments, both internal and external. Non-Investment Grade:
BBID Uncertainties exist that could affect the ability of the issuer to make payment on the instrument issued under the
Islamic financing contract(s).
BID Significant uncertainty exists as to timely payment on the instrument issued under the Islamic financing contract(s).
Slight adverse developments could impair issuer’s ability to fulfill such obligation.
CID Possesses a substantial risk of default, with little capacity to address further negative changes in financial
circumstances.
DID Failed to make scheduled payment on the instrument issued under the Islamic financing contract(s).
Notes: Long-Term Ratings from AA to B may be modified by the addition of a plus (+) or minus (-) suffix to show relative standing within the major rating categories. Bank-guaranteed issues will carry a suffix (bg), corporate-guaranteed issues, a (cg), issues
guaranteed by a financial guarantee insurer (FGI), an (fg), and all other supports, an (s) when such guarantees or supports give favourable effect to the assigned rating.
MARC’s Short-Term Ratings are assigned to Islamic capital market instruments with original maturities of one year or less, and are intended to assess the likelihood of timely payment of the instrument issued under the various Islamic financing contract(s).
Investment Grade:
MARC–1ID Extremely strong capacity to make timely payment on the instrument issued under the Islamic financing
contract(s).
MARC–2ID Strong capacity to make timely payment on the instrument issued under the Islamic financing contract(s).
Timeliness of payment is slightly susceptible to adverse changes in operating circumstances and economic conditions.
MARC–3ID Adequate capacity to make timely payment on the instrument issued under the Islamic financing contract(s).
Moderately adverse changes in operating environment and economic conditions may weaken financial capacity to fulfil such obligation.
Non-Investment Grade:
MARC–4ID Vulnerable to non-payment of instrument issued under the Islamic financing contract(s). Capacity to make
payment on the instrument is dependent upon favourable business, financial and economic conditions.
DID Failed to make scheduled payment on the instrument issued under the Islamic financing contract(s).
Notes: Short-Term Ratings will also carry a suffix (bg) for bank-guaranteed issues, (cg) for corporate-guaranteed issues, (fg) for FGI-guaranteed issues, and (s) for all other supports when such guarantees or supports give favourable effect to the assigned rating.
Subscript ‘ID’ for Long-Term and Short-Term Ratings denotes an Islamic Private Debt Security.
MARC’s Rating Outlook assesses the potential direction of the Islamic Capital Market Instrument Rating over the intermediate term (typically over a one to two-year period). The Rating Outlook may either be: POSITIVE which indicates that a rating may be raised; NEGATIVE which indicates that a rating may be lowered; STABLE which indicates that a rating is likely to remain unchanged; or
DEVELOPING which indicates that a rating may be raised, lowered or remain unchanged.
LONG-TERM RATINGS
SHORT-TERM RATINGS
RATING OUTLOOK

MARC Analysis Sime Darby Berhad
43
--------------------------------------------------------------------- Disclaimer ---------------------------------------------------------------------- The Credit Analysis Report is the property of Malaysian Rating Corporation Berhad (MARC) and is protected by Malaysian and international copyright law and conventions. The Credit Analysis Report and all information contained herein shall not be copied or otherwise reproduced, repackaged, further transmitted, transferred, disseminated, redistributed or resold for any purpose, in whole or in part, in any form or manner or by any means whatsoever, by any person without MARC's prior written consent. MARC does not make any warranties, express or implied, including, without limitation, those of merchantability and fitness for a particular purpose, with respect to the Credit Analysis Report and all information contained herein. The Credit Analysis Report and all information contained herein is provided on the basis of information believed by MARC to be accurate and reliable as derived from publicly available sources or provided by the rated entity or its agents. MARC, however, has not independently verified such information and makes no representation as to the accuracy or completeness of such information. Any assignment of a credit rating by MARC is solely to be construed as a statement of its opinion and not a statement of fact. A credit rating is not a recommendation to buy, sell, or hold any security. No investment decision should be made solely on the basis of a credit rating as it does not, among others, comment on the adequacy of market price, the suitability of any security for a particular investor, or the tax-exempt nature or taxability of payments made in respect to any security. MARC reviews from time to time the credit ratings it has assigned and may change such credit ratings or place them on credit watch. Further, the Credit Analysis Report and all information contained herein may include inaccuracies or typographical errors. Moreover, MARC may make modifications and/or changes in the Credit Analysis Report and all information contained herein at any time, for any reason. Any person using and/or relying on the Credit Analysis Report solely assumes the risk in making use and/or relying on the Credit Analysis Report and all information contained herein. Any person making use of and/or relying on the Credit Analysis Report and any information contained herein expressly absolves and releases MARC and its licensors and suppliers from any liability for any damages arising from the use of and/ or reliance on the Credit Analysis Report or information contained herein. Under no circumstances will MARC or its affiliates be liable for any special, indirect, incidental or consequential damages of any kind, including, but not limited to, compensation, reimbursement or damages on account of the loss of present or prospective profits, expenditures, investments or commitments, whether made in the establishment, development or maintenance of business reputation or goodwill, cost of substitute materials, products, services or information, cost of capital, and the claims of any third party, or for any other reason whatsoever, even if MARC has been advised of the possibility of such damages. Any person making use of and/or relying on the Credit Analysis Report and all information contained herein hereby acknowledges that he has read this Disclaimer and has understood it and agrees to be bound by it.
----------------------------------------------------------------------------------------------------------------------------------------------------------------
© 2009 Malaysian Rating Corporation Berhad
Published and Printed by:
MALAYSIAN RATING CORPORATION BERHAD (Company No. : 364803 V)
5th Floor, Bangunan Malaysian Re, No 17 Lorong Dungun, Damansara Heights, 50490 KUALA LUMPUR Tel: [603] 2092 5398 Fax: [603] 2094 9397 E-mail: [email protected] H-page : www.marc.com.my