Embed Size (px)
Citation preview
NASA
Technical Memorandum 105416
- //
J
AVSCOM
Technical Report 91-C-049
Analysis and Modification of a Single-MeshGear Fatigue Rig for Use inDiagnostic Studies
James J. Zakrajsek, Dennis E Townsend, and Fred B. Oswald
Lewis Research Center
Cleveland, Ohio
and
Harry J. Decker
Propulsion Directorate
U.S. Army Aviation Systems CommandLewis Research Center
Cleveland, Ohio
May 1992
Nt A(NAT;A-I_-I05._IC,) ANALYSIS AN-r); MOOIFICATInN
,2_ A z.INbLE-MT3_ 'q-,[aFt f-AlTO.liE klG FO.R USE IN
3IAGNr_STIC STUDIt_ (NASA) 20 D
SYSTEMS COMMAND
N_Z-ZT_T_
Uncla_
:35/$7 0_99215
https://ntrs.nasa.gov/search.jsp?R=19920018636 2018-05-08T23:24:22+00:00Z
Single-mesh gear fatigue rigs at NASA Lewis have been used for nearly 20 years to
supply data on the effects of gear materials, gear surface treatments, and lubrication types and
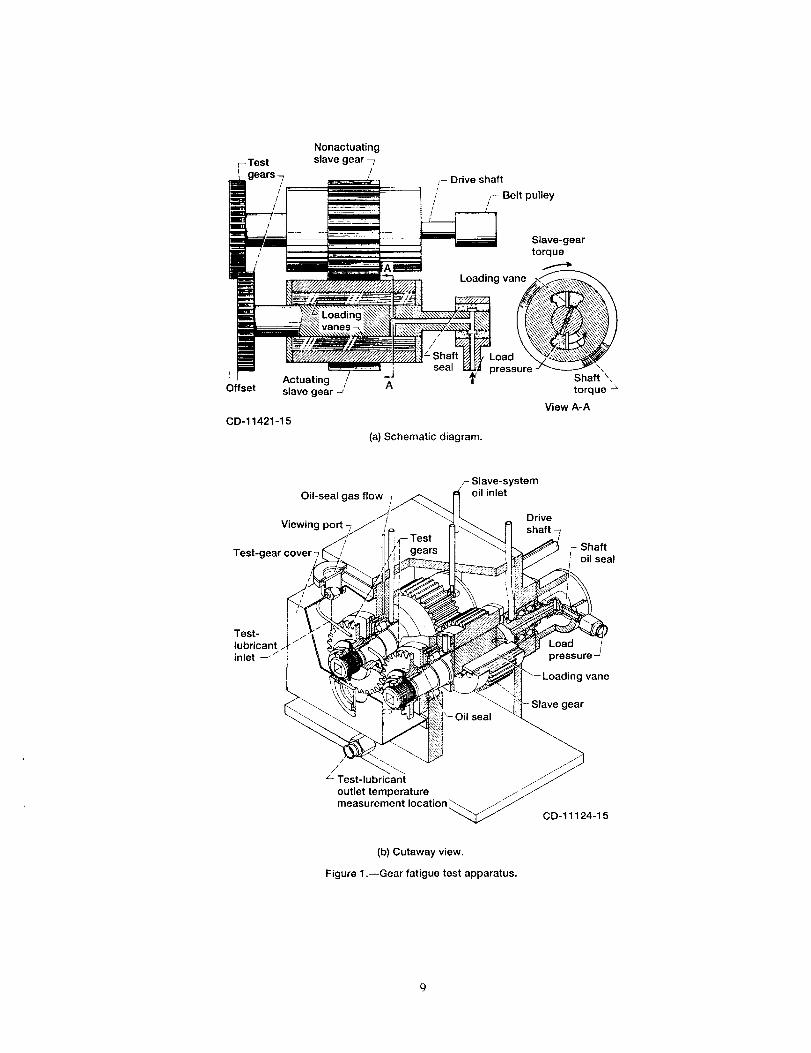
methods on the fatigue strength of aircraft-quality gears. A schematic diagram and cutaway
view of the fatigue rig are shown in figure 1. The test rig is a four-square type with power
recirculating through the slave gears. Resisting torque is provided by hydraulically actuated
load vanes inside one of the slave gears. The motor provides only the power required to over-
come frictional forces. Until recently (Zakrajsek, 1989) this rig was exclusively used for fatigue
studies, where only the overall root-mean-square vibration level was monitored as an indicator offailure.
The most critical part of any diagnostic monitoring process is the ability to obtain
vibration data that accurately represent the dynamics of the component that is being monitored.
In a previous study (Zakrajsek, 1989) a major problem was identified in using this fatigue rig for
diagnostic studies. The vibration signal from this rig was found to contain a number of fre-
quency components that were unrelated to the test gears. A typical vibration spectrum from the
fatigue rig is given in figure 2. This spectrum was a result of time-synchronous averaging of the
signal over 100 revolutions. Time-synchronous averaging reduces the components of the vibra-tion signal that are not coincident with the shaft rotational frequency. Even with time avera-
ging the vibration signal is saturated with vibration components at frequencies other than the
test-gear meshing frequency and its harmonics. These components mask the test-gear meshing
signal. Applying current diagnostic methods (McFadden, 1986, and Stewart, 1977) to this noisyvibration signal results in confusing and erroneous predictions. The unwanted vibration compo-
nents of this signal, because they are dominant, have the major influence on the results of the
diagnostic methods. A way was needed to obtain a "cleaner" vibration signal that accuratelyreflects only the dynamics of the test gears before meaningful diagnostic research could be per-
formed with this fatigue rig.
In order to improve the vibration signal for diagnostic research, several steps were taken
to analyze and modify the single-mesh gear fatigue rig. The first step involved trying to identify
possible sources and factors contributing to the problem. Following this, some analysis was
performed on an existing rig to determine the effects of sensor mounting location on the vibra-
tion signal. Another rig was then physically modified in an effort to reduce the unwanted
vibration components in the signal. The two rigs used in this study were identical in both
physical construction and dynamic response. The modified rig was then analyzed to determine
how the vibration signal changed. The following sections discuss each of these steps in more
depth. Some conclusions based on the results of this study are also presented.
PROBLEM SOURCE IDENTIFICATION
In order to reduce the amplitude of undesired vibration frequencies, several possiblesources and factors had to be identified. Resident rotor and gear dynamics experts, general
information from the literature, and specific rig geometry information were all used to establish
a list of the most probable sources and factors that might result in the unwanted noise. Twomethods can be used to reduce this noise: Either eliminate the sources of the noise or minimize
the transmission to the sensor. In those cases where the sources cannot be eliminated, reducing
the transmission to the sensor of the unwanted components may be the only feasible option.
The most probable sources and factors are listed here. The first factor listed can be investigatedwithout modification to the rig.
(1) The accelerometer may not be mounted in an optimum location. Two issues affect
the optimum location. First, the optimum location should give the strongest representation of
the test gears being monitored. In the case of rolling-element bearings a bearing defect in a
helicopter tail rotor gearbox was easier to detect when the accelerometer was closest to the
bearing and located in the bearing load zone (Hollins, 1988). Because the vibration must be
transmitted through the bearings to the case, it is expected that the gear vibration will also be
strongest in the bearing load zone. Second, the vibration signal at the optimum location should
have the test-gear meshing frequencies as the dominant components.
(2) The slave gears may be too lightly loaded. The slave gears are also spur gears; how-
ever, unlike the test gears the slave gears are oversized to ensure that they do not fail during the
test. The normal operating load of the rig results in the slave gears being loaded to approxi-
mately 10 percent of their design load based on tooth contact stress, and to 8 percent based on
tooth bending stress. Lightly loaded spur gears have a tendency for excessive vibration and
noise (Rebbechi et al., 1992). The nonlinear nature of gears losing contact during meshing
results in a vibration forcing function that is broadband (i.e., a function that requires a wide
band of frequency components to characterize the time signal).
(3) Imbalance may exist in the rotating components. The slave gears and the shafts are
balanced separately and then assembled. Even though both are balanced separately, an im-
balance could exist after the parts are assembled unless the axes of rotation of both parts are
exactly concentric. The vibration due to imbalance will be limited to the first several shaftharmonics.
(4) Misalignment may exist in the rotating components. A bent or misaligned shaft can
result in a high level of vibration. The vibration due to misalignment usually results in a large
number of shaft harmonics in the spectrum.
(5) Mechanical looseness may exist in the rotating components. The fatigue rig has been
in operation for nearly 20 years, and many of the rotating parts now fit loosely due to wear.
Bearings fit loosely in the housing, and slave gears fit loosely over shafts. Mechanical looseness
is generally characterized by normal sinusoidal vibration interrupted by a mechanical limit. The
machine response will be nonlinear, exhibiting a time domain signal containing truncation and
impulses. This nonlinear nature of the vibration due to mechanical looseness results in a vibra-
tion forcing function that, like that of the lightly loaded slave gears, is broadband (Lyon, 1987).
(6) Slave gears are too massive. The slave gears are roughly 51/2 times more massive than
the test gears. Excessive slave-gear mass can amplify unwanted vibration sources due to
misalignment and imbalance.
ANALYSIS OF UNMODIFIED RIG
Before modifying the test rig some analysis was performed on an existing rig to deter-
mine what effect sensor location alone has on the vibration signal. Sensor location is the only
one of the six sources and factors identified that can be changed without physically modifying
the test rig.
For diagnostic studies the optimum sensor location is that point at which the test-gear
meshing frequencies dominate the signal and are more prominent than at any other location. As
shown in figure 2, the main problem is obtaining a vibration signal that is not masked by the
other components in the signal. It is believed that these unwanted components in the vibration
signal are a result of the natural modes of the vibration transfer path, from the gear mesh to the
sensor, being excited by the sources identified previously. Those sources that result in a
broadband vibration (e.g., mechanical looseness and lightly loaded slave gears) are capable of
exciting most natural modes of the transfer path in the frequency range of interest. The range
1 to 10 kHz is defined as the frequency range of interest, as it contains the primary mesh fre-
quency of the test gear (4741 Hz) and its second harmonic. Therefore, it is possible to reducethe effects of the various sources on the vibration signal by locating the sensor at a point where
the modal properties of the transfer path have minimal effect on the signal.
In order to determine the optimum sensor mounting location, frequency response meas-urements were conducted at 18 locations on the test rig, as illustrated in figure 3. An instru-
mented modal hammer was used to apply an impulse input on the shaft where the test gear
mounts, in the direction that the actual meshing forces act on the shaft, as depicted by vector I
in figure 3. A common practice used in modal analysis is to analyze the spectrum of the input
impulse and determine at what frequency the amplitude drops by 20 dB. The impulse suffi-
ciently excites all the frequencies in the structure up to that point. This is commonly referred to
as the 20-dB dropoff rule. Using this rule, the applied impulse was found to excite frequencies
up to 9 kHz. Frequency response measurements were taken between the common impulse
application point (point O) and each of the 18 locations on the test rig. The magnitude of the
frequency response function, or the system gain factor, was recorded at each point. The system
gain factor is given as
IH(f) I = IY(f)lIX(f) l
where IY(f) l = output amplitude and IX(f) L = input amplitude.
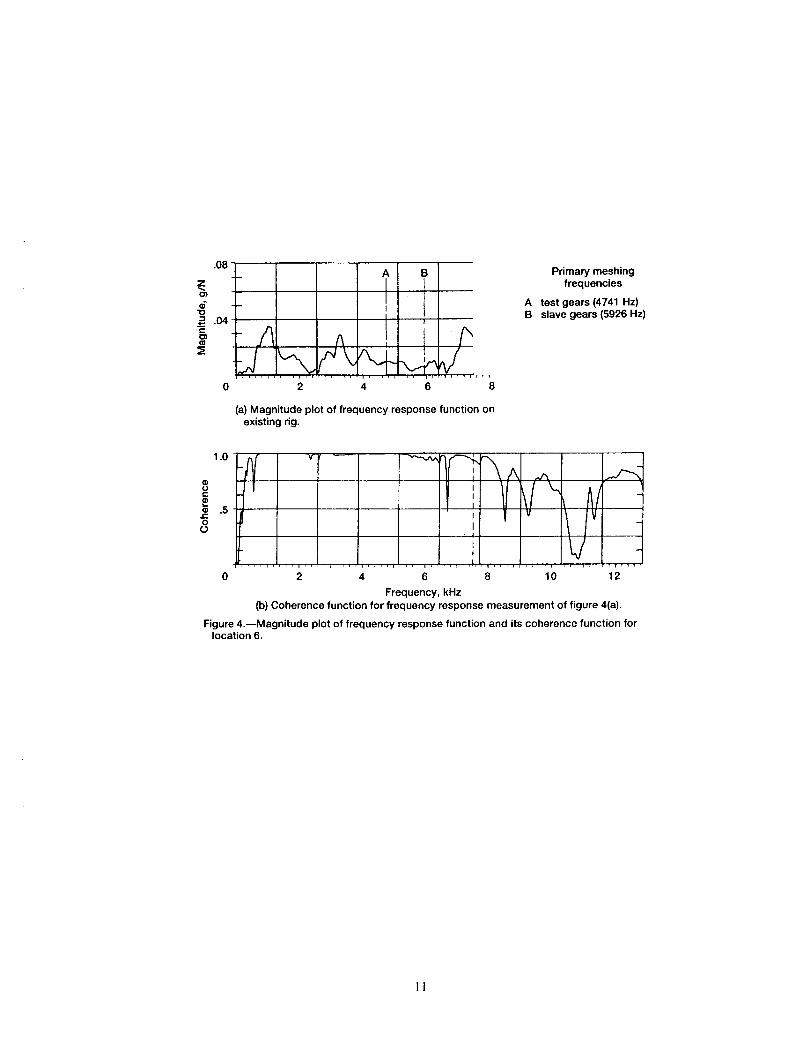
In order to measure the quality of the frequency response function obtained, the coher-ence function was calculated for each frequency response function. The coherence function is a
measure of the amount of the output signal that is directly related to the input signal at any
specific frequency. A coherence value of 1.0 at a certain frequency indicates that the output at
that frequency is a direct result of the input signal at that frequency. The measured coherence
was at or very close to 1.0 for all frequencies up to approximately 7.5 kHz. Above 7.5 kHz the
coherence dropped off rapidly. Figure 4(b) shows an example of the coherence function obtained
for the frequency response measurement of figure 4(a). Thus, the frequency response functions
obtained were considered only up to 7.5 kHz, because of the uncertainty of the measurement
beyond that point.
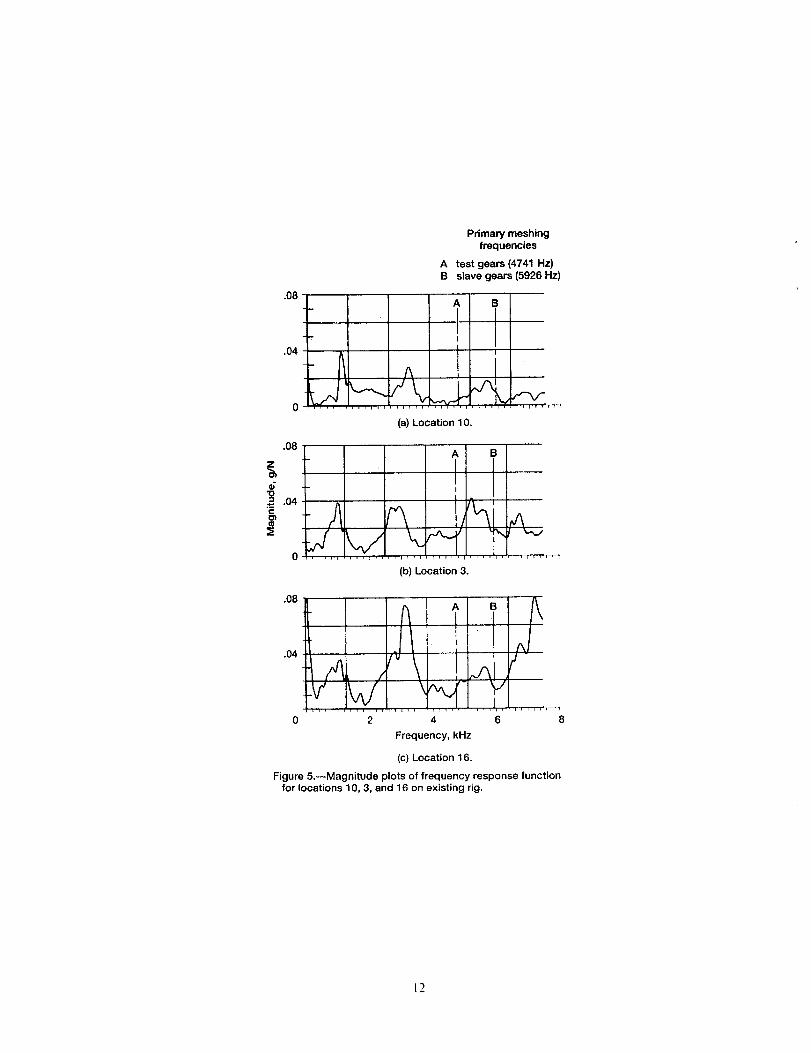
Frequency response results are given in figures 4 and 5 for sensor mounting locations 6,
10, 3, and 16, respectively. Of all the locations examined, locations 6 and 10 were found toexhibit the flattest frequency response functions. Locations 6 and 10 are probably coincident
with nodes of the housing. Location 3 is the traditional accelerometer mounting point and was
used in the previous study (Zakrajsek, 1989). As shown in figure 5(b), location 3 appeared to be
more modally active than locations 6 and 10. Location 16 represented the optimum point with
respect to previous studies (Hollins, 1986). This position was on the bearing end plate at one of
the closest points to the test-gear mesh. As shown in figure 5(c), location 16 was found to be
one of the most modally active of the 18 positions analyzed. Other locations on the bearing end
4
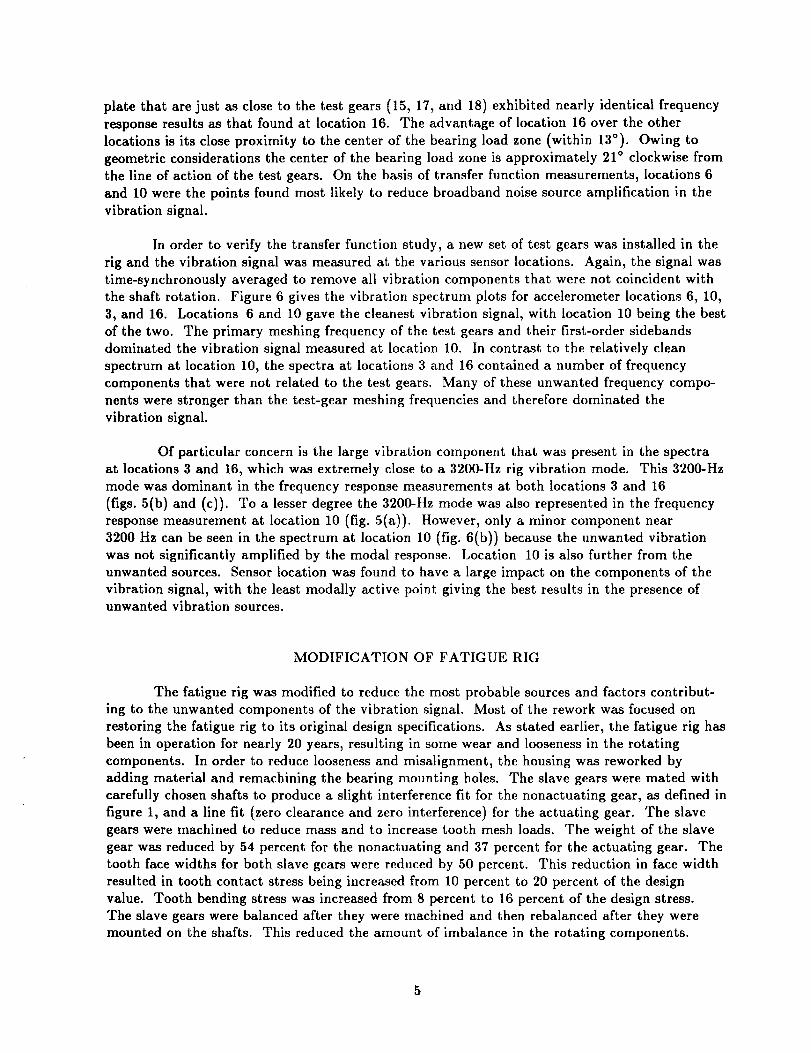
plate that are just as close to the test gears (15, 17, and 18) exhibited nearly identical frequency
response results as that found at location 16. The advantage of location 16 over the other
locations is its close proximity to the center of the bearing load zone (within 13°). Owing to
geometric considerations the center of the bearing load zone is approximately 21 ° clockwise from
the line of action of the test gears. On the basis of transfer function measurements, locations 6
and 10 were the points found most likely to reduce broadband noise source amplification in the
vibration signal.
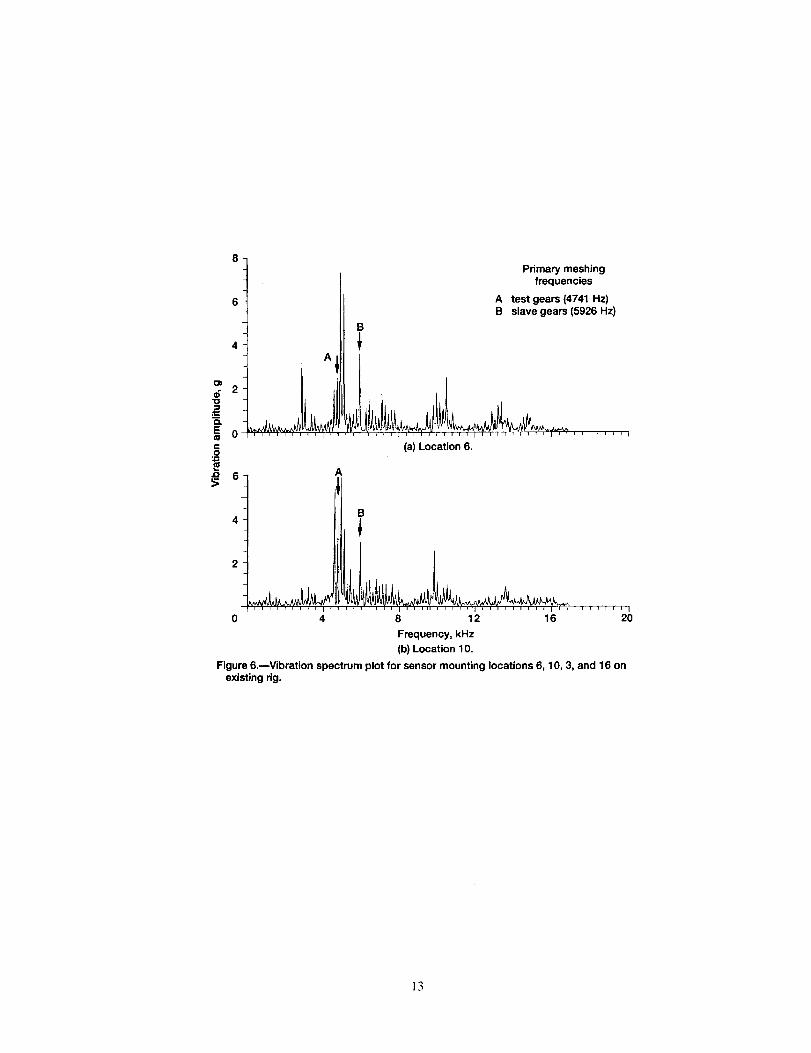
In order to verify the transfer function study, a new set of test gears was installed in the
rig and the vibration signal was measured at the various sensor locations. Again, the signal was
time-synchronously averaged to remove all vibration components that were not coincident with
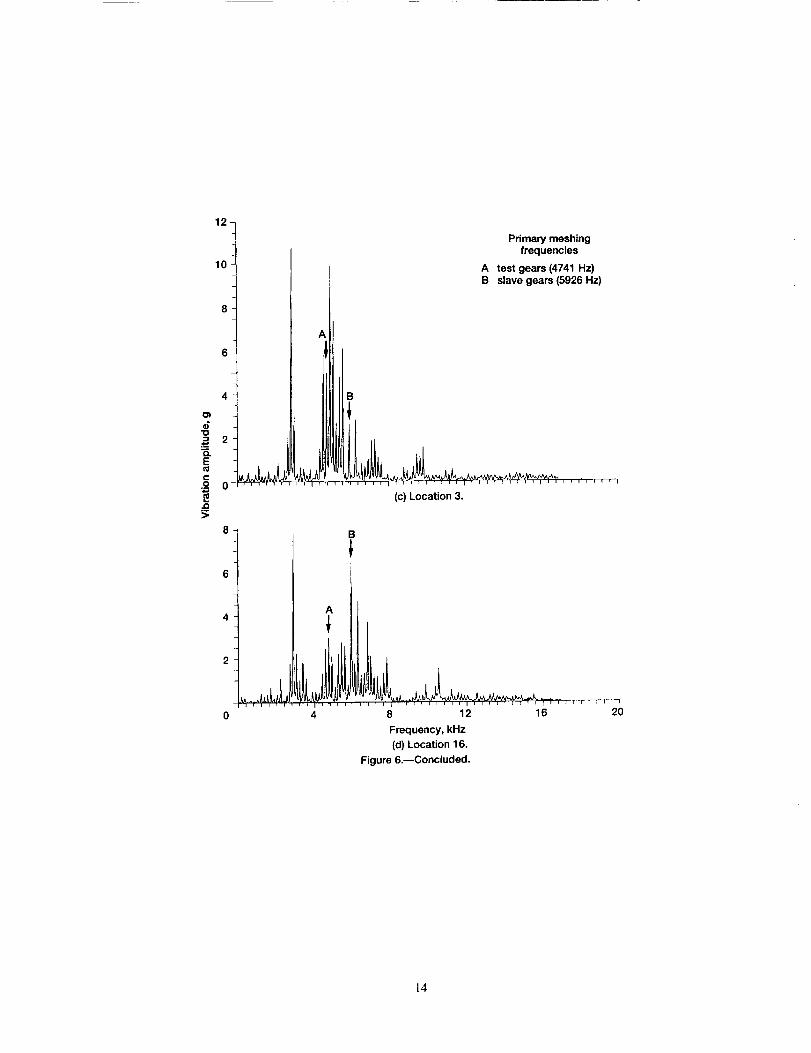
the shaft rotation. Figure 6 gives the vibration spectrum plots for accelerometer locations 6, 10,
3_ and 16. Locations 6 and 10 gave the cleanest vibration signal, with location 10 being the best
of the two. The primary meshing frequency of the test gears and their first-order sidebands
dominated the vibration signal measured at location 10. In contrast to the relatively clean
spectrum at location 10, the spectra at locations 3 and 16 contained a number of frequency
components that were not related to the test gears. Many of these unwanted frequency compo-
nents were stronger than the test-gear meshing frequencies and therefore dominated the
vibration signal.
Of particular concern is the large vibration component that was present in the spectra
at locations 3 and 16, which was extremely close to a 3200-Hz rig vibration mode. This 3200-Hz
mode was dominant in the frequency response measurements at both locations 3 and 16
(figs. 5(b) and (c)). To a lesser degree the 3200-Hz mode was also represented in the frequency
response measurement at location 10 (fig. 5(a)). However, only a minor component near
32OO Hz can be seen in the spectrum at location 10 (fig. 6(b)) because the unwanted vibration
was not significantly amplified by the modal response. Location 10 is also further from the
unwanted sources. Sensor location was found to have a large impact on the components of the
vibration signal, with the least modally active point giving the best results in the presence ofunwanted vibration sources.
MODIFICATION OF FATIGUE RIG
The fatigue rig was modified to reduce the most probable sources and factors contribut-
ing to the unwanted components of the vibration signal. Most of the rework was focused on
restoring the fatigue rig to its original design specifications. As stated earlier, the fatigue rig has
been in operation for nearly 20 years, resulting in some wear and looseness in the rotating
components. In order to reduce looseness and misalignment, the housing was reworked by
adding material and remachining the bearing mounting holes. The slave gears were mated with
carefully chosen shafts to produce a slight interference fit for the nonactuating gear, as defined in
figure 1, and a line fit (zero clearance and zero interference) for the actuating gear. The slave
gears were machined to reduce mass and to increase tooth mesh loads. The weight of the slave
gear was reduced by 54 percent for the nonactuating and 37 percent for the actuating gear. The
tooth face widths for both slave gears were reduced by 50 percent. This reduction in face width
resulted in tooth contact stress being increased from 10 percent to 20 percent of the design
value. Tooth bending stress was increased from 8 percent to 16 percent of the design stress.
The slave gears were balanced after they were machined and then rebalanced after they were
mounted on the shafts. This reduced the amount of imbalance in the rotating components.
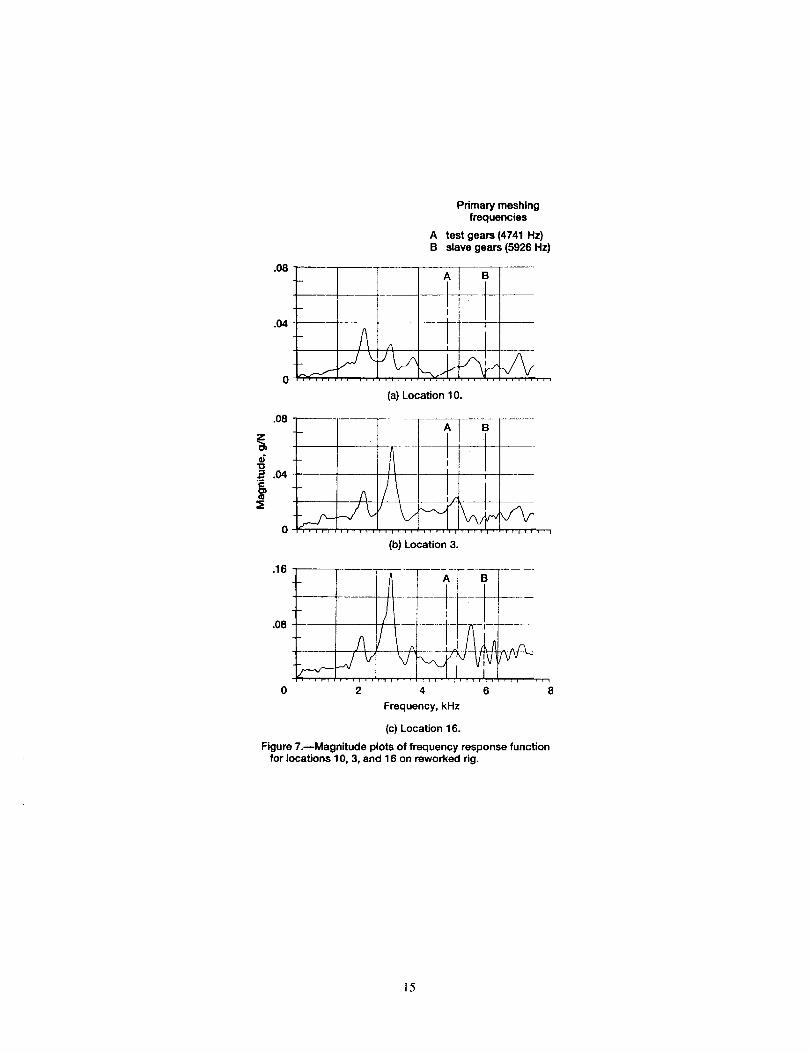
Figure 7 shows results of the frequency response measurements on the modified rig for
locations 10, 3, and 16. Comparing this figure with figure 5 illustrates similar modal character-
istics for the modified rig and the existing rig. Location 10 exhibited a relatively flat frequency
response function on both rigs. Only two major differences can be seen. At all locations the
1.1-kHz mode on the existing rig shifted to 2.2 kHz on the reworked rig, and at location 16 the
large 7.3-kHz mode on the existing rig was absent on the reworked rig. The shift in the lower
mode from 1.1 to 2.2 kHz can be explained by the large amount of mass removed from the slave
gears on the modified rig.
RESULTS OF RIG MODIFICATION
In order to determine the results of the rig modification, a new set of test gears was run
on both the existing rig and the reworked rig. First, the gears were run on the existing rig for a
short time while vibration measurements were made at a variety of locations on the rig. The
same set of new test gears was then installed and run on the reworked rig, with vibration signals
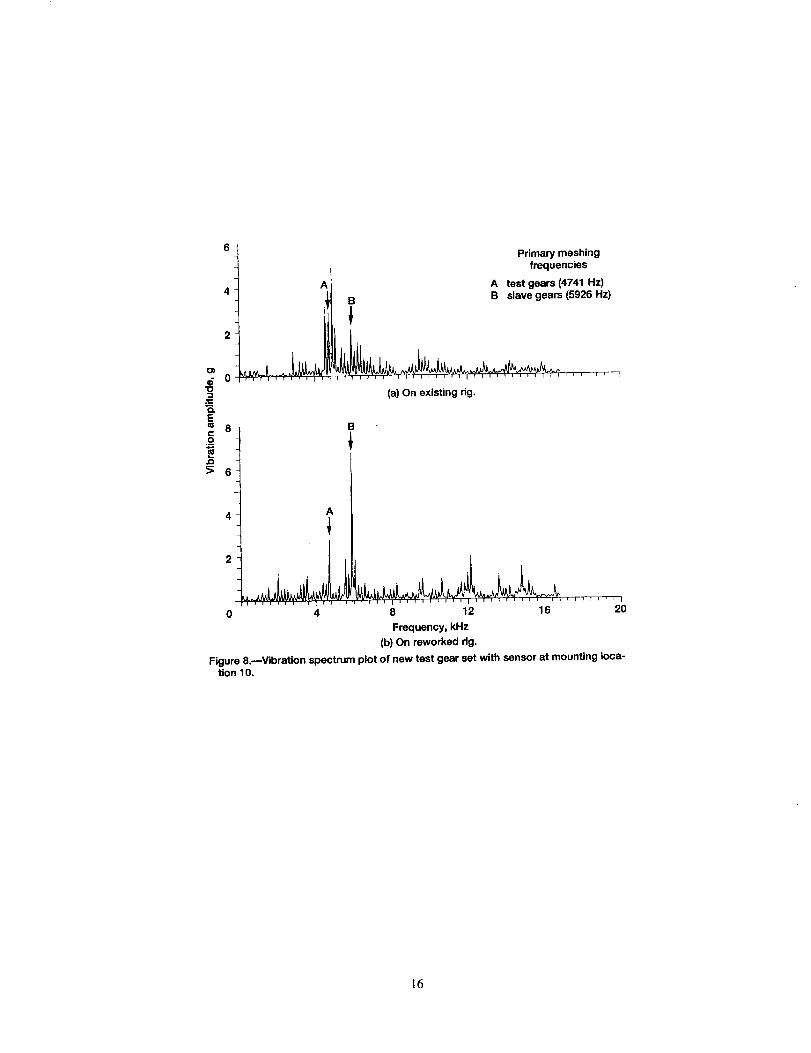
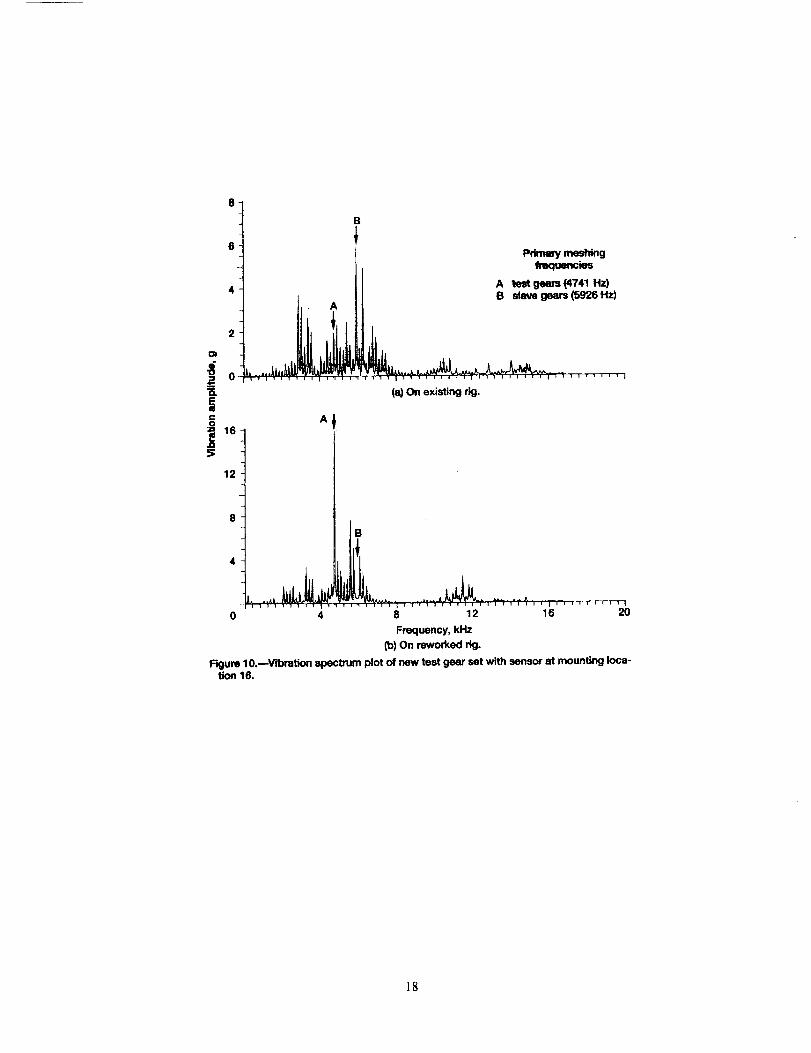
recorded at identical locations. The vibration spectra from the existing rig were compared with
those from the modified rig with the same test-gear set for locations 10, 3, and 16, respectively
(see figs. 8, 9, and 10). As shown in these figures there was a definite improvement in the
spectrum of the vibration signal with the modified rig. At all locations the amplitude of
unwanted vibration components near the test-gear meshing frequency was reduced in the
reworked rig. The strong components near 3200 Hz at locations 3 and 16 on the existing rig
were reduced to negligible values on the reworked rig. The test-gear meshing frequency was
more prominent at all locations on the reworked rig as compared with the same locations on the
existing rig. These results strongly support the conclusion that the sources of the unwanted
vibration were greatly reduced, if not eliminated, as a result of the rework.
One adverse result of the rework was the increase in amplitude at the slave-gear meshing
frequency at locations 10 and 3 on the reworked rig. Unfortunately, even though the spectrum
was much cleaner and the test-gear meshing frequency was more prominent at locations 10 and 3
on the reworked rig, the slave-gear meshing frequency strength had increased to the point where
it was now the dominant component in the vibration signal. It is suspected that the tooth
deflection resulting from increasing the slave-gear tooth loading by a factor of 2 caused the
initial tooth contact to happen prematurely. Adding some form of tip relief to the presently
unmodified slave-gear tooth profile should correct this problem (Lin et al., 1989).
Another problem associated with the current rig was observed while comparing results
with the modified rig. Two different sets of new test gears were used to produce the spectra
illustrated in figures 6(b) and 8(a) for location 10 on the existing rig. Although two different
sets of gears were used, both spectra show the same pattern of lower amplitude for the test-gear
primary meshing frequency as compared with the corresponding first-order sidebands. This
pattern was not present at location 10 on the reworked rig even though the same gear set was
used. In fact, as shown in figure 8, no sidebands were detectable on the reworked rig. Strong
first-order sidebands are usually an indication of eccentricity. The problem was found to be a
badly worn shaft on the existing rig, with a 0.003-in. clearance between the shaft and the test
gear where a line fit is specified. The additional clearance provided by the worn shaft caused
eccentric mounting of the gear. The sidebands are a result of the once-per-revolution eccentrici-
ty being carried through the primary test-gear meshing frequency.
6
Whenextraneousvibrationsourcesareeliminated,theoptimummountinglocationisthat point closestto the gearmeshbeingmonitoredin the loadzoneof the bearing.Figure10(b)illustratesthat whenthe extraneousvibrationsourceswereremoved,location16(the closestto the test-gearmeshandin the bearingloadzone)gavethe strongestrepresentationof the test-gearmeshingenergy. Figure10(a)alsoshowsthat in thepresenceof extraneousvibrationsources,location16wasoneof theworst locations. If the sourcesof the noisein thevibrationsignalcouldnot beeliminatedor reduced,location10wouldbe theoptimumsensorposition. Eventhoughthetest-gearmeshingfrequencywasnot asrobustat location10,therelativelyflat frequencyresponseof the transmissionpathat location10servedto reducetheinfluenceof the unwantednoisesourcesto thepoint wherethefrequencycomponentsof the test-gearmeshdominatedthe vibrationsignal.
CONCLUSIONS
A single-meshgearfatiguerig wasanalyzedandmodifiedto improvethe vibrationsignalfor usein diagnosticstudies.Pooraccelerometerplacement,mechanicallooseness,imbalance,andoversizedandunderloadedslavegearscausedthe test-gearvibration componentsto becompletelymaskedby other frequencycomponents.The modificationsreducedthe unwantedvibrationand resultedin a vibrationsignalthat is usefulfor diagnosticstudies. Somesignificantconclusionsof this studyarelisted here:
(1) Sensorlocationhasa majoreffecton thestrengthof unwanted components in a
vibration signal. A location free from resonant amplification of the unwanted vibration compo-
nents is desirable. If there is no problem with unwanted vibration, the optimum sensor location
will likely be near a gear support bearing and in the direction of bearing loading.
(2) By minimizing imbalance, misalignment, and looseness in rotating parts, unwanted
components in the vibration signal can be reduced to negligible levels. Mechanical looseness is
especially destructive to a clean vibration signal. The nonlinear nature of the vibration due to
mechanical looseness results in a broadband excitation.
(3) Increasing the tooth load on the slave gears, which have unmodified involute tooth
profiles, results in an increase in slave-gear mesh vibration instead of the reduction that is
desired.
REFERENCES
Astridge, D.G., 1989, Helicopter Transmissions - Design for Safety and Reliability. Inst. Mech.
Eng. Proc., vol. 203, no. G2, pp. 123-138.
Hollins, M.L., 1988, The Effects of Vibration Sensor Location in Detecting Gear and Bearing
Defects. Deflection, Diagnosis, and Prognosis of Rotating Machinery to Improve Reliability,
Maintainability, and Readiness Through the Application of New and Innovative Techniques,
T.R. Shires and L.J. Mertaugh, eds., Cambridge University Press, Cambridge, MA, pp. 49-58.
Lin, H.H., Oswald, F.B., and Townsend, D.P., 1989, Profile Modification to Minimize Spur
Gear Dynamic Loading. 1989 International Power Transmission and Gearing Conference, 5th,
ASME, Vol. 1, pp. 455-465.

Lyon, R.H., 1987, Machinery Noise and Diagnostics. Butterworth Publishing, Boston.
McFadden, P.D., 1986, Detecting Fatigue Cracks in Gears by Amplitude and Phase Demodula-
tion of the Meshing Vibration. J. Vib. Acoust. Stress Reliab. Design, vol. 108, no. 2, Apr.
pp. 165-170.
Rebbechi, B.R., et al., 1992, A Comparison Between Theoretical Prediction and Experimental
Measurement of the Dynamic Behaviour of Spur Gears. Prepared for the ASME 6th Interna-
tional Power Transmission and Gearing Conference, September 13-16, 1992, Phoenix, AZ.
Stewart, R.M., 1977, Some Useful Data Analysis Techniques for Gearbox Diagnostics. Machine
Health Monitoring Group, Institute of Sound and Vibration Research, University of
Southhampton, Report MHM/R/10/77, July.
Zakrajsek, J.J., 1989, An Investigation of Gear Mesh Failure Prediction Techniques. NASATM-102340.
Nonactuating
r-Test slave gear
gears --7 /j-- Drive shaft
1-- Belt pulley
I Actuating / "1
Offset slave gear t A
CD-11421-15
sea
Slave-geartorque
Loading vane -..._
'Loo pressure _-_"
t" Shafttorque -_
View A-A
(a) Schematic diagram.
F- Slave-system
Oil-seal gas flow __Viewing port -, J_/
Drive
i,_, shaft _,4-- TestTest-gear cover-7_--J _ gears _ _ r- Shaft
_.__ [_J I oilseal
z
Test- / i
lubricant i / \ _ !i
inlet _ _'_ pressu re_
- Loading vane
ii!i_';_!_\- Oil seal'" _Slaveiear
z_ Test-lubricant
outlet temperaturemeasurement location _ j_./
_"_r_ CD-11124-15
(b) Cutaway view.
Figure 1 .--Gear fatigue test apparatus.

O)
"O
et
Sc-o
JO
B
A
Primary meshingfrequencies
A test gears (4741 Hz)B slave gears (5926 Hz)
0 4 8 12 16 20
Frequency, kHz
Figure 2.--Typical vibration spectrum from existing single-mesh gear fatigue rig.
application vector of modal hammer0 impulse application point
\
x_ Line of actionof test gears
Figure 3.---Sensor mounting locations on fatigue rig.
]0
.08"Z
_.04'°_C
GI
A
I
0 4 6
M
2
B
t
8
(a) Magnitude plot of frequency response function onexisting rig.
Primary meshingfrequencies
A test gears (4741 Hz)B slave gears (5926 Hz)
,-.-, ,,0
"'°iD'[._" : "' - IA/,.,__-........................I......J : L.,'
0 2 4 8 10 126
Frequency, kHz(b) Coherence function for frequency response measurement of figure 4(a).
Figure 4.--Magnitude plot of frequency response function and its coherence function forlocation 6.
11
q;10
.==t-
eg
.O8
.04
.O8
.04
Primary meshingfrequencies
A test gears (4741 Hz)B slave gears (5926 Hz)
A B/
(a) Location 10.
V
A B
I
(b) Location 3.
.08
.04
-V0 2
. J A
\/_- V4 6 8
Frequency, kHz
(c) Location 16.
Figure 5.--Magnitude plots of frequency response functionfor locations 10, 3, and 16 on existing rig.
12
4
o_ 2
cO¢3
6
Primary meshingfrequencies
A test gears (4741 Hz)B slave gears (5926 Hz)
B
(a) Location 6.
A
B
4
2
,_--r-r-_--r-q
0 4 8 12 16 20Frequency, kHz
(b) Location 10.
Figure 6.mVibra tion spectrum plot for sensor mounting locations 6, 10, 3, and 16 on
existing rig.
13
"O
0.
E
CO
.Q
12
10
8
A
6 V
O [r , i _ i r i i i i i,i i i, , i F f i
(c) Location 3.
Primary meshingfrequencies
A test gears (4741 Hz)B slave gears (5926 Hz)
111'llll7
A,._./,,AL,_/I
B
A
4 8 12 16 20
Frequency, kHz
(d) Location 16.
Figure 6.--Concluded.
14
"O
8,¢0
.08
Primary meshingfrequencies
A test gears (4741 Hz)B slave gears (5926 Hz)
A B
. I 1---
I
.04 I
• , , , , ....... ',', , ,
(a) Location 10.
.08A B
fo) Location 3.
.16 ......... _--F-_ .....
.........Ir ....
0 2 4 6 8
Frequency, kHz
(c) Location 16.
Figure 7.mMagnitude plots of frequency response functionfor locations 10, 3, and 16 on reworked rig.
]5
O)
qD
E
¢-O
J_
4A
Primary meshingfrequencies
A test gears (4741 Hz)
B B slave gears (5926 Hz)
1
1 I i I _ I I F I I I I [' i_
la) On existing rig.
A
4 8 12 16 20
Frequency, kHz
(b) On reworked rig.
Figure 8.--Vibration spectrum plot of new test gear set with sensor at mounting loca-tion 10.
16

0
d"O
_" 10
C
.g
_ 6
_lllJJl
Primary meshing
frequencies
A test gears (4741 Hz)B slave gears (5926 Hz)
i r 1 - r i r i r _ r , J = i , i r _ r i t
(a) On existing rig.
A
i r = i i i i I
0 4 8 12 16 20
Frequency, kHz
(b) On reworked rig.
Figure 9.--Vibration spectrum plot of new test gear set with sensor at mounting loca-tion 3.
17
2
OI
a.
SO
18112
8
A
4
0 4
B
Primary meshingf_Nmc_s
A tes_ gems (4741 Hz)B slave gears (5926 Hz)
11 i I i I , i _ i , , i I i i , , , i , I ' '
(a) On existing rig.
...... ;"s_ ...... , , ,',?A' , 'i" ........ '_8 12 16 20
Frequency, kHz
_) Onrework_ ,_.
Figure 10.--Vibration spectrum plot of new test gear set with sensor at mounting loca-tion 16.
]8

Form Approved
REPORT DOCUMENTATION PAGE OMB No. 0704-0188
Public reporting burden for this collection of information is estimated to average 1 hour per response, including the time for reviewing instructions, searching existing data sources,
gathering and maintaining the data needed, and completing and reviewing the collection of information Send comments regarding this burden eslimate or any other aspect of this
collection of information, including suggestions for reducing this burden, to Washington Headquarters Services, Directorate for information Operations and Reports, 1215 Jefferson
Davis Highway, Suite 1204, Arlington, VA 22202-4302, and to the Office of Management and Budget, Paperwork Reduction Proiect (0704-0188), Washington, DC 20503.
1. AGENCY USE ONLY (Leave blank) 2. REPORT DATE 3. REPORT TYPE AND DATES COVERED
May 1992 Technical Memorandum
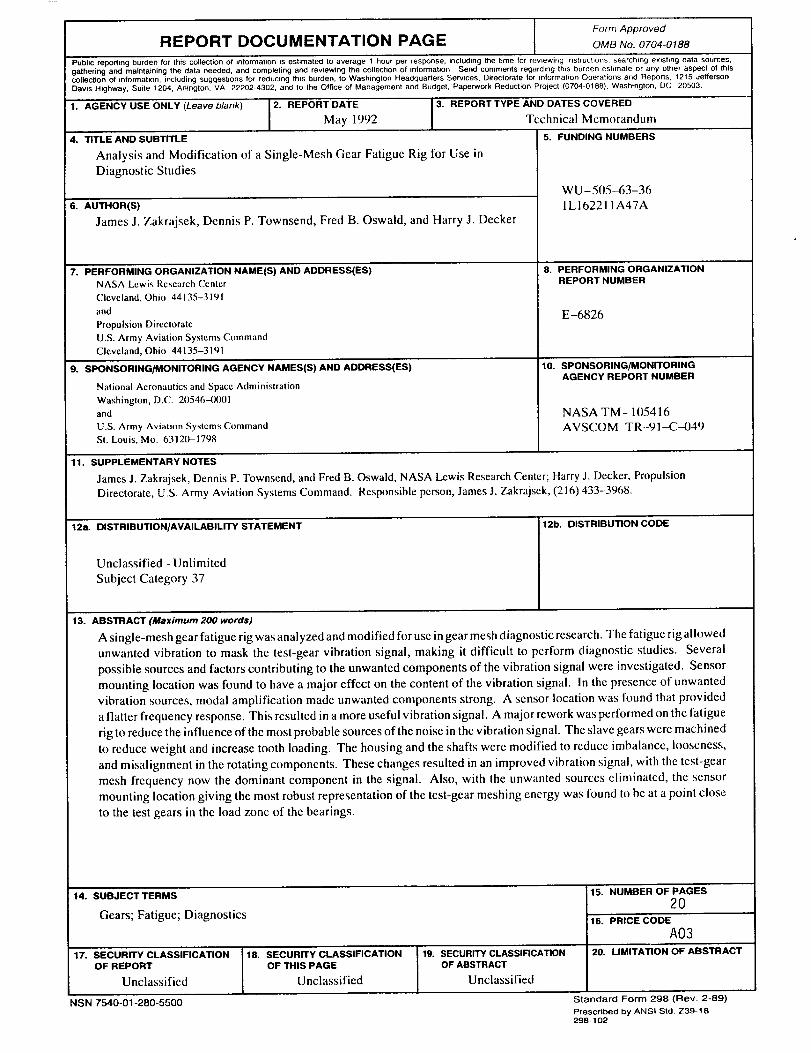
5. FUNDING NUMBERS4. TITLE AND SUBTITLE
Analysis and Modification of a Single-Mesh Gear Fatigue Rig for Use in
Diagnostic Studies
6. AUTI-IOR(S)
James J. Zakrajsek, Dennis P. Townsend, Fred B. Oswald, and ltarry J. Decker
7. PERFORMING ORGANIZATION NAME(S) AND ADDRESS(ES)
NASA Lewis Research Center
Cleveland, Ohio 44135-3191
and
Propulsion Directorate
U.S. Army Aviation Systems Command
Cleveland, Ohio 44135-3191
9. SPONSORING/MONITORING AGENCY NAMES(S) AND ADDRESS(ES)
National Aeronautics and Space Administration
Washington. D.C. 20546-(X)(II
and
U.S. Army Aviation Systems Command
St. Louis, Mo. 63120-1798
WU-505-63-36
1L162211A47A
8. PERFORMING ORGANIZATIONREPORT NUMBER
E-6826
10. SPONSORING/MONITORINGAGENCY REPORT NUMBER
NASA TM-105416
AV SCO M-TR-91-C--049
11. SUPPLEMENTARY NOTES
James J. Zakrajsek, Dennis P. Townsend, and Fred B. Oswald, NASA Lewis Research Center; Harry J. Decker, Propulsion
Directorate, U.S. Army Aviation Systems Command. Responsible person, James J. Zakrajsck, (216) 433-3968.
12a. DISTRIBUTION/AVAILABILITY STATEMENT 12b. DISTRIBUTION CODE
Unclassified - Unlimited
Subject Category 37
13. ABSTRACT (Maximum 200 words)
A single-mesh gear fatigue rig was analyzed and modified for use in gear mesh diagnostic research. The fatigue rig allowed
unwanted vibration to mask the test-gear vibration signal, making it difficult to perform diagnostic studies. Several
possible sources and factors contributing to the unwanted components of the vibration signal were investigated. Sensor
mounting location was found to have a major effect on the content of the vibration signal, in the presence of unwanted
vibration sources, modal amplification made unwanted components strong. A sensor location was found that provided
a flatter frequency response. This resulted in a more useful vibration signal. A major rework was performed on the fatigue
rig to reduce the influence of the most probable sources of the noise in the vibration signal. The slave gears were machined
to reduce weight and increase tooth loading. The housing and the shafts were modified to reduce imbalance, looseness,
and misalignment in the rotating components. These changes resulted in an improved vibration signal, with the test-gear
mesh frequency now the dominant component in the signal. Also, with the unwanted sources eliminated, the sensor
mounting location giving the most robust representation of the test-gear meshing energy was found to be at a point close
to the test gears in the load zone of the bearings.
14. SUBJECT TERMS
Gears; Fatigue; Diagnostics
17. SECURITY CLASSIFICATION
OF REPORT
Unclassified
NSN 7540-01-280-5500
18. SECURITY CLASSIFICATIONOF THIS PAGE
Unclassified
19. SECURITY CLASSIFICATIONOF ABSTRACT
Unclassified
15. NUMBER OF PAGES
2016. PRICE CODE
A0320. LIMITATION OF ABSTRACT
Standard Form 298 (Rev. 2-89)
Prescribed by AN SI Std. Z39-18
298-102