Embed Size (px)
Citation preview
1
ANALYSIS AND INTERPRETATION OF FINANCIAL
STATEMENT AS A MANAGERIAL TOOL FOR
DECISION MAKING
(A CASE STUDY OF NWOKEJI URBAN PLANNING AND
ARCHITECTURAL STUDIO [NUPAS]
BY
NWOKEJI OGONNA UZOCHUKWU
ACC/2008/495
DEPARTMENT OF ACCOUNTANCY
FACULTY OF MANAGEMENT AND SOCIAL SCIENCES
CARITAS UNIVERSITY, AMORJI-NIKE,
ENUGU, ENUGU STATE
AUGUST, 2012
2
TITLE PAGE
ANALYSIS AND INTERPRETATION OF FINANCIAL
STATEMENT AS A MANAGERIAL TOOL FOR
DECISION MAKING
(A CASE STUDY OF NWOKEJI URBAN PLANNING AND
ARCHITECTURAL STUDIO [NUPAS]
BY
NWOKEJI OGONNA UZOCHUKWU
ACC/2008/495
A RESEARCH PROJECT SUBMITTED TO THE DEPARTMENT OF
ACCOUNTANCY
FACULTY OF MANAGEMENT AND SOCIAL SCIENCES, CARITAS
UNIVERSITY OF AMORJI-NIKE ENUGU
IN PARTIAL FULFILLMENT OF THE REQUIREMENT FOR THE
AWARD OF BACHELOR OF SCIENCE (B.SC.) DEGREE IN
ACCOUNTANCY
AUGUST, 2012

3
APPROVAL PAGE
We hereby satisfied that the project by Nwokeji Uzochukwu
with Registration Number ACC/2008/495 is worthy of acceptance in
partial fulfillment of the requirement for the Award of Bachelor of
Science Degree (B.Sc.)
Mr. Chinedu Enekwe Dr. Frank Ovute Supervisor Head of Department
…………………………….. …………………………….. Signature/Date Signature/Date External Examiner
………………………….. Signature/Date

4
DEDICATION
I dedicate this work to God Almighty. And also to my parents
Mr. and Mrs. Jerome Nwokeji

5
ACKNOWLEDGEMENT
I acknowledge and honour the Almighty God for His grace and
kindness towards the success of this research work.
I am deeply committed in gratitude to my parents Mr. & Mrs.
Jerome Nwokeji whose abilities made me to be a baptized academic.
My sincere thanks goes to my supervisor, Mr. Chinedu Enekwe
for his encouragement and who supervised with all his effort to make
sure that my research project is successful. Also with him I share my
heartfelt to my HOD, Dr. Frank Ovute, and my lecturers Mr. Nsoke,
Mr. Desmond and Mr. James for their love, care and encouragement.
My special thanks goes to Rev. Fr. Remy N. Onyewueyi, the
chaplain and DVC Caritas University Amorji-Nike for his moral advice
and support.
Finally, I appreciate my siblings – Udenna, Aunli, Mmeli and
Nonye for their love and care throughout my stay in school and also
to my friends and well-wishers. May God bless you all.
6
Abstract
Financial Statement Analysis and Interpretation is a very vital instrument of good management decision-making in business enterprise. Good decisions ensure business survival, profitability and growth. Without financial statement analysis in investment decisions, an enterprise is likely to make decisions, which could spell its doom. Poor or lack of qualitative financial statement analysis could lead to investment returns, low profitability and even inability to identify viable investment opportunities. The main objective of this project is therefore, was to determine how firms could use financial statement analysis and interpretation to aid management decisions and to avert the problems highlighted above. Primary and secondary data are employed to broaden the scope of this study. Primary data are sourced from questionnaire responses. This provided data for the validation of the hypotheses tested with the use of chi-square (X2). The test revealed as follows: (1) Significant difference between the returns of the financial statement in Analysis and Interpretation based on management decision. (2) Organizational profitability has relationship with financial statement analysis and interpretation based management decision but not significantly. The project concludes that companies should pay great attention to the use of financial statement analysis so as to properly equip themselves with this invaluable tool. The researcher recommends the following: (a) Accountants or financial analysts should not be rushed in collection, preparation, analysis and interpretation off financial statements. (b) Financial statements should be made to reflect current cost accounting to eliminate or reduce the effects to historical cost principle and inflation risk element. (c) A combination of different ratios should be used in analyzing a company’s financial and/or operating performance. Proper use of financial statement analysis should be made not only in investment but also in other areas of decision making.
7
TABLE OF CONTENT
Title page - - - - - - - -- - i
Approval page - - - - - - - - ii
Dedication - - - - - - - - - iii
Acknowledgement - - - - - - - iv
Abstract - - - - - - - - - v
Table of content - - - - - - - - vi
Chapter One: INTRODUCTION
1.1 Background of the Study - - - - - 1
1.2 Statement of Problem - - - - - - 4
1.3 Objectives of the Study- - - - - - 4
1.4 Research Questions - - - - - - 5
1.5 Hypotheses of the Study - - - - - 6
1.6 Significance of the Study - - - - - 6
1.7 Scope of the Study - - - - - - 7
1.8 Limitation of the Study - - - - - - 7
1.9 Definition of Terms - - - - - - 8
References - - - - - - - - 10

8
Chapter Two: LITERATURE REVIEW
2.1 Introduction - - - - - - 11
2.2 What is Financial Statement?- - - - 12
2.2.1 Objective of a Financial Statement Analysis - 13
2.3 Uses and Users of Financial Statement - - 14
2.4 Classification of Financial Statement - - 15
2.5 Relationship among the Statement of Financial
Position, Income Statement, Statement of cash
Flows and Statement of Retained Earnings - 18
2.6 Techniques and financial Statement Analysis and
Interpretation - - - - - - 19
2.6.1 Horizontal Analysis - - - - - 19
2.6.2 Trend Analysis - - - - - - 20
2.6.3 Vertical Analysis - - - - - - 24
2.6.4 Ratio Analysis - - - - - - 24
2.7 Definition of Ratio - - - - - 24
2.8 Types and Classification --- - - - 26
2.8.1Liquidity Ratios - - - - - - 27
2.8.2 Leverage Ratios - - - - - - 30
2.8.3 Activity Ratios - - - - - - 32
9
2.8.4 Profitability Ratios - - - - - 34
2.9 Nature of Accounting Ratios - -- - - 37
2.10 Uses of Ratio in Analyzing Financial Statement 39
2.11 Limitations of Financial Statement Analysis - 40
2.12 Use of Different Accounting Principles - - 40
2.13 Industry Affiliation - - - - - 41
2.14 Accounting Differences Between Countries - 42
2.15 The Impact of Inflation of Financial Statement
Analysis - - - - - - - - 42
2.16 Features of a Good Management Decision
Technique - - - - - - - 44
2.17 Environment of Management Decision Making - 45
References - - - - - -- - 47
Chapter Three
3.1 Research Design - - - - - - 4
3.2 Sources and Method of Data Collection --- - 48
3.3 Research Instrument - - - - - 49
3.4 Reliability/Validity of Research Instrument - 49
3.5 Population - - - - -- - - 50
3.6 Sample size and Technique - - - - 50

10
3.7 Administration of Research Instrument - - 53
3.8 Method of Data Analysis - - - - 53
3.9 Decision Criteria for Validation of Hypothesis - 56
References - - - - - - -- 57
Chapter Four: DATA PRESENTATION AND ANALYSIS -58
4.1 Data Presentation - - - - - 60
4.2 Analysis of Question - - - - - 61
4.3 Test of Hypothesis - - - - - 71
Chapter Five: SUMMARY OF FINDINGS, CONCLUSION AND
RECOMMENDATIONS
5.1 Summary of Findings - - - - - 76
5.2 Conclusion - - - - - - - 77
5.3 Recommendations - - - - - 77
Bibliography - -- - - - - 79
Appendix - - -- - - - - - 80

11
CHAPTER ONE
1.0 INTRODUCTION
1.1 Background of the Study
The complex nature of today’s business world and the
transformation of the entire world into a global village have been of
great concerns to manages of all forms of business organizations.
According to Ojuigo (2001), the problems of managers are multi:-
varied because of inefficiency in management of poor decision
outcomes of these organizations. Therefore, the managers are
unable to achieve the organizational objective within a period of time.
As diverse as business is, its controllable and uncontrollable
factors influence all decisions which ultimately lead to the realization
of set objectives. To achieve this, management needs reliable,
authentic and relevant information from the financial statements to
efficiently facilitate decision making.
It must be noted that every business stores at making at least
from investments “sustainable profits” so as to stay afloat and
continue in business. Therefore, profit being the concern of every
manager is a factor in business. To achieve this, available
information from the financial statements of organizations must be
analysed, interpreted and used as a basis for decision making
(Needham and Dransfield 1991). Financial statement analysis is
often considered as a vital tool used in evaluating a company’s
12
performance and ensuring that decisions are based on facts rather
than rule of thumb.
A financial analyst needs financial statements of companies to
be able to identify operating and financial problems which may affect
the companies (Mbat, 2001:60). Thus, any person who analyses the
financial statements of firms should be able to identify the cause and
effect of financial and operating problems of such firms.
The cause of any financial or operating problem is an event,
which produces an effect (the problem). However, in order to identify
the cause and effect, the system, which represents an indictor f the
problem, should be observed. This process is referred to as
interpretation (Pandey, 2005). According to (Mbat, 2001), it is the
responsibility of the financial manager or analyst to enable them
make better management decisions.
The symptoms could be:
- Declining liquidity
- Declining profit
- External debt recovery period
- Increased volume of inventory
- Declining return on total assets
- Increasing operating expenses etc
The identification of causes should also be important in order to
appropriately evolve corrective measures.
Financial analysis and interpretation assist in the:

13
- Identification of organizational performance through the use of
analystical data.
- Identification of empirical relationships between operating
results and those items which have influenced the achievement
of the results.
- Identification of historical data order to determine which internal
or external factors have exerted positive or negative influence
on the operating results (Mbat 2001:61).
Categorically, there are three forms of financial analysis. These
include: multivariate, univariate and ratio analysis (Welsh, 1987).
Moreover, ratios are the end results of basis analysis. The ratio
requires an interpretation on the basis of their trends and in the lights
of what is known of the business as a young concern. It should be
noted that financial statements represent the positions of a firm at a
particular point in time.
However, the success or failure of a business depends largely on
the quality of decisions made by management, which in turn depends
on reality of accounting information available on them.
Research into this area is quite relevant given the apparent
investment failures experienced by many business organizations.
The collapse of many business either private or public is due to poor
decision. The question is whether management has used information
provided in the financial statement extensively to enable rational
decision making?

14
1.2 Statement of the Problem
The principal aim of making investment decision is to get
adequate returns from it. According to Needham and Dransfield
(1991), “people as a rule will only tie up their money in a business if
they are satisfied with the returns they get from it”.
In an attempt to achieve maximum returns from investment in
production, services shares or stock and/or other securities outside
the firm, a comprehensive analysis of the company which is intended
to be invested in should be carried out using the company’s financial
statements to ascertain both its explicit and implicit investment
opportunities. However, organizations that do not use financial
statement analysis in making investment decisions could be ill
formed. As a result, the following problems may arise:
(i) Inability to identify viable investment opportunities
(ii) Decreasing returns from investments.
(iii) Decline in organizational overall profitability.
(iv) Increased investment risk: The organization might not
achieve its corporate objective at the end of the period.
If the trend continues, it will likely lead to the failure of the
organization. Therefore, there is a great need for organizations to
consider and analyse company’s financial statements before
investing in that company. These are the focus of this study.
1.3 Objectives of the Study
On noting that most investments made by firms end in failure, it
is the overall objective of this study to determine how firms can use

15
financial statement analysis and interpretation to aid management
decisions. Specifically, the study is designed to:
i) Find out how the use of financial statement analysis assists
organizations in identifying investment opportunities.
ii) Find out how increasing investment returns can be achieved
using financial statement analysis.
iii) Find out the extent to which a company’s overall profitability
can be hampered if it does not analyse another company’s
financial statement before investing in it.
iv) Find out how business failures can be curbed or minimized and
corporate objective achieved through successful investment.
v) Identify alternative ways of minimizing investment risk.
1.4 Research Questions
The following questions are put forward for the purpose of the
study.
1) Is financial statement analysis important/necessary in every
organization?
2) Who are the users of financial statement?
3) How can a financial statement of an organization be
interpreted?
4) How can its interpretation be used in making effective
management decisions?
1.5 Hypotheses of the Study

16
To id the achievement of the desired objectives, the following
hypothesis are formulated:
HO: Represents Null hypothesis
HI: Represents Alternative hypothesis
Research hypothesis No 1
HO: There is no significant difference between the returns of a financial
statement analysis and interpretation based on management
decisions.
H1: There is a significant difference between the returns of a financial
statement analysis and interpretation based on management
decisions.
Research hypothesis No 2
HO: There is no significant relationship between a firms profitability an financial statement analysis and interpretation based management decisions.
HI: There is a significant relationship between a firms profitability and financial statement analysis and integration based management decision.
1.6 Significance of the Study
The study of the use of financial statement analysis and
interpretation in management decision is meant to contribute immensely to
sustained business operations in selected firms south south region and
general growth in business, be it private or public. The study shall be
beneficial in the following ways:
i) It will redirect management on the need for the use of financial
statement analysis and interpretation of rational investment
decision.

17
ii) It will inform management on the possible and available
investment ratio, their functions and uses for a greater
evaluation of a company’s capabilities and profitability.
iii) The work will also serve as a reference material to other
persons who will conduct studies in similar areas both within
and outside the university.
1.7 Scope of the Study
The study is conducted to cover selected firms both in South-
South region.
However, this study is conducted to cover the use of financial
statement which includes; (Balance sheet, income statement,
statement of cash flow and statement of retained earnings) analysis
civil interpretation management decision.
1.8 Limitation of the Study
The research work has some limitations due to some problems
encountered from the sources of collecting useful materials also
some unforeseen circumstances which posted as a threat during
preparation of this research project includes:
- TIME: A research of this kind would require enough time to
cover many areas of activity effectively, but since the
researcher is a student with other classroom works to do, the
time allocated for the study was limited.
18
- FINANCE: During the course of this research, another
stumbling block. Judgment financial resources was
encountered. The researcher has to make due with little
financial provision available to achieve a qualitative and
acceptable research finding.
- Health was also a limiting factor, for instance, the researcher
falling ill in the cause of the study, which stopped the research
for some time.
- TRANSPORATION: The source of collecting useful material or
information is far and the transport logistics expensive, in some
cases, the journey was fruitless if the staff was not available.
1.9 Definition of Terms
* RATIOS: A ratio is the relationship between two amounts that
results from dividing one by the other. It is an accounting term
used to describe the financial index which compares two
financial variables such as current assets and current liabilities.
Examples of ratios are quick ratio, and test etc.
* ACCOUNTING RATIOS: “they are the relationship between
figures expressed as ratios”
* INVESTMENT DECISIONS: This relates to allocation of capital
and involves decisions to commit funds to long term assets,
which will yield benefits in future.
* RATIO ANALYSIS:

19
It is an analytical tool designed to identify significant
relationships between two financial statement amounts.
* SECURITY: Security is a financial asset which earns a fixed
and/or variable periodic income till terminal maturity period if
any.

20
REFERENCES
Mbat, D.O. (2001). Finance management. Uyo: Dome
Associates publishers.
Needham, D. and Dransfield R. (1991). Business studies. UK:
McGraw publication.
Ojuigo, M.C. (2002). Accounting Guide to management technique
Enugu: Hugolex publication.
Pandey, I.M. (2005). Financial management. London: Vitus
publishing House PVT Limited.

21
CHAPTER TWO
LITERATURE REVIEW
2.1 Introduction
The use of financial statement analysis and interpretation in
investment decision has been addressed by a series of authors in
one way or the other. In some instances, the sue of this analysis to
determine profitability of a company and specifically returns on
investment and optimal management decisions have been stated.
According to Pandey (2005), profitability is the ability of an
entity to earn income. It can be assessed by computing various
relevant measures including the ratio of net sales to assets, the rate
earned on total assets etc.
Meigs and Meigs (2003) stated that the rate of return on
investment (ROI) is a test of management’s efficiency in using
available resources. This review is organized under the following
sub-heads for ease of comprehension.
1. What is financial statement?
2. Objective of financial statement analysis
3. Uses and users of financial statement analysis
4. Classification of financial statement
5. Techniques of financial statement analysis and interpretation.
6. Limitations of financial statement analysis
7. Features of a good management decision

22
8. Decision making environment
9. Impact of inflation on financial statement analysis
2.2 What is Financial Statement?
According to Meigs and Meigs (2003), financial statement are a
structured representation of the financial position and financial
performance of an entity. The objective of financial statements is to
provide information about the financial position, financial performance
and cash flows of an entity that is useful to a wide range of users in
making economic decisions.
Financial statements also show the results of the
management’s stewardship of the resources entrusted to it. To meet
these objectives, financial statements provide information about an
entity’s:
i) Assets
ii) Liabilities
iii) Equity
iv) Income and expenses, including gains and losses
v) Contribution by and distribution to owners in their capacity
as owners, and vi) cash flows
A complete set of financial statement comprises:
1) A statement of financial position as at the end of the period:
2) A statement of comprehensive income for the period;
3) A statement of changes in equity for the period:
4) A statement of cash flow for the period.

23
5) Notes of Account comprising a summary of significant
accounting policies and other explanatory information; and
6) A statement of financial position as at the beginning of the
earliest comparative period when an entity applies an
accounting policy retrospectively or makes a retrospective
restatement of items in its financial statements or when it
reclassifies items in its financial statements.
2.2.1 Objective of a Financial Statement Analysis
Business decisions are made on the basis of the best available
estimates of the outcome of such decisions. According to Meigs and
Meigs (2003), the purpose of financial statement analysis is to
provide information about a business unit for decision making
purpose and such information need not to b limited to accounting
data. White ratios and other relationships based on past
performance may be helpful in predicating the future earnings
performance and financial health of a company, we must be aware of
the inherent limitations of such data.
According to Meigs and Meigs (2003), the key objectives of
financial analysis are to determine the company’s earnings
performance and the soundness and liquidity of its financial position.
We are essentially interested in financial analysis as a predictive tool.
Accordingly, we want to examine both quantitative and
qualitative data in order to ascertain the quality of earnings and the
quality and protection of assets. In periods of recession when
business failures are common, the balance sheet takes on increase

24
importance because the question of liquidity is uppermost in the
minds of many in the business community. However, when business
conditions are good, the income statement receives more attention.
Nevertheless, a financial analyst has to grapple on the above
complexities of using financial statement analysis to achieve a
specific purpose.
2.3 Uses and Users of Financial Statement
According to Akpan (2002), financial statement may be used by
users for different purposes:
a) OWNERS AND MANAGERS: Require financial statement to
make important business decisions that affect its operations.
Financial analysis is then performed on these statements to
provide management with a more detailed understanding of the
figures. These statement are also used as part of
management’s annual report to the stockholders.
b) EMPLOYERS: Also need these reports in making collective
bargaining agreements (CBA) with the management, in the
case of labour unions or for individuals in discussing their
compensation promotion and rankings.
c) PROSPECTIVE INVESTORS: They make use of financial
statements to assess the viability of investing in a business.
Financial analysis are often used by investors and are prepared
by professionals (financial analyst), thus providing them with
the basis for making investment decisions.
25
d) FINANCIAL INSTITUTIONS: Financial institutions (banks and
other lending company) use them to decide whether to grant a
company with fresh working capital or extend debt securities
(such as a long term bank loan or debentures) to finance
expansion and other significant expenditures.
e) GOVERNMENT ENTITIES: Government entities (Tax
authorities) need financial statements to ascertain the property
and accuracy of taxes and other duties declared and paid by a
company.
f) VENDORS: They require financial statement to access the
credit worthiness of the business
g) MEDIA AND GENERAL PUBLIC: They are also interested in
financial statements for a variety of reasons.
2.4 Classification of Financial Statement
According to Diamond (2006), all watchful business owners
have an innate sense of how well their business is doing. Almost
without thinking about it, these business owners can tell you any time
during the month how close they are to butting budgeted figures.
Certainly, cash in bank plays a part, but its more than that.
Helpful is the nowtine review of financial statements. They are
three types of financial statements. Each will give important
information about how efficiency and effective the business is
operating.

26
1) INCOME STATEMENT:
The income statement shows all items of income and expense
for arts or crafts business. It reflects a specific time period. So an
income statement for the quarter ending March 31, shows revenue
and expense for January, February and March, if the income
statement is for the calendar year-ending December 31, it would
contain all the information from January 1 to December 31. Note that
the normal accounting period for income statement is 12 months or
year.
Income statements are also known as profit and loss account.
The button line on an income statement is income less expenses. If
when income is more than expenses it is known as net profit and
when expense is more than income it is a net loss.
2) BALANCE SHEET
Accounting is based upon a double entry system. For every
entry into the books there has to be an opposite and equal entry. The
net effect of the entries is zero, which results your books being
balanced. The proof of this balancing act is shown in the balance
sheet when Asset = Liability + Equity.
The balance sheet shows the health of a business from day
one to the date on the balance sheet. Balance sheet are always
dated on the late day of the reporting period. If you have been in
business since 1st January 2011 and your balance sheet is dated as
of 31 December of the current year the balance sheet will show the

27
results of your operations from 1st January 2011 to December 31,
2011.
3) STATEMENT OF CASH FLOWS
The statement of cash flows the ins and outs of cash during the
reporting period. You may be thinking-well who needs that type of
report? I will just look at the checkbook. Good point, unless you are
reporting things that don’t immediately affect cash such as
depreciation, accounts receivable, accounts payable.
If I could only choose one of those three financial statements to
evaluate the ability of a company to pay dividends and meet
obligations (indicating a healthy business), I would pick the statement
of cash flows. The statement of cash flows takes aspects of the
income statement and balance sheet and kind of crams them
together to show cash sources and uses for the period.
4) THE STATEMENT OF RETAINED EARNINGS
The statement of retained earnings shows the break down of
retained earnings. Net income for the year is added to the beginning
of year balance, and dividends are subtracted. This results in the end
of year balance for retained earnings.
Remember that expenses, revenues and dividends impact
retained earnings. Since net income equals revenue minus
expenses, we need to include dividends when computing end of
period retaining earnings, plus net income and minus dividends.
28
2.5 Relationship among the Statement of Financial Position,
Income Statement, Statement of Cash Flows and Statement
of Retained Earnings.
As mentioned above, the balance sheet shows the financial
position at a point in time. It therefore cannot contain information that
is related to some period, such as sales or wages expense.
It is a common practice to include beginning of a period balance
sheet as well as an end period balance sheet in a financial report.
This way the reader can form an opinion about how the firms financial
position has changed.
The cash flow statement and the income statement-statement
both give information about the firms performance over the period,
albeit from different angles. The cash flow statement explains the
change in cash. In other words, it explains how the beginning of
period cash has turned into the end of period cash by differentiating
between operating, investing and financial activities.
The income statement shows a presentation of the sales, the
main expenses and the resulting net income over the period. Net
income is based on accounting principles which gives guidance/rules
on when to recognize revenues and expenses, whereas cash from
operating activities, obviously is cash based.
As dividends do not reduce net income, the income statement
does not always explain the change in retained earnings over the
year (Net income always equals the change in retained earnings
when no dividend is paid out). The statement of retained earnings is

29
included to show how equity has changed because of net income and
possible dividend payments. It shows the beginning value of retained
to which net income is added and dividends subtracted, resulting in
end of year retained earnings.
2.6 Techniques of Financial Statement Analysis and
Interpretation
Financial statement users and analysts have developed a
number of techniques to help them analyse and interpret financial
statements. According to Diamond (2006) the most common of these
includes, horizontal, vertical and ratio analysis. All of these
techniques focus on relationships among items in the financial
statement themselves.
In trying to understand the current financial position of firm and
its future outlook, it is important, to consider changes from year to
year as well as trends over several years. One way to accomplish
this is to use comparative financial statements and the five-or-ten
year summary of data found in the firms annual report to spot
important or emerging trends, ibidi.
2.6.1 Horizontal Analysis
Horizontal analysis focuses on the naira (N) and percentage
changes that have occurred in certain accounts from year to year,
Pendey (2005). Using percentage changes is better for comparative
purposes than using actual naira changes.

30
In order to calculate percentage changes the following formula
should be used:
Percentage change = Amount of Naira Change x 100
Based-year amount 1
The base year always is considered to be the first year in the
comparisons. For example, NUPAS total current assets were
N11848 6+6000 at the end of fiscal year 2010 and N13496 589 000
at the end of fiscal year 2011. This represents a naira increase of
N1647 913 000 and a percentage increase of 13.9% calculated as
follows:
13496589000 x 100
11848 676000 1
= 13.9%
Horizontal analysis can be used in conjunction with the balance
sheet and the income statement as an example exhibit 2.5 and 2.6
presents comparative balance sheet for NUPAS Nigeria Plc.
2.6.2 Trend Analysis
This involves computing ratios and comparing them with
previous year ratios of the same company to assess the performance
of the company. Diamond (2006)
When more than two years are involved, index numbers are
used instead of percentage changes, ibid. Essentially, one year is
31
selected as the base year and is set to 100%. To measure real
growth the value of the index can be compared with either the
consumer price index or any specific price index for the industry.
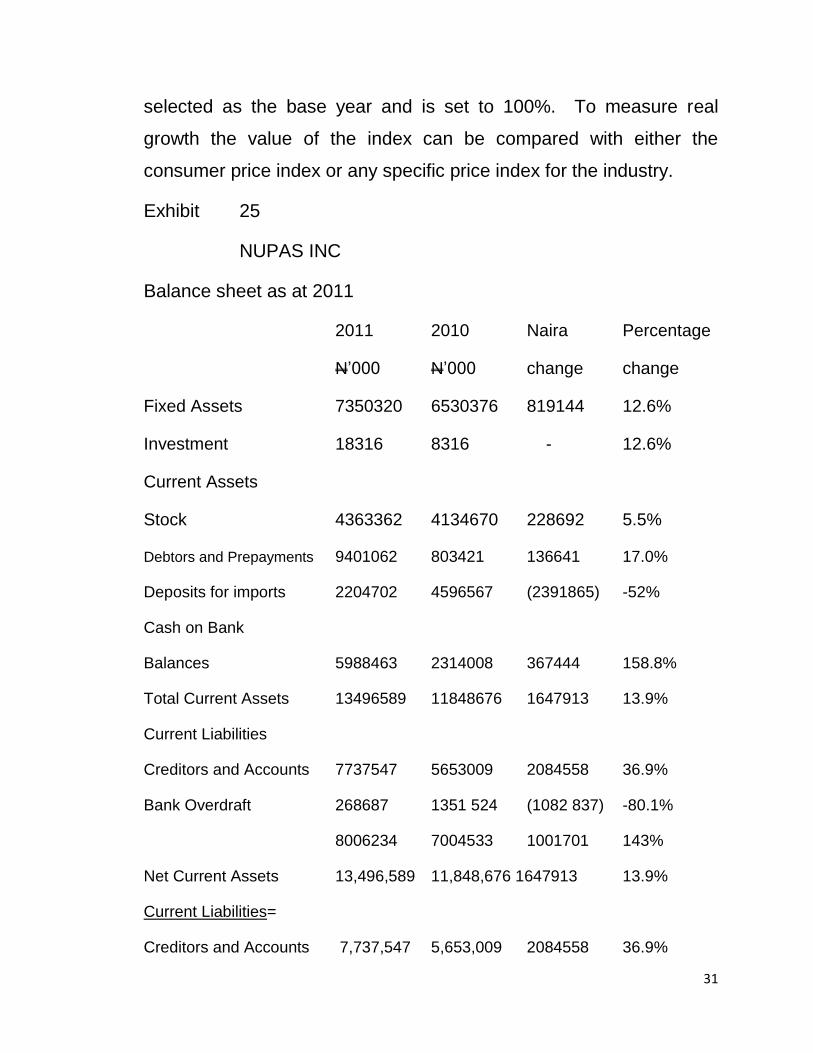
Exhibit 25
NUPAS INC
Balance sheet as at 2011
2011 2010 Naira Percentage
N’000 N’000 change change
Fixed Assets 7350320 6530376 819144 12.6%
Investment 18316 8316 - 12.6%
Current Assets
Stock 4363362 4134670 228692 5.5%
Debtors and Prepayments 9401062 803421 136641 17.0%
Deposits for imports 2204702 4596567 (2391865) -52%
Cash on Bank
Balances 5988463 2314008 367444 158.8%
Total Current Assets 13496589 11848676 1647913 13.9%
Current Liabilities
Creditors and Accounts 7737547 5653009 2084558 36.9%
Bank Overdraft 268687 1351 524 (1082 837) -80.1%
8006234 7004533 1001701 143%
Net Current Assets 13,496,589 11,848,676 1647913 13.9%
Current Liabilities=
Creditors and Accounts 7,737,547 5,653,009 2084558 36.9%
32
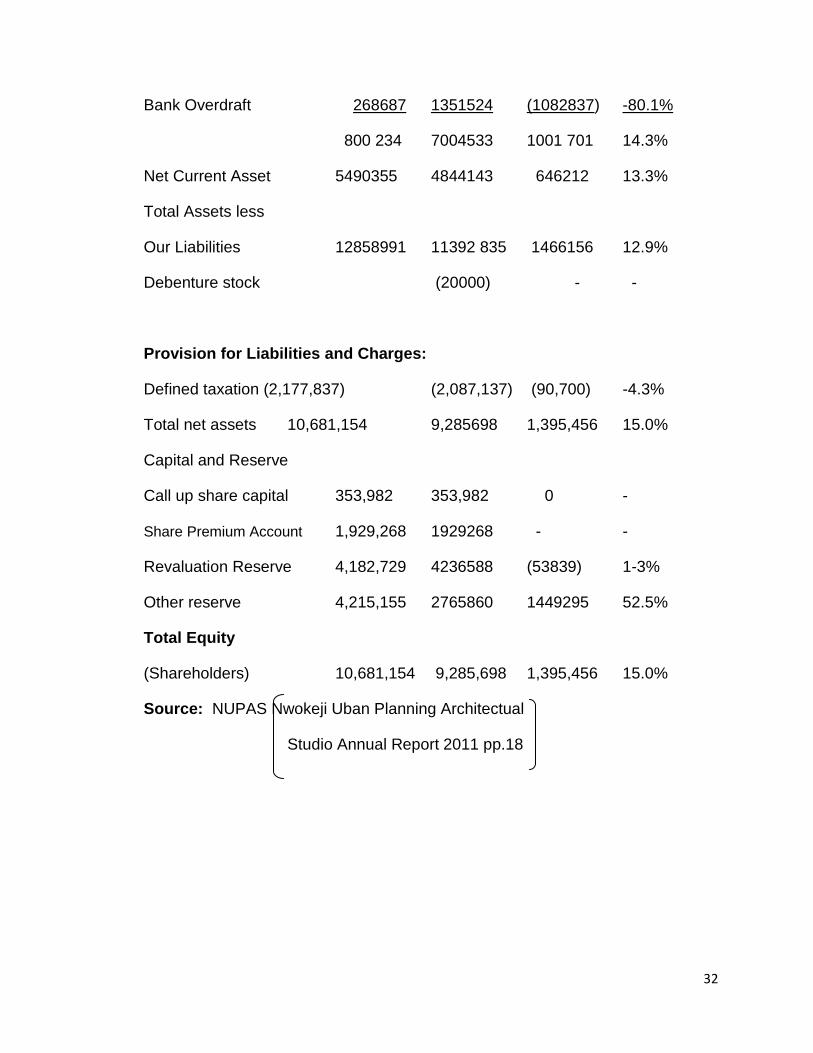
Bank Overdraft 268687 1351524 (1082837) -80.1%
800 234 7004533 1001 701 14.3%
Net Current Asset 5490355 4844143 646212 13.3%
Total Assets less
Our Liabilities 12858991 11392 835 1466156 12.9%
Debenture stock (20000) - -
Provision for Liabilities and Charges:
Defined taxation (2,177,837) (2,087,137) (90,700) -4.3%
Total net assets 10,681,154 9,285698 1,395,456 15.0%
Capital and Reserve
Call up share capital 353,982 353,982 0 -
Share Premium Account 1,929,268 1929268 - -
Revaluation Reserve 4,182,729 4236588 (53839) 1-3%
Other reserve 4,215,155 2765860 1449295 52.5%
Total Equity
(Shareholders) 10,681,154 9,285,698 1,395,456 15.0%
Source: NUPAS Nwokeji Uban Planning Architectual
Studio Annual Report 2011 pp.18
33
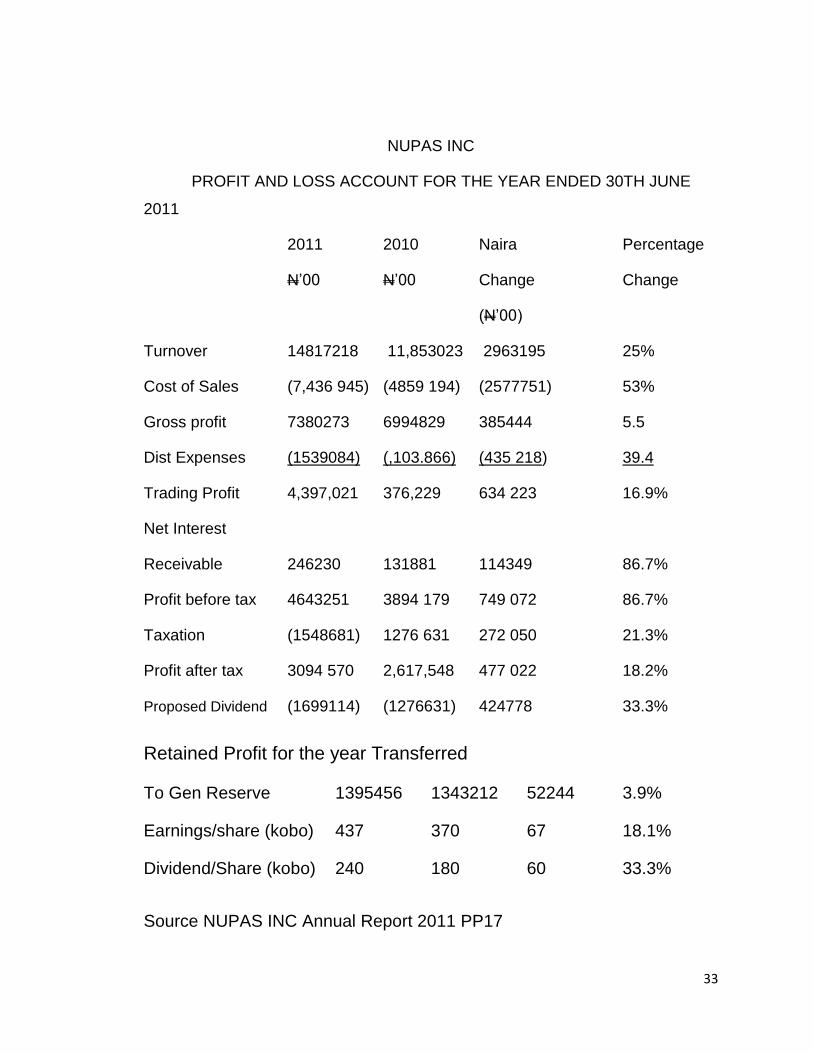
NUPAS INC
PROFIT AND LOSS ACCOUNT FOR THE YEAR ENDED 30TH JUNE
2011
2011 2010 Naira Percentage
N’00 N’00 Change Change
(N’00)
Turnover 14817218 11,853023 2963195 25%
Cost of Sales (7,436 945) (4859 194) (2577751) 53%
Gross profit 7380273 6994829 385444 5.5
Dist Expenses (1539084) (,103.866) (435 218) 39.4
Trading Profit 4,397,021 376,229 634 223 16.9%
Net Interest
Receivable 246230 131881 114349 86.7%
Profit before tax 4643251 3894 179 749 072 86.7%
Taxation (1548681) 1276 631 272 050 21.3%
Profit after tax 3094 570 2,617,548 477 022 18.2%
Proposed Dividend (1699114) (1276631) 424778 33.3%
Retained Profit for the year Transferred
To Gen Reserve 1395456 1343212 52244 3.9%
Earnings/share (kobo) 437 370 67 18.1%
Dividend/Share (kobo) 240 180 60 33.3%
Source NUPAS INC Annual Report 2011 PP17

34
2.6.3 Vertical Analysis
According to Diamond (2006), vertical analysis is used to
evaluate the relationships within a single financial statement.
Essentially, the appropriate total figure in the financial statement is
set to 100% and other items are expressed as a percentage of that
figure, ibidi. For the balance, this figure usually is total assets or the
total of liabilities plus stockholders equity. Net sale usually is the total
figure used in the income statement.
Exhibit 2.8 and 2.9
2.6.4 Ratio Analysis
According to Diamond (2006), Ratio analysis is a method of
expressing relations among various items in a company’s financial
statement. However, ratios are not substitutes for looking dipper into
the financial position of the company. There is a danger that
inexperienced financial statement analysts might use what is called a
rule of the thumb analysis to make important decisions. However,
according to Diamond, there are few rules of thumb that are adequate
in today’s complex financial world. It is important to keep that caveat
in mind when performing ratio analysis.
2.7 Definition of Ratio
Ratios has been defined by different authors in many ways:

35
Hornby A.S. et al (2002) defines ratio as a “relation between
two amount determined by the number of times one contains the
other”.
Another author, Pandey (2005) defines ratio as “the indicated
quotient of two mathematical expression” and as “the relation
between two or more things”. From the researchers point of view,
ratio can be defined as a mathematical expression that has a
relationship between two or more accounting figures, which makes
the interpretation of financial statements meaningful to the users.
Furthermore, ratios are among the most popular and widely
used tools of financial analysis. They provide with clues and
symptoms of underlying conditions. A ratio can help us uncover
conditions and trends difficult to detect by inspecting individual
component making up the ratio. Like other analytical tools, ratio are
usually future oriented that they are often adjusted for their probable
future trend and magnitude. Usefulness of ratios depends on our
skilful interpretation of them, and is the most challenging aspect of
ratio analysis.
A ratio expresses a mathematical relation between two
qualities. For instance, a change in account balance from N100 to
N20 can be expressed as: (a) 150% (b) 2.5 times or (c) 2.5 to 1 (or
2.5=1). While computation of a ratio is a simple arithmetical
operation, its interpretation is not. To be meaningful, a ratio must
refer to an economically important relation. For example, there is a
direct and circular relation between an items sales price and its cost
price.
36
Accordingly, the ratio of cost of goods sold to sales is a
significant one in contrast, there is no obvious relation between
freight cost and the balance of marketable securities. Diamond
(2006)
2.8 Types and Classification
Ratios calculated from the accounting data can be grouped into
various classes according to its financial activities or their function of
evaluation. Short and long term creditors, shareholders and
management are the parties that are more interested in financial
analysis. The short-term creditors main interest is in the liquidity
position of the company. On the other hand, the long term creditors
rely on the solvency and profitability position of the company.
Similarly, the shareholders concentrate on the company’s profitability
and financial condition. While the management is interested in
evaluating every aspect of the company’s performance. They have to
protect the interest of all parties and sees that the firm grows
profitably.
Pandey (2005), classifier ratio into the following:
I) Liquidity ratios
II) Leverage ratios
III) Activity ratios
IV) Profitability ratios
Hornby (2002) shares the same view of classification. Thus,
(I) Short term solvency and liquidity ratios
(II) Long term solvency and stability ratios
37
(III) Profitability ratios
(IV) Investors/shareholders/potential and actual growth ratios.
Furthermore, according to Hornby (2002), no one of such classes
of ratios gives sufficient information by which to judge the financial
condition and performance of the firm. Only when the group of ratios
are analysed can reasonable judgments be made. Seasonal
character of a business must be taken into account.
Underlying trends may be assessed only through a comparison of
raw figures and ratios of the same time of the year. Ratio
comparisons should not be made between December 31 balance
sheet with May 31 balance sheet; rather, it should be compared with
December 31 and December 31 balance sheet. Although the number
of financial ratios that might be computed increases geometrically
with the amount of financial data. Emphasis will be laid on the most
important and necessary ones. Thus, the researchers concern will be
on:
2.8.1 Liquidity Ratios
This measures the ability of the company to meet its current
liabilities (short term obligations) as they fall due, out its current
assets (Mabt 2001). Analysis of liquidity needs the preparation of
cash budgets and cash funds flow statements, but liquidity ratios by
establishing a relationship between cash and other current assets to
current obligations, provide a quick measure of liquidity. The failure
of a company to meet its obligations due to lack of sufficient liquidity,

38
will result in wrong decision making, poor credit worthiness, loss of
creditors confidence, or even in legal tangles resulting in the
disclosure of the company.
Also, a high degree of liquidity is bad because idle assets earn
nothing since the company’s fund will be unnecessarily tied up in
current assets. Hence, there is a need for equal between high
liquidity and lack of liquidity. The two common ratios which indicate
the extent of liquidity or lack of liquidity are:
(i) Current Ratio=
Current ratio is calculated thus
Current ratio = Current Assets Current liabilities
The ratio f 2:1 is considered an idle for current ratio and it is a
conventional rule. It represents a margin of safety of creditors. The
higher the current ratio, the greater the margin of safety: the larger
the amount of current assets in relation current liabilities the most the
firm’s ability to meet its current obligations. However, current ratio
should not be followed blind because a company with less than 2:1
ratio may be doing well and the one of high ratio only struggles to
meet its obligations because current ratio only measures the quality
and not the quality.
ii) Quick Ratio = This is also known as acid test ratio; it
establishes a relationship with quick or liquid assets and current
liabilities. It indicates the ability of the company to meet its short term

39
liabilities from its current assets without having to sell stock. It is
computed as:
Quick Ratio = Current Asset – Inventories
Current Liabilities
It is vital index of the firms liquidity. The ratio of 1:1 is
considered to represent a satisfactory current financial condition. But
1:1 in essence does not imply sound liquidity position because a high
value of quick ratio in a company may have problem of funds
shortage, if it has a slow paying doubtful and longer period
outstanding debtors. At the same time, if the firms are able to meet
its current obligations in time by turning over their inventories
efficiently they can prosper. Although quick ratio is a more
penetrating test of liquidity than the current ratio, yet it should be used
cautiously. Others are=
i) Cash Ratio = Since cash is the most liquid asset, a financial
analyst may examine cash ratio and its equivalent to current
liabilities. Trade investment or marketable securities are equivalent
of cash therefore, they may be included in the computation of cash
ratio.
Cash ratio = Cash + Marketable Securities
Current Liabilities
ii) Interval Measure: This assesses a firms ability to meet its
regular cash expenses. It relates liquid assets to average daily
operating cash outflows. The daily operating expenses will be equal
to cost of goods sold plus selling, administrative and general

40
expenses less depreciation (and other non-cash expenditure) divided
by number of days in the year (say 360).
Interval Measure = Current asset – Inventory
Average daily operating expenses
iii) Net Working Capital Ratio: This ratio measures the firm’s
potential reservoir of funds. It is the difference between current
assets and current liabilities excluding short term bank borrowing, it
can be related to net assets (or capital employed)
NWC = Net working capital
Net Assets
2.8.2 Leverage Ratios =
This ratio indicates mix of funds provided by owners and
lenders. It measures the relationship between long term debt and
equity and firms total capital financing. There is a general rule which
states that, there should be an appropriate mix of debt and owner’s
equity in financing the firm’s assets. The manner in which assets are
financed has a number of implications. First between debt and
equity, debt is more risky from the firms point of view. Secondly, the
use of debt is advantageous for shareholders in two ways:
- They can retain control of the firm with a limited state
- Their earning will be magnified, when the firm earns a rate of
return on the total capital employed higher than the interest rate
on the borrowed funds.
41
Average ration can be calculated from the balance sheet items to
determine the proportion of debt in total financing. And can equally
be calculated from the profit and loss account to determine the extent
to which operating profit are sufficient to cover the fixed charges
(Pendey 2005).
It has the following ratios:
i) Debt Ratio=
This ratio measures the proportion of the firm’s total assets
which are paid for by both long and short term debt. It is calculated
as:
Debt Ratio= Total Debt (TD)
Net Assets (NA)
ii) Debt – Equity Ratio:
This ratio expresses the direct proportion of debt to owner’s
equity. It is indirectly computed by dividing total debt by net worth.
That is:
Debt –Equity Ratio = Total debt
Net worth
(iii) Coverage Ratio:
The interest coverage ratio or the time interest earned is used
to test the firm’s debt-servicing capacity. It measures the extent to
which the net profit may drop before the firm becomes unable to
serve the loan. It is calculated as:

42
Coverage ratio = EBIT
Interest
Where: EBIT = Earnings Before Interest and Tax
2.8.3 Activity Ratios:
These are employed to evaluate the efficiency with which the
firm manages and utilizes its assets. They are also called the
turnover ratios in that the indicate the speed with which the assets
are being converted or turned over into sales. Thus, the activity ratio
is said to have a relationship between sales and assets. The
effectiveness of asset utilization is judged by the calculation of activity
ratios. Activity ratios has the following:
(i) Inventory Turnover:
This indicates the efficiency of the firm in producing and
selling its products. It is given by dividing the cost of goods
sold by the average inventory. In a manufacturing company,
inventory of finished goods is used to calculate inventory
turnover:
Inventory turnover = Cost of goods sold
Average inventory
The average inventory is the average of opening and closing
balances of inventory.
ii) Debtor (Account Receivable) Turnover: It indicates the number
of times debtors turnover each year. Generally, the higher the value
43
of debtors turnover, the more efficient is the management of credit.
Thus, debtors turnover can be calculated by dividing total sales by
the year and balance of debtors (Pandey, 2005:526)
debtors Turnover = Sales
Debtors
iii) Average Collection Period: It measures the quality of debtors
because it indicates the speed of their collection. This ratio is useful
to an analyst in two ways:
i. In determining the collectibles of debtors and thus, the
efficiency of collection efforts, and
ii. To find out the firms comparative strength and advantage
relative to its credit policy and performance vis-à-vis the
competitor’s credit policies and performance. Thus, the shorter
and average collection period, better the quality of debtors
since a short collection period implies the prompt payment by
debtors (Pandey 2007). It is computerized as=
Average collection Period = 360
Debtors Turnover
= Debtors x 360 Sales 1
iv) Total Assets Turnover = Sales
Total Assets
44
v) Net Assets Turnover=
The most important aspect of its operating performance is
measured by the ability of the firm to produce a large volume of sales
for a given amount of net sales.
It is given by:
Net Assets Turnover = Sales
Net Assets
vi) Fixed and Current Assets Turnover:
It measures the willingness of the firm to efficiently utilize its
fixed assets and current assets separately. It is computed by the
following:
a) Fixed Assets turnover = Sales
Net Fixed Assets
b) Current Assets turnover = Sales Current Assets
vii) Working Capital Turnover:
This indicates the extent in which current assets (or working
capital gap) relate to sales calculated by:
Working Capital Turnover = Sales
Net Current Assets.
2.8.4 Profitability Ratios
These rations indicate the net result of a large number of
policies and decisions. They are calculated to measure the operating

45
efficiency of the company. Besides management, creditors, owners
and even customers are also interested in the profitability of the
company.
Usually, profitability ratios are calculated in two major ways:
a) Profitability in relation to investment
b) Profitability in relation to sales
Profitability ratio is classified into the following:
i) Gross Profit Margin: Gross Profit Margin reflects the efficiency with
which management produces each unit of product. It indicates the
average spread between the cost of goods sold and the sales
revenue.
It is given by:
Gross Profit Margin = Sales-cost of goods sold
Sales
= Gross Profit
Sales
ii) Net Profit Margin: This ratio indicates the firm’s ability withstand
adverse economic conditions. It establishes a relationship between
net profit and sales and also indicates management’s efficiency in
manufacturing, administering and selling of products. Net profit
margin ratio is the overall measure of the firm’s ability to turn each
Naira sales into Net profit, it is measured by dividing profit after tax by
sales:
46
Net profit margin = Profit After Tax
Sales
iii) Return on Capital Employed (ROCE):
This ratio measures the firm’s operating performance. It
indicates the firm earning power. It is calculated as:
ROCE = Operating Profit x 100
Capital employed 1
iv) Return on Equity: This ratio is one of the most important
relationships in financial analysis. It indicates how well the
company has used the resources of owners. The return on
equity ratio is of great interest to the present as well as the
prospective shareholders and also of great concern to
management, which has the responsibility of maximizing the
owner’s welfare. It is given as=
ROE = Profit After Tax (PAT)
Net Worth (Equity) NW
v) Earnings Per Share = This allows the profitability of the firm on
a per share basis. The earnings per share of a company should
always be compared with the industry average and the
earnings per share of another company. It is calculated by:
EPS = Profit After Tax (PAT)
Number of Outstanding Shares
47
vi) Dividend Per Share: This is the earnings distributed to ordinary
shareholders against the outstanding number of ordinary shares. It is
given by=
dividend per share = Earnings paid to shareholders (Dividend)
Number of ordinary shares outstanding
vii) Dividend and Earnings Yield: This ratio evaluates the
shareholders return in relation to the market value of the share> It is
given by the following:
a) Dividend yield = Dividend per share (DPS)
Market value per share (MV)
b) Earnings yield = Earnings per share (EPS)
Market value per share (MY)
viii) Price Earning Ratio: The price earning ratio is widely used by
the security analysts to value the firm’s performance as
expected by investors. It indicate investor’s judgment or
expectations about the firm’s performance.
2.9 Nature of Accounting Ratios
Accounting ratios are used as a benchmark for evaluating the
financial position and performance of a firm. There is no meaningful
understanding of the performance and financial position of a firm by
only reporting the accounting figures in the financial statement.
Accounting figures can only give meaning when they are related to
some other relevant information, that is, through the use of ratio.
48
Hence, ratio can be defined a the relationship between two amounts
determined by the number of times one contain the other (Hornby,
1998).
For instance, a certain amount of net profit may look
impressive, but the firm’s performance can be said to be good or bad
only when the net profit figures is related to the company’s
investment. This relationship between two accounting figures
expressed mathematically, is known as a ratio.
Ratios assist in summarizing large quantities of financial data
and to make informed and quantitative judgments about the firms
financial performance. For example, if current ratio is to be
determined, it is calculated by dividing current assts by current
liabilities. This relationship is seen as an index or a yardstick that
enables the firm to judge its capability in meeting its short term
obligations as they fall due. The liquidity of the firm is measured. It is
vital to note that, ratio reflects a quantitative relationship that helps to
form a quanlitative judgement (Pandey, 2005:518).
Basically, financial ratios are computed for items in the income
statement and balance sheet embodied in the financial statement
which can be compared using any of the methods of comparison in
determining changes in a firm’s ratio over time and highlighting
improvement in performance or problems areas that need attention.

49
2.10 uses of Ratio in Analyzing Financial Statement
To determine the financial condition and performance of a
company, the financial analyst needs certain yardstick. The
yardsticks frequently used is a ratio, relating two pieces of financial
data to each other. Analysis and interpretation of various ratio should
give experienced, skilled analysts a better understanding of the
financial condition and performance of the firm than they would obtain
from analyzing only the financial data.
The essence of the financial soundness of a company lies in
balancing its goals, product market choices, commercial strategy and
resultant financial needs. Ratio analysis is a very useful analytical
tool to raise pertinent questions on a number of managerial issues.
Many groups of people in a company are interested in using analysed
financial statements to know the company’s operating performance.
The use of ratio gives a statement reader a clear idea about items
and eliminate some difficulties he/she may have in understanding the
significance of the naira amount.
Ratio is also useful in security analysis whose major interest is
on long term profitability. The analyst here is interested in the
efficiency with which the firm is exposed.
The usefulness of ratio analysis also extends to the area of
performance analysis, competitive analysis and trend analysis.
Management have to protect the interest of all concerned parties so
as to ensure some minimum operation efficiency and keep the risk of
a firm at a minimum since their future position depends on their
operating performance. Analysis of financial statement is of greater

50
use to the management because they use it from time to time to
determine the firm’s financial strength and weaknesses and as a
proper basis for decision making. However, management should
make use of financial ratios as they have access to internal
information which is not available to other analysts, such as credit
and security analysts (Pandey, 2005).
2.11 Limitations of Financial Statement Analysis
In this survey, it will be pertinent to discuss the limitations of
financial statement analysis and recommend ways of minimizing or
overcoming them. Categorically, according to Diamond (2006), three
problems involved in such analysis are:
i) That firms use different accounting principles and methods.
ii) That it is often difficult to define what industry and firm is really
a part of and
iii) That accounting principles varies among countries
2.12 Use of Different Accounting Principles
A firm’s management has the right to select among a set of
generally accepted accounting principles and methods. Even firms in
the same industry select different methods to account for the same
event. For example, one firm in the steel industry may use LIFO and
another may use FIFO. Obviously, the financial statements of these
two firms as well as key ratios and relationships based on those
statements, will be significantly different (Diamond, 2006). This
51
makes the direct comparison of firms within the same industry
difficult.
Careful reading of management’s discussion and analysis of
operations and the footnotes to the financial statements can partially
overcome this problem, ibidi. The notes to the financial statements
also provide important information concerning the use of accounting
principles.
2.13 Industry Affiliation
Using industry norms as a basis for financial statement analysis
presupposed being able to define the industry to which the firm is
affiliated for companies such as NUPAS INC and Nigerian Breweries
Plc, this is an easy process, because they operate in a well-defined
industry. However, many companies are truly conglomerates that
operate in a variety of industries for example, in what industry is
UAC? This question is difficult to answer because the firm is a
diversified company that now operates in many industries.
Early in its existence, the Financial Accounting Standard
Boards recognized this problem with the issuance of statement No.14
which requires that firms disclose certain operating and financial data
by industry segments and where appropriate by geographical
location. Essentially, this statement requires diversified companies to
report revenues, income from operations; and identifiable assets for
each operating segment as well as similar information by
geographical area.

52
2.14 Accounting Differences Between Countries
Accounting differences that exist between countries accounting
to Diamond have made it difficult for users to compare and contrast
the information contained in financial statement prepared under the
Generally Accepted Accounting Principles (GAAP) of difference
countries.
Comparability among financial statements prepared under
different GAAP is ongoing and significant problem for financial
statement users.
In summary, in making decisions based on the results of your
analysis, you must be aware of the limitations inherent in financial
statement analysis.
2.15 The Impact of Inflation of Financial Statement Analysis
During a period of inflation, financial statements which are
prepared in terms of historical costs do not reflect fully the economic
resources or the real income (in terms of purchasing power) of a
business enterprise (Meigs and Meigs 2003).
Therefore, inflation affects financial statement analysis to a
greater extent. However, there is SEC requirement that large
corporations disclose in footnotes the replacement cost of
inventories, cost of goods sold, plant and equipment, and
depreciation, ibid. Financial analyst should therefore attempt to
evaluate the impact of inflation on the financial position and results on
operations of the company being studies. Moreover, according to
Diamond (2006), analysts would raise such questions as: how much

53
of the net income can be attributed to the increase in the general
price level? Is depreciation expense understated in terms of current
price levels? Are profits exaggerated because the replacement cost
of inventories is higher than the cost of units charged to cost of goods
sold? Will the company be able to keep its “physical capital” intact by
paying the higher prices necessary to replace plant assets as they
wear out? Therefore, accounting information should be modified to
cope with the impact of inflation.
Since inflation affects the financial statements, there is need or
a remedy to be done; this will be in the form of modifying the
accounting. To Meigs and Meigs (1979:579), two approaches are
generally in use. They are:
i) The adjustment of historical cost financial statements for
changes in general purchasing power; and
ii) Current value accounting, this approach envisions a series
of traditional steps away from historical cost accounting,
the first of which would be limited to requiring footnotes
disclosures of the current values for inventories, cost of
goods sold, plant and equipment, and depreciation. It
second step would involve preparing supplementary
financial statements expressed in current values for most
items, and a final step would call for a set of current value
financial statements to become the primary financial
statement of a company.
54
2.16 Features of a Good Management Decision Technique
According to Mabt (2001), investment decisions concern
allocation of funds to appropriately select investment opportunities to
maximize profit as well as sustain the organization as a gong
concern. According to him, investment decision techniques involve
sequential stages of opportunity assessment. The stages are as
follows:
(i) The review of a firms operating objectives and goals as well as
the identification of possible constraints, which can inhibit
goal achievement; this can be found in the director’s report
and the financial statements in the company’s annual report
or in the form 10-k from Security and Exchange Commission
(SEC).
(ii) Identification of various investment opportunities which are
likely to enhance corporate goal achievement.
(iii) Estimation of the amount of financial outlay required for each
investments opportunity, timing of cash flow requirement and
determination of the level of risk associated with each
investment opportunity.
(iv) Franking of all investment opportunities assessed in terms of
the levels of contribution to goal achievement.
(v) Selection of investment opportunity of opportunities that best
enhance the achievement of operational objectives and
(vi) Regularly assessing the detection to identity possible
weaknesses in order to adopt corrective measures.
55
Generally, information from the financial statements can enable
the efficiency of the above technique, hence, the great need for
financial statement analysis in investment decisions.
2.17 Environment of Management Decision Making
A management decision may be taken under three distinct
conditions (Mbat, 2001). The three types of conditions are those of
certainty, risk and uncertainty. The first type of decision should not
be discussed because the investor knows with certainty a prior what
is going to be the return on an investment in corporate stocks.
However, not all investment opportunities have the same level of
certainty in terms of the rate of returns of outcome. Most investment
problems are normally associated with a certain probability density
function relative to the outcome, ibid. This means that the outcomes
of most investment decisions are at best normally guessed. This
brings us to the concept of risk and uncertainty.
Risk may be defined as a situation where there is a variety of
possible outcomes which could result from a particular investment
decision cannot be predicted with any degree of certainty even
though there is a partial information on which to base the decision,
this is mostly the case with investment in corporate stocks.
However, according to Mabt (ibid), decision under conditions of
uncertainty is a situation in which the determination of the outcome is
made impossible because of insufficient data on which to base the
decision. Since this is not the case in investment using financial
statement, we are going to concentrate on the environment of risk.

56
Nevertheless, it is important to recognize risk appraisal as an
integral part of investment decision making. While appraising risk, an
investor should make a fundamental decision between risk evaluation
and its calculation, ibid. This would enable him to strike a balance
between risk and return.
According to Mbat (2001), risk evaluation is important in the
sense that the probability of the different available information are
adequately weighed in order to determine their related degree of
influence on the outcome, while risk calculation enables the investor
to reduce the abstract to numerical dimension, in order to know the
extent of the influence of each type of risk on the outcome.

57
REFERENCES
Akpan, I. (2002). Fundamental of Finance. Uyo: Modern Business
Press Ltd.
Diamond, M.A. (2006). Financial Accounting. Ohid: Southwestern
College Publishers.
Pandey, I.M. (2005). Financial Management. London: Vikas
publishing House PVT Limited.
Meigs, W.B. and Meigs, R.F. (2003). Financial Accounting. USA:
McGraw Hill, Inc.
Mbat, D.O. (2001). Financial Management. Uyo: Dome Associates
Publishers.

58
CHAPTER THREE
3.1 Research Design
A research design is simply the framework or plan for the study,
which is used as the modus operandi of collecting pertinent data.
In this study, the quasi-experimental design is adopted with
particular concentration on the descriptive method. This is preferred
to others given the nature of the study, which is an exposition of
selected companies with respect to the effect of financial statement
analysis and interpretation as a tool for management decision and
corporate performance evaluation.
3.2 Sources and Method of Data Collection
The main sources and methods of data collection used in the
study are:
a) Primary source and
b) Secondary source
The primary source of data is the questionnaire and personal
interview while the secondary sources include: textbooks, journal and
opinions of experts on the subject.
The secondary source provide the theoretical framework for the
study.

59
3.3 Research Instrument
A research instrument is any device constructed for recording
of measuring data. It is the means for generating pertinent
information to be used for solving the research problems (Olakunori
1997) therefore, in order to obtain valuable data for analysis,
interpretations and appreciation of problems aforementioned, a set of
questionnaire was designed and administered to employees of
NUPAS Ltd.
The choice of questionnaire as research instrument for this
study was based on the fact that, it permits the coverage of minimum
expenses both in money and effort.
Again, because of greater impersonality attached to
questionnaires, more objective data were obtainable in the set of
questionnaire structured questions, multiple choice (close-ended)
questions and open ended questions were used.
3.4 Reliability/Validity of Research Instrument
In order to forestall measurement errors, which occur when the
research instrument is faulty, the reliability of the research instrument
was ensured through its careful construction and pretest. Pretest
was done by conducting a pilot survey, where in the research
instruments (questionnaire) where administered to apart (sample) of
the population with a new to finding possible fault and thereafter,

60
correction than before the full application of main sample for the
study.
3.5 Population
Population here refers to the totality of targeted individuals that
form the focus of this study. The objectives of the data collection
process is to draw conclusions about the population. It is therefore
imperative to have a clear picture of what constitutes the research
population.
The population for this study consist of employees drawn from
some vital departments or section of workers of the NUPAS Ltd.
Department Population
Architecture 10
Accounting 15
Administration 20
Construction 5
Accounts & cleaning 50
Total 50
3.6 Sample Size and Technique
According to Egbu (1998), sampling involves the selection of a
number of study units from a defined study population.
A sample is therefore, a small representatives of a large
population. In drawing a small sample for the study, the researcher
61
considered how many people that are needed in the sample and their
category first to be selected.
A sample size used is forty-four (44) staff selected from NUPAS
Ltd using the formular by yaro yemmen method (1967)
n = N 1+N(e)2
where
n = sample size
N = Population size (50)
e = Level of significance (acceptable
error/limit)
I = A constant number
For the purpose of this research works, our level of significance
(2) = 5% or 0.05 that is a 95% confidence limit.
Since n = ?
N = 50
e = 0.05 or 5%
substituting the above value into the formular we have that,
n = 50
1 + 50 (0.05)2
n = 50
1 + 50 (0.0025)

62
= 50
1+0.125
= 50
1.125 = 44.44
Approximately = 44
n = 44
the sample size of the population is 44 and the researcher issue the
same number of questionnaire to the staff of NUPAS Ltd, to the
responses in this study.
The sampling technique used in this study is the probability
sampling. Probability sampling can be simple random, or stratified
random. The simple random sampling allows for generalization to
take place.
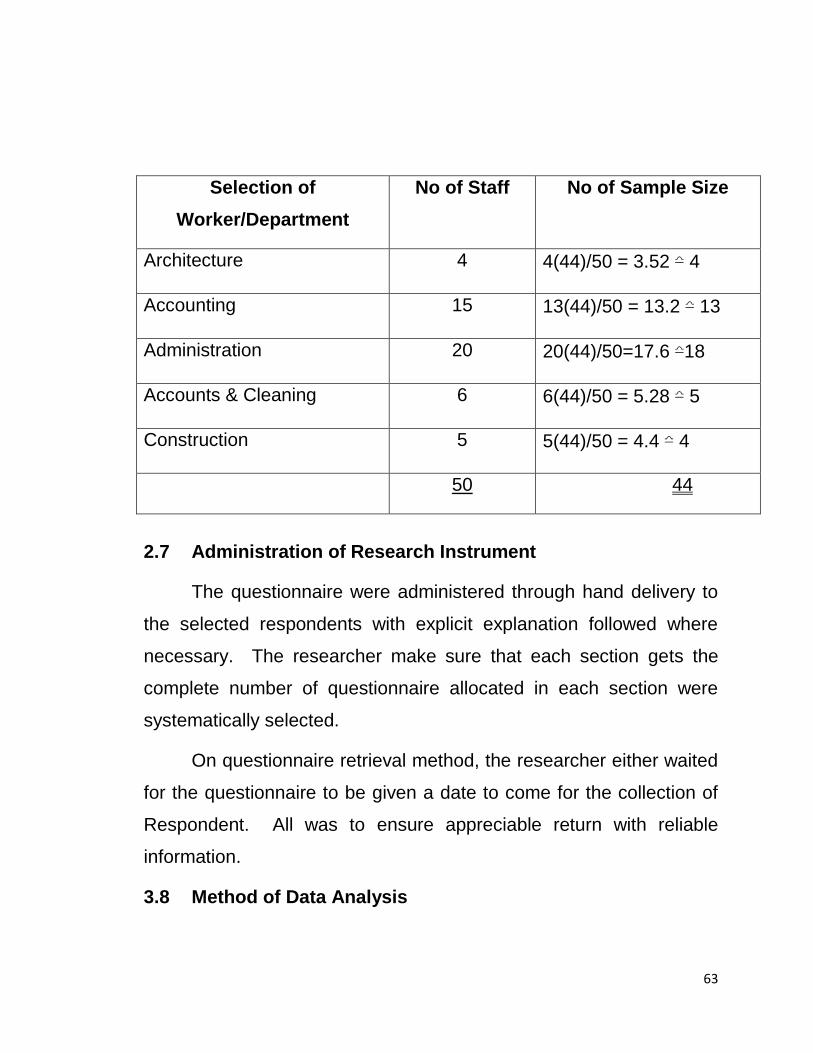
Bowley’s proportional allocation formula was applied thus;
nh = n x nh’
N
Where;
nh = Number of questionnaire allocated to staff of NUPAS Ltd.
n = Total sample size
Nh = Number of employee in each section of population.
N = Population
Therefore, the allocation will be as follows:
63
Selection of
Worker/Department
No of Staff No of Sample Size
Architecture 4 4(44)/50 = 3.52 ≏ 4
Accounting 15 13(44)/50 = 13.2 ≏ 13
Administration 20 20(44)/50=17.6 ≏18
Accounts & Cleaning 6 6(44)/50 = 5.28 ≏ 5
Construction 5 5(44)/50 = 4.4 ≏ 4
50 44
2.7 Administration of Research Instrument
The questionnaire were administered through hand delivery to
the selected respondents with explicit explanation followed where
necessary. The researcher make sure that each section gets the
complete number of questionnaire allocated in each section were
systematically selected.
On questionnaire retrieval method, the researcher either waited
for the questionnaire to be given a date to come for the collection of
Respondent. All was to ensure appreciable return with reliable
information.
3.8 Method of Data Analysis

64
The researcher used the descriptive statistical tools (Tables,
figure and percentages) in preparing and analyzing the data
generated from this study.
Again the researcher used the chi-square (X2) in testing the
formulated hypothesis and correlation co-efficient in testing the
relationship among variables. The chi-square (X2) distribution which
can be defined as the sum of ratio of difference between observed
and expected frequency is used when it wished to compare an actual
observed distribution with a hypothesized or expected distribution and
to measure the degree of deviation that exist between a calculated
value and the critical value (table value).
The responses were represented in table while percentages
were used to analyze each question contained in the questionnaire
and its responses.
Formula = x2 = ∑(Fo-fe)2
Fe
Where:
X2 = Calculated value
∑ = Summation sign
fo = Observed frequency
e = significance sign
Df = Degree of freedom (2)
The level of significance = 0.05 or 5%
65
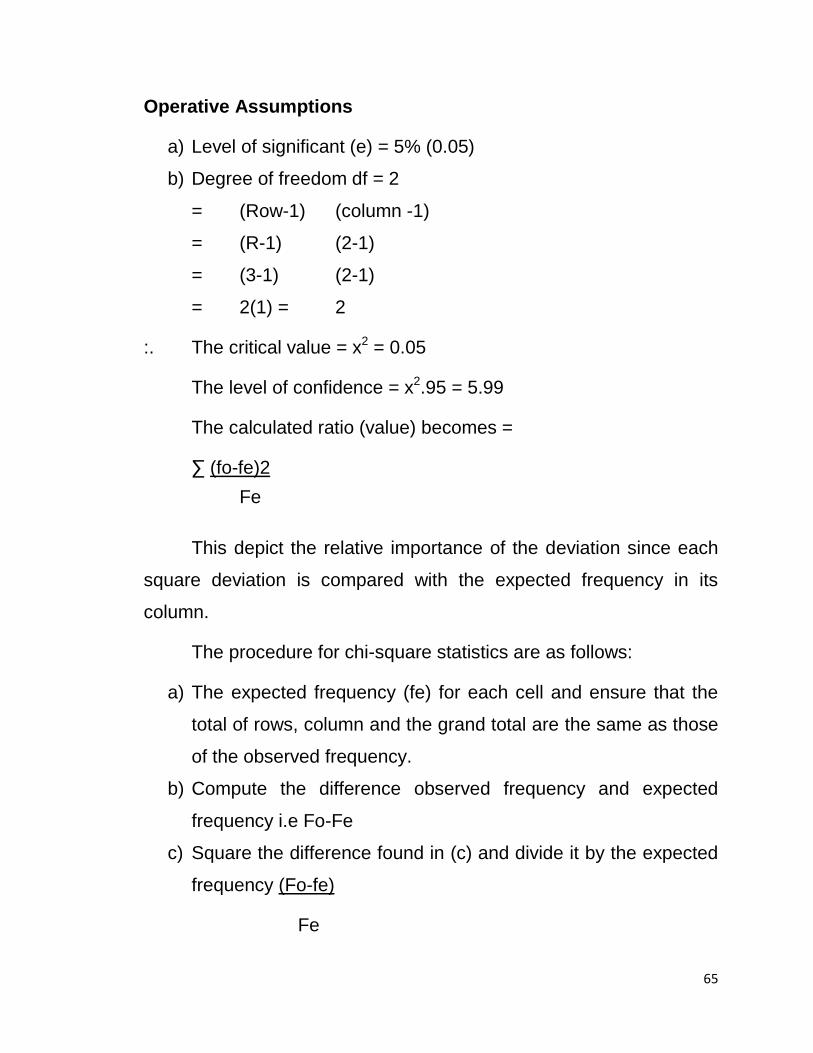
Operative Assumptions
a) Level of significant (e) = 5% (0.05)
b) Degree of freedom df = 2
= (Row-1) (column -1)
= (R-1) (2-1)
= (3-1) (2-1)
= 2(1) = 2
:. The critical value = x2 = 0.05
The level of confidence = x2.95 = 5.99
The calculated ratio (value) becomes =
∑ (fo-fe)2
Fe
This depict the relative importance of the deviation since each
square deviation is compared with the expected frequency in its
column.
The procedure for chi-square statistics are as follows:
a) The expected frequency (fe) for each cell and ensure that the
total of rows, column and the grand total are the same as those
of the observed frequency.
b) Compute the difference observed frequency and expected
frequency i.e Fo-Fe
c) Square the difference found in (c) and divide it by the expected
frequency (Fo-fe)
Fe

66
d) Sum the values in (d) above i.e, ∑ (fo-fe)2
Fe
e) Decide on the level of significance.
f) The critical region is for sample x2 = x2a (r-1) (c-1)
g) Determine the degree of freedom, give as: (Row-1) (Column -1)
= (r-1) (c-1)
h) The critical region is for sample x2> x 2a (r – 1) (c-1)
i) From the degree of freedom in (g) and the value of chi-square
in (d) above, determine the probability of association between
attributes.
3.9 Decision Criteria for Validation of Hypothesis
In order to decide whether to accept or reject the null
hypothesis, a comparison was made between the calculated value of
chi-square and the critical value. (value from the table).
The decision rule is therefore;
Accept Ho, if x20 < x2e
Reject H0, if x2
0 > x2e
where:
x20 = Calculated chi-square
x2e = Chi-square value from the distribution table or
the critical value.

67
REFERENCES
Egbui, K.I. (1998), Groundwork of Research Method and Procedures. Enugu: Institute for Development Studies. Olakunori, O.K. (1997), Successful Research Theory and Practice. Enugu: Computer Edge Publishers. Yamen Yaro (1964), An Introduction Analysis, 3rd edition, New York, Jerpes and Raw Publishers. Spiegal, E.F. (2001), Using Accounting Information. New York= John Wiley Publishers.
68
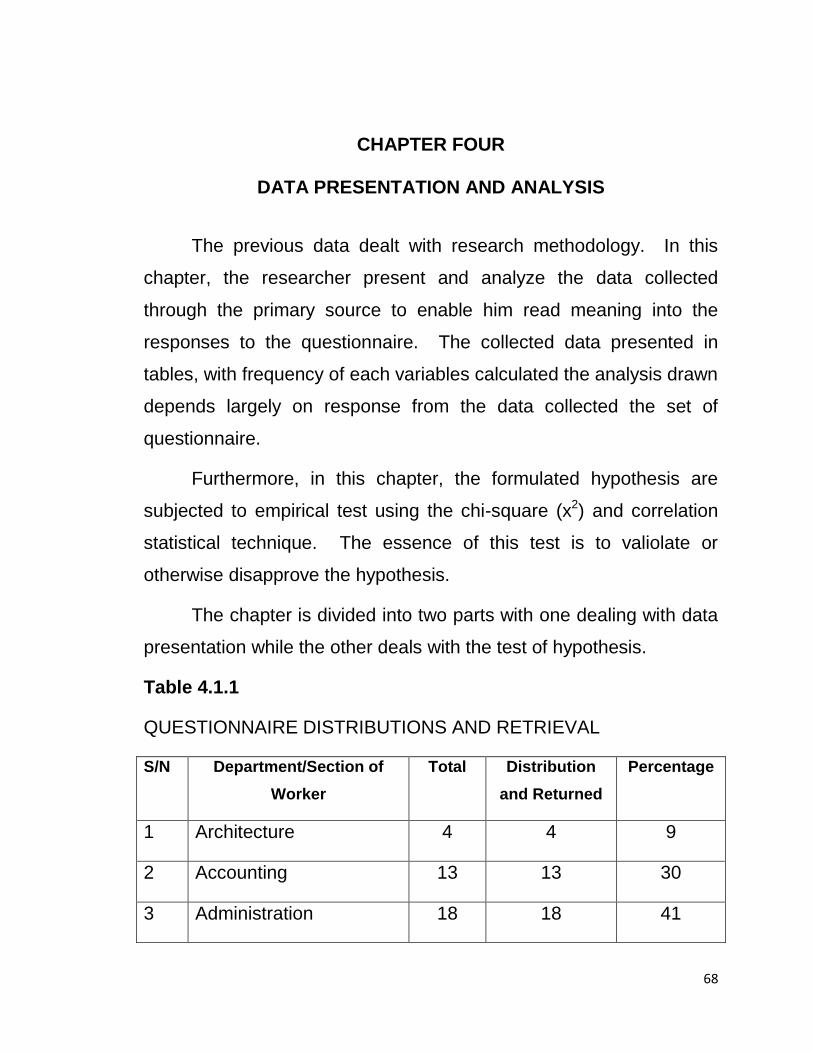
CHAPTER FOUR
DATA PRESENTATION AND ANALYSIS
The previous data dealt with research methodology. In this
chapter, the researcher present and analyze the data collected
through the primary source to enable him read meaning into the
responses to the questionnaire. The collected data presented in
tables, with frequency of each variables calculated the analysis drawn
depends largely on response from the data collected the set of
questionnaire.
Furthermore, in this chapter, the formulated hypothesis are
subjected to empirical test using the chi-square (x2) and correlation
statistical technique. The essence of this test is to valiolate or
otherwise disapprove the hypothesis.
The chapter is divided into two parts with one dealing with data
presentation while the other deals with the test of hypothesis.
Table 4.1.1
QUESTIONNAIRE DISTRIBUTIONS AND RETRIEVAL
S/N Department/Section of
Worker
Total Distribution
and Returned
Percentage
1 Architecture 4 4 9
2 Accounting 13 13 30
3 Administration 18 18 41
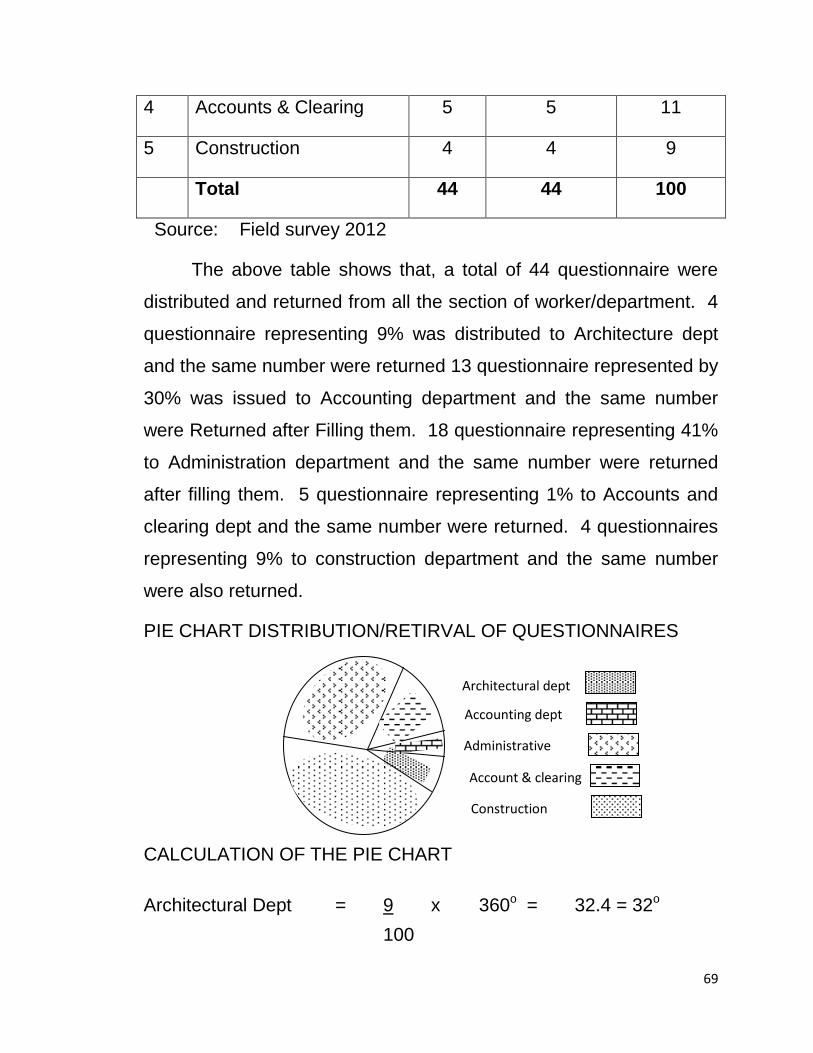
69
4 Accounts & Clearing 5 5 11
5 Construction 4 4 9
Total 44 44 100
Source: Field survey 2012
The above table shows that, a total of 44 questionnaire were
distributed and returned from all the section of worker/department. 4
questionnaire representing 9% was distributed to Architecture dept
and the same number were returned 13 questionnaire represented by
30% was issued to Accounting department and the same number
were Returned after Filling them. 18 questionnaire representing 41%
to Administration department and the same number were returned
after filling them. 5 questionnaire representing 1% to Accounts and
clearing dept and the same number were returned. 4 questionnaires
representing 9% to construction department and the same number
were also returned.
PIE CHART DISTRIBUTION/RETIRVAL OF QUESTIONNAIRES
CALCULATION OF THE PIE CHART
Architectural Dept = 9 x 360o = 32.4 = 32o
100
Architectural dept
Accounting dept
Administrative
Account & clearing
Construction

70
Accounting Dept = 30 x 360 = 1.080
100
Administrative Dept = 41 x 360 = 147.80
100
Accounts and clearing = 11 x 360 = 40o
100
Construction Dept = 9 x 360 = 32o
100
Total = 360o
4.1 Data Presentation
The researcher makes use of questionnaire for the data
presentation. The data collected from the members of staff of
NUPAS Ltd. The questionnaire was distributed randomly on all
categories or section of workers in the accessible population.
The researcher desire to use only 44 questionnaire the
researcher topic from the staffs of NUPAS Ltd. The 44 question were
issued to the staff of NUPAS Ltd and the entire question issued were
collected successfully for analysis is consequently based on the
sample size of 44 which is the producing sample. The method of
data analysis used is the sample percentage which is very easy to
understand.

71
ANALYSIS OF QUESTION
This section of research work is aimed at examining the
responses filled in the questionnaire and returned
Question No. 1 AGE
Table 4.1.2
S/N Response Options No of Responses Percentage of
Responses
a) Below 20 yrs 20 45
b) 20 – 30yrs 14 32
c) 31-40yrs 6 14
d) Above 40yrs 4 9
Total 44 100
Field survey – 2012
Table 4.1.2 above indicates that 20 respondent representing
45% belong to staff, 14 respondent representing 32% were of the age
range of 20-30 years, 6 respondent representing 14% were of the
age range of 31-40 years and only 4 respondents representing 9%
were above the age of 40 years.
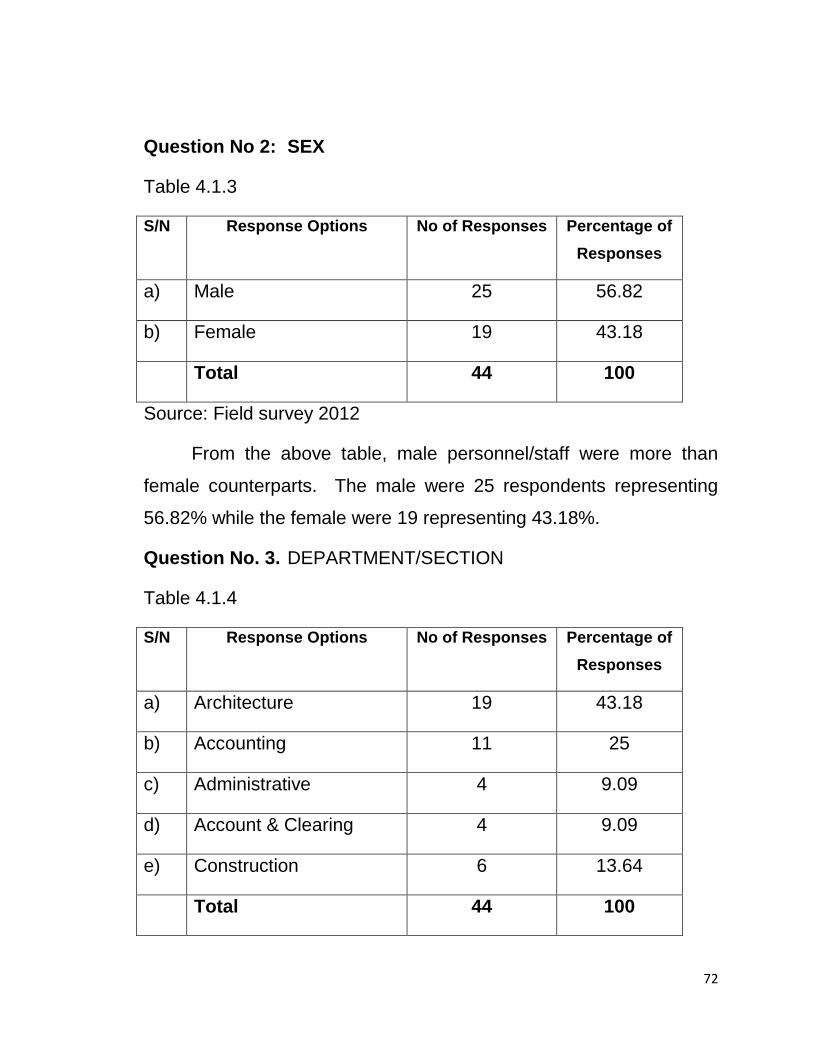
72
Question No 2: SEX
Table 4.1.3
S/N Response Options No of Responses Percentage of
Responses
a) Male 25 56.82
b) Female 19 43.18
Total 44 100
Source: Field survey 2012
From the above table, male personnel/staff were more than
female counterparts. The male were 25 respondents representing
56.82% while the female were 19 representing 43.18%.
Question No. 3. DEPARTMENT/SECTION
Table 4.1.4
S/N Response Options No of Responses Percentage of
Responses
a) Architecture 19 43.18
b) Accounting 11 25
c) Administrative 4 9.09
d) Account & Clearing 4 9.09
e) Construction 6 13.64
Total 44 100

73
Source: Field Survey – 2012
From the above table shows that 19 respondent representing
43.18% of Architecture department, 11 respondent representing 25%
is for Accounting department. 6 respondent representing 13.64%
belong to construction department while Administrative and Accounts
& Cleanings department share the same number of respondent, 4
representing 9.09% respectively.
Question No. 6: Work Experience:
Table 4.1.7
S/N Response Options No of Responses Percentage of
Respondent
a) Below 4 years 16 36.36
b) 5-9 years 14 31.8
c) 10-14 years 9 20.3
d) Above 15 years 5 11.4
Total 44 100
Source: Field Survey – 2012
The above table shows that 16 respondent representing
36.36% have been in practice for below 4 years. 14 respondents
representing 31.8% have been in practice for 5-9 years, 9
respondents representing 20.5% have been in practice from 10-14
years and 5 respondents representing 11.4% have worked above 15
years.

74
Question 7: Have your company invested in common stock or
other securities in another company?
Table 4.1.8
S/N Response Options No of Responses Percentage of
Respondents
a) Yes 35 79.5
b) No 9 20.5
Total 44 100
Source: Field Survey – 2012
From the above analysis, it can be observed that 35
respondents representing 79.5% believes that the company invested
in common stock and 9 respondents representing 20.5% believes the
company invested securities in another company.
Question 8
Do you analyze financial statement before making investment
decision in corporate stocks or other securities?
S/N Response Options No of Responses Percentage of
Respondent
a) Yes 32 72.72
b) No 12 27.23
Total 44 100
Source: Field Survey 2012
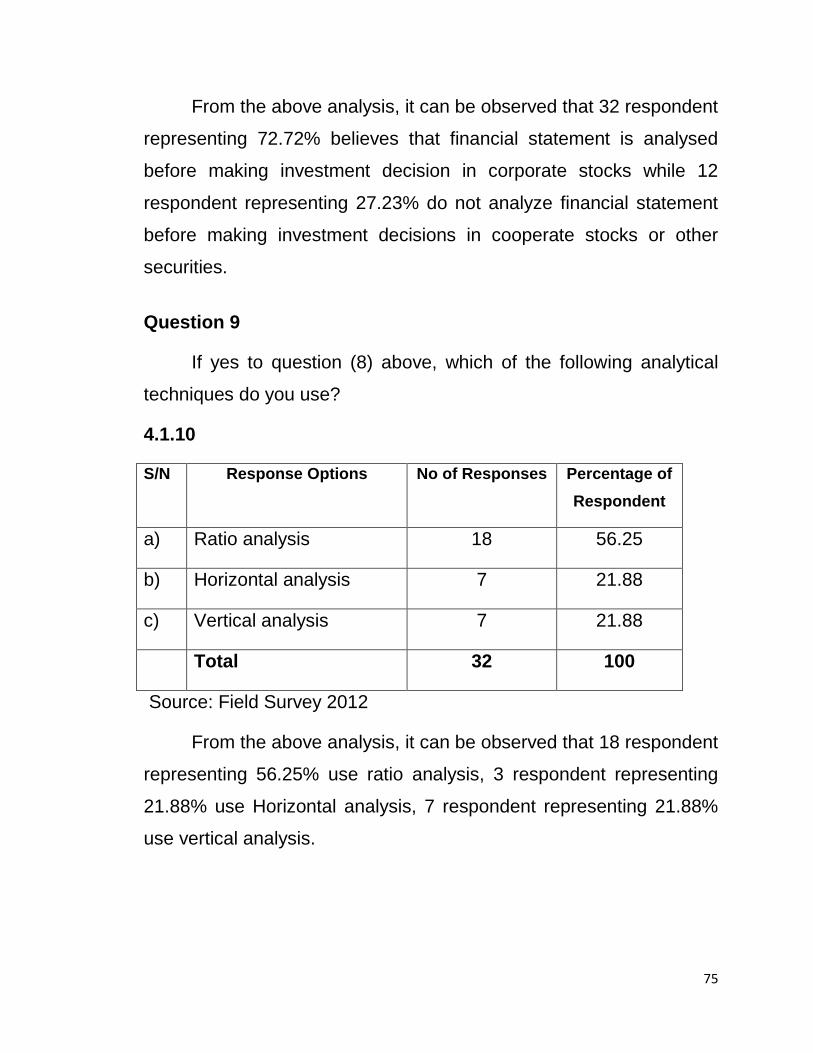
75
From the above analysis, it can be observed that 32 respondent
representing 72.72% believes that financial statement is analysed
before making investment decision in corporate stocks while 12
respondent representing 27.23% do not analyze financial statement
before making investment decisions in cooperate stocks or other
securities.
Question 9
If yes to question (8) above, which of the following analytical
techniques do you use?
4.1.10
S/N Response Options No of Responses Percentage of
Respondent
a) Ratio analysis 18 56.25
b) Horizontal analysis 7 21.88
c) Vertical analysis 7 21.88
Total 32 100
Source: Field Survey 2012
From the above analysis, it can be observed that 18 respondent
representing 56.25% use ratio analysis, 3 respondent representing
21.88% use Horizontal analysis, 7 respondent representing 21.88%
use vertical analysis.

76
Question 10
How effective has financial statement analysis assisted your
company in identifying investment opportunities?
4.1.11
S/N Response Options No of Responses Percentage of
Responses
a) Very effective 20 45.45
b) Effective 18 40.91
c) Not effective 6 13.64
Total 44 100
Source: Field survey – 2012
From the above table shows that 20 respondent representing
45.45% are very effective. 18 respondent representing 40.91% are
effective. 6 respondent representing 13.64% are not effective.
Question 11
Are you familiar with specific analytical tools or ratios for
determining investment return?
4.1.12
S/N Response Options No of Responses Percentage of
Respondent
a) Very well 20 45.45

77
b) Fairly well 14 31.82
c) Well 8 18.18
d) Not at all 2 4.5
Total 44 100
Source: Field survey – 2012
From the above table shows that 20 respondent representing
45.45% are very well familiar. 14 respondent representing 31.82%
are fairly well familiar. 8 respondent representing 18.18% are well
familiar with analytic tools or ratios.2 respondent representing 4.5 are
not familiar with analytic tools or ratios for determining investment
return.
Question 12
What was the aim of your company for investing in another
company?
Table 4.1.13
S/N Response Options No of Responses
Percentage (%) of
Responses
a) Max short term returns 22 50
b) Max long term returns 12 27.27
c) Others 10 22.73
Total 44 100
Source: Field survey – 2012
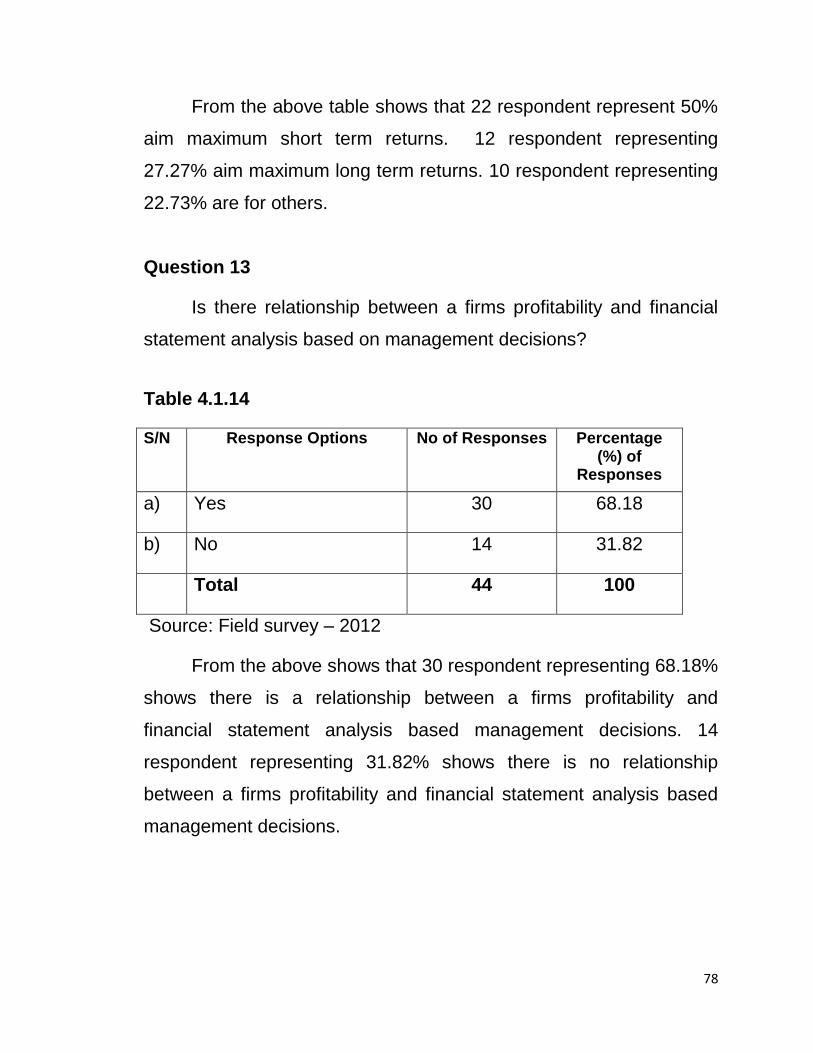
78
From the above table shows that 22 respondent represent 50%
aim maximum short term returns. 12 respondent representing
27.27% aim maximum long term returns. 10 respondent representing
22.73% are for others.
Question 13
Is there relationship between a firms profitability and financial
statement analysis based on management decisions?
Table 4.1.14
S/N Response Options No of Responses Percentage (%) of
Responses
a) Yes 30 68.18
b) No 14 31.82
Total 44 100
Source: Field survey – 2012
From the above shows that 30 respondent representing 68.18%
shows there is a relationship between a firms profitability and
financial statement analysis based management decisions. 14
respondent representing 31.82% shows there is no relationship
between a firms profitability and financial statement analysis based
management decisions.
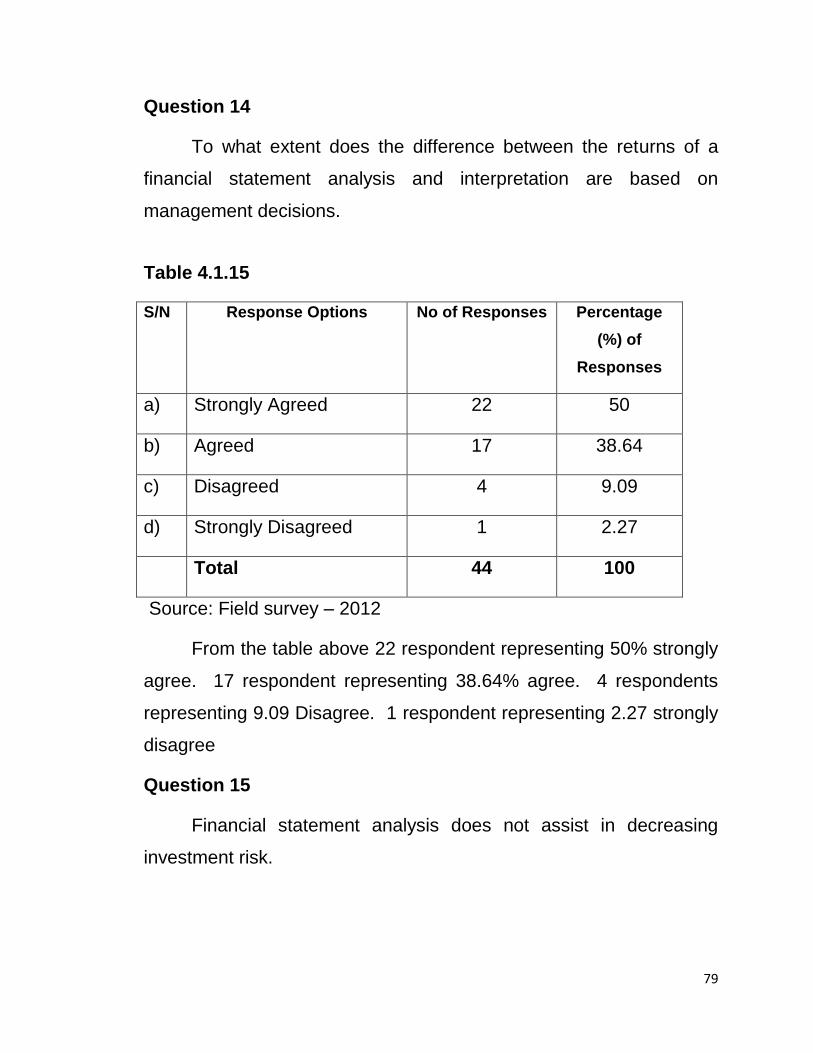
79
Question 14
To what extent does the difference between the returns of a
financial statement analysis and interpretation are based on
management decisions.
Table 4.1.15
S/N Response Options No of Responses Percentage
(%) of
Responses
a) Strongly Agreed 22 50
b) Agreed 17 38.64
c) Disagreed 4 9.09
d) Strongly Disagreed 1 2.27
Total 44 100
Source: Field survey – 2012
From the table above 22 respondent representing 50% strongly
agree. 17 respondent representing 38.64% agree. 4 respondents
representing 9.09 Disagree. 1 respondent representing 2.27 strongly
disagree
Question 15
Financial statement analysis does not assist in decreasing
investment risk.
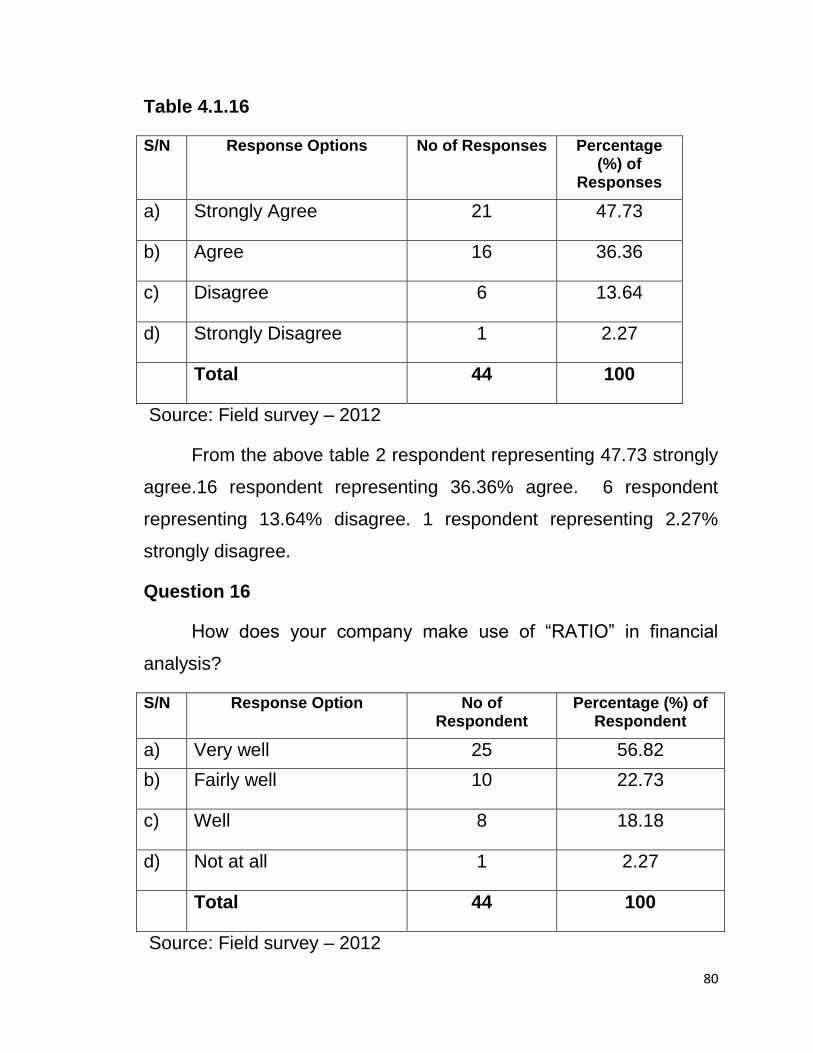
80
Table 4.1.16
S/N Response Options No of Responses Percentage (%) of
Responses
a) Strongly Agree 21 47.73
b) Agree 16 36.36
c) Disagree 6 13.64
d) Strongly Disagree 1 2.27
Total 44 100
Source: Field survey – 2012
From the above table 2 respondent representing 47.73 strongly
agree.16 respondent representing 36.36% agree. 6 respondent
representing 13.64% disagree. 1 respondent representing 2.27%
strongly disagree.
Question 16
How does your company make use of “RATIO” in financial
analysis?
S/N Response Option No of Respondent
Percentage (%) of Respondent
a) Very well 25 56.82
b) Fairly well 10 22.73
c) Well 8 18.18
d) Not at all 1 2.27
Total 44 100
Source: Field survey – 2012
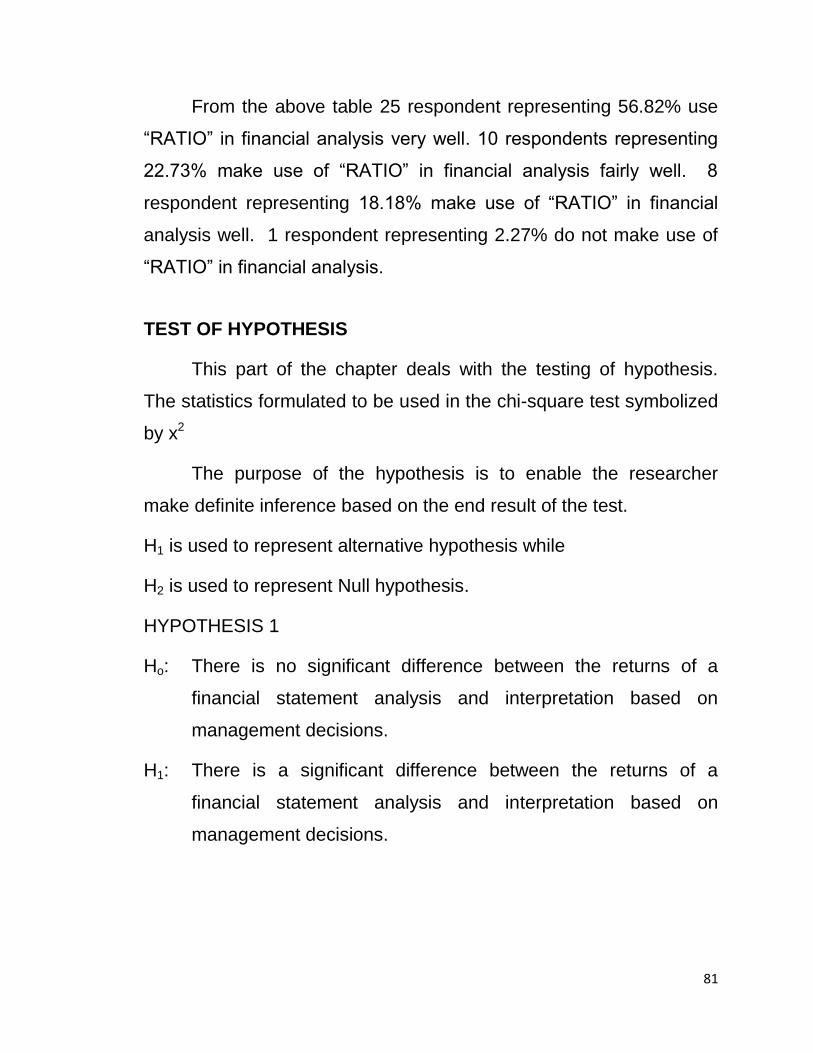
81
From the above table 25 respondent representing 56.82% use
“RATIO” in financial analysis very well. 10 respondents representing
22.73% make use of “RATIO” in financial analysis fairly well. 8
respondent representing 18.18% make use of “RATIO” in financial
analysis well. 1 respondent representing 2.27% do not make use of
“RATIO” in financial analysis.
TEST OF HYPOTHESIS
This part of the chapter deals with the testing of hypothesis.
The statistics formulated to be used in the chi-square test symbolized
by x2
The purpose of the hypothesis is to enable the researcher
make definite inference based on the end result of the test.
H1 is used to represent alternative hypothesis while
H2 is used to represent Null hypothesis.
HYPOTHESIS 1
Ho: There is no significant difference between the returns of a
financial statement analysis and interpretation based on
management decisions.
H1: There is a significant difference between the returns of a
financial statement analysis and interpretation based on
management decisions.
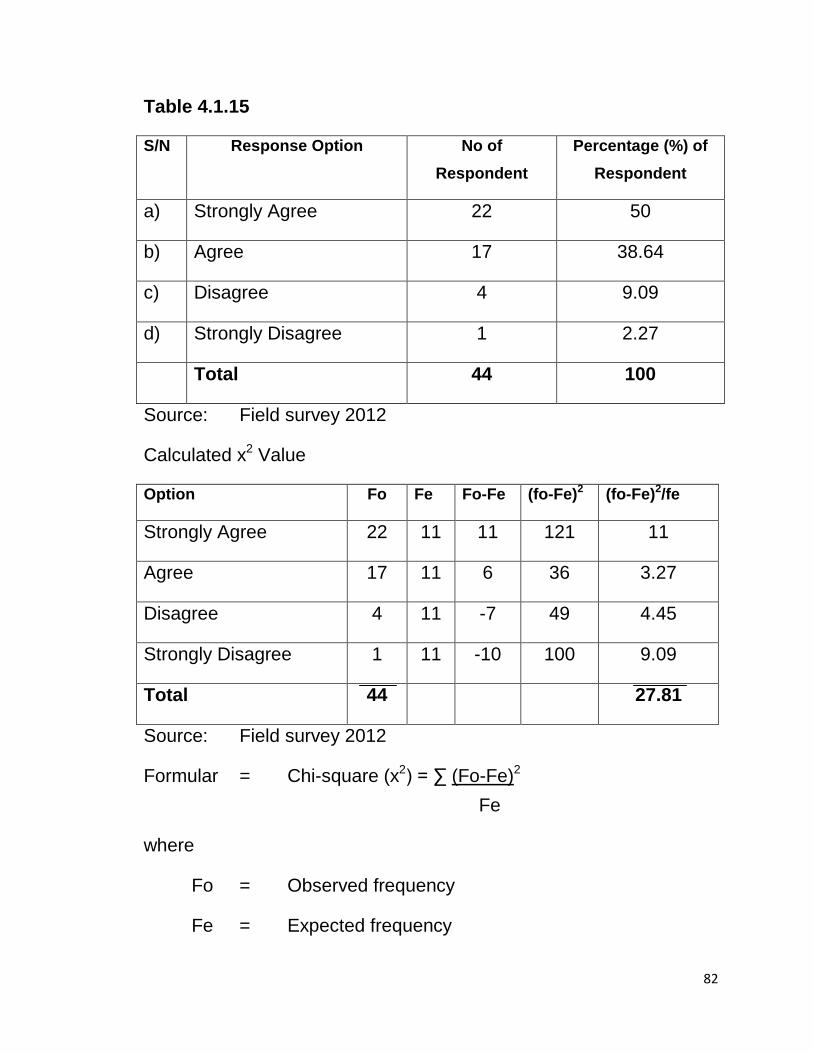
82
Table 4.1.15
S/N Response Option No of
Respondent
Percentage (%) of
Respondent
a) Strongly Agree 22 50
b) Agree 17 38.64
c) Disagree 4 9.09
d) Strongly Disagree 1 2.27
Total 44 100
Source: Field survey 2012
Calculated x2 Value
Option Fo Fe Fo-Fe (fo-Fe)2 (fo-Fe)2/fe
Strongly Agree 22 11 11 121 11
Agree 17 11 6 36 3.27
Disagree 4 11 -7 49 4.45
Strongly Disagree 1 11 -10 100 9.09
Total 44 27.81
Source: Field survey 2012
Formular = Chi-square (x2) = ∑ (Fo-Fe)2
Fe
where
Fo = Observed frequency
Fe = Expected frequency
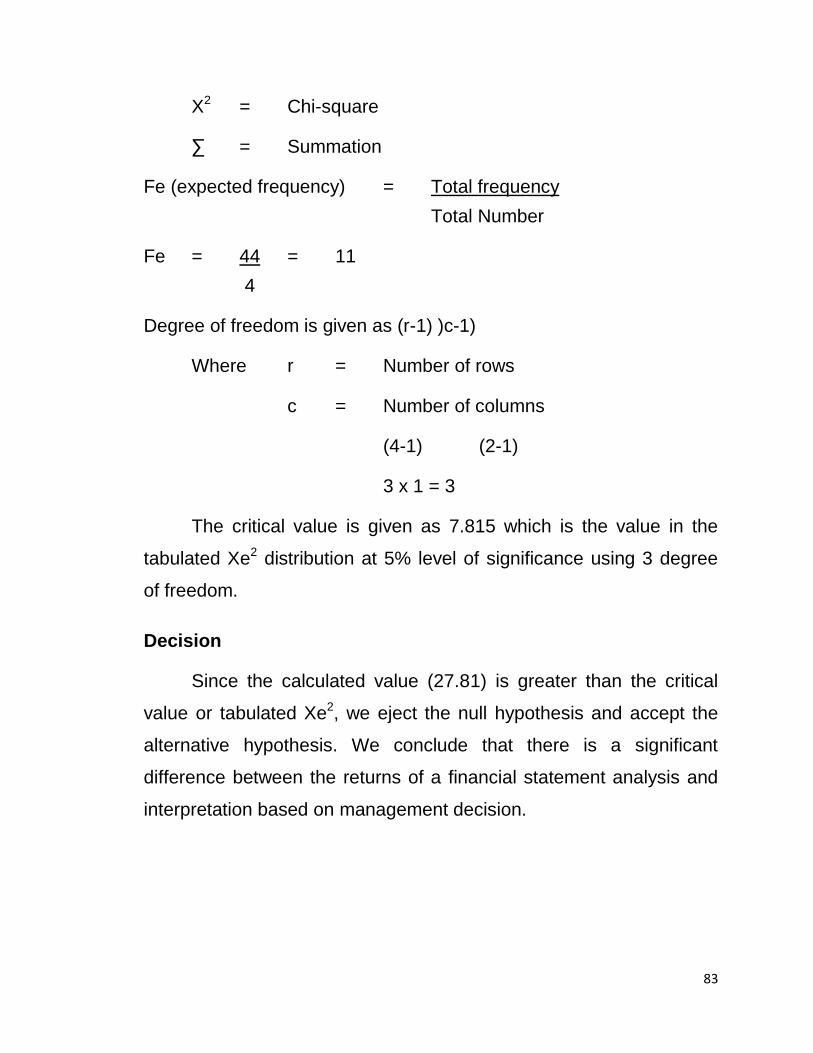
83
X2 = Chi-square
∑ = Summation
Fe (expected frequency) = Total frequency
Total Number
Fe = 44 = 11
4
Degree of freedom is given as (r-1) )c-1)
Where r = Number of rows
c = Number of columns
(4-1) (2-1)
3 x 1 = 3
The critical value is given as 7.815 which is the value in the
tabulated Xe2 distribution at 5% level of significance using 3 degree
of freedom.
Decision
Since the calculated value (27.81) is greater than the critical
value or tabulated Xe2, we eject the null hypothesis and accept the
alternative hypothesis. We conclude that there is a significant
difference between the returns of a financial statement analysis and
interpretation based on management decision.

84
HYPOTHESIS 2
Ho: There is no significant relationship between a firms profitability
and financial statement analysis and interpretation based on
management decision.
H1: There is a significant relationship between a firms profitability
and financial statement analysis and interpretation based on
management decision.
Table 4.1.14
S/N Response Option No of
Respondent
Percentage (%) of
Respondents
a) Yes 30 68.18
b) No 14 31.82
Total 44 100
Source: Field survey 2012
Calculated X2 value
Option Fo Fe Fo-Fe (fo-Fe)2 (fo-Fe)2/fe
Yes 30 22 8 64 2.91
No 14 22 -8 64 2.91
Total 44 27.81
Source: Field survey 2012
Formular = Chi-square (X2) = ∑ (Fo-Fe)2
Fe

85
where
Fo = observed frequency
Fe = Expected frequency
X2 = Chi-square
Fe (Expected frequency) = Total frequency
Total Number
Fe = 44 = 22
2
Degree of freedom is given as (r-1) (r-1)
where r = Number of rows
c = Number of columns
(2-1) (2-1)
1 x 1 = 1
The critical value is given as 3.841 which is the value in the
tabulated Xe2 distribution at 5% level of significance using 1 degree
of freedom.
Decision
Since the calculated value is greater than the critical value or
tabulated Xe2, we reject the null hypothesis and accept the alternative
hypothesis. We conclude that there is significant relationship
between a firms profitability and financial statement analysis and
interpretation based on management decisions.

86
CHAPTER FIVE
SUMMARY OF FINDINGS, CONCLUSION AND
RECOMMENDATIONS
5.1 Summary of Findings
This research work has identified how companies use financial
statement analysis and interpretation in making effective
management decisions. Overall organizational profitability and
achievement of organizational objectives were discussed. Again the
difference between the returns of a financial statement analysis and
interpretation based on management decisions were also discussed.
Forty-four questionnaires were distributed to the top and
executive level managers of the selected company and the use of
percentage and chi-square distribution were also used in testing the
formulated hypothesis.
From the results of the hypothesis tested, the null hypothesis
was rejected in the first hypothesis and the alternative hypothesis
was accepted. In order words, it was observed that there is a
significant difference between the returns of a financial statement
analysis and interpretation based on management decisions.
From the results of the second hypothesis tested, the null
hypothesis was rejected and the alternative hypothesis was
accepted. We also got to conclude that there is a significant
relationship between a firms profitability and financial statement
analysis and interpretation based on management decisions.
87
5.2 Conclusion
The main objective of this study was to determine how firms
could use financial statement analysis to aid investment and
management decisions in the selected company.
It is of great importance to note that survey carried out shows
that financial statement analysis is valuable in investment decision
making of the company.
Consequently, the first and second hypothesis shows a positive
result, all from the responses obtained from the questionnaires used
in the analysis of the research work. Hence, from this point of view, it
is necessary that business organizations should pay more attention to
the use of financial statement analysis
5.3 Recommendations
Based on the findings of this study as presented, analysed and
interpreted, the following recommendations were deemed necessary
by the researcher:
1) Adequate time should always be allowed for collection of
financial statement data and preparation for their analysis.
2) Financial statement should be properly interpreted and should
be made to reflect current cost accounting to reduce the
negative effects of historical cost principle on financial
statement decisions.
3) The effects of inflation on financial statement result should be
considered to reduce the inflation risk.
88
4) The adequacy of financial information need to be emphasized
on, as it will provide enough and necessary details for
investment and management decisions.
5) A combination of different ratios should be used to analyze a
company’s financial and/or operating performance.
6) Finally, the management of the selected company should make
proper use of financial statement analysis in other decision
areas of management not only in investment decision.

89
BIBLIOGRAPHY Akpan, I. (2002). Fundamentals of finance. Uyo: Modern business press Ltd. Diamond, M.A. (2006). Financial Accounting. Ohio: Southwestern college publishers. Egbui, K.I. (1998). Groundwork of Research method & procedures. Enugu: Institute for development studies. Mbat, D.O. (2001). Finance Management. Uyo: Dome Associates publishers. Meigs, W.B. and Meigs, R.F. (2003). Financial Accounting. USA: McGraw Hill, Inc. Needham, D. & Dransfield, R. (1991). Business Studies. UK: McGraw publications. Ojuigo, M.C. (2002). Accounting Guide to management technique. Enugu: Hugotex publication. Olakunori, O.K. (1997). Successful research theory and practice. Enugu: Computer Edge publishers. Pandey, I.M. (2005). Financial management. London: Vitkus publishing House PVT Limited. Spiegal, E.F.(2001). Using Accounting Information. New York: John Wiley publishers. Thorton, V.C. (1981). Accounting Managerial Decisions. New York: John Wiley. Yamen, Y. (1964). An Introduction to Research methodology. 3rd New York: Jerpes and Raw publishers.

90
QUESTIONNAIRE
Instruction:
Please tick [√] against the appropriate option in the
questionnaire design.
1) Age: (a) Below 20 years [ ] (b) 20-30 years [ ]
(c) 31-40 years [ ] (d) Above 40 years [ ]
2) Sex (a) Male [ ] (b) Female [ ]
3) Department/Section (a) Architecturer Dept [ ]
(b) Accounting Dept [ ] (c) Administrative Dept [ ]
(d) Accounts and clearing [ ] (e) Construction Dept [ ]
4) Marital Status (a) Single [ ] (b) Married [ ]
5) Educational Qualification (a) Higher Degree [ ]
(b) University Degree
Equivalent [ ]
(c) OND or equivalent [ ]
(d) WAEC or equivalent [ ]
(e) Others [ ]
6) Work Experience (a) Below 4 years [ ] (b) 5-9yrs [ ]
(c) 10-14 years [ ] (d) Above 15 years [ ]
7) Have your company invested in common stock or other
securities in another company?

91
(a) Yes [ ] (b) No [ ]
8) Do you analyse financial statement before making investment
decision in corporate stocks or other securities?
(a) Yes [ ] (b) No [ ]
9) If yes to question (8) above, which of the following analytical
techniques do you use? (a) Ratio analysis [ ] (b) Horizontal
analysis [ ] (c) Vertical analysis [ ]
10) How effective has financial statement analysis assisted your
company in identifying investment opportunities?
(a) Very effective [ ] (b) Effective [ ] (c) Not effective [
]
11) Are you familiar with specific analytical tools or ratios for
determining investment returns?
(a) Very well [ ]
(b) Fairly well [ ]
(c) Well [ ]
(d) Not at all (NA) [ ]
12) What was the aim of your company for investing in another
company?
(a) Maximum short term returns [ ]
(b) Maximum long term returns [ ]
(c) Others
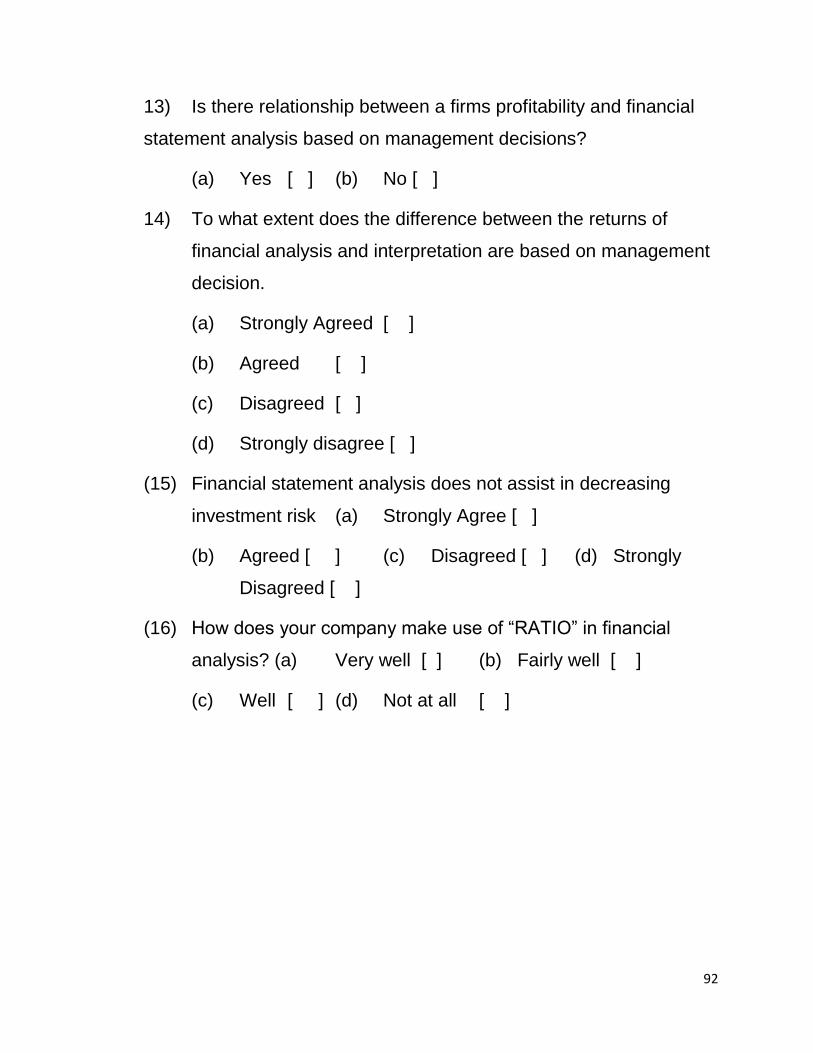
92
13) Is there relationship between a firms profitability and financial
statement analysis based on management decisions?
(a) Yes [ ] (b) No [ ]
14) To what extent does the difference between the returns of
financial analysis and interpretation are based on management
decision.
(a) Strongly Agreed [ ]
(b) Agreed [ ]
(c) Disagreed [ ]
(d) Strongly disagree [ ]
(15) Financial statement analysis does not assist in decreasing
investment risk (a) Strongly Agree [ ]
(b) Agreed [ ] (c) Disagreed [ ] (d) Strongly
Disagreed [ ]
(16) How does your company make use of “RATIO” in financial
analysis? (a) Very well [ ] (b) Fairly well [ ]
(c) Well [ ] (d) Not at all [ ]