Embed Size (px)
Citation preview

Page 1 of 29
Analysing Geometry Learning
A Case Study of Two Schools in Rajasthan
Suchismita Srinivas, Jeenath Rahaman, Saurabh Khanna, Arati Bapat

Page 2 of 29
Mathematics learning begins with the child connecting mathematical ideas to everyday understandings,
moving from concrete to abstract. Gradually, these ideas become more refined, and the student learns to
observe patterns, generalise, reason, and apply these learnings in different contexts and situations to solve
new problems. According to the Position Paper on Teaching of Mathematics by the National Focus Group
(NCERT, 2006), mathematics education at the elementary stage ‘… is (or ought to be) guided more by the
logic of children’s psychology of learning rather than the logic of mathematics’. But at the secondary stage,
students should begin to ‘perceive the structure of mathematics’, and geometry is one of the key areas
wherein the understanding of this structure could be situated.
The maths curriculum at the secondary stage assumes a readiness on part of the student to understand the
structure of mathematics, and operate within it. But are secondary school students in the state-run schools
in India actually ready for this? This study tries to look closely at this in the context of geometry learning.
This is a report of the first part of the study, done in two schools in Rajasthan.
1. Background
During initial interactions with schools at the start of the Connected Learning Initiative project (also called
CLIx, a collaboration between the Tata Trusts (India), Massachusetts Institute of Technology (MIT,
Cambridge, Mass., USA) and Tata Institute of Social Sciences (TISS, Mumbai, India), a number of teachers
in the selected CLIx schools expressed the need to have more engaging ways of teaching and learning
Geometry, flagging it as one of the most difficult topics to teach and learn. Based on this, it was decided that
the first module in CLIx maths would be picked from geometry.
However, before starting with the module, it was be important to understand more about what students find
difficult in the topic and why. This would help get the right focus in the module and aid module design.
A review of the research literature on geometry learning and impressions from the ground suggested that
while the high school geometry curriculum consists mainly of content that expects the students to
understand deductive reasoning and be able to construct formal proofs independently, many students at this
level do not demonstrate facility with this kind of formal reasoning. Thus, not being ready for a formal
system of reasoning and proofs, students struggle with the (mainly Euclidean) geometry curriculum in high
school.
Based on this, there seemed to be enough reasons to suggest that the CLIx geometry module would need to
focus on doing the groundwork that is required for high school students before they start working on formal
proofs. The module would start with activities that focus on analysis of geometric shapes and their
properties, and informal deduction (Van Hiele levels 1 and 2), gradually building facility with reasoning.
Ultimately, the module would lead up to an understanding of the need for formal deductive proofs, thereby
equipping the students to handle the geometry coursework better.
However, before embarking on module development, it appeared to be necessary to validate the hypothesis
about student learning, and their struggles with foundational concepts and reasoning - and hence inform the
design of the first CLIx Maths module. In particular, it was important to get a first hand understanding of the
actual existing levels of geometric thought in high school students who are the likely audience for the CLIx
module, see how geometric thought progresses from middle school to high school, and get an initial idea of
how high school teachers understand and tackle high school geometry.
2. Purpose of the Visit
Page 3 of 29
With the above stated objectives in mind, the CLIx Maths team undertook a study in two schools in
Rajasthan in October 2015. The purpose of the visit was to:
a. Explore the actual existing levels of geometric thought in high school students who are the likely
audience for the CLIx module. (To corroborate or refute what the ‘impressions’ from the ground and
research seems to suggest.)
b. Make a rough estimate of the extent to which ‘geometric thought’ progresses (from middle school to
high school), given the existing situation and current modes of learning.
c. Explore the levels of geometric thought in high school teachers who teach these students, and also
understand their perspectives about the teaching and learning of Geometry.
3. School Selection
Due to various limitations, the study had to be limited to two schools. It was decided that one of the two
schools picked should represent a ‘high potential’ school among the CLIx schools in the state, while the
other should represent a school with challenges. It was surmised that this would provide enough variation
for the purposes of this study. Based on this, two schools, School 1 and School 2 were picked, the former
being the one with high potential.
Two different sources of information were consulted for the data to aid the school selection:
Source 1: Data provided by the CLIx state partner organisation, and also, the observations of their field
support personnel who had visited the schools directly.
Source 2: Data provided by the Shala Darpan portal of the Rajasthan RMSA (Rashtriya Madhyamik Shiksha
Abhiyan). Data on student enrolment, as well as strength and qualifications of staff was available.
Note on U-DISE data: The data from U-DISE surveys is useful as well since it showcases the percentage of
students appearing in and successfully passing tenth and twelfth class examinations. It also provides data on
the promotion rates among secondary classes (although this aspect was found incomplete in several district
school reports). However, it was found that no data existed in U-DISE data for School 1. Moreover, for
School 2, the U-DISE data was not consistent with the data from RMSA and even from the team’s own
school visits. Hence, this study only used U-DISE data only in cases where data was not available from
other sources, and with the rider that the data might not be accurate.
Regarding the school potential, the observations of the field personnel (which are in line with the data from
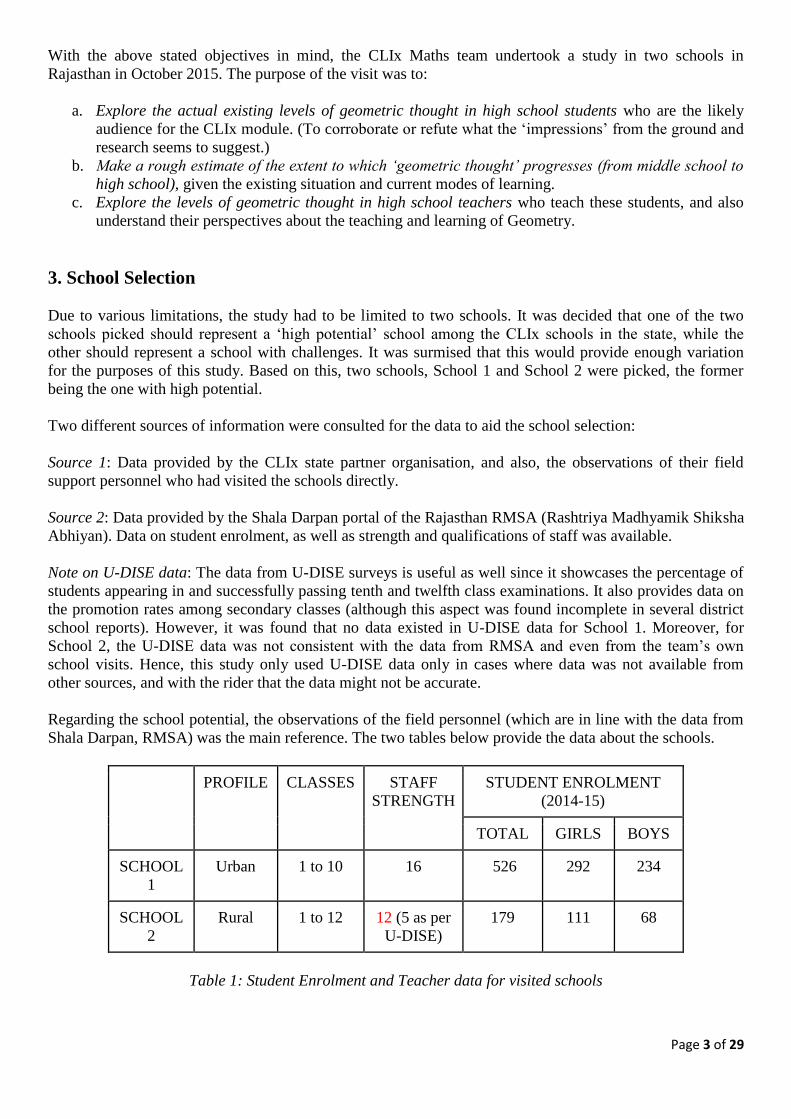
Shala Darpan, RMSA) was the main reference. The two tables below provide the data about the schools.
PROFILE CLASSES STAFF
STRENGTH
STUDENT ENROLMENT
(2014-15)
TOTAL GIRLS BOYS
SCHOOL
1
Urban 1 to 10 16 526 292 234
SCHOOL
2
Rural 1 to 12 12 (5 as per
U-DISE)
179 111 68
Table 1: Student Enrolment and Teacher data for visited schools

Page 4 of 29
PROMOTION
FROM 9 TO
10
GRADE 10 PASS PERCENTAGE
2014-2015 2013-2014 2012-2013
SCHOOL 1 70.0% 90 73 70
SCHOOL 2 85% (59.7% as
per U-DISE)
46 93 62
Table 2: Student performance data for visited schools
The process of school selection, and later, data from the assessments done, revealed various discrepancies in
the data pertaining to the schools. Based on the narrative of the field personnel, the two schools represented
two extremes (in terms of opportunities and challenges) among the schools chosen for CLIx in Rajasthan.
School 1 was perceived as one among the top-performing Govt. schools in Rajasthan (the principal showed
a recent newspaper article praising the school and mentioned that students came to study there even from a
distance due to its repute). School 2 was representative of a school with many challenges situated in a not-
so-well connected area on the outskirts of Jaipur city, with an acute shortage of teachers (Class 11 students
said they had no teacher and only sometimes the primary school teachers would teach them, and the Class 7
teacher was on a month-long leave leaving the class unattended). While the assessment data gathered during
the study validated this viewpoint, the U-DISE data seemed to suggest otherwise.
Another interesting observation was that Class 7 had less students than Class 9 in both schools (Table 3),
while the expected trend is of students dropping out, and class strengths reducing, as the classes progress.
Class 9
School 1
Class 9
School 2
Class 7
School 1
Class 7
School 2
Number of
Students
61 48 50 27
Table 3: Student Enrolment for Classes 9 and 7
A plausible explanation for more students in the secondary class is that these schools were ‘feeder schools’
for multiple (around 4-5) primary schools in the nearby areas. Another point worth mentioning is that
parents often prefer their wards to be admitted to a secondary/senior secondary school, since it avoids
transfer burdens later. Hence, these two schools can be expected to have a larger catchment area. A by-
product of having a large catchment area is that the classroom backgrounds stay more or less homogeneous.
This homogeneity allowed us to compare performance data on our diagnostic tool, across class as well.
4. Methodology and Tools
Three different activities were conducted in each school:
● Student Assessment Tool: A common paper and pencil assessment for students of classes 9 and 7, to
assess performance on tasks related to geometric thinking and logic.
● Student Small group Interviews: Follow-up interviews with students, in small groups.
● Teacher Interviews: Discussions with the maths teachers teaching class 9 and 7.
4.1 Student Assessment Tool (paper and pencil)

Page 5 of 29
The beginning ideas for the student assessment tool1 comes from the standard Van-Hiele assessments test
(Usiskin, 1982). However, that included five items pertaining to each of the five Van-Hiele levels as defined
in the box below, while the tool used in this study had items related to the first four Levels (0 to 3) only.
(The highest level, Rigour, was not included in our tool as it is hardly encountered in high school students.)
Also, there were fewer items from each level, and the focus was on Levels 0 to 2.
The Van-Hiele Levels of Geometric Thinking (from Shaughnessy and Burger, 1985)
Level 0- visualization. At this level, a geometric figure is seen as a whole. No
attention is given to its component. Descriptions are purely visual. If asked why
he or she called a figure a rectangle , a student might reply, “Because it looks like
a rectangle. It is like a window or a door.” (These descriptions use a visual
prototype.).
Level 1- analysis. Students at this level think of a rectangle as a collection of
properties that it must have (necessary conditions). When asked why a figure is a
rectangle, the student’s response would be a litany of properties: “Opposite sides
are parallel, opposite sides are congruent, opposite angles are equal, you have
four right angles… ”
Level 2- informal deduction. At this level, student can select sufficient conditions
from the “litany” just described to determine a rectangle. That is, the student
orders properties logically and begins to appreciate the role of general definitions.
Simple inferences can be made, and class inclusions are recognized (e.g., square
are rectangles)
Level 3- formal deduction. At this level the role of axioms, undefined terms, and
theorems is fully understood, and original proofs can be constructed. Many high
school courses presently approach the study of geometry at this level.
Level 4- rigor. Comparisons between different axiomatic systems can be made at
this level. For example, what happened to geometry if we do not assume the
parallel postulate? (This level is rarely encountered by high school students.)
It is important to note here, that our assessment tool and the analysis that followed was not just limited to the
Van Hiele levels of reasoning as defined by Shaughnessy and Burger (1985) but it also evolved from the
ideas of sub-levels of understanding as defined by Battista (2007). Moreover, while the tool used in the
Usiskin study were all in the five-option MCQ format, the tool used in this study had 12 questions in a four-
option MCQ format, followed by 5 constructed response items, including some open ended questions. The
pattern of questions was based on the standard tool used in the earlier (Usiskin) study on Van Hiele levels,
but the form and content of the questions were modified to fit the context. The format of the tool is
elaborated in the table below:
Question
items1
Format Van-Hiele Level Rationale
1, 2, 3 MCQ Level 0 (Visual) The question items were pertaining to
shape recognition and understanding of
shape (concept image of square, triangle
1 Appendix 1C
Page 6 of 29
and parallel lines). Apart from checking
that it also brings some specific
conceptual difficulties students have in
identifying or understanding parallel
lines.
4, 5, 6 MCQ Level 1
(descriptive/
analytic)
The question items tries to check
whether students could relate to the
description and analyse the properties of
the shapes.
7, 8 MCQ Level 2
(informal
deduction)
The items were related to class inclusion
(informal deduction)
9, 10 MCQ Level 3 (formal
deductive
reasoning)
The items were to check student’s
formal deductive reasoning.
11, 12 MCQ Deductive logic
(outside
geometry)
These were not geometry questions but
general logical question to see students
general reasoning skills.
13, 14, 15 Constructed
Response
Item:
Open
Ended
Levels 0 to 2 While the rest of the questions were
MCQ type, these questions were
descriptive and open ended. Questions
13, 14 and 15 were aligned to Levels 0,
1 and 2 respectively.
16, 17 Constructed
Response
Item:
Textbook
Exercise type
Level 3
(Based on
textbook
questions which
uses geometric
results)
To check how well the students perform
on typical textbook-type formal
reasoning items. The idea was also to
see the correlation, if there is any, in
students’ performance in their regular
school questions and questions posed by
our tool.
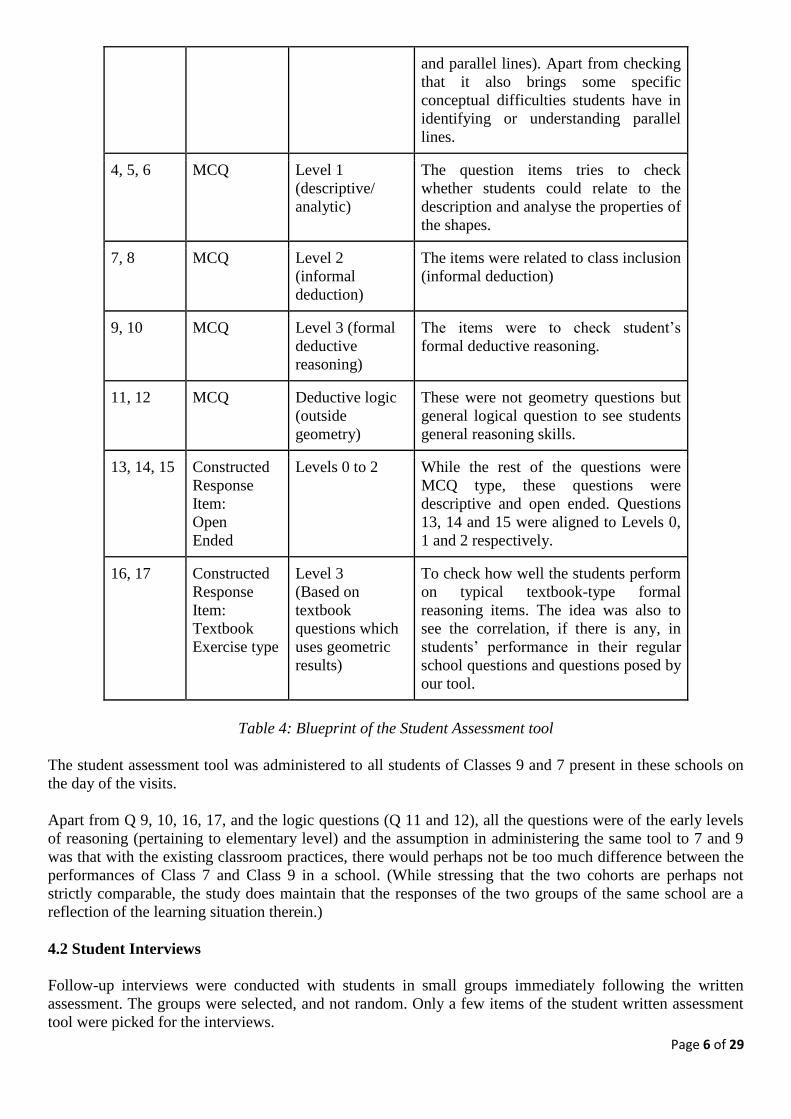
Table 4: Blueprint of the Student Assessment tool
The student assessment tool was administered to all students of Classes 9 and 7 present in these schools on
the day of the visits.
Apart from Q 9, 10, 16, 17, and the logic questions (Q 11 and 12), all the questions were of the early levels
of reasoning (pertaining to elementary level) and the assumption in administering the same tool to 7 and 9
was that with the existing classroom practices, there would perhaps not be too much difference between the
performances of Class 7 and Class 9 in a school. (While stressing that the two cohorts are perhaps not
strictly comparable, the study does maintain that the responses of the two groups of the same school are a
reflection of the learning situation therein.)
4.2 Student Interviews
Follow-up interviews were conducted with students in small groups immediately following the written
assessment. The groups were selected, and not random. Only a few items of the student written assessment
tool were picked for the interviews.

Page 7 of 29
For the selection of a small group, student answer scripts were skimmed, and students choosing different
options students were asked to explain the rationale for choosing a particular option, and defend their choice
to others in a small group. The small groups were formed on the spot based on a quick skim through the
answer scripts, and identification of students who had selected different options on one or more of the
selected questions. The interviewer facilitated the discussion and debate. Pre-designed (and sometimes
improvised) extension tasks2 were asked to get a full sense of students’ concept images.
Current classroom practices not being very supportive of discussion and dialogue among students, the
rationale of doing the interview in small groups was that the students might be more comfortable articulating
their thinking in smaller groups.
4.3 Teacher Interviews
For the teachers, a teacher questionnaire3 was used for reference, but the actual interviews were free
flowing. The teacher interviews were carried out while the students were doing the test - this seemed to
work well, as teachers tend to get overly anxious watching their students go through the assessment. The
teachers were asked some general questions to understand their beliefs about maths and maths learning, with
a focus on geometry. Later, the student tool was also discussed with them, and they were asked to analyse
the items and make conjectures about possible common wrong options selected by students.
In School 1, the team interacted with the Principal too.
5. Observations and Findings
The findings from the study are discussed in three sub-sections – 5.1 Existing Practices, 5.2 Findings from
Student Assessments, and 5.3 Teacher Interaction Report.
5.1 Existing Practices
Curriculum: The textbooks followed by both schools (in both class 7 and 9) were in line with the one
published by the NCERT. The class 9 textbook proceeded as per the structure of formal mathematics. For
instance, the textbook chapter on quadrilaterals began with the introductory definition of quadrilaterals,
moving to special quadrilaterals, multiple theorems with complete proofs, solved examples, and the section
culminated in exercise problems for the concepts learnt. The exercise problems are also based on the
student's knowledge of formal proofs.
Pedagogy: While the team did not observe any geometry lessons in progress in these two schools, questions
on classroom teaching were put to the teachers during the 1-1 interviews. In both schools, teachers
mentioned that most of the time, they would teach a topic directly from the textbook, and then solve all the
problems (given in the exercises) on the board, which the students would copy. When asked to estimate the
number of students in their class who would be able to solve at least a few of the textbook problems (mostly
based on formal proofs) on their own, both teachers replied, “Very few indeed.”
Assessment: The assessments (summative) for class 9 appeared to be tightly aligned to the textbook
exercises, with few or no questions that assess problem solving skills. This is evident in the snippet provided
below from the 2014-15 summative assessment (conducted in March 2015):
2 Appendix 1A and 1B 3 Appendix 2

Page 8 of 29
Exhibit 1: Snippet from school summative assessment (2014-15)
The 2014-15 U-DISE data further indicates that the school was not implementing Continuous and
Comprehensive Evaluation (CCE).
Other observations: In School 1, the headmaster took pride in his school’s achievements and seemed to have
built a culture of openness and dialogue amongst students and teachers. But at the same time, he admitted
that in their school, geometry learning was not stressed - opining that it was not a worthwhile topic to spend
time on, as topics like arithmetic and simple interest held more instrumental value.
In general, there appeared to be a huge difference in terms of the culture prevalent in the two schools. In
School 1, the students were obviously used to open interactions (including with the teachers, the headmaster
and even visitors from outside), while in School 2, the students were reticent to the extreme, and difficult to
draw into even an ordinary conversation, let alone on-task discussions.
5.2 Findings from Student Assessments
The data from the 12 MCQ questions in the written tool were analysed quantitatively, and the responses
from the 5 remaining questions were analysed qualitatively in detail. The data from the follow-up interviews
with small groups of students was also used in the analysis. The analysis from the student assessments is
divided into two sections – Summary of Findings, followed by the more detailed Thematic Discussions.
5.2.1 Summary of Findings
1. Class-wise average scores: Overall learning levels were quite low, even in School 1, though overall,
School 1 had higher learning levels than School 2, especially in Class 9.
9 School 1
(n = 45)
9 School 2
(n = 37)
7 School 1
(n = 32)
7 School 2
(n= 23)
AVERAGE4 (%) 28 15 17.5 12
HIGHEST 7 4 4 3
LOWEST 0 0 0 0
4 For the class averages, only data from the MCQ questions related to Geometry (Q1 – Q10) has been used.

Page 9 of 29
Table 5: Class-wise average scores
2. Class 9 vis-a-vis Class 7: There was a fairly large difference between the average scores (28% vs 17.5%),
of Class 9 and Class 7 students in School 1, but a negligible difference between the average scores (15% vs
12%) of the two classes in School 2.
3. Levels of geometric thinking: In both schools, many students across both class appeared to be operating at
the initial, ‘Visual Reasoning’ level of thought for 2D shapes (as revealed in the interviews). Even those in
Class 9, hardly ever talked about the properties of shapes, almost always falling back on classic visual level
responses – responding with ‘because the shape looks like/does not look like’ kind of reasoning. When they
did talk about properties, most students used very primitive and imprecise vocabulary.
In School 2, almost all students were thinking at the Visual Reasoning level, and in fact, a few were in the
initial Pre-recognition level within that - where they could not recognize even basic shapes (for instance, a
square in regular orientation).
(Also see discussion on Articulation of Reasoning- points 5 and 6.)
4. Common misconceptions: Some of the items revealed similar patterns of misconceptions (or gaps in
understanding) across the schools and classes, with students not recognising ‘turned’ squares and instead
identifying shapes that appear like a square in the common orientation.
Some ‘new’ (read unanticipated!) misconceptions were revealed in the interviews, some of these might even
be language-specific or region-specific - taking ‘parallel’ (samantar) and ‘equal’ (saman) to mean the same
thing.
These misconceptions are not necessarily improving with time. In fact, they are sometimes getting
strengthened. (See section 5.2.2, performance data on Q 2)
5. Articulation of reasoning (in written Constructed Response Items): Apart from Class 9 in School 1, very
few students in the other three groups wrote answers in the section with constructed response items. Giving
reasoning for responses was almost totally absent in these three groups.
Only a handful of students in Class 9, School 1, and almost none in Class 9, School 2, could articulate clear
lines of reasoning in some of the informal and formal reasoning questions in the Constructed Response
section. On a direct reasoning question related to finding the third angle of a triangle with two angles given
(a property taught in Class 7), 78% of the Class 9 group in School 1 attempted the question, but less than
20% got it right with reasoning. Only 11% of the Class 9 students in School 2 attempted this question, and
none got it right.
9 School
1
(n = 45)
9 School
2
(n = 37)
7 School
1
(n = 32)
7 School
2
(n= 23)
Correct answer with correct
reasoning (%) 18 0 0 4.3
Correct answer without correct
reasoning (%) 4 0 0 0
Attempted the question (%) 78 11 0 4

Page 10 of 29
Table 6: Students performance in the constructed response item Q 17(a)
Only 1 student out of the entire lot of 127 students assessed used formal and symbolic language of
mathematics correctly (mentioning properties like ‘linear pair’, using ‘implied’ symbol, words like
‘therefore’ etc.)
Exhibit 2: Response of student J9_40 showing correct use of symbolic language
6. Articulation of reasoning (in Interviews): One major difference between the two schools was seen to be
the confidence in articulating their responses. While a large number of students in School 1 justified and
defended their respective points of view strongly in the interviews, in School 2, most of the students barely
spoke - responding with 1-2 words when they did. In School 1, girls and boys spoke with an equal degree of
confidence, while in School 2, the girls were reticent to the extreme, and some could not be drawn into the
discussion at all.
In School 1, the students seemed to be learning quickly through the discussion and debate that was
generated, often identifying their own erroneous ideas. Interestingly, in at least one case, a student, who had
a misconception about the concept of shape, managed to convince another, who originally answered
correctly, that the latter’s reasoning was incorrect!
The student interviews underlined two critical aspects of learning- the role of the facilitator, and the
importance of bringing the students’ thinking to the fore.
7. Response to the logic questions: Interestingly, in the two logic questions, the correct-response averages in
classes 7 and 9 were almost identical, especially in School 2.
9 School 2 (n = 37) 7 School 2 (n = 23)
% of students who got Q 11 correct 22 22
% of students who got Q 12 correct 8 9
Table 7: Performance of School 1 students in the logic questions
In School 1 too, the averages were very close (20% and 16%) in Q 12, though in Q11, Class 9 students
identified a language issue in the options (a clue related to gender in the verb form in Hindi, which was not
so in the English version of the question) and gamed the answer.
The clustering of responses to one the logic questions (Q 12), and the follow up interviews revealed that
while they were not guessing randomly, they were only able to do partial analysis of the problem –
considering only the first among the statements given. This has implications for instruction (discussed in the
last para in the section on Deductive Reasoning).

Page 11 of 29
5.2.2 Thematic Discussions
Student Understanding of Geometric Concepts
The initial items of the student tool and the extension tasks in the student interviews were designed to
capture students’ understanding of shape and other geometric concepts (the meaning of ‘parallel’, for
instance). The data revealed interesting patterns of misconceptions, which on being investigated further in
the interviews, revealed students’ thinking about shape and space.
Some of the richest data, both from the test and the subsequent interviews, came from this question.
Q1.Which of the following is a square?
Performance data for Q 1 (in %)
Option 9 School-1 9 School-2 7 School-1 7 School-2
A (Correct option) 36 8 16 4
B (Most chosen) 42 54 50 48
Exhibit 3: Group-wise performance data (averages) on Q1 of Student Assessment
As the data reveals, nearly half the class, in all groups (including Class 9, School 1), thought that shape B
was a square, and A was not. Clearly, this misconception is not diminishing over time. In fact, at face value,
it appears as if they are sometimes getting strengthened (a higher percentage of the Class 9 group in School
2 have opted for option B than that of Class 7!)
The subsequent interviews revealed that most students think of shapes based on familiar visual ‘prototypes’.
Some have clearly abstracted orientation as a factor that affects shape. This question and the related

Page 12 of 29
interviews also revealed clearly that the students’ notion of ‘shape’ was something that ranged from tenuous
to outright problematic. For instance, one student (of Class 9, School 2), who held the notion that the ‘shape
of a object changed on changing orientation’, articulated an extremely powerful reasoning supporting his
idea.
The data also revealed what might possibly be a language or region specific misconception. While the item
on recognition of parallel lines was included with a pre-supposition that students might only recognize
parallel lines in familiar visual archetypes (horizontal/vertical and aligned), what could not be predicted was
the student thinking that ‘parallel lines are necessarily congruent’.
Q2. In which of these figures are the lines parallel?
A) only P, R and S
B) only P
C) only P and S
D) only Q
Performance data for Q 2 (in %)
Option 9 School-1 9 School-2 7 School-1 7 School-2
C (Correct option) 11 11 0 0
B (Most chosen) 56 54 63 39
Exhibit 4: Group-wise performance data (averages) on Q2 of Student Assessment
The interviews revealed that many students thought the terms ‘equal’ and ‘parallel’ were equivalent. In the
interviews on the second day, an extension task (Exhibit 5) was used to investigate this further.
This task clearly revealed the extent of the misconception, with some students even calling Pair 1 parallel.
One of the possible reasons for this, is that the Hindi words for these terms – ‘saman’ for equal and

Page 13 of 29
‘samantar’ for parallel, sound rather similar, though they are actually self-explanatory. Some students when
asked whether these terms mean the same thing or different, replied that they meant the same.
Classify each of the given pairs as parallel or not parallel, and justify your choice.
Exhibit 5: Extension task related to Q2 of Student Assessment
(Showing that some students do not differentiate between the terms ‘equal’ and ‘parallel’)
Levels of Geometric thinking As mentioned earlier, the student assessment tool and the extension tasks were designed to explore how the
target students respond to different Van Hiele level tasks (for 2D shapes).
The data and the interviews showed that most Class 9 students were still functioning at the very basic level -
the Visual-Holistic5 reasoning level, when it came to 2D shapes and related concepts. Very often one heard
phrases like, “this can’t be a triangle, because it just doesn’t look like one any which way.”
Within the Visual-Holistic level, most students were at the Recognition level – where they could identify
common shapes in regular orientation, while some (particularly in School 2) were at the Pre-recognition
level, where they could not recognize or draw even common shapes (like a square or a rectangle) in regular
orientation.
A few students appeared to have some success at some of the tasks related to analysis of properties of a
shape (Level 1 tasks) - they seemed to be operating at the initial phases the Analytic-Componential6
Reasoning level (Analysis, as per Shaughnessy and Burger). Students made some attempt to talk about
properties of shapes, but using very primitive vocabulary.
Researcher: What is a square?
Student: It has congruent. (Uss mein saman hota hai)
They mostly responded in one or two words, not using almost any descriptive vocabulary except ‘saman’. In
addition to being very limited, their geometric vocabulary was also imprecise when used - like referring to
the sides of the shapes as ‘lines’ (‘rekha’ instead of ‘bhuja’). Very few students spoke about angles or
5 Named as per the revised levels of geometric thinking given by Battista, 2007 6 Named as per the revised levels of geometric thinking given by Battista, 2007

Page 14 of 29
vertices (kon) of the shapes, only a couple mentioned right angles (nabbe degree ka kon) when talking about
squares.
Only a very small number of students (1-2 in each school) were successful in the higher level reasoning
tasks, like the hierarchical shape classification task shown below:
Q8. Which of these can be called rectangles?
A) all can be called as rectangles
B) only Q
C) only P and Q
D) only Q and R
Performance data for Q 8 (in %)
Option 9 School-1 9 School-2 7 School-1 7 School-2
A (Correct option) 20 30 13 0
C (Most chosen) 29 30 9 61
Exhibit 6: Group-wise performance data (averages) on Q8 of Student Assessment
Even the teachers had trouble with these, with one teacher choosing option ‘A’ (the correct option) as the
common wrong answer that students might pick!
An extension activity used in the interviews was a task adapted from Shaughnessy and Burger (1985), where
students were asked to sort the figures shown in Exhibit 7 into two groups – those which are quadrilaterals
and those which are not, or, those which are parallelograms and those which are not, or even, those which
are rectangles and those which are not.

Page 15 of 29
An important observation was that even students who exhibited higher level thinking intermittently, often
tended to fall back on visual reasoning when cognitive dissonance was generated – demonstrating that they
had not yet fully acquired that level. Exposure to limited ‘prototypes’ of a shape (in class) also came up as a
factor when students often said that was what they had seen (or not seen). For instance, one student, even
while admitting that a shape could be referred to both as a ‘rectangle’ and a ‘quadrilateral’, ultimately
rejected Shape 9 as a quadrilateral saying ‘hum ne aisa chaturbhuj dekha nahi hai kabhi’.
Sometimes, the students were seen to actually jump to higher levels during the interaction. A case in point
was the student who started by saying putting a number of shapes in the above list in the ‘Not a
Quadrilateral’ list. But soon, he had second thoughts, and wanted to change his stance. In fact, he had an
epiphany of sorts during the interview itself, when he remarked (while convincing another student why
Shape 11 was a quadrilateral) that “I just realised, that actually ALL these are quadrilaterals!”
Deductive Reasoning
There were four items in the tool that required student to use deductive logic to solve – Q9 – Q12. Two of
these (Q11 and 12) were pure logic questions in general contexts, unrelated to geometry.
Of these, Q 11 was a logic question related to the understanding of truth vs logical validity. The data from
this question has to be discounted somewhat, because the Hindi version added a component of gender in the
verbs (khelti/khelta), due to which some students could guess the correct answer. However, it is still
interesting to note here that the wrong answers here clustered around a common wrong option, A, indicating
two important things:
● Except for class 9 Jaipur, in all the other groups around 40% of students are looking at the ‘truth’ (in
this case, probably an observation that most boys play football) of a statement while choosing the
answer, rather than logical validity.
● Students are using some rationale to arrive at the answer, it’s not a random choice.
Q11. In Chanakyapur, ALL cats play football. Shalu lives in Chanakyapur.
If both the above statements are true, which of the following statements must
DEFINITELY be true?
A. If Shalu is a boy, he plays football.
B. If Shalu is a dog, he cannot play football.
C. If Shalu is not a cat, he cannot play football.
D. If Shalu is a cat, he plays football.
Performance data for Q 11 (in %)
Option 9 School-1 9 School-2 7 School-1 7 School-2
D (Correct Option) 78 22 34 22
A (Most Chosen) 13 41 38 39
Page 16 of 29
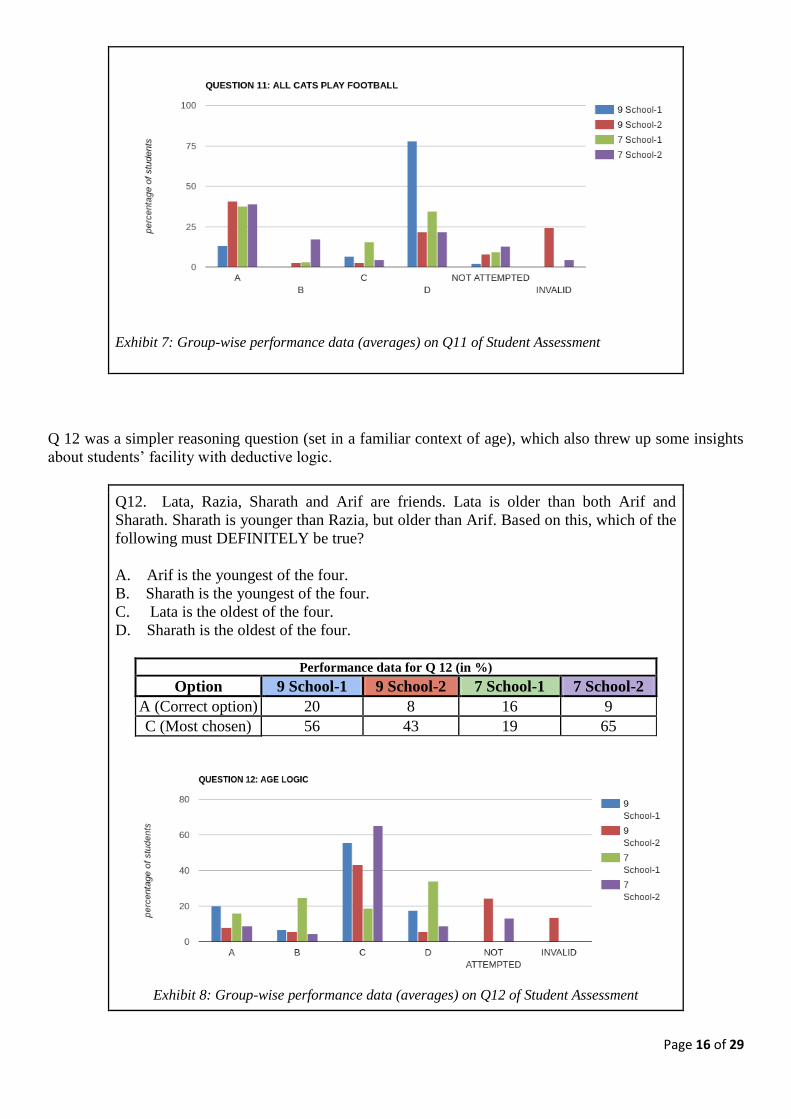
Exhibit 7: Group-wise performance data (averages) on Q11 of Student Assessment
Q 12 was a simpler reasoning question (set in a familiar context of age), which also threw up some insights
about students’ facility with deductive logic.
Q12. Lata, Razia, Sharath and Arif are friends. Lata is older than both Arif and
Sharath. Sharath is younger than Razia, but older than Arif. Based on this, which of the
following must DEFINITELY be true?
A. Arif is the youngest of the four.
B. Sharath is the youngest of the four.
C. Lata is the oldest of the four.
D. Sharath is the oldest of the four.
Performance data for Q 12 (in %)
Option 9 School-1 9 School-2 7 School-1 7 School-2
A (Correct option) 20 8 16 9
C (Most chosen) 56 43 19 65
Exhibit 8: Group-wise performance data (averages) on Q12 of Student Assessment

Page 17 of 29
Both the data, showing clustering around one wrong option, C, and the student interviews showed that
students are only doing partial analysis of the problem. They are unable to use strategies to reconcile the first
statement “Lata is older than both Arif and Sharath”, with the second, “Sharath is younger than Razia, but
older than Arif” - and choosing an answer based only on the first statement.
This has clear implications in terms of instruction, because while the curriculum might expect them to
consider and understand two statements (or two parts of a statement) in conjunction, the students might not
have the facility to deal with them. For instance, the different clauses in the first part of the statement: “If a
quadrilateral has two pairs of parallel sides and equal diagonals, it is a rectangle.”
5.3 Teacher Interaction Report
Two teachers, one from each of the two schools, were interviewed during the visit. In School 1, the same
teacher was teaching both 7 and 9, in School 2, the class 9 teacher was interviewed. The maths teacher of
class 7 was away on long leave.
On choosing teaching as a profession: When asked about the reason for choosing teaching as a profession,
both teachers indicated that teaching was a choice arising more because of convenience. One teacher
mentioned that while she liked maths and was good at it, the choice was more because it’s a ‘comfortable’
job if one wants to take care of family. The other teacher worked with various NGOs before joining this
school, and saw this job as simply ensuring ‘permanence’ as opposed to a non-Govt. job (the words
“permanent sarkari naukri” were actually mentioned).
On the Issues and Challenges of Teaching Maths: When asked to talk about the issues and challenges they
face in teaching maths in high school, the first teacher mentioned the usual ‘basics not being clear’ as the
reason for their not understanding stuff and relying totally on memorization. The School 2 teacher
mentioned that he had to do the problems on the board repeatedly before the students could write them
(although not said in so many words, it was clear that the students were not expected to do much on their
own, but just by rote).
A related question was about their perception of (and expectations from) the students. The school 1 teacher
made an interesting observation from her 17 years of experience of having taught both rural and urban
schools, that while there was not much difference, she still felt that rural schools have better students, since
it’s not like the urban scenario there - where all promising students are sent to private schools. She also felt
that the large percentage of girls in the rural schools was an additional reason for rural schools being
marginally better.
On the Teaching-Learning of Geometry: When asked about the toughest topic/strand in 9-10 class
mathematics, the teachers mentioned geometry, and in particular, proofs, in addition to algebra (‘variables’).
The teacher in School 1, when asked about the probable causes of this, immediately mentioned that in
geometry problems need thought and reasoning (‘soch ke karna padhta hai’) She also opined that students
think ‘maths means numbers’, and are unable to cope with geometry because it’s different from that
perception.
When asked about why Euclidean Geometry is taught, the School 1 teacher initially said it’s needed for
higher classes, but when asked which areas in higher classes are based on this topic, she thought again, and
changed her response to say that Euclidean geometry and proofs are not really needed at class 9-10 level.
Interestingly, the principal of this school was quite eloquent about how he thought geometry was useless and
the only thing that was important for students to learn were things that had immediate practical use for them
– like percentages, money, banking etc. But he added, that since our focus was going to be geometry, he
would focus on that now – and that it would be an easy thing anyway, since the “whole of geometry could
be taught in a week.”

Page 18 of 29
Both teachers were also asked specifically about how they would go about teaching a particular piece of
geometry content – namely, the angle sum property of a triangle. Both teachers mentioned starting with a
triangle drawing and verification activity. The teacher in School 1 mentioned that she first revisits the
elements of a triangle with them, and then goes to the verification activity. For class 9, she does not do the
verification, but just reminds them of the property, saying, “As you have studied before” and then goes on to
the formal proof. The teacher in School 2 said that after the verification, he straightaway wrote the proof on
the board. He was then asked how he would respond to a student who might say that ‘I know that the sum of
the three angles of a triangle are supposed to add up to 180 degrees, but I don’t think that really happens
when you measure them.’ (This was an actual example from the previous day’s student interactions). He did
not have any response to this.
Neither teacher seemed to have thought about how to make the transition from ‘verification’ to proof, or
displayed understanding of what verification is, how it differs from proof, or even why proof is necessary.
Teachers’ Understanding of Geometry: In the second part of the interview, the student assessment tool was
discussed with the teachers, and they were asked to comment on specific questions. The teacher in School 1
was able to comment meaningfully on most questions – discussing the purpose of the question, predicting
the commonly chosen wrong option correctly, etc. She made astute observations about some of the questions
(predicting the likely misconception in Q7, for instance) – which were later proved right by data. However,
the response to some of the tasks revealed gaps in understanding on the teacher’s part (Discussed in the
section on Levels of Geometric Thinking). The teacher in School 2 was not able to participate very
meaningfully in the discussion related to the items and their mathematical content, except on a few initial
questions.
6. Recommendations
The data from the student assessment and in particular, the interviews confirm that most students are at very
initial levels of geometric thought, holding tenaciously to alternate conceptions that they have formed about
shape, and would need learning experiences that would provide them ample opportunities to describe and
analyse shapes using (progressively) refined geometric vocabulary, and then proceed to reasoning about
shapes.
The visit also raised a few issues and concerns related to the module. Of the two schools visited, one was
supposed to be representative of a high performing school in Rajasthan, and the other, that of a low
performing school. Before the visit, the impression was that in most schools the learning levels would
perhaps be like the former. The visit was a reality check which suggested that there would be perhaps be
many schools like the latter school, where the majority of students in the class might not be able read
fluently, write in clear and complete sentences, identify basic shapes or their properties. They are likely to be
unused to thinking or communicating independently, asking questions, or even speaking much in class.
These would need to be specifically addressed in the design of the module and TPD.
One point related to this that merits further discussion, is the difference in terms of the readiness for
mathematical discourse between the two schools, and the reasons for the same. In School 1, most students
were nowhere near the required levels of geometric reasoning, but the students were much more articulate
and disposed towards participating in mathematical discourse. This is probably something to do with the
culture of the school and the exposure that the students here get. The principal appeared to encourage and
actively promote student interactions within the school, and also interactions of the students with the outside
world. The CLIx maths module has to build upon the existing foundation in schools like this one, and focus
on building a culture of meaningful mathematical discourse in schools where it does not yet exist.
There were several other questions and concerns that came up during the visit, the most critical of them all
being teacher capacity and teacher beliefs. It was quite obvious that many of the teachers in the target
schools themselves have insufficient understanding of the content they need to teach – they seem to have at
Page 19 of 29
least some of the misconceptions and learning gaps that the students had. Also, they are used to a very
orthodox pedagogy. As such, what the CLIx Maths offering is proposing is nothing short of a revolution.
Ultimately, no matter how well designed the learning resources are, it is the teacher who would need to
believe in the proposed changes, and facilitate the classroom discourse that is critical in facilitating learning.
This has some clear implications for TPD.
This section below has some suggestions and recommendations based on the field experience.
6.1 Recommendations for Module Development
● The starting point of the module would need to be lowered, to include some foundational activities
that aim to help students develop a robust conceptual understanding of ‘shape’.
● A comprehensive remedial list that might be required (irrespective of whether these may actually
exist, or are usable as open source) needs to be created. A related point would be to do a thorough
resource search amongst the Khan Academy (Hindi version) videos.
● While the Class 9 group in a school cannot be compared directly to that of the Class 7 group in that
school, the performances could still be considered indicative. The performance data does seem to
suggest that not enough gains are happening over time in either reasoning or conceptual
understanding. One possible reason for this could be the absence of focus on thinking and reasoning
in the Maths class currently, the module will definitely need to specifically focus on developing the
habit of reasoning among the students.
● Just tasks and activities, no matter how thoughtfully designed, are not going to be enough for better
learning - the kind of discussions and dialogue that need to happen in the class during and after each
task needs to be specifically woven into the lesson plans. Small group discussions seem to work well,
the module should have enough tasks designed around these.
● The module should provide the flexibility to adapt to local contexts and variation in student learning
levels. Specific localized issues, challenges, even misconceptions have to be researched and
targeted. A case in point was the ‘saman’ vs. ‘samantar’ issue. (It is also possible that in some cases
there are some localized strengths– they need to be built upon).
● Translations, reverse translations and validation of translated resources through trials on the field
should become an integral part of the development process. Localization of mathematical terms,
language etc. are very important for the module to be effective. (In particular, translation of any
resource would be a large step in itself, requiring several discussions and iterations).
● In School 2, a fair number of class 9 students could not read Hindi fluently, this could pose
challenges for the module. This needs to be researched further.
6.2 Recommendations for TPD
● The existing levels of geometric thinking (or the gaps in understanding, whichever way you choose
to call it), are closely linked to the pedagogy and the exposure the students get in class (for instance,
student after student falling back on visual reasoning, saying ‘I have never seen a
square/triangle/quadrilateral like this’). Only limited visual prototypes of a class of shapes are
shown, and not enough variations that represent the class. Also, the students do not connect the
properties used to define a class of shapes with the visual prototypes because the have never been
pointed out to those connections. The pedagogy component of the Maths TPD course needs to help
teachers identify and address such teaching-learning gaps.
● Keeping in mind the existing content understanding of the teachers, the TPD planned for them
(unlike, say TPD for i2c) will need to address not only the technology or the pedagogy aspect of
CLIx, but even actual content knowledge (MKT- Mathematical Knowledge for Teaching). This
engagement with the teachers on the content and pedagogy aspects has to be a sustained one. This is
critical for the module to be implemented meaningfully.

Page 20 of 29
● The target teachers are clearly only used to writing solutions on the board and having students copy
them. They will need a lot of inputs related to facilitating meaningful maths discourse, and
establishing a classroom culture where such discourse is valued. They would also need a lot of
practical experience in this before the actual module commences.
● Another point related to TPD is whether the Maths TPD module should focus on high school
teachers only, leaving out middle school teachers completely. Mathematical concepts being so inter-
related, a TPD that is aimed solely at high school teachers, particularly when we are talking about
previous class competencies not having developed, could be potentially problematic.
● It may be useful to enable teachers to see themselves as researchers, and independently carry out the
kind of interviews done by the CLIx team, analyse student responses, and then weave the feedback
back into their teaching.
6.3 Scope for Further Research
While the study provided some deep insights, it also threw up numerous questions related to the learning and
teaching of geometry. Some questions/issues that merit further study (especially through the actual detailed
geometry baseline study and during the course the CLIx module itself) are listed here. These will need to be
explored and/or sharpened to formulate actual research questions. A few areas of possible research in the
future could be:
● Further research on geometry learning – large scale study of geometry learning in 10% CLIx schools,
qualitative studies on students’ progression through the levels, students’ conception of shape and the
factors that affecting it, students’ (and teachers’) understanding of hierarchical class relationships,
student’ (and teachers’) notions about proof, being a few.
● The relation between students’ geometric thinking levels and their facility with logic.
● Research related to some of the actual misconceptions, including region/language specific
misconceptions.
● Examining the relationship between peer dialogue and the development of geometric thinking.
● Similar studies in other states, and perhaps a large scale study on geometry learning.
The study, carried out as a part of the background research for the first CLIx module, gave the team
invaluable insights about student learning and teacher beliefs to inform the design of the student and TPD
modules. It also provided pointers towards ideas for further research, and tips for refining the methodology
and tools to be used for future detailed studies on geometry learning and teaching. The learnings and insights
from this visit in all the three focus areas of CLIx Maths – Module Development, TPD and Research.
References
● Battista, M. T. (2007). The development of geometric and spatial thinking. Second handbook of research on
mathematics teaching and learning, 2, 843-908.
● NCERT (2006). Position Paper by the National Focus Group on Teaching of Mathematics.
● Shaughnessy, J. M., & Burger, W. F. (1985). Spadework prior to deduction in geometry. The Mathematics
Teacher, 78(6), 419-428.
● Usiskin, Z. (1982). Van Hiele Levels and Achievement in Secondary School Geometry. CDASSG Project.
● Mayberry, J. (1983). The Van Hiele Levels of Geometric Thought in Undergraduate Preservice Teachers. Journal for Research in Mathematics Education, Vol. 14, No. 1, 58-69. Published by: National Council of
Teachers of Mathematics. ● NCERT (2006). Syllabus: Volume 1, Elementary Level.
● NCERT (2006). Syllabus: Volume 2, Secondary Level.

Page 21 of 29
Appendices
Appendix 1A, 1B: Extension Tasks
Student Interview Tasks for Rajasthan School Visit
Ask these to an individual student first, then call a small group to generate a discussion (or call a small
group with diverse opinions on some of the shapes, after going through their answer sheets). Get students to
talk about something that they feel good about (recalling a recent happy day from their lives, for instance)
before starting with the interview questions.
A. Extension of Level 0 tasks: Particularly for students who have got Q1 - Q3 wrong, ask for reasoning.
For these students and also for students who get some of these wrong, ask to pick all triangles from list
below. Probe reasoning for each incorrect answer.

Page 22 of 29
Other visualization questions could be asked, like identifying right angle or obtuse angled triangle in
different orientation.
B. Extension of Level 2 tasks: First show a collection of quadrilaterals, and ask which of them are
parallelograms. Do NOT ask things like ‘Are all squares parallelograms?’ Ask only for specific figures.
Further probe can be focused on a few chosen figures, say 9, 7, 13, and 2.
Note the answers carefully to identify patterns of responses - are the students able to recognize only
parallelograms that are not rectangles or squares? Only parallelograms that are not rhombuses, rectangles
or squares, and so on. If the student is leaving out say, rectangles and squares, they can be asked why they
feel it is not a parallelogram. It is also possible to ask the students ‘What is a parallelogram?’
This could be followed up by ‘Are all rectangles parallelograms’, ‘Are all parallelograms rectangles’ kind
of questions.
C. Open ended tasks to understand readiness for formal proofs: Show a slightly non standard triangle
(maybe like fig 11 of the triangles list), and ask - 'What is the sum of the three angles of this triangle?

Page 23 of 29
If the student is able to answer this, ask, “Is it true for ALL triangles? How do you know that? Suppose you
have a friend who is not convinced that this is true for all triangles, what would you do? How would you
convince him/her?”
Do NOT mention the word proof or ask ‘How would you prove it’.
OR
Alternately, ask the students, “Suppose you have a quadrilateral with both pairs of opposite sides equal,
would the opposite sides be parallel? How would you know for sure?”
D. Extension/Justification for reasoning tasks: Ask students to justify their choice for Q12, and if the
group is articulate, also for Q11. Encourage them to articulate reasoning using whatever mode they want,
including drawing etc.
Appendix 1C: Learning Assessment Tool
Hkkx & 𝑨
iz'u 1 ls 12 esa lgh fodYi ij xksyk xyk,¡A 𝐴, 𝐵, 𝐶 ;k 𝐷 esa ls dsoy ,d fodYi ij xksyk yxk,¡A
1. fuEufyf[kr esa ls dkSulk ,d oxZ gSa?
A)
B)
C)
D)
2. fuEufyf[kr esa ls fdl fp= esa js[kk,W lekUrj gSa\
A) dsoy 𝑃, 𝑅 vkSj 𝑆
B) dsoy 𝑃
C) dsoy 𝑃 vkSj 𝑆
D) dsoy 𝑄
3. fuEufyf[kr esa ls dkSuls f=dks.k gSa \

Page 24 of 29
A) 𝑃, 𝑄, 𝑅 vkSj 𝑆
B) dsoy 𝑆
C) dsoy 𝑃 vkSj 𝑆
D) dsoy 𝑅 vkSj 𝑆
4. fdlh y{k.k dks crk,W tks bu lHkh vkd`fr;ksa esa gSA
A) lekarj Hkqtkvksa dk ,d tksM+k
B) leku Hkqtkvksa dk ,d tksM+k
C) ,d ledks.k
D) buesa dksbZ leku xq.k ugha gSaA
5. fn, gq, mnkgj.kksa dks nsf[k,:
vkd`fr;kW tks lekarj prqHkqZt gsS vkd`fr;kW tks lekarj prqHkqZt ugha gSA
buesa ls dkSu ls xq.k izR;sd leakrj prqHkqZt ds fy, lgh gS\
A) lHkh Hkqtk,a leku yEckbZ dh gSA
B) lekarj Hkqtkvks ds nks tksMas gSA
C) fod.kZ ,d nqljs dks 90 fMxzh ij lef}Hkkftr djrs gSA
D) lHkh dks.k cjkcj gSA
6. fuEufyf[kr vkd`fr;ksa esa ls fdlh ,d esa uhps fn, x, nksuks xq.k fo|eku gSaA
I. leku Hkqtkvks dk dsoy ,d tksMk
II. ,d ls T;knk vf/kd dks.k
;g vkd`fr dksu lh gS\

Page 25 of 29
A)
B)
C)
D)
7. buesa ls dkSulk uke uhps nh xbZ lHkh vkd`fr;ksa ds fy, lgh gSaA
A) lekarj prqHkZwt
B) leprqHkZqt
C) vk;r
D) oxZ
8. buesa ls fdudks vk;r dgk tk ldrk gS\
A) lHkh dks vk;r dgk tk ldrk gSa
B) dsoy 𝑄 dks
C) dsoy 𝑃 vkSj 𝑄 dks
D) dsoy 𝑄 vkSj 𝑅 dks
9. ;gk¡ nks dFku fn, x, gaSA
dFku 1% vkd`fr 𝑋 ,d o`r gS
dFku 2% vkd`fr 𝑋 ,d f=Hkqt gSA
fuEufyf[kr esa ls dkSu lk lgh gS\
A) ;fn dFku 1 lgh gS rks dFku 2 Hkh lgh gksuk pkfg,A
B) ;fn dFku 1 xyr gS rks dFku 2 lgh gksuk pkfg,A
C) dFku 1 vkSj dFku 2 nksuksa ,d lkFk lgh ugh gks ldrsA
D) dFku 1 vkSj dFku 2 nksuks ,d lkFk xyr ugha gks ldrsA
10. fn, x, fp= js[kk,a 𝑚 vksSj 𝑛 nksuksa js[kk 𝑝 ij vfHkyEc gSA
ge ;g Hkh tkurs gSs fd ;fn nks js[kk,s ,d gh js[kk ij
vfHkyEc gSSa rks os ijLij lekarj gkasxhA bl xq.k dk mi;ksx

Page 26 of 29
djrs gq, ge fu"d’kZ fudky ldrs gS fd &
A) 𝑝 vkSj 𝑚 vfHkyEc gSaA
B) 𝑚 vkSj 𝑛 vfHkyEc gaSA
C) 𝑚 vkSj 𝑛 izfrPNsn djrh gSaA
D) 𝑚 vkSj 𝑛 lekUrj gSaA
11. pk.kD;iqj esa lHkh fcfYy;kW QqVcky [ksyrh gSA 'kkyw pk.kD;iqj esa jgrh gSA
;fn mi;qZDr nksuksa dFku lR; gS rks fuEufyf[kr easa ls dksSu lk dFku fuf'pr :Ik ls lR; gksuk
pkfg,\
A) ;fn 'kkyw yM+dk gS rks og QqVcky [ksyrk gSA
B) ;fn 'kkyw dqRrk gS rks og QqVoky ugha [ksy ldrk gSA
C) ;fn 'kkyw fcYyh ugha gsS rks og QqVcky ugh [ksy ldrk gSA
D) ;fn 'kkyw fcYyh gS rks og QqVoky [ksyrh gSA
12. yrk] jft;k]lkjFk vkSj vkfjQ fe= gS yrk vkfjQ vkSj lkjFk nksuksa ls cMh gS lkjFk jft;k ls
NksVk gS ijUrq vfjQ ls cMk gS bl vk/kkj ij fuEufyf[kr esa ls fuf'pr :Ik ls lR; gksxk\
A) vkfjQ pkjksa esa lclsa NksVk gSA
B) lkjFk pkjksa es lcls NksVk gSA
C) yrk pkjks esa ls lcls cMh gSA
D) lkjFk pkjksa esa lcls cMk gSA

Page 27 of 29
Hkkx & 𝑩
iz'u% 13 ls 17 rd ds mRrj fy[ksaA
13. vkd`fr 𝐴 dks ns[ksaA
uhps fn, x, vkd`fr;ksa ds laxzg ls ,d vkd`fr dks igpkuks tks vkd`fr 𝐴
tSlh gSA vkids fopkj ls ;s fdl izdkj leku gS\ ¼ o.kZu djsA½
--------------------------------------------------------------------------------------------------------------------------------------------------------
-------------------------------
--------------------------------------------------------------------------------------------------------------------------------------------------------
-------------------------------
14. ;fn ge lHkh vkd̀fr;ksa dks ftudh Hkqtkvksa dk dsoy ,d tksMk cjkcj gS ccyww
ds :Ik esa ifjHkkf"kr djrs gsS rks buesa ls ccyw dksSu ls gS\
--------------------------------------------------------------------------------------------------------------------------------------------------------
-------------------------------
𝑨

Page 28 of 29
--------------------------------------------------------------------------------------------------------------------------------------------------------
-------------------------------
15. ,d xq.k dk uke crk,a tks lHkh vk;rksa esa gksrk gS ijUrq dqN lekrj prqHkqZtksa
esa mldk gksuk vko';d ugha gssaA
--------------------------------------------------------------------------------------------------------------------------------------------------------
------------------------------
--------------------------------------------------------------------------------------------------------------------------------------------------------
------------------------------
16. js[kk;s 𝑙 vkSj 𝑚 ijLij lekarj gaS vkSj 𝑡 ,d fr;Zd Nsnh js[kk gSA dks.k 𝑥 vkSj
dks.k 𝑦 ds eku D;k gaS\ vius mRrjksa ds dkj.k nsaA
17. fuEufyf[kr fp= dks ns[ksa vkSj dks.kksa 𝐴𝐵𝐶] rFkk 𝐴𝐵𝐸 ds eku Kkr djsa uhps nh
xbZ lkj.kh esa fjDr LFkkuksa dh iwfrZ djsaA

Page 29 of 29
okD; dkj.k दीजिये
∠𝐵𝐴𝐶 = 45°
∠𝐶𝐵𝐴 = 65°
∠𝐵𝐶𝐴 + ∠𝐶𝐵𝐴 + ∠𝐴𝐶𝐵 = 180°
∠𝐴𝐶𝐵 =
∠𝐴𝐶𝐵 + ∠𝐴𝐶𝐸 = 180°
∠𝐴𝐶𝐸 =
Appendix 2: Discussion Points for Teacher Interviews
Rajasthan School visit
1. Discuss teacher’s approach towards teaching geometry – How do they progress to
address age-wise needs?
Ask them: If you want to discuss the angle sum property of a triangle with the students,
what method will you adopt?
How would you discuss principles of geometry with the students?
How do you develop reasoning skills in the students?
2. Which topic/concept do you find most difficult to teach?
3. What about Geometry? Do you think it is easy to learn, or difficult? Why? (If they say
difficult, ask what is difficult about teaching it, and why students have difficulty in
learning it)
4. What do you think about the geometry curriculum? Especially proofs?
5. Do students ever ask you ‘why must we learn geometry?’ or ‘why must we learn proofs?’
What do you tell them? (In your opinion, why do you think students need to learn
geometry? Ask especially about proofs?)