Embed Size (px)
Citation preview

UNIVERSITÉ DE SHERBROOKE Faculté de génie
Département de génie mécanique .
ANALYSES EXPÉRIMENTALE, NUMÉRIQUE ET OPTIMISATION DE TRAITEMENTS ACOUSTIQUES
MULTICOUCHES À BASE DE MATÉRIAUX VISCOÉLASTIQUES ET POREUX POUR RÉDUIRE LE
BRUIT À BORD DE L’AVION
Thèse de Doctorat Spécialité : génie mécanique
Esen Cintosun
Jury : Prof. Noureddine Atalla (directeur) Prof. Raymond Panneton Prof. Franck C. Sgard Dr. Sebastian Ghinet
Sherbrooke (Québec) Canada février 2011


i
RÉSUMÉ Ce projet de recherche est composé de trois parties principales : la première comprend l’analyse expérimentale et la simulation des performances vibratoires de matériaux avec amortissement viscoélastique, en tant que traitements acoustiques appliqués aux structures du fuselage d’un avion. La deuxième partie comprend l’analyse expérimentale et le calcul de la performance acoustique de ces matériaux amortissant en comparaison avec l’effet d’une masse équivalente. Enfin, la troisième partie est une étude paramétrique sur les effets de localisation, de la densité et de la taille d’un traitement massique. Les systèmes d’isolation phoniques typiquement employés dans la construction des fuselages d’avions sont composés de matériaux poreux, avec ou sans des matériaux amortissant (matériaux viscoélastiques). La performance et donc l’utilité de ces traitements amortissant, en comparaison avec une couche de masse équivalente, reste une question largement ouverte. Dans ce travail on a comparé numériquement et expérimentalement les performances acoustiques d’un traitement amortissant avec celui d’une masse équivalente tous les deux incorporées dans le traitement phonique et ceci pour plusieurs types d’excitations. Deux structures représentant des fuselages, une en aluminium et la seconde en carbone composite, ont été sélectionnées pour cette étude ainsi que deux matériaux poreux couramment utilisés en aéronautique : une laine en fibre de verre et une mousse à cellules ouvertes. Deux types d’excitations ont été étudiés numériquement et expérimentalement. La première est une excitation acoustique (champ diffus) et la seconde mécanique (forces ponctuelles). Une troisième, excitation par couche limite turbulente a été étudié numériquement. Dans tous les cas, la perte par insertion du traitement acoustique est utilisée comme indicateur principal de la performance. D’autres indicateurs comme le coefficient d’absorption, le coefficient de perte par amortissement et la vitesse quadratique moyenne sont aussi utilisés pour mieux cerner et expliquer l’effet du traitement. Il a été démontré que l’utilisation d’une couche de masse équivalente à un traitement viscoélastique conduit systématiquement à la meilleure performance acoustique et ceci pour les trois types d’excitations étudiées. En particulier, dans le cas classique où le traitement amortissant est appliqué directement au fuselage. Dans ce dernier cas, les effets de doubles parois créés par la couche massique, positionnée judicieusement loin du fuselage, augmentent la performance en moyennes et hautes fréquences. Les performances en basses fréquences restent limitées par la fréquence de résonance double parois. Et même l’effet amortissant des traitements viscoélastiques, théoriquement visible aux résonances et coïncidences du système, se trouve limité par l’amortissement ajouté par le montage et le traitement absorbants. Cependant, l’efficacité de la couche massique est compromise par les difficultés d’installations et en particulier pour les fibreux. Les résultats de cette thèse restent toutefois limités par notre choix de structures et de traitements étudiés. Mots-clés: Vibroacoustique, Aeronautique, Bruit, Vibrations, Amortissement, Absorption, Composites, Traitements acoustiques

ii
SUMMARY
The project is made up of three main parts. The first part involves a comprehensive experimental and numerical analysis of viscoelastic damping materials as acoustic treatments to aircraft fuselage structures. The second part involves numerical and experimental acoustic comparison of viscoelastic damping material to equivalent mass. And the third part is a parametric study of equivalent mass for the effects of mass location, density and size. The goal of the project is to identify the vibroacoustic effect of viscoelastic material damping of fuselage skin, and develop possible alternatives to damping. The insulation systems (typically used on aircraft) that are made up of porous materials with or without viscoelastic damping material or equivalent mass were called sound packages throughout this document. The viscoelastic damping material and equivalent mass both incorporated in sound packages were acoustically compared. Fiberglass and open cell foam were used as porous materials. The viscoelastic damping material used in this study is constraining layer damping and abbreviated as CLD. The equivalent mass was an impervious screen. Both representative Aluminum and carbon composite fuselage skin structures were treated with sound packages as part of the comparison. The vibroacoustic performance indicators were used to characterize the sound packages. The indicators were airborne insertion loss (ABIL), structure borne insertion loss (SBIL), turbulent boundary layer insertion loss (TBLIL), average quadratic velocity (AQV), damping loss factor (DLF), absorption coefficient, and radiation efficiency. Diffuse field acoustic excitation was used to obtain the vibroacoustic indicators of ABIL and absorption coefficient. Mechanical excitation was used to obtain SBIL, AQV, DLF, absorption coefficient, and radiation efficiency. Turbulent boundary layer excitation was modeled to obtain TBLIL. The numerical methods of finite element method (FEM) and transfer matrix method (TMM) were used to calculate all of the above vibroacoustic performance indicators. Experimentally, ABIL, SBIL, AQV, DLF and radiation efficiency were measured. Experimental modal analysis was also performed to characterize representative Aluminum and carbon composite fuselage skin structures. Based on the numerical analysis, equivalent mass generated a double or multiple (in case of double wall layer configuration) wall effect and hence became an effective acoustic insulator as part of sound packages at mid to high frequencies. Even at coincidence frequencies (in case of the representative carbon composite fuselage skin), the equivalent mass layer was more effective than viscoelastic damping material. However, the drawback was the occurrence of the double wall resonance at lower frequencies which compromised the effectiveness. Nevertheless, the parametric study of equivalent mass revealed that equivalent mass is superior to viscoelastic damping material at reduced weight in term of vibroacoustic performance indicators of overall ABIL/SBIL/TBLIL in the frequency range of 100 to 6300 Hz and mean ABIL/SBIL/TBLIL in SIL (octave 1k, 2k, 4k Hz) frequency range.

iii
Keywords: Vibroacoustics, Aeronautics, Noise, Vibrations, Damping, Absorption, Composites, Acoustic treatments


v
REMERCIEMENTS I’d first like to thank my supervisors Prof. Noureddine Atalla and Dr. Tatjana Stecenko for their support for the collaborative research project between MTI Polyfab and the University of Sherbrooke that my dissertation became a part of. Their support, encouragement and perspective allowed the realization, progression and completion of the project. Their dedication to research is remarkable. Next, I’d like thank the jury members: Prof. F. C. Sgard, Dr. Sebastian Ghinet and Prof. Raymond Panneton for the detailed review of my thesis report and their encouragement. Beside Prof. Atalla, Dr. Maxime Bolduc was my main connection to the University of Sherbrooke. I’d like to thank him for helping me with administrative issues, testing, and analyzing the test results. Dr. Bolduc was always supportive and tremendous help in testing. I’d also like to thank (in no particular order) to Dr. Sebastian Ghinet for the introduction and warm welcome to UdeS during my visits, Dr. Celse Kafui Amédin for support in Nova and NovaFEM, Dr. Kamel Amichi for help with the use of NovaFEM, Abderrazak Mejdi for help with the use of Femap, Andrew Wareing for providing Bombardier panels, Chantal Simard for storing and locating the test samples, Dilal Rhazi for helping me with tests, Patrick Lévesque for building my panels, Rémy Oddo for help with testing, Eric Chen, Gina Deonarian, Satish Perera, and shop personnel for preparing my samples and Marcelo Santos, Prof. Arcanjo Lenzi and Fabio for the tests performed at the University of Florianopolis Acoustic and Vibration Laboratory, in Santa Catarina, Brazil.


vii
TABLE DES MATIÈRES RÉSUMÉ ................................................................................................................................ i SUMMARY ........................................................................................................................... ii REMERCIEMENTS............................................................................................................... v LISTE DES FIGURES .......................................................................................................... ix LISTE DES TABLEAUX.................................................................................................... xix Chapter 1 Introduction....................................................................................................... 1
1.1 Aircraft TBL & engine noise sources........................................................................ 3 1.2 Aircraft passive noise control overview .................................................................... 4 1.3 Objectives ................................................................................................................ 5 1.4 Overview of dissertation........................................................................................... 6
Chapter 2 Literature review ............................................................................................... 9 2.1 Viscoelastic material damping ................................................................................ 10
2.1.1 Effects of temperature ..................................................................................... 11
2.1.2 Effects of frequency ........................................................................................ 12
2.1.3 Effects of pre-stress and cyclic strain amplitude............................................... 13
2.1.4 Other environmental effects............................................................................. 13
2.1.5 Damping treatment design ............................................................................... 13
2.2 Alternative methods to viscoelastic material damping............................................. 14 2.3 Noise transmission loss through partition................................................................ 19
Chapter 3 Vibroacoustic performance indicators and testing methodologies .................... 25 3.1 Vibroacoustic performance indicators..................................................................... 25
3.1.1 Damping loss factor......................................................................................... 26
3.1.2 Airborne insertion loss..................................................................................... 28
3.1.3 Structure-borne insertion loss .......................................................................... 30
3.1.4 Turbulent boundary layer excitation insertion loss ........................................... 33
3.1.5 Average quadratic velocity .............................................................................. 35
3.1.6 Radiation efficiency......................................................................................... 35
3.1.7 Absorption coefficient ..................................................................................... 36
3.1.8 Computational tools......................................................................................... 37
3.2 Testing Methodologies ........................................................................................... 38 3.2.1 DLF and AQV testing methodologies .............................................................. 39
3.2.2 TL testing methodology................................................................................... 44
3.2.3 SBIL and AQV testing methodologies ............................................................. 50
3.2.4 Radiation efficiency testing methodology ........................................................ 54
3.3 Conclusions ............................................................................................................ 57

TABLE DES MATIÈRES
viii
Chapter 4 Constrained layer damping vibration performance............................................59 4.1 Experimental AQV and DLF results and discussion ................................................61
4.1.1 Analysis of Al ribbed panel damping................................................................65
4.1.2 Analysis of carbon composite ribbed panel damping ........................................78
4.2 Numerical AQV results and discussion....................................................................88 4.2.1 Description of Femap/Nastran model of Al ribbed panel ..................................88
4.2.2 Al ribbed panel FEM results.............................................................................91
4.3 Conclusions.............................................................................................................96 Chapter 5 Viscoelastic material damping versus equivalent mass layer.............................99
5.1 Experimental and numerical results obtained using Al panels & discussion...........107 5.1.1 Bare ribbed Al panel results ...........................................................................108
5.1.2 Ribbed Al panel treated with melamine foam sound packages........................115
5.1.3 Ribbed and flat Al panels treated with fiberglass sound packages...................126
5.2 Experimental and numerical results obtained using carbon composite panel & discussion........................................................................................................................134 5.3 Overall results and final remarks ...........................................................................146
Chapter 6 Parametric study.............................................................................................151 6.1 Mass layer location study ......................................................................................153 6.2 Mass layer density study .......................................................................................160 6.3 Mass layer size study.............................................................................................166 6.4 Experimental results and final remarks ..................................................................169
Chapter 7 Conclusion and perspectives ..........................................................................177 7.1 Conclusions...........................................................................................................177 7.2 Future work...........................................................................................................179
Annexe A DLF results.........................................................................................................181 A.1 Aluminum ribbed panel DLF results......................................................................181 A.2 Carbon composite panel DLF results .....................................................................196
Annexe B Smactane EX ......................................................................................................201 B.1 Smactane EX shear modulus and loss angle tangent ..............................................201 B.2 Smactane EX shift factor alpha T ..........................................................................202
Annexe C Layup of the ribbed carbon composite panel .......................................................203 Annexe D Chapter 5 additional plots ...................................................................................207 Annexe E Parametric study ABIL, SBIL and TBLIL plots ..................................................215
E.1 Location................................................................................................................215 E.2 Density..................................................................................................................221 E.3 Size .......................................................................................................................227
Annexe F Parametric study overall ABIL, SBIL and TBLIL results ....................................233 LISTE DES RÉFÉRENCES................................................................................................245

ix
LISTE DES FIGURES Figure 1-1: Sound absorbing material installed next to fuselage skin....................................... 5
Figure 1-2: A combination of foam and fiberglass sound absorbing material that is typically
used in aircraft insulation ................................................................................................ 5
Figure 2-1: Variation of storage modulus and loss factor of a viscoelastic material with
increasing temperature from Glassy region to Flow region [1]. ..................................... 12
Figure 2-2: Free layer damping [1] ....................................................................................... 14
Figure 2-3: Constrained layer damping [1]............................................................................ 14
Figure 2-4: Double panel system – fuselage (1), heterogeneous blanket (2), air cavity (3), trim
panel (4), and interior acoustic field (5) [43]. ................................................................ 16
Figure 2-5: Schematic of “effective area” concept [44]. ........................................................ 18
Figure 2-6: Variation of resonant frequency of an 8 g mass in a melamine foam block
(35x35x100 mm) as a function of the thickness of foam beneath the mass [44]. ............ 18
Figure 2-7: An illustration of a double-leaf panel [12]........................................................... 21
Figure 2-8: Schematic illustration of the behavior of a typical double-lead panel [56]. .......... 22
Figure 3-1: Multilayered panel under mechanical excitation [58] .......................................... 31
Figure 3-2: Pictures of (a) bare Al ribbed panel, (b) Al ribbed panel with CLD..................... 40
Figure 3-3 : A photograph of the Polytec laser vibrometer [73]............................................. 41
Figure 3-4: Scheme of measurement setup [73]..................................................................... 41
Figure 3-5: Photos illustrating the filler wall construction (a) with gypsum boards; (b) wood
frame with resilient bars and isolating material (before adding the gypsum boards) [75] 45
Figure 3-6: Illustration of the mounting of the panel in the test window [75]......................... 46
Figure 3-7: Rotating microphone, loudspeakers and diffusers positions in the source room [
75] ................................................................................................................................ 46
Figure 3-8: Horizontal and vertical intensity scans performed for each TL measurement [75]47
Figure 3-9: Schematic of the LVA-UFSC transmission loss measurement facility [77] ......... 48
Figure 3-10: Transmission loss measurement data collection instruments used at UFSC for
composite panel testing [77].......................................................................................... 50
Figure 3-11: Schematic illustration of a typical AMCF measurement setup [75] ................... 51
Figure 3-12: The shaker and some accelerometers attached to the ribbed Al panel ................ 52

LISTE DES FIGURES
x
Figure 3-13: Flat Al panel (not ribbed Al panel) exact mechanical excitation locations and
accelerometer locations for average quadratic velocity measurements [75] ....................52
Figure 3-14 : Excitation and response points used for radiation efficiency measurements [80]
......................................................................................................................................56
Figure 3-15 : The shaker attached to the carbon composite panel [80] ...................................57
Figure 4-1: DLF values obtained at -30 C on bare Al ribbed using DRM, PIM and half-power
bandwidth (modal) methods are plotted against frequency. ............................................64
Figure 4-2: DLF values obtained at -30 C on Al ribbed panel with 80% VS1 coverage using
DRM, PIM and half-power bandwidth (modal) methods are plotted against frequency. .64
Figure 4-3: Measured AQV on the bare Al ribbed panel surface ............................................66
Figure 4-4: Mode shapes (operating deflection shapes at resonance frequencies),
corresponding modal frequencies and loss factors in % obtained from velocity
measurements on the surface of Al ribbed panel ............................................................67
Figure 4-5: Measured AQV plot for bare Al ribbed panel in third octave frequency...............68
Figure 4-6: Plots of input mobility measured at the shaker excitation point on the surface of
the Al ribbed panel treated with CLD configurations at (a) -40 C; (b) -30 C; and (c) 20 C
......................................................................................................................................69
Figure 4-7: Bare panel AQV results at -40, -30, -20, -10, 0 and 20 C.....................................70
Figure 4-8: Plots of mass corrected AQV measured on the surface of the Al ribbed panel
treated with various CLD configurations at -40 C ..........................................................71
Figure 4-9: Plots of mass corrected AQV measured on the surface of the Al ribbed panel
treated with various CLD configurations at -30 C ..........................................................72
Figure 4-10: Plots of mass corrected AQV measured on the surface of the Al ribbed panel
treated with various CLD configurations at 20 C ...........................................................73
Figure 4-11: Mass corrected overall AQV IL in the frequency range of 50 to 2500 Hz at -40 C
......................................................................................................................................74
Figure 4-12: Mass corrected overall AQV IL in the frequency range of 50 to 2500 Hz at -30 C
......................................................................................................................................75
Figure 4-13 Mass corrected overall AQV IL in the frequency range of 50 to 2500 Hz at 20 C
......................................................................................................................................76
Figure 4-14: Measured AQV on the bare carbon composite ribbed panel surface...................79

xi
xi
Figure 4-15: Mode shapes (operating deflection shapes at resonance frequencies),
corresponding modal frequencies and loss factors in % obtained from velocity
measurements on the surface of carbon composite ribbed panel .................................... 80
Figure 4-16: Measured AQV plot for bare carbon composite ribbed panel in third octave
frequency...................................................................................................................... 81
Figure 4-17: Plots of input mobility measured at the shaker excitation point on the surface of
the carbon composite ribbed panel at (a) -40 C; (b) -30 C; and (c) 20 C ........................ 82
Figure 4-18: Plots of mass corrected AQV measured on the surface of the carbon composite
ribbed panel with or without VS3 treatment at -40 C..................................................... 83
Figure 4-19: Plots of mass corrected AQV measured on the surface of the carbon composite
ribbed panel with or without VS3 treatment at -30 C..................................................... 84
Figure 4-20: Plots of mass corrected AQV measured on the surface of the carbon composite
ribbed panel with or without VS3 treatment at 20 C ...................................................... 85
Figure 4-21: Mass corrected overall AQV IL in the frequency range of 50 to 2500 Hz at -40 C
..................................................................................................................................... 86
Figure 4-22: Mass corrected overall AQV IL in the frequency range of 50 to 2500 Hz at -30 C
..................................................................................................................................... 87
Figure 4-23: Mass corrected overall AQV IL in the frequency range of 50 to 2500 Hz at 20 C
..................................................................................................................................... 88
Figure 4-24: Isometric view of the panel............................................................................... 89
Figure 4-25: Location of the input force is shown by the red arrow, top left corner of the base
plate being the origin, input force is located at (x, y, z) coordinates in mm of (53.3, 276.9,
0). ................................................................................................................................. 90
Figure 4-26: 80% coverage viscoelastic material damping in Femap/Nastran........................ 91
Figure 4-27: Comparison of measured and Femap/Nastran calculated IM for bare Al ribbed
panel ............................................................................................................................. 92
Figure 4-28 : A few mode shapes and corresponding modal frequencies obtained from
displacement calculations on the surface of Al ribbed panel using Femap/Nastran ........ 94
Figure 4-29: Femap/Nastran calculated AQV for bare Al ribbed panel, panel with 50% VS1
coverage and 80% VS1 coverage – results are in 1/3 octave. ......................................... 96
Figure 5-1: Picture of the ribbed Al panel ........................................................................... 101

LISTE DES FIGURES
xii
Figure 5-2: Picture of the carbon composite panel ...............................................................101
Figure 5-3: Carbon composite panel melamine bricks and frame blankets ...........................103
Figure 5-4: Melamine bricks installed to carbon composite panel (a) and melamine frame
blankets installed to carbon composite panel over bricks (b) ........................................104
Figure 5-5: Mode at 195 Hz obtained by Femap/Nastran clamped constrained modal analysis
of the ribbed Al panel ..................................................................................................109
Figure 5-6: Ribbed Al panel (bare), bare with CLD (bareDamp) and bareDamp mass corrected
measured TL plots .......................................................................................................110
Figure 5-7 : Ribbed Al panel (bare) and bareDamp configurations measured narrow frequency
band AQV results ........................................................................................................111
Figure 5-8 : Ribbed Al panel (bare), bareDamp and bareDamp mass corrected configurations
measured third octave frequency band AQV results .....................................................112
Figure 5-9: Measured ABIL and SBIL plots for ribbed Al panel (bare) with damping
configuration ...............................................................................................................113
Figure 5-10: Comparison of experimental and numerical TL for bare configuration ............114
Figure 5-11: Comparison of measured and numerical ABIL for ribbed Al panel (bare) with
damping configuration.................................................................................................115
Figure 5-12: Mass corrected melamine foam sound package configurations ABIL results ...117
Figure 5-13: Mass corrected melamine foam sound package configurations SBIL results ....118
Figure 5-14: Mass layer installation method for mela200 configuration...............................119
Figure 5-15: Experimental SBIL and ABIL comparison for mela sound package.................120
Figure 5-16: Experimental SBIL and ABIL comparison for mela100 sound package...........121
Figure 5-17: Experimental SBIL and ABIL comparison for melaDamp sound package .......122
Figure 5-18: Melamine sound package configurations (a) frame and (b) top covers blankets122
Figure 5-19: Numerically obtained absorption coefficient plots for melamine foam sound
package configurations – diffuse acoustic field excitation, source side, without panel..123
Figure 5-20: Numerically obtained radiation efficiency plots for melamine sound package
configurations – rain on the roof (mechanical) excitation is used .................................123
Figure 5-21: Experimental and numerical ABIL comparison for mela sound package..........124
Figure 5-22: Experimental and numerical ABIL comparison for mela100 sound package....125
Figure 5-23: Experimental and numerical ABIL comparison for melaDamp sound package 125

xiii
xiii
Figure 5-24 : Experimental and numerical SBIL comparison for mela sound package......... 126
Figure 5-25: Mass corrected measured ABIL plots for fiberglass sound package configurations
................................................................................................................................... 128
Figure 5-26: Mass layer bagged as part of bricks in fiber200 sound package....................... 128
Figure 5-27: Mass corrected measured SBIL plots for fiberglass sound package configurations
................................................................................................................................... 129
Figure 5-28: Numerically obtained absorption coefficient plots for fiberglass sound package
configurations – diffuse acoustic field excitation, fluid domain, source side, without panel
................................................................................................................................... 130
Figure 5-29: Fiberglass sound package configurations (a) frame and (b) top covers blankets
................................................................................................................................... 130
Figure 5-30: Flat Al panel mass corrected ABIL plots for fiberglass with mass layer and
fiberglass with CLD configurations............................................................................. 131
Figure 5-31: Flat Al panel mass corrected SBIL plots for fiberglass with mass layer and
fiberglass with CLD configurations............................................................................. 132
Figure 5-32: Numerically obtained absorption coefficient plot for 2” fiberglass (0.6 pcf) sound
package configuration – diffuse acoustic field excitation, fluid domain, source side,
without panel .............................................................................................................. 133
Figure 5-33 : The method of installation of equivalent mass layer as part of sound package for
carbon composite panel............................................................................................... 135
Figure 5-34: Measured TL for composite bare panel, bare panel with damping and mass
corrected TL for bare panel with damping................................................................... 136
Figure 5-35: Mass corrected plots of measured ABIL for cbare+CLD+B+FB+TC and
cbare+B+FB+mass+TC sound package configurations................................................ 138
Figure 5-36 : Numerical absorption coefficient plots for cbare+CLD+B+FB+TC and
cbare+B+FB+mass+TC configurations obtaining using diffuse acoustic field excitation,
on receiver side and in fluid domain. ........................................................................... 138
Figure 5-37: Measured radiation efficiency plots for cbare and cbare+CLD configurations. 139
Figure 5-38: Measured radiation efficiency plots for configurations cbare+CLD+B+FB+TC
and cbare+B+FB+mass+TC........................................................................................ 140

LISTE DES FIGURES
xiv
Figure 5-39: Comparison of experimental and numerical TL for bare carbon composite
configuration ...............................................................................................................141
Figure 5-40 : Comparison of experimental and numerical ABIL for cbare+CLD configuration
....................................................................................................................................142
Figure 5-41: Comparison of experimental and numerical ABIL for cbare+CLD+B+FB+TC
configuration ...............................................................................................................143
Figure 5-42: Comparison of experimental and numerical ABIL for cbare+B+FB+mass+TC
configuration ...............................................................................................................144
Figure 5-43: Experimentally and numerically obtained radiation efficiency plots for cbare
configuration ...............................................................................................................145
Figure 5-44: Experimentally and numerically obtained radiation efficiency plots for
cbare+B+FB+mass+TC configuration .........................................................................146
Figure 6-1: Mass layer location study – SWL and DWL configuration ABIL results for
melamine sound packages............................................................................................155
Figure 6-2: Mass layer location study – SWL and DWL configuration SBIL results for
melamine sound packages............................................................................................157
Figure 6-3: Mass layer location study – SWL and DWL configuration TBLIL results for
melamine sound packages............................................................................................159
Figure 6-4: Mass layer density study – SWL and DWL configuration ABIL plots for melamine
sound packages – all results mass normalized ..............................................................162
Figure 6-5: Mass layer density study – SWL and DWL configuration SBIL plots for melamine
sound packages – all results mass normalized ..............................................................163
Figure 6-6: Mass layer density study – SWL and DWL configuration TBLIL plots for
melamine sound packages – all results mass normalized ..............................................165
Figure 6-7: Mass layer for sound packages (a) FiberS50; (b) FiberS75; (c) FiberS90unconn;
and (d) FiberS100 ........................................................................................................171
Figure 6-8 : Mass layer comparison using measured ABIL results in SWL configuration – all
results mass normalized ...............................................................................................173
Figure 6-9: Mass layer comparison using measured ABIL results in DWL configuration – all
results mass normalized ...............................................................................................174
Figure 6-10: SBIL plots in SWL configuration – all results mass normalized ......................175

xv
xv
Figure A-1: DLF values measured at -40 °C on bare and treated Al ribbed panel ................ 181
Figure A-2: Al ribbed panel DLF plots at -40 °C (a) 80% VE1 & 50% VS1, (b) 50% VS1 &
50% VS4, (c) 50% VS4 & 50% VS3, (d) 50% VS3 & 80% VS4, (e) 80% VS4 & 80%
VP1, (f) 80% VP1 & 80% VS1 ................................................................................... 182
Figure A-3: DLF values measured at -30 °C on bare and treated Al ribbed panel ................ 183
Figure A-4: Al ribbed panel DLF plots at -30 °C (a) 80% VE1 & 50% VS1, (b) 50% VS1 &
50% VS4, (c) 50% VS4 & 50% VS3, (d) 50% VS3 & 80% VS4, (e) 80% VS4 & 80%
VP1, (f) 80% VP1 & 80% VS1 ................................................................................... 184
Figure A-5: DLF values measured at -20 °C on bare and treated Al ribbed panel ................ 185
Figure A-6: DLF values measured on bare Al ribbed panel at -40 °C, -30 °C, -20 °C, -10 °C, 0
°C, and 25 °C.............................................................................................................. 186
Figure A-7: DLF values measured at temperatures of -40 °C, -30 °C, -20 °C, and -10 °C on Al
ribbed panel treated with 80% VE1............................................................................. 187
Figure A-8: DLF values measured at temperatures of -40 °C, -30 °C, -20 °C, and -10 °C on Al
ribbed panel treated with 80% VS1 ............................................................................. 188
Figure A-9: DLF values measured at temperatures of -40 °C, -30 °C, -20 °C, and -10 °C on Al
ribbed panel treated with 50% VS3 ............................................................................. 189
Figure A-10: Treated Al ribbed panel DLF values plotted against mass of treatment at -40 °C
and at frequencies (a) 125 Hz and (b) 250 Hz.............................................................. 190
Figure A-11: Treated Al ribbed panel DLF values plotted against mass of treatment at -40 °C
and at frequencies (a) 500 Hz and (b) 1000 Hz............................................................ 191
Figure A-12: Treated Al ribbed panel DLF values plotted against mass of treatment at -40 °C
and at 2000 Hz............................................................................................................ 192
Figure A-13: DLF values measured on Al ribbed panel treated with 50% and 80% VS1 at
temperatures (a) -40 °C, (b) -30 °C, and (c) -20 °C..................................................... 193
Figure A-14: DLF values measured at room temperature on Al ribbed panel treated with 20%,
50%, 80% and 100% VS1 ........................................................................................... 194
Figure A-15: DLF values measured at room temperature on Al ribbed panel treated with 20%,
50%, and 100% VP1 ................................................................................................... 195
Figure A-16: DLF values measured at -40 °C on bare and treated carbon composite ribbed
panel ........................................................................................................................... 196

LISTE DES FIGURES
xvi
Figure A-17: DLF values measured at -30 °C on bare and treated carbon composite ribbed
panel............................................................................................................................197
Figure A-18: DLF values measured at -20 °C on bare and treated carbon composite ribbed
panel............................................................................................................................198
Figure A-19 DLF values measured at temperatures of -40 °C, -30 °C, -20 °C, and -10 °C on
carbon composite ribbed panel treated with 50% VS3..................................................199
Figure D-20: Experimental SBIL and ABIL comparison for mela200 sound package ..........207
Figure D-21: Experimental and numerical ABIL comparison for mela200 sound package ...208
Figure D-22: Measured ABIL plots for fiberglass sound package configurations .................208
Figure D-23: Measured SBIL plots for fiberglass sound package configurations..................209
Figure D-24: Comparison of the measured ABIL and SBIL plots for fiber configuration.....209
Figure D-25: Comparison of the measured ABIL and SBIL plots for fiber100 configuration
....................................................................................................................................210
Figure D-26: Comparison of the measured ABIL and SBIL plots for fiber200 configuration
....................................................................................................................................210
Figure D-27: Comparison of the measured ABIL and SBIL plots for fiberDamp configuration
....................................................................................................................................211
Figure D-28: Comparison of the measured and numerical ABIL plots for fiber configuration
....................................................................................................................................211
Figure D-29: Comparison of the measured and numerical ABIL plots for fiber100
configuration ...............................................................................................................212
Figure D-30: Comparison of the measured and numerical ABIL plots for fiber200
configuration ...............................................................................................................212
Figure D-31: Comparison of the measured and numerical ABIL plots for fiberDamp
configuration ...............................................................................................................213
Figure D-32: Comparison of the measured and numerical SBIL plots for fiber configuration
....................................................................................................................................213
Figure F-33: Mass layer location study – SWL and DWL configuration ABIL plots for
fiberglass sound packages............................................................................................233
Figure F-34: Mass layer location study – SWL and DWL configuration SBIL plots for
fiberglass sound packages............................................................................................234

xvii
xvii
Figure F-35: Mass layer location study – SWL and DWL configuration TBLIL plots for
fiberglass sound packages ........................................................................................... 235
Figure F-36: Mass layer density study – SWL and DWL configuration ABIL plots for
fiberglass sound packages – all results mass normalized.............................................. 236
Figure F-37: Mass layer density study – SWL and DWL configuration SBIL plots for
fiberglass sound packages – all results mass normalized.............................................. 237
Figure F-38 : Mass layer density study – SWL and DWL configuration TBLIL plots for
fiberglass sound packages – all results mass normalized.............................................. 238
Figure F-39: Mass layer size study – SWL and DWL configuration ABIL plots for melamine
sound packages – all results mass normalized ............................................................. 239
Figure F-40: Mass layer size study – SWL and DWL configuration SBIL plots for melamine
sound packages – all results mass normalized ............................................................. 240
Figure F-41: Mass layer size study – SWL and DWL configuration TBLIL plots for melamine
sound packages – all results mass normalized ............................................................. 241
Figure F-42: Mass layer size study – SWL and DWL configuration ABIL plots for fiberglass
sound packages – all results mass normalized ............................................................. 242
Figure F-43: Mass layer size study – SWL and DWL configuration SBIL plots for fiberglass
sound packages – all results mass normalized ............................................................. 243
Figure F-44: Mass layer size study – SWL and DWL configuration TBLIL plots for fiberglass
sound packages – all results mass normalized ............................................................. 244


xix
LISTE DES TABLEAUX Table 3-1 : Turbulent boundary layer excitation Corcos TBL model parameters ................... 33
Table 3-2: The tests performed ............................................................................................. 39
Table 3-3: Dimensions of the aperture in composite TL measurements ................................. 48
Table 4-1: Tested constraining layer viscoelastic materials ................................................... 60
Table 4-2 : Aluminum panel material properties ................................................................... 61
Table 4-3: List of Al ribbed panel damping treatments each with percentage coverage and
mass; the tests were performed at temperatures of 20, 10, 0, -10, -20, -30, and -40 °C... 62
Table 4-4: List of carbon composite ribbed panel damping treatments each with percentage
coverage and mass; the tests were performed at temperatures of 20, 10, 0, -10, -20, -30,
and -40 °C..................................................................................................................... 62
Table 4-5: List of Al ribbed panel damping treatments each with percentage coverage and
mass; the tests were performed at room temperature...................................................... 63
Table 4-6: Mass corrected measured AQV IL for VS1.......................................................... 77
Table 4-7: Mass corrected numerical AQV IL for VS1 ......................................................... 96
Table 5-1 : Mechanical properties of the ribbed carbon composite panel............................. 100
Table 5-2: Mechanical properties of Al panel...................................................................... 100
Table 5-3: Ribbed Al panel sound packages........................................................................ 102
Table 5-4: Flat Al panel sound packages............................................................................. 102
Table 5-5: Carbon composite panel sound packages............................................................ 103
Table 5-6: Material properties of Smactane EX................................................................... 104
Table 5-7: Al constraining layer material properties............................................................ 105
Table 5-8 : Carbon composite constraining layer material properties................................... 105
Table 5-9 : Material properties of melamine foam and 0.6pcf FG........................................ 106
Table 5-10: Mass corrected average and overall ABIL for ribbed AL panel sound packages148
Table 5-11: Mass corrected average and overall SBIL for ribbed Al panel sound packages . 148
Table 5-12: Mass corrected average and overall ABIL for carbon composite panel sound
packages ..................................................................................................................... 149
Table 6-1: Material properties of skin structure of trim panel .............................................. 152
Table 6-2: Material properties of core structure of trim panel.............................................. 152

LISTE DES TABLEAUX
xx
Table 6-3: The location parametric study sound packages....................................................153
Table 6-4: The mass layer density parametric study sound packages ...................................161
Table 6-5: The mass layer size parametric study sound packages.........................................167
Table 6-6: Sound package configurations tested as part of parametric study ........................170

1
Chapter 1 Introduction
This thesis is part of a collaborative project between MTI Polyfab (became 3M Thermal &
Acoustic Systems on June 11, 2010) and Groupe d’Acoustique de l’Université de Sherbrooke
through the Université de Sherbrooke’s “Partnership program for Master and Doctoral studies
in the workplace”. The aim of this project is to identify the noise transfer mechanisms from
aircraft cabin exterior to interior with a focus in particular on the function and modeling of
viscoelastic vibration damping of fuselage skin, and develop possible alternatives to damping.
The turbulent boundary layer (TBL) and engine are the two main sources of noise from
exterior to the aircraft cabin interior. The TBL noise is caused by the aerodynamic behavior
of air flowing around the fuselage skin. The environmental control system (ECS) is also a
significant noise source; however, it is generated within the aircraft. The ECS noise and
treatment schemes are not investigated as part of this research project.
The two paths that noise is believed to enter the cabin interior, for the purposes of this research
from the surrounding air under flight cruise conditions, include direct transmission of sound
waves (airborne) and radiation of noise (structure-borne). The transmission of airborne noise
occurs through the partition separating the aircraft interior from the exterior. The radiated
noise is generated by the excitation of the fuselage skin predominantly due to TBL. TBL
excitation of the fuselage skin is believed to cause noise transmission to cabin interior in two
ways. First, by exciting the skin, the skin panel radiates noise into the cavity in between the
fuselage skin and trim panel and this airborne noise is transmitted to the cabin interior. The
second path is structure-borne transmission through the mounts which excites the trim panel
and in turn generates radiated noise into the cabin interior.
Noise control can be divided into three methods: active, passive and semi-active. In active
method, speakers, actuators, and microprocessors are used to produce out of phase signal to
electronically cancel the transmitted noise waves. Passive control involves the use of
absorbers, barriers, mufflers, silencers, dampers, etc. Semi-active control involves the use of
Introduction
2
active method to enhance the acoustic properties of passive control methods. Passive noise
control is simpler to implement and more cost-effective than active and semi-active and hence
its applications are widespread [1]. Active and semi-active noise control is more applicable to
helicopters and propeller driven aircrafts where frequency specific noise predominantly
occurs. Only passive aircraft acoustic materials are examined in this research project.
Sound packages (passive noise control) made up of porous materials such fiberglass and open-
cell foam are typically used on commercial aircraft as acoustic and thermal insulation.
Viscoelastic material damping is also often used as part of a sound package. Sound package is
installed in the gap between the fuselage skin and trim panel of aircraft. Optimal sound
package is one that acoustically performs superior over the audible frequency range of 12 to
20000 Hz with as light a weight as possible. In the industry, the acoustical performance is
predominantly based on ABIL (airborne insertion loss). In this report, SBIL (structure
insertion loss) and TBLIL (turbulent boundary layer excitation insertion loss) are also used to
evaluate the acoustical performance. Two other vibroacoustic indicators: absorption
coefficient and radiation efficiency are generally used in support (when describing the
physics) of ABIL, SBIL and TBLIL results in this report
Sound transmission into the cabin interior is more important for aircrafts in comparison to
vibration levels since the aircraft skin is already highly damped due to its physical make-up
which inherently reduces the vibration levels. DLF (damping loss factor) and AQV (average
quadratic velocity) experimental and numerical results are used to evaluate the panel vibration
levels. DLF is also used when defining panel properties as part of ABIL, SBIL and TBLIL
calculations.
Since some panel damping is also achieved with the application of sound absorbing materials
such as foam and fiberglass, the efficiency of viscoelastic material damping is questioned.
Viscoelastic material damping is argued to be acoustically effective as extra mass while being
compared to a layer of impervious limp material (mass layer) as part of this thesis project.
The comparison was performed using both metallic and composite panel constructions. The
critical frequency is above 10,000 Hz for metallic panels and is at around 3,000 Hz for
composite panels. The impact of viscoelastic material damping and mass layer at critical
frequency is compared using the composite panel.

3
The aircraft acoustic performance is measured using two acoustic levels. One is an overall
measurement and is a summation of A-weighted sound pressure levels (LA) in the audible
frequency range of 12 to 20000 Hz. And the other is the speech interference level (SIL) which
is an arithmetic average of the sound pressure levels in the octave bands centered at 1000,
2000 and 4000 Hz (500 Hz octave band is also at times included in the average). Accordingly,
the comparison of viscoelastic damping material to alternative configurations was primarily
based on overall ABIL (airborne insertion loss), SBIL (structure-borne insertion loss) and
TBLIL (turbulent boundary layer excitation insertion loss) in the frequency range of 100 to
6300 Hz (experimentally 200 to 6300 Hz) and based on mean ABIL, SBIL and TBLIL in SIL
frequency range (1k, 2k and 4k Hz).
Both numerical and experimental analyses are performed to understand the mechanism behind
noise transmission through partitions. Numerical work is based on the use of computational
tools of finite element method (FEM), statistical energy analysis (SEA) and transfer matrix
method (TMM). Numerical analysis is quite often implemented in conjunction with
experimental analysis which may include transmission loss tests, vibration data collection and
power input and output measurements.
1.1 Aircraft TBL & engine noise sources
There has been a gradual decrease in noise levels of subsonic passenger airplanes largely due
to developments in engine design and efficiency over the past 40 years. Today, aircrafts are
typically equipped with turbojet or turboprop engines. The turboprop engines produce greater
noise than the turbojets. The main noise sources of a modern by-pass turbojet engine are the
jet and the fan, while the internal combustion chamber and the turbine stages usually make a
smaller contribution to the total noise produced by the engine [2, 3]. Some effective measures
have been taken in reducing the propeller noise of turboprop engines such as an increase in the
number of blades, a decrease in their relative thickness, a more swept shape and optimal
choice of the load distribution over the blade surfaces and the blade geometry that reduce the
wave processes in the airflow around the blades [2, 4]. Depending on the aircraft, the
turbulent boundary layer (TBL) or the engine becomes the leading noise source. Interior
sound levels in multi-engine, propeller-driven aircraft are dominated by the discrete frequency

Introduction
4
components at the blade passage frequency and its harmonics [2]. However, at aircraft speeds
above about 200 mph, aerodynamic noise also becomes important [5, 6]. For jet powered
aircraft, a significant source of cabin noise in mid and high frequencies is the aerodynamic
sound generated by attached or separated turbulent boundary layers [5, 6]. The continuous
noise sources dominate the sound field inside the cabin, especially the noise due to the
structural vibration of the fuselage side wall caused by the TBL [5].
The boundary layer thickness around the flight deck for most commercial airplanes is about 13
mm and grows to about 30 cm at the back of the plane [1]. It has been observed that the
boundary layer noise in the cabin will increase by about 2 dB for every 0.1 Mach increase in
airspeed [1]. The noise, however, decreases by the same amount for about every 1500 m
increase in altitude [1].
TBL excitation transfers energy to the interior cavity through both the air and structure paths.
Vibration damping mechanisms such as energy transfer to joints and energy loss to
surroundings can in fact be paths of noise transfer and radiation, respectively. Noise is
transmitted to the interior of an aircraft not just by direct transmission of sound waves through
the fuselage skin, insulation system and trim panel but also by damping mechanisms at joints
and radiation. [7, 8, 9, 10, 11, 12, 13, 14, 15, 16, 17, 18, 19, 20, 21, 22, 23, 24, 25, 26, 27,28, 29, 30, 31, 32, 33]
1.2 Aircraft passive noise control overview
A typical aircraft passive sound insulation structure consists of double wall with sound
absorbing materials, viscoelastic damping and depending on the cabin noise level
requirements a barrier layer. The two walls are the fuselage skin and interior trim panel. The
sound absorbing materials are fixed in between the two walls and the viscoelastic damping is
attached (normally using pressure sensitive glue) to the fuselage skin and/or to the trim panel.
A section of aircraft insulated with a sound absorbing material next to the fuselage skin is
shown in Figure 1-1. A typical sound absorbing material composition is shown in Figure 1-2.
The research in characterization and acoustic properties estimation of sound absorbing
materials is extensive [7-18]. Similarly, analytical and experimental research with emphasis in
vibration damping is extensive [18-33].

5
Figure 1-1: Sound absorbing material installed next to fuselage skin
Figure 1-2: A combination of foam and fiberglass sound absorbing material that is typically
used in aircraft insulation
1.3 Objectives
The primary objective is to investigate the acoustic performance of viscoelastic damping
material versus equivalent mass as added noise treatments to typical aircraft sidewall
structures under diffuse acoustic field and mechanical excitations. The equivalent mass is a
layer of impervious screen that is equivalent in weight to viscoelastic damping material. The
Introduction
6
investigation is performed both numerically and experimentally using various acoustical and
vibration indicators. Extensive viscoelastic damping material characterization is performed
with the aim to determine the effect of temperature and frequency on the performance of
viscoelastic damping materials. A parametric study is also performed to determine an optimal
equivalent mass layer.
The specific objectives are:
- conduct a literature review on mass versus damping as a noise control mechanism in
aircraft sidewalls;
- characterize viscoelastic damping materials;
- devise and conduct acoustic and vibration tests on two representative sidewalls, the
first metallic and the second composite;
- conduct experimental tests to compare effects of viscoelastic damping material versus
mass on the acoustic and vibration response of the representative sidewall panels;
- investigate numerically mass versus damping for a typical single and double sidewall
panels;
- compare testing to modeling;
- conduct a parametric study and suggest an enhanced configuration ; and
- test the final configuration and conclude.
1.4 Overview of dissertation
Literature review is in Chapter 2. The characteristics of viscoelastic material damping, the
alternatives to viscoelastic material damping, and the features of noise transmission loss
through partition are discussed in Chapter 2. The vibroacoustic performance indicators of
damping loss factor (DLF), airborne insertion loss (ABIL), structure-borne insertion loss
(SBIL), turbulent boundary layer insertion loss (TBLIL), average quadratic velocity (AQV),
radiation efficiency and absorption are defined and the experimental methods for measuring

7
DLF, AQV, ABIL, SBIL, and radiation efficiency are described in Chapter 3. The
viscoelastic damping material characterization results are presented in Chapter 4. The results
and discussion of the experimental and numerical comparison of viscoelastic damping
material to equivalent mass are in Chapter 5 along with a parametric study of equivalent mass
in Chapter 6.


9
Chapter 2 Literature review
On commercial aircraft, the acoustic and thermal insulation system is primarily made up of
sound absorbing materials. Low density limp fiberglass (typically 0.42 or 0.6 pcf) and open
cell foam are used as sound absorbing materials. Open cell foams frequently used in aircraft
industry include solimide polyimide and/or melamine foam. Viscoelastic material damping is
also utilized (more commonly on business aircraft) as part of aircraft acoustic insulation
systems. Constraining layer viscoelastic material damping (CLD) is the predominant method
of damping. Both fuselage skin and trim panel can be damped.
Sound absorbing materials are effective at frequencies of octave 1000 Hz and higher mainly in
terms of sound absorption. The absorption materials also result in added damping on the
fuselage skin and trim panel. Typically the gap between fuselage skin and trim panel is filled
with sound absorbing materials. Sound absorbing materials are normally bagged in covering
film for moisture protection. Hydro-phobic treatment may also be applied to avoid bagging
(e.g. melamine foam).
Viscoelastic material damping is used on aircraft largely for lower frequency (octave 500 Hz
and less) noise reduction which in turn results in an overall sound level reduction in aircraft
cabin. Viscoelastic material damping is effective at panel resonant frequencies at the first few
modes and at the critical frequency and is ineffective at double wall resonance frequency.
Fuselage skin and trim panel make up the double wall.
This chapter is divided into three sections. The first section includes a detailed description of
viscoelastic material damping. In section 2, possible alternatives to vibration damping are
discussed. The characteristics of transmission loss are described in the third section.

Literature review
10
2.1 Viscoelastic material damping
Damping occurs inherently in all materials when the structure deforms during vibration. This
structure damping depends on the exact composition and processing of the material. In
addition to material inherent damping, damping of a structure can be increased by external
means such as attaching layers of high damping material, through joint interfaces, energy loss
to surrounding, and friction with mounted equipment and other objects/surfaces. A structure
can also be isolated from a vibration source by using isolators. Viscoelastic material damping
is added damping to a structure and is primarily effective in reducing vibration levels at
resonant frequencies.
Damping is a form of energy dissipation that occurs as a result of internal molecular
interactions during material deformation. Vibration is a cyclic deformation. It is theoretically
possible that, with a complete knowledge of the molecular structure of materials involved and
the use of Quantum Mechanics, one can predict the damping behavior. However, such
analysis would require enormous computational resources and is currently not possible for
practical structures. Nevertheless, mathematical models have been formulated that yield
quantifiable damping characteristics using theorems such as Newton’s laws, Euler-Bernoulli
equation of motion, and stress and strain relationships. The drawback is that all available
analytical models are strictly for homogeneous, isotropic and geometrically simple structures.
For complex structures, damping is predominantly characterized experimentally and at times
finite element analysis is also used in conjunction with tests or by itself.
The viscoelastic damping characteristics are directly linked to material composition and
processing, including the degree of cross-linking and the type of fillers such as carbon black
[1]. The characteristics also vary with temperature and to a lesser degree with frequency.
Molecules become disturbed and move from their equilibrium position when a structure is
subjected to a load (such as a harmonic load), but over time the molecules reach a state of
equilibrium. The time it takes to reach the state of equilibrium depends upon the material
composition, temperature and the harmonic excitation frequency [19].
Three different types of models are commonly used for solving structural dynamic problems:
physical or spatial, modal space and response based. Physical or spatial models are developed

11
from basic physical characteristics describing the system mass, damping and stiffness typically
from a finite element model description. Modal space models are developed from the modal
characteristics describing the frequency, damping and mode shape. Response based models
are developed from characteristics of the system response typically from frequency response
measurements [34].
An elastic material such as a spring retracts to its original position when stretched and
released, whereas a viscous fluid such as putty retains its extended shape when pulled [19].
Viscoelastic materials typically exhibit characteristics of both a viscous fluid and an elastic
solid. After being stressed, viscoelastic material returns to its original shape, but does it
slowly enough to oppose the next cycle of vibration. The degree to which a material behaves
either viscously or elastically depends mainly on temperature and rate of loading (frequency).
Many polymeric materials (plastics, rubbers, acrylics, silicones, vinyls, adhesives, urethanes,
epoxies, etc.) having long-chain molecules exhibit viscoelastic behavior [1]. The dynamic
properties (shear modulus, extensional modulus, etc.) of linear viscoelastic materials can be
represented by the complex modulus approach. The material properties of viscoelastic
materials depend significantly on environmental conditions such as environmental
temperature, vibration frequency, pre-load, dynamic load, environmental humidity and so on.
Therefore, a good understanding of such effects, both separately and collectively, on the
variation of the damping properties is necessary in order to tailor these materials for specific
applications [1].
2.1.1 Effects of temperature
The dynamic properties of viscoelastic materials vary strongly with temperature [19]. In
Figure 2-1, which was taken from [1], it is shown that there are four distinct regions revealing
the variation of storage modulus and damping loss factor. With increasing temperature, glassy
region is at the lowest range, where the material has very large storage modulus (dynamic
stiffness) but very low damping. The storage modulus in this region changes slowly with
increasing temperature, while the damping changes significantly. In the transition region,
because of the softening of the material with increasing temperature, the damping increases
and the material modulus decreases. The damping usually peaks at or around the glass
transition temperature of the material and some polymers can be made to have more than one
Literature review
12
transition region by changing the polymeric structure and composition to take advantage of the
peak damping capacity in this region [19]. In the rubbery state both modulus and damping take
lower values and vary slowly with temperature. The flow region is typical for a few damping
materials such as vitreous enamels and thermoplastics, where the material continues to soften
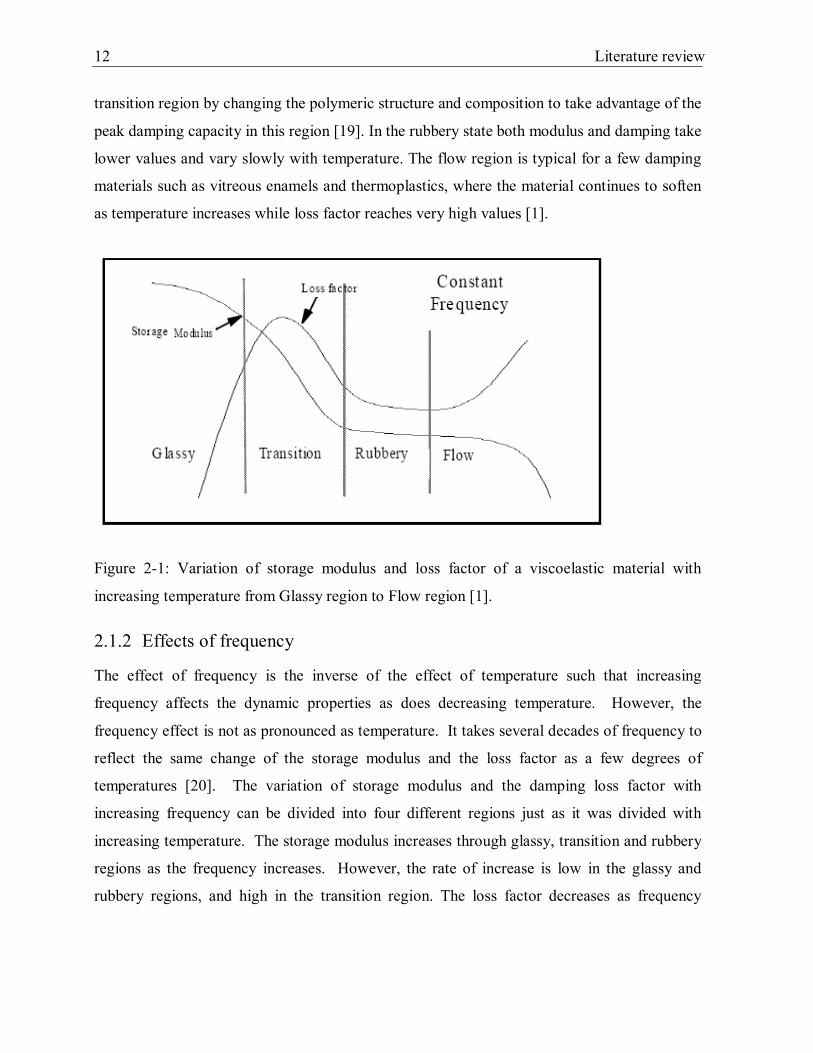
as temperature increases while loss factor reaches very high values [1].
Figure 2-1: Variation of storage modulus and loss factor of a viscoelastic material with
increasing temperature from Glassy region to Flow region [1].
2.1.2 Effects of frequency
The effect of frequency is the inverse of the effect of temperature such that increasing
frequency affects the dynamic properties as does decreasing temperature. However, the
frequency effect is not as pronounced as temperature. It takes several decades of frequency to
reflect the same change of the storage modulus and the loss factor as a few degrees of
temperatures [20]. The variation of storage modulus and the damping loss factor with
increasing frequency can be divided into four different regions just as it was divided with
increasing temperature. The storage modulus increases through glassy, transition and rubbery
regions as the frequency increases. However, the rate of increase is low in the glassy and
rubbery regions, and high in the transition region. The loss factor decreases as frequency

13
increases in the glassy region, reaches its maximum in the transition region, and increases in
the rubbery region.
2.1.3 Effects of pre-stress and cyclic strain amplitude
Analytical analysis of a viscoelastic system can only be performed linearly if the cyclic strain
amplitudes are very low. The extent of the nonlinear behavior depends upon the type of
polymer, especially the molecular structures. For most engineering purposes, except where
components are subjected to extremely high strains over considerable periods of time, the
linear theory of viscoelasticity is the most practical first step, followed possibly by testing of
the system under simulated loading conditions in lieu of nonlinear analysis [19, 20].
2.1.4 Other environmental effects
Environmental factors such as exposure to radiation (e.g. ultraviolet and nuclear), humidity in
the atmosphere and hydrocarbon fluids (e.g. fuels and lubricants) can affect the dynamic
properties of polymers. Exposure to hydrocarbon fluids may over time progressively and
irreversibly damage the molecular structure, and this can in turn change the dynamic
properties with respect to temperature, frequency and strain. In the case of radiation, damage
may be progressive. In the case of humidity, the process may in some cases be reversible. [19,
20]
2.1.5 Damping treatment design
Viscoelastic materials have traditionally been applied to structures to enhance damping in two
different ways: free-layer damping treatment and constrained-layer or sandwich-layer
damping treatment. The key in viscoelastic damping design is to recognize that the damping
material must be strained as much as possible when the structure is deformed in the vibration
mode under investigation [1].
Free-Layer damping (FLD): In Figure 2-2, a portion of a structure with a free-layer is shown. Free layer damping is also referred to as extensional type damping. The damping material is either sprayed on the structure or bonded using a pressure-sensitive adhesive [1]. When the base structure is deflected in bending, the viscoelastic material deforms primarily in extension and compression in planes parallel to the base structure. The degree of damping is limited by thickness and weight

Literature review
14
restrictions. The system loss factor in a free-layer system increases with the thickness, storage modulus, and loss factor of the viscoelastic layer [1].
Figure 2-2: Free layer damping [1]
Constrained-layer damping (CLD): In Figure 2-3, a portion of a structure with
constrained-layer damping treatment is shown. This consists of a sandwich of two outer elastic layers with a viscoelastic material as the core. When the base structure undergoes bending vibration, the viscoelastic material is forced to deform in shear because of the upper stiff layer. The constrained-layer damping is more effective than the free-layer design since more energy is consumed and dissipated into heat in the work done by the shearing mode within the viscoelastic layer. Damping tapes consisting of a thin metal foil covered with a viscoelastic adhesive and used on an existing structure is a constrained layer type arrangement. The symmetric configuration in which the base and the constraining layers have the same thickness and stiffness is by far the most effective design since it maximizes the shear deformation in the core layer. [1, 20]
Figure 2-3: Constrained layer damping [1]
2.2 Alternative methods to viscoelastic material damping
Aircraft is typically insulated using a combination of damping and low density porous
materials. Porous materials such as foam and fiberglass are effective noise attenuators at
frequencies higher than 500-1000 Hz depending on the thickness. For low frequency sound
energy attenuation, heavy damping is used. Increased mass lowers the resonant frequencies.
The issue with damping is that since the dampers are rigid materials, the combination of panel

15
and damper may result in new resonant frequencies which may cause radiated noise. Most
research involving porous and viscoelastic damping materials is concerned with materials that
are homogeneous and uniform as they are easier to analyze analytically. A composite material
that is made up of loosely connected particles of different densities, shapes and stiffness
should in theory perform well as noise insulator. In such a structure, particles of different
density, shape and stiffness would ideally each have resonant frequencies and vibrate
(dissipate energy) at those frequencies in loosely connected medium when excited by acoustic
energy. [35, 36, 37]
Distributed mass in porous material has been found to increase transmission loss and act as
damper. Sgard et al. [35-37] investigated both numerically and experimentally the significance of
heterogeneous blankets in dissipating vibro-acoustic energy. Heterogeneous blankets were porous
materials with embedded masses and also porous materials with embedded air cavities. Sgard et al.
[35] used an FE method to model the plate and the acoustic domains (gaps and internal cavities).
They used the mixed (u, P) formulation of Biot’s poroelasticity equations to model poroelastic
patches. Thus, heterogeneous blankets with embedded air cavities were modeled using a mixed
(u, P) formulation referred to as “initial formulation” and the blankets with embedded masses were
modeled using a mixed (u, P) formulation referred to as “modified formulation” [35].
Sgard et al. [35] calculated two acoustic indicators: the mean square velocity of the panel and
a space averaged mean square pressure in the cavity. The experimental system was excited
mechanically using a shaker and acoustically using a loudspeaker. Validation of the simulation
method was performed by comparing measured and calculated mean square velocity and
pressure. Total power dissipated was also calculated as part of the analysis. The major
conclusions included: mass inclusions equivalent to 7% of panel weight increased energy
dissipation at low frequencies up to 150 Hz and distributed air cavities of up to 20% of porous
material did not change the acoustic performance of the porous material. [38, 39, 40]
Furthermore, Kidner et al [38-40] investigated the effect of mass inclusions in poro-elastic
layer and found that the insertion loss of standard acoustic blankets can be significantly
improved at low frequencies. Esteve [41, 42] showed that optimally damped vibration
absorbers and optimally damped Helmholtz resonators reduce sound transmission into payload
fairing at low frequencies. [43, 44, 45, 46, 47]

Literature review
16
Idrisi et al. [43-47] also experimentally and analytically investigated the effect of
heterogeneous blankets in reducing radiated noise in a double panel system and presented their
findings in three companion papers. The heterogeneous blankets were fabricated by
embedding masses in a porous material. The porous material in the investigation was
Melamine foam. The double panel system was made up of a fuselage skin structure,
heterogeneous blanket, air cavity, and a trim panel structure. In the first of the companion
papers [43], the authors presented the methods used for modeling the acoustic performance of
the double panel system and experimental verification (of the analytical work). The findings
from their parametric studies were presented in the second paper [44]. In the third companion
paper [45], modeling strategies for devising an optimal heterogeneous blanket were described.
The response of the double panel system was numerically obtained using coupling equations.
The source and receiving panels and air cavity were modeled using an impedance and mobility
method (IMM) [43] and heterogeneous blanket was modeled using a finite element (FE)
model. The mathematical model of the double panel system is experimentally validated by
comparing the calculated and measured acoustic power (radiated from the system) and
spatially averaged square velocities (of source and receiving panels).
Figure 2-4: Double panel system – fuselage (1), heterogeneous blanket (2), air cavity (3), trim
panel (4), and interior acoustic field (5) [43].
Idrisi et al. [43] investigated the acoustic response of the double panel system to an impact
excitation using a mathematical model with five components. In Figure 2-4, the components
of the model are shown. A solution for the double panel system is obtained by equating forces
and velocities at the interfaces. IMM was used to couple the components together at
discretized locations on the interfaces [43]. At each frequency, for a given component, a
17
mobility matrix was formed describing the relationship between all output velocities and all
forces. Major assumptions included the source and receiving panels moving only with
transverse motion, continuity of velocity and force on both sides of the plate and flat panels
[43]. The objects were coupled using a linear system of equations derived using the continuity
of velocity and force equations at all interfaces [43].
A point source excitation was used in the experimental analysis. The experimental and
numerical results for the double panel system with and without the heterogeneous blanket
were compared. The authors experimentally validated that the analytical model can be used to
predict the response of the double panel system. They also concluded that proper tuning of the
heterogeneous blanket can result in broadband noise reduction below 500 Hz with added
weight less than 10% of the weight of the fuselage skin.
Idrisi et al [44] performed parametric studies to characterize the acoustic performance of
embedded masses inside porous materials. The characteristics that were considered include
“footprint”, “effective area” and “mass interaction distance”.
Each mass moving due to excitation inside a porous material has a region of influence. This
region of influence is identified in [44] as “footprint”. The size of the “footprint” may directly
affect the stiffness of the porous media such that the larger the region of influence (footprint),
the greater the stiffness becomes increasing the natural frequency of the heterogeneous
blanket.
Idrisi et al [44] illustrated that increasing the surface area of the top face of a mass changes the
volume of the porous media that the mass interacts, hence the stiffness and consequently the
natural frequency of the mass-spring-damper system inside the heterogeneous blanket
increases. The concept of “effective area” was introduced and defined as the area whose
perimeter is a distance d away from the perimeter of the surface area as shown in Figure 2-5
[44]. Idrisi et al. [44] then demonstrated that this effective area is proportional to the
equivalent stiffness of the heterogeneous blanket and is a function of the natural frequency.

Literature review
18
Figure 2-5: Schematic of “effective area” concept [44].
Idrisi et al. [44] also revealed that the resonant frequency of the mass inclusion increases with
decreasing the depth as shown in Figure 2-6.
Figure 2-6: Variation of resonant frequency of an 8 g mass in a melamine foam block
(35x35x100 mm) as a function of the thickness of foam beneath the mass [44].
Idrisi et al. [45] numerically examined three different heterogeneous blanket design strategies.
The first design strategy involved formation and evaluation of heterogeneous blankets with
random mass inclusions. As part of the second strategy, heterogeneous blanket design based
on the location of the source panel modes was evaluated. Masses were embedded near an
anti-node of a targeted mode [45]. The third design strategy involved evaluation of each of all
19
possible heterogeneous blanket configurations. For each configuration, the two mass
inclusions were located at different nodes (in FE model).
The authors [45] found that the performance of the heterogeneous blanket based on the design
(location of the masses) varied with the best performer attenuating 12.5 dB and the median
performer attenuating 2.6 dB in sound radiation in the 0-500 Hz frequency range. They
determined that the design based on the source panel modes did not perform as well. They
argued that the modes of the source panel are not equally coupled to the receiving panel and
hence optimal control of the source panel does not lead to optimal control of the sound
radiation. They emphasized that their investigation is at early stages and extensive work in
optimizing the system is required.
Without a convincing explanation of the underlying physics, all these investigations indicate
that introducing non-uniformities in porous materials enhance acoustic properties. One focus
in the current research project is also heterogeneous blankets; however, this research is more
extensive in terms of the involved analysis. In addition, the acoustic performance of
heterogeneous blankets is compared to the performance of viscoelastic damping materials
currently used. [48, 49, 50, 51, 52]
2.3 Noise transmission loss through partition When a sound wave strikes a partition, some portion of its energy will be reflected, another
portion will be absorbed, and the remaining portion will be transmitted through. The amounts
of reflection, absorption and transmission are dependent upon the properties of the partition.
A partition can be any panel or any combination of panels or panels with sound packages. A
sound package may be sound absorbent materials inserted within the gap in between two
panels, or material attachments to panels for stiffening and/or damping purposes. There hence
is a vast variety of partitions that are available and one single theory cannot adequately
describe the sound transmission characteristics. Aircraft fuselage, trim panel, noise treatment
materials in between the fuselage and trim panel, and windows all make up the partition that
separates the interior of the aircraft from the outside.

Literature review
20
There are a number of analytical models that are used to predict transmission loss. The
descriptions and derivations of some of those models can be found in [48-52] with
comparisons to experimental data. For the purposes of this project, Transfer matrix Method
(TMM), based modeling will be used for transmission loss calculations as additional resource
to finite element – boundary element modeling. NOVA [53] is TMM based computational
tool and (NOVAFEM [54] is a finite element – boundary element computational tool. They
are both used for modeling flat multilayered systems with acoustic materials (porous and
viscoelastic) [53, 54]. They are also part of the ESI/NOVA software package developed at
Mecanum/GAUS and distributed by ESI-group [55].
Some features of sound transmission through a panel are outlined below [56, 57]:
1. The amount of sound transmission through and/or radiation from a panel is related to
the frequency range of the incident noise and vibration source. The stiffness, mass or
damping dominates the partition’s response depending on the frequency range. Every
partition structure will have natural frequencies and mode shapes. It is revealed that
for a simple one-degree of freedom model at frequencies less than the natural
frequency, the stiffness dominates, around the natural frequency, the damping
dominates, and above the natural frequency, the mass dominates.
2. The response of the partition is depended on whether the excitation is mechanical or
acoustical. When a panel is mechanically excited, most of the radiated sound is
produced by resonant panel modes irrespective of whether the frequency range of
interest is below or above the critical frequency.
3. When a panel is acoustically excited by a diffuse incident sound field, sound
transmittance and radiation is very low below the critical frequency; it is generally the
mass of the panel that controls the reduction in sound transmission. Above the critical
frequency, it is the resonant modes that transmit most of the sound. [56]

21
Figure 2-7: An illustration of a double-leaf panel [12].
Doubling the mass per unit thickness of a single panel only produces a 6 dB increase in
transmission loss [56]. Double-leaf panels can produce significantly larger transmission losses
and are used when weight restrictions are critical for instance in aircraft applications. Double-
leaf panels are comprised of two separate single panels separated by a core section as shown in
Figure 2-7. The two panels are generally mechanically connected and some sort of absorption
material is normally used within the core section. The two main sound transmission paths
through the double-leaf panel are (i) direct transmission via the panel-fluid-panel path, and (ii)
structure-borne transmission through the mechanical couplings [56]. The behavior of a typical
double-leaf partition is schematically illustrated in Figure 2-8. All the assertions are valid for
infinite lateral flat panels.

Literature review
22
Figure 2-8: Schematic illustration of the behavior of a typical double-lead panel [56].
Some general comments and observations relating to the performance of a typical double-leaf
panel are listed below [56].
1. At frequencies below the double-leaf panel resonance the transmission loss is
equivalent to that of a single panel with a mass per unit thickness of ρs1 + ρs2 (i.e. there
is a 6 dB increase in transmission loss over a single panel of average mass per unit
thickness ρs1/2 + ρs2/2).
2. There is a significant reduction in transmission loss at the double-leaf panel resonance.
The addition of damping improves this.
3. There is a sharp increase in transmission loss (~18 dB per octave) after the double-leaf
panel resonance. This increase is maintained until the first air-gap resonance is
encountered.

23
4. At the air-gap resonance the transmission loss of a double-leaf panel is reduced to that
of a single panel with a mass per unit thickness of ρs1 + ρs2. These air-gap resonances
can be minimized and significant improvements can be achieved by the inclusion of
suitable sound absorbent material within the cavity. The absorbent material has the
added effect of damping the double-leaf panel resonance and sometimes completely
decoupling the individual partitions.
5. In the general air-gap resonance region the transmission loss increase at ~12 dB per
octave up to the critical frequency at which point the usual coincidence dip occurs.
6. The transmission loss performance at the double-leaf panel resonance can be improved
by increasing the mass per unit thickness ratio (i.e. ρs1 ≠ ρs2).
7. If there is sufficient damping, optimum high frequency performance is achieved when
ρs1 = ρs2. If not, having a different mass for the second panel allows the latter to isolate
the system at the critical dip of the first.
8. The sound absorbent material that is used in the cavity should have as high a flow
resistance as possible without producing any unnecessary mechanical coupling
between the two panels.


25
Chapter 3 Vibroacoustic performance indicators and testing methodologies
The vibroacoustic performance indicators of damping loss factor (DLF), airborne insertion
loss (ABIL), structure-borne insertion loss (SBIL), turbulent boundary layer excitation
insertion loss (TBLIL), average quadratic velocity (AQV), radiation efficiency and absorption
coefficient are defined in the first section of this chapter along with a brief discussion of
computational tools. In the second section of this chapter, testing methodologies for DLF,
ABIL, SBIL, radiation efficiency, and AQV are described. This chapter is concluded with a
brief section of conclusion.
3.1 Vibroacoustic performance indicators
The knowledge of the interactions of sound waves with solid structures is essential to define
sound transfer through a partition. The partition in consideration is an aircraft representative
fuselage structure by itself or along with a sound package. The excitation of the partition in
terms of power input and the response of the partition in terms of propagation and radiation of
sound are described in this section by defining vibraoacoustic performance indicators of DLF,
ABIL, SBIL, TBLIL, AQV, radiation efficiency and absorption coefficient.
Considering ideal circumstances including a known excitation method and within a laboratory
setting, sound transfer can be predicted quite accurately as will be shown in Chapter 5 and
Chapter 6. Although the actual excitation of the aircraft partition is very different from the
way partitions are excited in actual laboratory settings, the laboratory measurements and the
associated numerical analysis generally reveal the expected performance of a partition on
aircraft.
Two excitation methods were used to collect laboratory measurements. They were diffuse
field and mechanical point force excitations. Diffuse field excitation was used to obtain
transmission loss (TL) measurements and mechanical excitation was used to obtain the

Vibroacoustic performance indicators and testing methodologies
26
vibroacoustic performance indicators of DLF, SBIL, AQV, and radiation efficiency
measurements. The indicators of TL, DLF, SBIL, and radiation efficiency were also evaluated
numerically. In addition, absorption coefficient of sound package was numerically obtained.
The predominant noise source to the interior cabin of aircraft is the turbulent boundary layer
for most commercial jet engine aircraft. However, it is difficult and expensive to
experimentally simulate TBL excitation in a laboratory setting.
TL is the vibroacoustic performance indicator that most effectively describes the role of a
partition in hampering sound transfer. TL obtained using three different methods are
considered in the present study. Those methods are distinguished by the method used to excite
the partition. The excitation methods were diffuse acoustic field, mechanical and turbulent
boundary layer. With diffuse field excitation ABIL (airborne insertion loss) and with
mechanical excitation SBIL (structure borne insertion loss) were experimentally and
numerically evaluated. TBLIL (turbulent boundary layer insertion loss) was only numerically
evaluated as part of the parametric study in Chapter 6. Each vibroacoustic performance
indicator is briefly discussed next in separate subsections along with a brief discussion of
computational tools in the final subsection.
3.1.1 Damping loss factor
The numerical method of Statistical Energy Analysis (SEA) is currently most commonly used
in aircraft industry for assessment and optimization of insulation treatments for acoustic
performance. One of the main requirements in SEA calculations is the DLF values of
structures. There are three widely accepted methods of measuring DLF: decay rate method
(DRM), power input method (PIM) and half-power bandwidth method. Normally, DRM or
PIM DLF values are used in SEA calculations. For half-power bandwidth method, DLF for
each mode is required. This method is impractical for SEA context, since modal overlap is
high at higher frequencies.
Bolduc [74] performed a comprehensive analysis of DLF measurement methods. He in
particular thoroughly compared DRM and PIM. His investigation was both numerical and
experimental. As part of his numerical investigation, he created FEM models using IDEAS
NX 11 with arbitrary modal damping values and used the models to calculate input force-
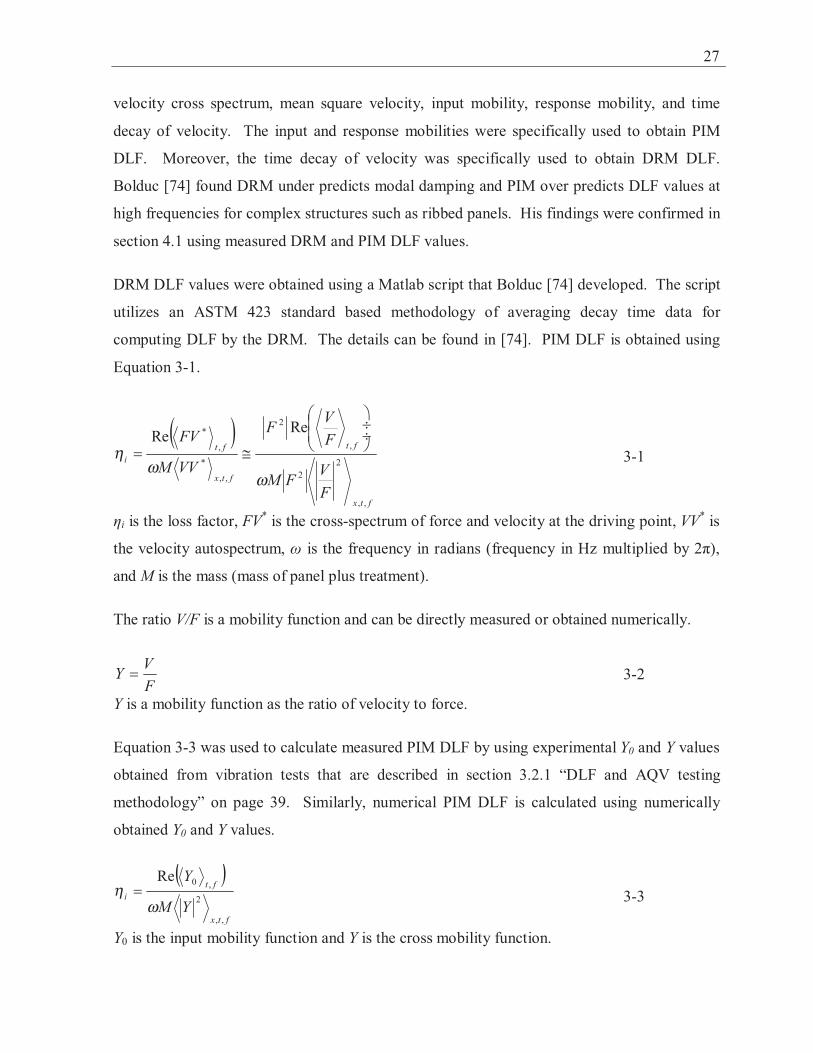
ωω
η
ωη

θ
θ
θ
θ
θθθ
θθθθτ
θτ
θ
θ
θ
θ
θθθ
θθθθτ

θθ
φφθφφθ
π
ω
φθ
θθφθθτφθτ
θτ
θτ
θθθτ

ρ
θ
ν
ν
νωρ

π

π
π
π
φφσ
π
φ
σ

ωρ
π

ρω
πωπ
ω
ρ
δ
σρ

φ
φ
φ
φ
ρσ

α
θθ
α
θ
θ
θ
θ
θθθ
θθθθαα
θ
θ
θ
θ
θθθ
θθθθαα

ωφθα
θθ
φθθφθα
θ
θ
θθθ
θθ
α
π
φφθπ
θ

Vibroacoustic performance indicators and testing methodologies
38
performance indicators of airborne insertion loss (ABIL), structure-borne insertion loss
(SBIL), average quadratic velocity (AQV), and radiation efficiency. [62, 63, 64,65, 66]
The complexity of the FEM varies widely depending on the physical problem and the number
of degrees of freedom. The FEM equations that are for instance used to predict the
vibroacoustic performance of a panel are more straightforward than the ones used for porous
materials. The FEM modeling of the poroelastic material is based on the Biot’s poroelasticity
equations (Biot [62, 63], Allard and Atalla [64]). The mixed displacement-pressure
formulation [64-66], for poroelastic materials is utilized in NovaFEM.
TMM is limited to 1-D propagation and infinite structures. However, size effect can be
included. Full coverage insulation system including viscoelastic material damping can be
modeled using TMM and again a correction (for size) can be performed to obtain an
approximation for partial coverage insulation. Various excitations from diffuse acoustic field
to point force mechanical (in terms of rain drops) can be used in TMM modeling. Nova
software engine is based on TMM. TMM is used to calculate ABIL, SBIL, TBLIL, radiation
efficiency, and absorption in the comparison of the sound packages with damping and
equivalent mass. The actual application of TMM in acoustic problems can be found in Allard
and Atalla [64].
3.2 Testing Methodologies
The vibroacoustic performance indicators of damping loss factor (DLF), transmission loss
(TL), structure-borne insertion loss (SBIL), radiation efficiency, and average quadratic
velocity (AQV) were measured as part of the acoustic performance comparison of viscoelastic
material constraining layer damping (CLD) to equivalent mass. DLF and TL measurements
were performed using Aluminum and composite panels. TL measurements using Al panel
were performed according to ISO 15186-1 standard at the University of Sherbrooke GAUS
laboratory. TL measurements using composite panel were performed according to ISO 140-3
1995 standard at the University of Florianopolis Acoustic and Vibration Laboratory. AQV
was measured while measuring both DLF and SBIL. SBIL measurements were performed
using the Al panel and radiation efficiency measurements were performed using the composite

39
panel. An outline of the performed tests is listed in Table 3-2. Each testing methodology is
described next in separate subsections.
Table 3-2: The tests performed Measurement Type
DLF TL SBIL AQV Radiation efficiency
Flat Al plate
Not performed
Performed according to ISO 15186-1
at GAUS
Performed at GAUS
Performed at GAUS
Not performed
Ribbed Al panel
Performed at GAUS
Performed according to ISO 15186-1
at GAUS
Performed at GAUS
Performed at GAUS
Not performed
P
anel
Typ
e
Ribbed composite
panel
Performed at GAUS
Performed according to ISO 140-3
1995 at LVA-UFSC
Not performed
Performed at GAUS
Performed at LVA-UFSC
3.2.1 DLF and AQV testing methodologies
Vibration tests were performed on two different panels as part of experimental
characterization of damping treatments. The panels were representatives of aircraft fuselage
skin, one being made out of aerospace grade Aluminum and the other carbon composite.
These panels were both ribbed with three stringer bays. A photograph of the Al ribbed panel
is in Figure 3-2(a), carbon composite panel is a close replicate of the Al ribbed panel.

Vibroacoustic performance indicators and testing methodologies
40
(a) (b) Figure 3-2: Pictures of (a) bare Al ribbed panel, (b) Al ribbed panel with CLD
The effect of temperature on performance of damping treatments and the effect of viscoelastic
material coverage on damping performance are tested. The temperature range was from -40
°C to 20 °C; measurements were collected at each 10 °C interval. 20%, 50%, 80% and 100%
viscoelastic material coverage on panels were tested. [67, 68, 69, 70, 71, 72]
Some references related to the testing methodology can be found in [67-72]. The tests were
performed using a set-up that was developed at the University of Sherbrooke, [73]. B&K
Pulse system was utilized to collect the measurements. A 50 lbs shaker was used to excite the
panels. Vibration response was measured utilizing a Polytec Laser Vibrometer and an
impedance head was used to measure input mobility and power. Since low temperature
measurements were required for majority of the tests, the experimental set up was placed in a
climate chamber. A photograph of the laser vibrometer and the climate chamber is in Figure
3-3. A graphical representation of the test set up which is taken from [73] can be found in
Figure 3-4. The Al and carbon composite representative fuselage skin structures are referred
to as “test panel” or “panel” in the rest of this section.

41
Figure 3-3 : A photograph of the Polytec laser vibrometer [73]
Figure 3-4: Scheme of measurement setup [73]
Main test set-up features are outlined below based on [73]:
The test panel was then hanged by bungee cables inside the climate chamber as shown
in Figure 3-4 as item 6. The shaker was attached to the test panel with a stinger using

Vibroacoustic performance indicators and testing methodologies
42
an impedance head where input mobility and power were recorded. One input power
location was used throughout the measurements. The panels were excited using the
shaker with broad band noise from 10 Hz to 5000 Hz.
The shaker was installed in an isolated box that was heated with two 100 W light
bulbs. A temperature controller was also installed in the box to ensure that the
temperature was always within the operational temperature range of the shaker (5 °C to
40 °C).
The laser vibrometer was used to measure the vibration response at the panel surface.
The vibrometer is located as close as possible to the climate chamber window in order
to have the maximum surface area available for measurement (see Figure 3-3).
Reflective paint was sprayed onto the test panel to get the maximum signal level
coming back to the vibrometer.
Experimental modal analysis was performed to characterize the test panel at room
temperature. Frequency response measurements were collected at over 2000 point
locations as part of the operational modal analysis.
The damping treatments were applied only to three central stringer bays of the test
panel. In that central stringer bays area, the vibration response was measured at 26
randomly chosen points on the Al ribbed panel surface and at 15 randomly chosen
points on the composite ribbed panel surface at low temperatures.
On ribbed panels, 100% viscoelastic material panel coverage area was decided as the
full panel skin area excluding the ribbed frame and stringer connections to the skin.
80%, 50%, and 20% coverage areas are with respect to 100% coverage area. The ratio
of the length and width remained constant for all coverage areas. The viscoelastic
material was always placed in the center of the stringer bay. 80% area coverage
viscoelastic material on a stringer bay is shown in Figure 3-2 (b).
High tech low peel (HTLP) adhesive was used to attach damping treatments to panels.

43
During the cooling process, the climate chamber vibrated and was excessively noisy.
Hence, all measurements including low temperature ones were collected while the
chamber was turned off.
The climate chamber was kept operational for about 40 minutes between the
temperature steps to allow the panel to stabilize its temperature.
For temperatures lower than -20°C, the climate chamber temperature was adjusted 2
degrees lower than the set value to ensure that the average temperature was close to the
set value.
There was approximately 15 minutes of available time for measurements at low
temperatures before the temperature in the climate chamber increased by 5 °C. Each
measurement lasted on average around 1 minute to collect due to the fact that some
measurements were required to be repeated as a result of poor readings. In order to
collect 26 measurements, the climate chamber was required to run for 5 to 10 minutes
in between measurements.
At the completion of each damping treatment test(s), the strips of the treatment were
weighed.
Using the vibration measurements decay rate method (DRM), power input method
(PIM) and modal based DLF values were calculated. DRM DLF was obtained using a
Matlab script that Bolduc [74] developed. The script utilizes an ASTM 423 standard
based methodology of averaging decay time data for computing DLF by the DRM.
PIM is described in section 3.1.1.
At the impedance head where a shaker was attached to the panel, input force and
velocity were measured using a force transducer and an accelerometer, respectively. A
laser vibrometer was used to measure velocity on the surface of the panel at 15 to 26
random locations. All measurements were collected as frequency response functions
(FRF) in terms of accelerometer velocity and force transducer force ratios
(AccelForce) and vibrometer velocity and force transducer force ratios (LaserForce).

Vibroacoustic performance indicators and testing methodologies
44
All collected measurements were in the frequency range of 0 to 3200 Hz at 0.5 Hz
intervals (bandwidths).
PIM DLF is calculated using Equation 3-3 in section 3.1.1. Y0 in Equation 3-3 is the
input mobility ratio of input velocity and input force and is measured at each 0.5 Hz
bandwidth. Y in Equation 3-3 is the ratio of panel surface velocity and input force and
is measured at each 0.5 Hz bandwidth. At each 0.5 Hz bandwidth, square magnitudes
of each of 15 to 26 random Y measurements are obtained and space averaged (<|Y2|>).
Both Y0 and <|Y2|> in 0.5 Hz bandwidth is converted to 1/3 octave bandwidth values.
This conversion is performed by averaging all Y0 and <|Y2|> values within 1/3 octave
frequency bands. For instance, Y0 value at 100 Hz (1/3 octave) is obtained by
averaging all values of Y0 at frequencies greater than or equal to 89.1 and less than 112
Hz. ηi at each 1/3 octave frequency bandwidth was calculated as the ratio of the
positive real value of 1/3 octave Y0 to the product of M, 1/3 octave ω and 1/3 octave
<|Y2|>.
The space averaged quadratic velocity (AQV) is force normalized and is given by
<|Y2|> in 0.5 Hz bandwidth (from 0 Hz to 3200 Hz) defined above and is either
averaged over the frequency range of 89.1 to 3200 Hz or in third octave.
3.2.2 TL testing methodology
Two different TL measurement methodologies were used. One methodology based on ISO
15186-1 for measurements using Al panel and the other one based on ISO 140-3 1995 for
measurements using composite panel.
3.2.2.1 Al panel TL testing
The measurements were done in the Groupe Acoustique de l’Université de Sherbrooke
(GAUS) transmission loss facility utilizing a semi-anechoic-reverberant transmission loss
suite and using a technical memo prepared by Bolduc [75]. The testing methodology is
described here is based on the technical memo [75].
Dimensions of the reverberation room were 7.5 m x 6.2 m x 3 m with a minimum frequency of
200 Hz and a reverberation time of 5.3 s at 1000 Hz. The free volume of the semi anechoic

45
chamber was 6 m x 7 m x 3 m with an operational frequency from 200 Hz to 80 kHz. The two
rooms were connected through a double wall construction with a 243.84 cm x 162.56 cm test
window decoupled by a 12.7 mm air gap. Both Al plate and ribbed Al panel were 1.5 m by 1
m. A filler wall was constructed to install the test panel, see Figure 3-5 and Figure 3-6. This
wall was made up of several layers of gypsum boards mounted on wood studs. The gypsum
boards were decoupled from the wood frame by resilient bars. The inner cavity was filled
with absorbing mineral wool. The panel was placed between two wooden frames, one
installed on the anechoic side and the other on the reverberant side, on which neoprene
decoupling tapes were applied. All the joints between the panel and the mounting frame were
sealed using silicon and aluminum tape. Several acoustic tests were conducted to check that
the system was leak-free and that the testing procedure was repeatable (mounting and un-
mounting of the panel).
Figure 3-5: Photos illustrating the filler wall construction (a) with gypsum boards; (b) wood
frame with resilient bars and isolating material (before adding the gypsum boards) [75]

Vibroacoustic performance indicators and testing methodologies
46
Figure 3-6: Illustration of the mounting of the panel in the test window [75]
The intensity technique was used to determine the transmission loss. The technique closely
follows the standard ISO 15186-1: 2000. The reverberation chamber was excited using six
loudspeakers and the sound pressure was captured using a rotating boom microphone (see
Figure 3-7). It is then used to calculate the incident sound power using diffuse field
assumptions.
Figure 3-7: Rotating microphone, loudspeakers and diffusers positions in the source room [
75]
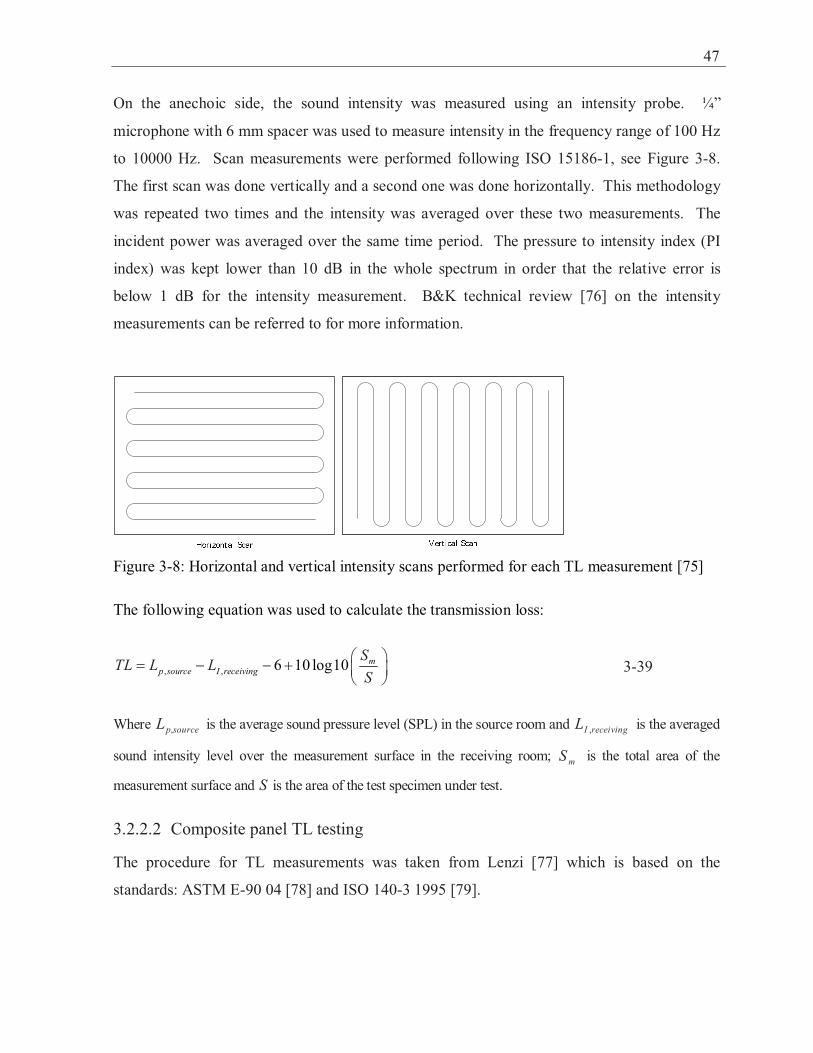

Vibroacoustic performance indicators and testing methodologies
48
TL measurements were performed using two adjacent reverberant rooms located in the
Acoustic and Vibration Laboratory (LVA) – UFSC. A schematic of the rooms is shown in
Figure 3-9. The ribbed composite panel was fixed in a 1.8 m by 1.13 m aperture between the
chambers.
Figure 3-9: Schematic of the LVA-UFSC transmission loss measurement facility [77]
TL was measured by creating a sound pressure field in the source room and measuring the
mean sound pressure levels on both rooms (source and receiver). Room 1 was the source
room where white noise was generated using a loudspeaker. Sound pressure levels (SPL)
were measured by microphones, in third octave bands, in both rooms. The volumes of room 1
and 2 are 148 m3 and 199 m3, respectively (see Table 3-3).
Table 3-3: Dimensions of the aperture in composite TL measurements Chamber 1 (source) Chamber 2 (receiver) Volume (m3) 148 199 Area (m2) 191.4 210 Perimeter (m) 70.5 72 The transmission loss (TL) was calculated using the expression [2]:


Vibroacoustic performance indicators and testing methodologies
50
Figure 3-10: Transmission loss measurement data collection instruments used at UFSC for
composite panel testing [77]
3.2.3 SBIL and AQV testing methodologies
The measurements were performed in the Groupe Acoustique de l’Université de Sherbrooke
(GAUS) transmission loss facility utilizing a semi-anechoic-reverberant transmission loss
suite. The procedure for SBIL measurements was taken from Bolduc [75]. SBIL is based on
the measurement of the radiated power and the mechanical input power. The ratio of the
radiated power to mechanical input power is a measure of “Acoustical-Mechanical Conversion
Factor” of the panel, referred to by AMCF [18]. The difference of two different
configurations of the same structure leads to the Structure-Borne Insertion Loss (SBIL) which
is a measure of the amount of sound insulation one can expect from the addition of a sound
insulation package component or a structural improvement to the baseline structure.

51
Al plate and ribbed Al panel were used to measure SBIL. The panels were installed between
the reverberant room and the anechoic room as illustrated in Figure 3-11. Additional
absorption was added in the reverberant room where the shaker was located to prevent
coupling with the acoustic response of the room.
Figure 3-11: Schematic illustration of a typical AMCF measurement setup [75]
The panel was excited with a shaker supported by bungee cables, see Figure 3-12. The shaker
was attached to the panel using an impedance head glued to the panel. Three different
impedance heads were glued to the panel at excitation locations; the shaker was connected to a
particular impedance head based on the related measurement. Both ribbed and flat Al panels
were excited at 3 different locations, flat panel mechanical excitation and accelerometer exact
measurement locations are shown in Figure 3-13. The excitation and measurement locations
for the ribbed Al panel are in the same pattern and in very close proximity to flat panel
excitation and measurement locations. On both panels, 25 accelerometer measurements were
collected for each sound package configuration, from which measured AQV was obtained.
The vibrations measurements in terms of frequency response function of velocity/force were
first space averaged and then frequency averaged (for third octave or overall) to obtain AQV
values.

Vibroacoustic performance indicators and testing methodologies
52
Figure 3-12: The shaker and some accelerometers attached to the ribbed Al panel
Figure 3-13: Flat Al panel (not ribbed Al panel) exact mechanical excitation locations and
accelerometer locations for average quadratic velocity measurements [75]


ρσ
λ

55
If the atmospheric pressure is kept constant, for the same chamber, one can write [18]:
KSPLSWL += 3-48
K is the chamber constant.
The comparison method measurement consists in measuring the mean sound pressure of the
reference sound source and measuring the mean sound pressure of the excited panel. The
panel sound power (SWLP) can be obtained by [18]:
SWLp = SWL
RS + SPL
P – SPL
RS 3-49
where SWLRS
is the sound power level of the reference source (given by the manufacturer);
SPLP
and SPLRS
are the measured mean sound pressure level of the panel and the reference
source, respectively.
Firstly, the sound pressure level generated by the reference sound source was measured
(SPLRS
) and stored. Moreover, the panel sound pressure level was measured when excited by a
random force. (SPLP). Acceleration measurements were made simultaneously with SPL to
assure the agreement between the pressure and acceleration signals. The acceleration was
measured in twenty evenly distributed points, for eleven excitation positions (five in the panel,
three in the frames and three in the stringers), adding up to 220 accelerations measurements
for each panel configuration. White random noise excitation generated within the Scadas
analyzer was used. The excitation and response points are shown in Figure 3-14.

Vibroacoustic performance indicators and testing methodologies
56
Figure 3-14 : Excitation and response points used for radiation efficiency measurements [80]
The instrumentation used for measuring the radiation efficiency was:
SCADAS Signal analyser and generator, with software LMS Test Lab v8.
Capacitive microphone ½” B&K 4189
Microphone calibrator B&K 4231
Reference sound source B&K 4204
Microphone pre-amplifier B&K 2671
5 Accelerometers B&K 4519-002
Electrodynamic exciter B&K 4809
Power amplifier B&K 2718

57
The white random noise was amplified and sent to the exciter B&K 4809, which was
connected to panel trough a thin metallic rod. The pressure and acceleration measurements
were made in third octave bands, from 200 Hz to 10 kHz. The shaker connected to the panel
is shown in Figure 3-15.
Figure 3-15 : The shaker attached to the carbon composite panel [80]
3.3 Conclusions
The vibroacoutic performance indicators of DLF, ABIL, SBIL, TBLIL, AQV, radiation
efficiency and absorption coefficient were defined in this chapter along with a description of
the test methodologies for measuring DLF, TL, SBIL, AQV, and radiation efficiency. In next
three chapters the results obtained using those test methodologies are outlined and compared
to numerical results. DLF and AQV measurements were used in Chapter 4 “Constrained layer
damping”. TL, SBIL, AQV and radiation efficiency measurements were used in Chapter 5
“Viscoelastic material damping versus equivalent mass layer”. TL and SBIL measurements
were used in Chapter 6 “Parametric study”. Numerical TBLIL results were also used in
Chapter 6.


59
Chapter 4 Constrained layer damping vibration performance
Viscoelastic material damping is added damping to a structure and is primarily effective in
reducing vibration levels at modal resonant frequencies and at around and above the critical
frequency region. Damping is a form of energy dissipation that occurs as a result of internal
molecular interactions during material deformation. The viscous fluid and elastic solid
characteristic of viscoelastic materials produces high damping. After being stressed,
viscoelastic material returns to its original shape, but does it slowly enough to oppose the next
cycle of vibration. The degree to which a material behaves either viscously or elastically
depends mainly on temperature and rate of loading (frequency).
The acoustic performance of viscoelastic material damping is generally evaluated
experimentally. The numerical evaluation is limited in application and requires prior
knowledge of the damping loss factor properties of the viscoelastic material and the structure
to be treated. The damping loss factor of the combination of viscoelastic material and the
structure to be damped are numerically evaluated. Since, experimental analysis of viscoelastic
material damping is time consuming and expensive, numerical methods are used in parametric
study and optimization of viscoelastic material damping (as treatment to a structure). FEM
and TMM are used as part of this project to numerically evaluate the effect of viscoelastic
material damping on representative aircraft fuselage structures. TMM is limited such that only
full coverage damping can be appropriately modeled and FEM modeling can be restricted to
low frequencies based on the size of the structure under consideration.
The acoustic performance of viscoelastic material with constraining layer (constraining layer
damping, abbreviated as CLD) is only investigated in the present study. FEM and TMM
modeling were performed either using overall properties of the CLD material or by
incorporating the material properties of core viscoelastic material and the constraining layer
separately in the model. The densities, frequency dependent damping loss factors and shear

Constrained layer damping vibration performance
60
modulus provided by the manufacturer or experimentally determined are used to construct the
numerical models. Modeling of CLD in terms of separate incorporation of core viscoelastic
material and constraining layer is performed as a sandwich where the core is viscoelastic
material, one skin is the fuselage and the second skin is the constraining layer.
The main objective of the project is to compare the acoustic performance of CLD to
equivalent mass. The focus in this chapter is to determine the effect of temperature and
frequency on the acoustic performance of CLD. A CLD material will be selected and
experimentally and numerically compared to equivalent mass in the next chapter.
The vibroacoustic indicators of damping loss factor (DLF) and average quadratic velocity
(AQV) are used to compare 5 different CLD materials (see Table 4-1) that are well-recognized
and commonly utilized in aircraft industry. An extensive experimental work is performed in
this comparison. Two representative aircraft fuselage skin panels were used: an aerospace
grade Aluminum (Al) panel and aerospace grade carbon fiber composite panel. Both panels
were ribbed and resembled fuselage skin with 3 stringer bays and a frame bay. The Al
representative fuselage skin panel with and without CLD is shown in Figure 3-2. The tests
were performed in a climate chamber to assess the effect of temperature on CLD. A trim
panel was not readily available for testing; hence, it is only incorporated in numerical studies
in Chapter 6.
Table 4-1: Tested constraining layer viscoelastic materials
ID Name of Material Manufacturer
Surface density [kg/m2]
Thickness [mm]
VE1 ADC124 EAR composites – a subsidiary of 3M 1.12 6.35
VP1 Paulstra Waffle Hutchinson 1.5 1.0
VS1 SmacEX SMAC MontBlanc Technologies 2.9 1.8
VS3 SmacEX composite
SMAC MontBlanc Technologies 2.5 1.9
VS4 SmacST composite
SMAC MontBlanc Technologies 2.5 1.9
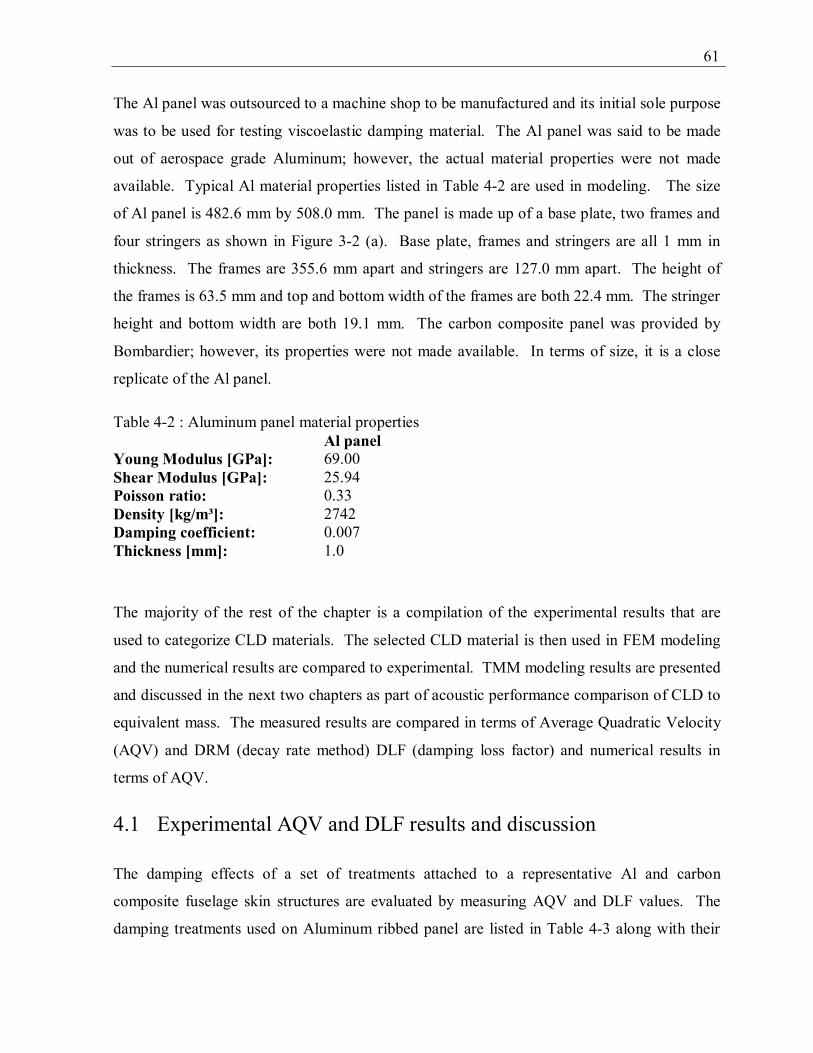
61
The Al panel was outsourced to a machine shop to be manufactured and its initial sole purpose
was to be used for testing viscoelastic damping material. The Al panel was said to be made
out of aerospace grade Aluminum; however, the actual material properties were not made
available. Typical Al material properties listed in Table 4-2 are used in modeling. The size
of Al panel is 482.6 mm by 508.0 mm. The panel is made up of a base plate, two frames and
four stringers as shown in Figure 3-2 (a). Base plate, frames and stringers are all 1 mm in
thickness. The frames are 355.6 mm apart and stringers are 127.0 mm apart. The height of
the frames is 63.5 mm and top and bottom width of the frames are both 22.4 mm. The stringer
height and bottom width are both 19.1 mm. The carbon composite panel was provided by
Bombardier; however, its properties were not made available. In terms of size, it is a close
replicate of the Al panel.
Table 4-2 : Aluminum panel material properties Al panel Young Modulus [GPa]: 69.00 Shear Modulus [GPa]: 25.94 Poisson ratio: 0.33 Density [kg/m³]: 2742 Damping coefficient: 0.007 Thickness [mm]: 1.0
The majority of the rest of the chapter is a compilation of the experimental results that are
used to categorize CLD materials. The selected CLD material is then used in FEM modeling
and the numerical results are compared to experimental. TMM modeling results are presented
and discussed in the next two chapters as part of acoustic performance comparison of CLD to
equivalent mass. The measured results are compared in terms of Average Quadratic Velocity
(AQV) and DRM (decay rate method) DLF (damping loss factor) and numerical results in
terms of AQV.
4.1 Experimental AQV and DLF results and discussion
The damping effects of a set of treatments attached to a representative Al and carbon
composite fuselage skin structures are evaluated by measuring AQV and DLF values. The
damping treatments used on Aluminum ribbed panel are listed in Table 4-3 along with their

Constrained layer damping vibration performance
62
percentage coverage of the stringer bays and total mass values. Also listed in Table 4-3 is the
mass of the bare Al ribbed panel. In a similar table, Table 4-4, the carbon composite damping
treatment details are listed along with the bare panel mass. The selection of the treatments,
percentage coverage and shape of the treatments are all based on the current use of the
damping materials on aircraft. 40%, 50%, 60%, 80% and 100% area coverage, rectangular
(corresponding to the shape of the stringer bay) shaped viscoelastic material treatments are
typically used on aircraft. Each of the treatment characterizations on both Al and carbon
composite ribbed panels was performed at temperatures of 20 °C, 10 °C, 0 °C, -10 °C, -20 °C,
-30 °C, and -40 °C. The cruise flight conditions are important which generally occur when the
aircraft is at 30,000 to 40,000 ft altitude. At those altitudes, the fuselage skin damping
temperature is expected to range from -40 to -20 °C.
Table 4-3: List of Al ribbed panel damping treatments each with percentage coverage and mass; the tests were performed at temperatures of 20, 10, 0, -10, -20, -30, and -40 °C Damping Treatment Percentage coverage [%] Mass [g] VS1 50 155.1 VS1 80 256.5 VE1 80 103.6 VP1 80 146.0 VS4 50 112.3 VS4 80 178.5 VS3 50 111.0 Al ribbed panel mass [g]: 1207.3
Table 4-4: List of carbon composite ribbed panel damping treatments each with percentage coverage and mass; the tests were performed at temperatures of 20, 10, 0, -10, -20, -30, and -40 °C Damping Treatment Percentage coverage [%] Mass [g] VS3 50 96.9 VS3 80 155.0 Carbon composite ribbed panel mass [g]: 1012.9
In order to evaluate the effect of percentage coverage of viscoelastic material on damping of
Al ribbed panel, a set of test configurations outlined in Table 4-5 were performed at room
temperature.

63
Table 4-5: List of Al ribbed panel damping treatments each with percentage coverage and mass; the tests were performed at room temperature Damping Treatment Percentage coverage [%] Mass [g] VE1 20 25.6 VP1 20 35.0 VS1 20 65.3 VE1 50 65.3 VP1 50 90.9 VE1 100 131.5 VP1 100 178.6 VS1 100 321.0 Al ribbed panel mass [g]: 1207.3
In practice the CLD treatment should be designed to target the resonances of the bare panel,
that is should be based on the mechanical and geometrical properties (including boundary
conditions) of the panel and environmental conditions (mainly temperature). Here this was
not possible and rather, typical CLD treatments used for aircraft are selected and compared.
This is coherent since, apart from the mounting conditions, the used panels are representative
of aircraft sidewalls.
A quick comparison of DLF calculation methods of DRM, PIM and half-power bandwidth are
made in Figure 4-1 and Figure 4-2 using bare Al ribbed and 80% coverage VS1
configurations, respectively. 80% coverage VS1 DLF results in Figure 4-2 show that values
obtained using the PIM method are consistently higher. Bolduc [74] provided a detailed
literature review and analysis in the area of DLF measurement methods. Based on his
investigation, DRM under predicts modal damping especially at low frequencies and PIM
severely over predicts DLF values at high frequencies for complex structures such as ribbed
panels due to difficulty in inputting power at high frequencies. Furthermore, PIM requires a
few modes per band to yield an acceptable DLF estimation which may be difficult to obtain at
low frequencies. DRM and modal method are more coherent and thus the analysis and
comparison uses DRM as a reference.
In Figure 4-1, bare panel DLF results are displayed for -30 C which is the temperature wherein
DLF is maximum for VS1.

Constrained layer damping vibration performance
64
0.1
1
10
100
100 1000 10000
Frequency [Hz]
DLF
[%]
DRM DLF Bare -30C
PIM DLF Bare -30C
Modal DLF Bare -30C
Figure 4-1: DLF values obtained at -30 C on bare Al ribbed using DRM, PIM and half-power
bandwidth (modal) methods are plotted against frequency.
0.1
1
10
100
100 1000 10000
Frequency [Hz]
DLF
[%]
DRM DLF 80% VS1 -30C
PIM DLF 80% VS1 -30C
Modal DLF 80% VS1 -30C
Figure 4-2: DLF values obtained at -30 C on Al ribbed panel with 80% VS1 coverage using
DRM, PIM and half-power bandwidth (modal) methods are plotted against frequency.
Damping treatment analysis for each of Al and carbon composite ribbed panels is performed
in a separate subsection. For both Al ribbed and carbon composite panels, in addition to actual

65
comparisons of damping treatments, the effects of temperature and coverage were also
investigated.
4.1.1 Analysis of Al ribbed panel damping
Al ribbed panel was used as a representative of aircraft fuselage skin. Five different
viscoelastic materials in seven configurations were applied to the Al ribbed panel to evaluate
the damping effect at varying temperature. The list of all these configurations can be found in
Table 4-3. The measured AQV (average quadratic velocity) and DLF obtained using DRM
(decay rate method) are used to compare constraining layer damping (CLD) materials. First,
the bare Aluminum ribbed panel is experimentally characterized based on an operational
modal analysis and frequency response function (FRF) measurements. Then, CLD materials
are compared based on: AQV; overall AQV; and DLF in frequency ranges of 50 to 2500 Hz
and 10 to 1125 Hz.
The modal analysis was performed using the velocity measurements obtained with a laser
vibrometer, see Figure 3-3. The panel was excited using a shaker. In Figure 4-3, measured
AQV is plotted against frequency. Measurements were taken at 0.3 Hz intervals.

Constrained layer damping vibration performance
66
-105
-95
-85
-75
-65
100 1000
Frequency [Hz]
AQ
V [d
B re
f 1 m
2 /s2 ]
Figure 4-3: Measured AQV on the bare Al ribbed panel surface
The modal frequencies and mode shapes (actually operating deflection shapes at the resonance
frequencies) are listed in Figure 4-4. The AQV plot in Figure 4-3 shows the major resonance
peaks which correspond to the mode shapes in Figure 4-4. Accordingly, peaks for instance
occur for mode (2x1) at 149 Hz, mode (3x1) at 190 Hz, and mode (2x2) at 273 Hz.
138 Hz – 2.46% 149 Hz – 1.17%

67
190 Hz – 1.15% 273 Hz – 2.10%
289 Hz – 3.14% 310 Hz – 1.10%
334 Hz – 1.14% 435 Hz – 2.22%
602 Hz – 0.91% 847 Hz – 0.97%
Figure 4-4: Mode shapes (operating deflection shapes at resonance frequencies),
corresponding modal frequencies and loss factors in % obtained from velocity measurements
on the surface of Al ribbed panel
In Figure 4-5, measured AQV results in third octave frequency is shown for bare Al ribbed
panel. When a damping treatment is efficient, its performance (measured using space and
frequency average indicators such as DRM) should show up in the 160-800 Hz frequency

Constrained layer damping vibration performance
68
range. The comparison of the CLD materials was performed using measured AQV and DLF
results in third octave frequency. Figure 4-5 shows that for bare panel, significant peaks in
third octave frequency occur at 200, 250, 400 and 500 Hz.
As outlined in section 3.2.1, in the experimental comparison of CLD materials, measured DLF
and AQV were obtained using FRF at few measurement points (15 to 30); however, over 1000
FRF measurements were used to perform bare panel modal analysis. Clearly, modal analysis
is much more reflective of the resonance behavior of the panel surface.
Figure 4-5: Measured AQV plot for bare Al ribbed panel in third octave frequency
The input mobility is measured on the Al ribbed panel surface at the shaker excitation point.
The plots of the measured input mobility at temperatures of -40 C, -30 C and 20 C for CLD
configurations are shown in Figure 4-6. The plots demonstrate that the point force mechanical
excitation that is used to compare CLD configurations is consistent and uniform.

69
(a)
(b)
(c)
Figure 4-6: Plots of input mobility measured at the shaker excitation point on the surface of
the Al ribbed panel treated with CLD configurations at (a) -40 C; (b) -30 C; and (c) 20 C

Constrained layer damping vibration performance
70
The measured AQV results are compared next as part of the CLD material comparison. First,
the mass corrected AQV plots for CLD configurations are compared at -40 C, -30 C and 20 C.
Mass correction of the CLD weight was performed by adding the term 20log(msp/mo) to the
AQV values obtained for configurations with damping (msp being the mass of the panel with
CLD and mo is the mass of the panel). Then, the overall (frequency averaged) AQV’s
obtained for each CLD configuration are compared. The damping performance categorization
of CLD configurations is largely based on the overall AQV values.
An anomaly is shown in Figure 4-7, the AQV results for bare panel is expected to be
temperature independent; however, the AQV results at 20 C significantly deviate, especially at
315 Hz, from the AQV results at -40, -30, -20, -10 and 0 C. The AQV measurements at 10 C
are corrupted and could not be plotted. One explanation for this deviation is the fact that the
bare panel measurements at 20 C were collected with the environmental chamber (see Figure
3-3) door open. All other measurements were collected with the door closed. The laser
vibrometer was used to collect the vibration measurements through the glass door when the
door was closed.
Figure 4-7: Bare panel AQV results at -40, -30, -20, -10, 0 and 20 C

71
In Figure 4-8 to Figure 4-10, CLD material comparison is performed using mass corrected
measured AQV. The AQV was measured on the surface of the Al ribbed panel. In Figure
4-8, mass corrected AQV values obtained at -40 C are compared. The Al ribbed panel (Bare)
AQV plot is in red color with triangle markings. The trend of the plots of the tested CLD
configuration is similar in the respect that the peaks are generally at the same frequencies.
However, the performance varies widely based on the frequency and the particular CLD
material. 80% VS1 appears to show the best performance with consistently lower AQV
values. 80% VP1 appears to perform the least favorably.
Figure 4-8: Plots of mass corrected AQV measured on the surface of the Al ribbed panel
treated with various CLD configurations at -40 C
In Figure 4-9, mass corrected AQV values obtained at -30 C are compared. The results are
very similar to the ones obtained at -40 C. The damping performance of VS1 is again the
most favorable and VP is the least favorable.

Constrained layer damping vibration performance
72
Figure 4-9: Plots of mass corrected AQV measured on the surface of the Al ribbed panel
treated with various CLD configurations at -30 C
The plots of the mass corrected measured AQV results for the Al ribbed panel CLD
configurations at 20 C are shown in Figure 4-10. The main observation is that the peak at
third octave 400 Hz for bare panel configuration at -40 and -30 C disappears at 20 C. The
AQV results for bare panel were expected to be temperature independent; this anomaly was
earlier linked to the measurement set-up.

73
Figure 4-10: Plots of mass corrected AQV measured on the surface of the Al ribbed panel
treated with various CLD configurations at 20 C
A more clear comparison of CLD materials based on temperature can be performed by
comparing overall AQV IL values. Overall AQV IL is calculated by subtracting overall AQV
values for configuration with CLD from overall AQV value for bare panel configuration. In
Figure 4-11 to Figure 4-13, overall AQV IL in the frequency range of 50 to 2500 Hz were
compared. Mass corrected overall AQV IL in the frequency range of 50 to 2500 Hz results at
-40 C in Figure 4-11 show that 80% VS1 is the best performing with 4.6 dB. The rest of the
CLD performance ranges from 2.5 to 3.6 dB.

Constrained layer damping vibration performance
74
3.0
2.6
3.0
3.6
2.8
4.6
2.5
-1
0
1
2
3
4
5
80% VE1
50% VS1
50% VS4
50% VS3
80% VS4
80% VS1
80% VP1
CLD configuration
Mas
s co
rrec
ted
over
all (
50 to
250
0 H
z)
AQ
V IL
at -
40 C
[dB
ref 1
(m/s
/N) 2 ]
Figure 4-11: Mass corrected overall AQV IL in the frequency range of 50 to 2500 Hz at -40 C
At -30 C, again 80% VS1 performance is the best at 4.8 dB based on mass corrected overall
AQV IL results in Figure 4-12. 80% VP1 with 3.2 dB performs the least favorably.

75
3.9
3.5
3.9
3.53.7
4.8
3.2
-1
0
1
2
3
4
5
80% VE1
50% VS1
50% VS4
50% VS3
80% VS4
80% VS1
80% VP1
CLD configuration
Mas
s co
rrec
ted
over
all (
50 to
250
0 H
z)
AQ
V IL
-30
C [d
B re
f 1 (m
/s/N
) 2 ]
Figure 4-12: Mass corrected overall AQV IL in the frequency range of 50 to 2500 Hz at -30 C
In Figure 4-13, the damping performance of the CLD materials is compared based on mass
corrected overall AQV IL at 20 C. Except for VP1 which performs similarly at temperatures -
40, -30 and now 20 C, all other CLD materials had a significant reduction in mass corrected
overall AQV IL. However, this significant reduction is misleading since the bare panel AQV
results at 20 C (as explained earlier) are unreliable. The actual overall AQV IL values should
be around 1 dB higher based on the comparison of the overall AQV at 20 C to ones at 0, -10, -
20, -30 and -40 C.

Constrained layer damping vibration performance
76
0.5
0.91.2
-0.3
0.9
2.0
3.0
-1
0
1
2
3
4
5
80% VE1
50% VS1
50% VS4
50% VS3
80% VS4
80% VS1
80% VP1
CLD configuration
Mas
s co
rrec
ted
over
all (
50 to
250
0 H
z)
AQ
V IL
at 2
0 C
[dB
ref 1
(m/s
/N) 2 ]
Figure 4-13 Mass corrected overall AQV IL in the frequency range of 50 to 2500 Hz at 20 C
Acoustically viscoelastic material damping is important at first few resonance frequencies
which occur below 1000 Hz for the Aluminum panel in consideration and at critical
frequency. The critical frequency is above 10000 Hz for the Aluminum panel and vibration
tests are limited to 2500 Hz.
In section 4.2 “Numerical AQV results and discussion”, the AQV results for VS1 at 50% and
80% are presented in the frequency range of 50 to 1125; hence, in Table 4-6, mass corrected
AQV IL in the frequency range of 50 to 1125 Hz are compared for VS1 material. 50% VS1 is
discovered to perform the best at -30 C with 3.4 dB in comparison to performance at
temperatures of -40 and 20 C. VS1 was selected to be used as the CLD for Al ribbed panel in
Chapter 5 in the acoustic performance comparison of CLD to equivalent mass.

77
Table 4-6: Mass corrected measured AQV IL for VS1 Mass corrected AQV IL (Treated panel AQV
subtracted from bare panel AQV) in frequency range of 50 to 1125 Hz [dB]
-40 C -30 C 20 C
50% VS1 2.4 3.4 0.7 (1.7*)
80% VS1 4.5 4.8 1.3 (2.3*) * Revised based on the estimated effect of the change in experimental set-up on the bare panel
AQV measurements at 20 C
In the rest of the section, CLD materials are compared based on DRM DLF results. All
corresponding plots are in Annexe A “DLF results”. The DLF measurements at -40, -30 and -
20 °C are plotted against frequency.
The DLF results appear to show that the carbon composite constraining layer damping
materials of VS3 and VS4 performing better than the rest of viscoelastic materials in contrast
to VS1 performing best in terms of AQV results; however, the results are in third octave
frequency (overall indications are not clear). Also, since VS3 and VS4 are specifically
designed for carbon composite fuselage skin; they are not applicable for the Al ribbed panel.
In Figure A-1 and Figure A-2, DLF results at -40 °C are shown. The results at -30 °C are in
Figure A-3 and Figure A-4. And in Figure A-5, the DLF values -20 °C plotted against
frequency.
In Figure A-6, the DLF values for bare Al ribbed panel at varying temperatures are shown.
The effect of temperature on viscoelastic material in terms of DLF results can be seen in
Figure A-7 to Figure A-9.
In Figure A-10 to Figure A-12, DLF values at -40 °C are plotted against mass of damping
treatment at varying frequencies. 1/3 octave frequency band DLF values are arithmetically
averaged to yield average DLF values in 1/1 octave bandwidth. Average DLF values at 125
Hz, 250 Hz, 500 Hz, 1000 Hz and 2000 Hz are plotted against mass of damping treatment.
In Figure A-13, performance of 50% and 80% VS1 are compared at -40, -30 and -20 °C. In
Figure A-14, DLF values measured at room temperature on Al ribbed panel treated with 20%,

Constrained layer damping vibration performance
78
50%, 80% and 100% are plotted. As determined earlier in this section, performance of VS1 is
optimal at -30 and -40 °C. At room temperature, except at 100 Hz to 200 Hz range, increasing
VS1 coverage does not present any noticeable increase in DLF values.
4.1.2 Analysis of carbon composite ribbed panel damping
A carbon composite panel was used as a representative of aircraft fuselage skin. One
viscoelastic material in two configurations was applied to the carbon composite ribbed panel
to evaluate the damping effect at varying temperature. The list of the configurations can be
found in Table 4-4. One major observation concerns an issue that may have affected the
measurements and was related to attaching viscoelastic materials to carbon composite panel.
The HTLP (hi-tech low peel) adhesive that was used to stick the CLD material to the carbon
composite panel formed a weak bond. The CLD material was not fully bonded to the panel
and came off of it easily.
The experimental modal analysis was performed to evaluate the resonance characteristics of
the carbon composite panel (representative of composite fuselage skin). In Figure 4-14,
measured AQV is plotted against frequency. Measurements were taken at 0.6 Hz intervals.

79
-110
-100
-90
-80
100 1000
Frequency [Hz]
AQ
V [d
B re
f 1 m
2 /s2 ]
Figure 4-14: Measured AQV on the bare carbon composite ribbed panel surface
Some modal frequencies and mode shapes (operating deflection shapes at resonance
frequencies) are listed in Figure 4-15. The AQV plot in Figure 4-14 shows the major
resonance peaks which correspond to the mode shapes in Figure 4-15. Accordingly, peaks for
instance occur for mode (1x1) at 204 Hz, mode (2x1) at 224 Hz, and mode (3x1) at 285 Hz.

Constrained layer damping vibration performance
80
204 Hz – 1.33% 224 Hz – 1.09%
285 Hz – 0.79% 294 Hz – 0.95%
598 Hz – 0.48% 726 Hz – 0.49%
Figure 4-15: Mode shapes (operating deflection shapes at resonance frequencies),
corresponding modal frequencies and loss factors in % obtained from velocity measurements
on the surface of carbon composite ribbed panel
In Figure 4-16, the measured AQV results in third octave frequency are shown for bare ribbed
carbon composite panel. The comparison of the CLD material was performed using measured
AQV and DLF results in third octave frequency. The reason why the results are compared in
third octave instead of narrow band is related to the use of SEA based indicators such as DRM
DLF. Figure 4-16 shows that for bare panel, the significant peaks in third octave frequency
occur at 200, 315, 500 and 1600 Hz. However, as outlined in section 3.2.1, experimental
comparison of CLD materials was performed using few measurement points (15 to 30) in
comparison to the number measurement points (over 1000) used to perform bare panel modal
analysis from which Figure 4-16 was obtained.

81
Figure 4-16: Measured AQV plot for bare carbon composite ribbed panel in third octave
frequency
The input mobility is measured on the carbon composite panel surface at the shaker excitation
point. The plots of the measured input mobility at temperatures of -40 C, -30 C and 20 C for
CLD configurations are shown in Figure 4-17. The plots demonstrate that the point force
mechanical excitation that is used to compare CLD configurations is consistent and uniform.

Constrained layer damping vibration performance
82
(a)
(b)
(c) Figure 4-17: Plots of input mobility measured at the shaker excitation point on the surface of
the carbon composite ribbed panel at (a) -40 C; (b) -30 C; and (c) 20 C
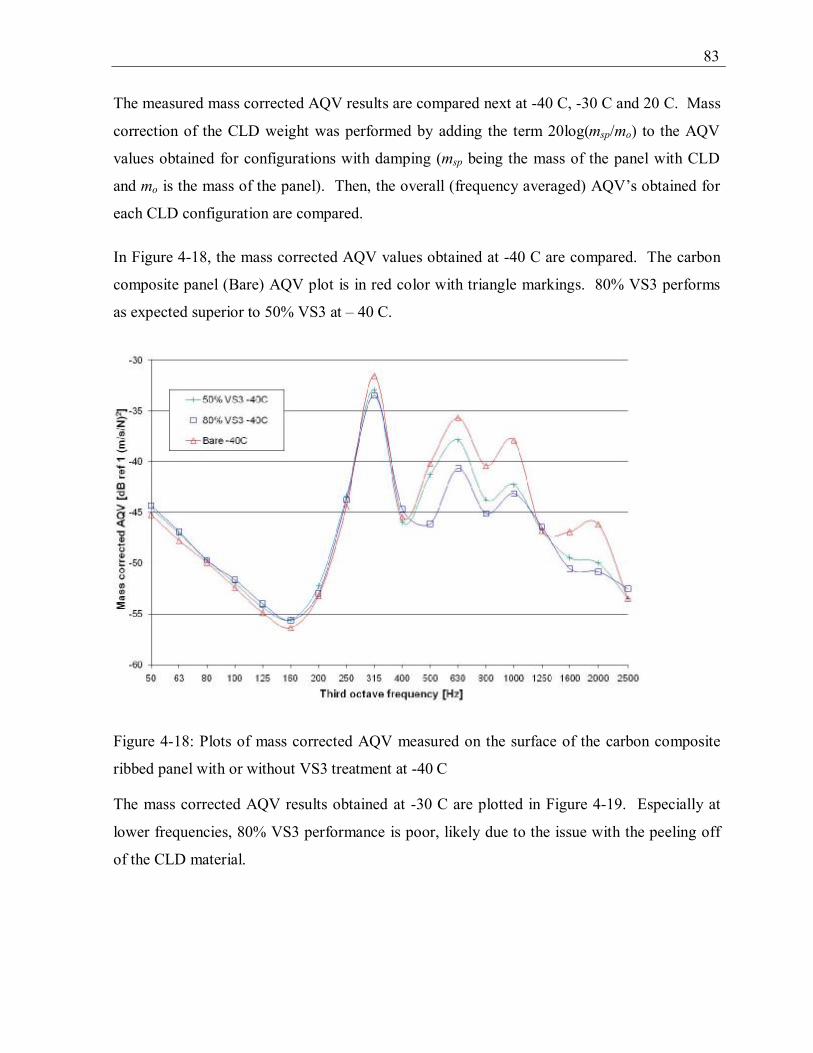
83
The measured mass corrected AQV results are compared next at -40 C, -30 C and 20 C. Mass
correction of the CLD weight was performed by adding the term 20log(msp/mo) to the AQV
values obtained for configurations with damping (msp being the mass of the panel with CLD
and mo is the mass of the panel). Then, the overall (frequency averaged) AQV’s obtained for
each CLD configuration are compared.
In Figure 4-18, the mass corrected AQV values obtained at -40 C are compared. The carbon
composite panel (Bare) AQV plot is in red color with triangle markings. 80% VS3 performs
as expected superior to 50% VS3 at – 40 C.
Figure 4-18: Plots of mass corrected AQV measured on the surface of the carbon composite
ribbed panel with or without VS3 treatment at -40 C
The mass corrected AQV results obtained at -30 C are plotted in Figure 4-19. Especially at
lower frequencies, 80% VS3 performance is poor, likely due to the issue with the peeling off
of the CLD material.

Constrained layer damping vibration performance
84
Figure 4-19: Plots of mass corrected AQV measured on the surface of the carbon composite
ribbed panel with or without VS3 treatment at -30 C
In Figure 4-20, the mass corrected measured AQV values obtained at 20 C are plotted. Except
at third octave 250 Hz for 50% VS3, the results are as expected. The CLD material is
effective at reducing vibration levels.

85
Figure 4-20: Plots of mass corrected AQV measured on the surface of the carbon composite
ribbed panel with or without VS3 treatment at 20 C
The mass corrected overall AQV IL in the frequency range of 50 to 2500 Hz results are
graphed for 50% and 80% coverage VS3 at -40 C, -30 C and 20 C in Figure 4-21 to Figure
4-23. The results at -40 C shown in Figure 4-21 indicate that increasing the VS3 coverage
from 50 to 80% generates 1 dB improvement in overall AQV IL.

Constrained layer damping vibration performance
86
1.6
2.6
-1
0
1
2
3
4
5
50% VS3
80% VS3
CLD configuration
Mas
s co
rrec
ted
over
all (
50 to
250
0 H
z)
AQ
V IL
at -
40 C
[dB
ref 1
(m/s
/N) 2 ]
Figure 4-21: Mass corrected overall AQV IL in the frequency range of 50 to 2500 Hz at -40 C
In Figure 4-22, the mass corrected overall AQV IL results at -30 C are plotted. The figure
shows that 80% VS3 is 1.2 dB less than 50% VS3 in terms of overall AQV IL. This result is
inconsistent; the performance of 80% VS3 should be at least as good as 50% VS3, not worse.
80% VS3 material is believed to have partial peeled off before the measurements were
collected at -30 C.

87
3.0
1.8
-1
0
1
2
3
4
5
50% VS3
80% VS3
CLD configuration
Mas
s co
rrec
ted
over
all (
50 to
250
0 H
z)
AQ
V IL
-30
C [d
B re
f 1 (m
/s/N
) 2 ]
Figure 4-22: Mass corrected overall AQV IL in the frequency range of 50 to 2500 Hz at -30 C
The overall AQV IL results obtained at 20 C are shown in Figure 4-23. 80% VS3 yields a 1.4
dB greater performance than 50% VS3. The overall AQV IL for 50% VS3 is at 2.1 dB which
is greater than 1.6 dB at -40 C and less than 3.0 dB at -30 C.

Constrained layer damping vibration performance
88
2.1
3.5
-1
0
1
2
3
4
5
50% VS3
80% VS3
CLD configuration
Mas
s co
rrec
ted
over
all (
50 to
250
0 H
z)
AQ
V IL
at 2
0 C
[dB
ref 1
(m/s
/N) 2 ]
Figure 4-23: Mass corrected overall AQV IL in the frequency range of 50 to 2500 Hz at 20 C
The DLF results are displayed in Annexe A. In terms of DLF results, again 50% VS3
consistently performs better than 80% VS3. The reason behind this anomaly is tied to the
bonding issue.
4.2 Numerical AQV results and discussion
An effort was made to validate numerically the presented results using a FEM model of the
panel. First an FEM model of a flat Al ribbed aircraft structure with and without viscoelastic
material damping is described. Then, the effect of viscoelastic material is evaluated using
numerical AQV results.
4.2.1 Description of Femap/Nastran model of Al ribbed panel
Femap/Nastran was used to model a 482.6 mm by 508.0 mm Al ribbed panel. The panel is
made up of a base plate, two frames and four stringers as shown in Figure 4-24. Base plate,
frames and stringers are all 1 mm in thickness. The frames are 355.6 mm apart and stringers
are 127.0 mm apart. The height of the frames is 63.5 mm and top and bottom width of the
frames are both 22.4 mm. The stringer height and bottom width are both 19.1 mm.

89
Figure 4-24: Isometric view of the panel
The base plate was modeled as plate structure (cquad4 elements) in Femap/Nastran. Typical
Aluminum material properties which are listed in Table 4-2 were used for the panel. Point
force load was applied to the panel at (x, y, z) coordinates in mm of (53.3, 276.9, 0) as shown
in Figure 4-25. Input force location was a replication of the experimental set-up. The panel
was free-free constrained as was in the experimental set-up. Al panel geometry was meshed in
Femap. The criterion of 6 linear elements per wavelength was used to determine the
maximum mesh size. The frequency range of excitation was 10 to 1125 Hz. A total of 5296
elements were used to model the panel. The frames and stringers were modeled using beam
elements.

Constrained layer damping vibration performance
90
Figure 4-25: Location of the input force is shown by the red arrow, top left corner of the base
plate being the origin, input force is located at (x, y, z) coordinates in mm of (53.3, 276.9, 0).
The effect of viscoelastic material damping applied to the Al ribbed panel on vibration
response was also modeled using Femap/Nastran. The viscoelastic material was modeled as
solid material attached to the base plate at three central frame bay locations as shown in Figure
4-26. Application of the viscoelastic material in the numerical model was a replication of the
experiments. 100% coverage is the full base plate area in each frame bay – excluding stringer
and frame connecting parts. 80% coverage is shown in Figure 4-26. Measured modal
damping loss factor values were used in the modeling of both bare panel and bare panel
treated with VS1 CLD material.

91
Figure 4-26: 80% coverage viscoelastic material damping in Femap/Nastran
4.2.2 Al ribbed panel FEM results
FEM space and frequency averaged quadratic velocity (AQV) values were calculated using
Femap/Nastran. In order to numerically validate the model, bare panel FEM input mobility
(IM) values were compared to measured IM values. Bare panel measured and calculated IM
comparison is shown in Figure 4-27.

Constrained layer damping vibration performance
92
-40
-35
-30
-25
-20
-15
-10
-5
100 1000
Frequency [Hz]
Inpu
t mob
ility
[dB
ref 1
m/s
/N]
MeasuredNumerical
Figure 4-27: Comparison of measured and Femap/Nastran calculated IM for bare Al ribbed
panel
The comparison of experimental and Femap/Nastran calculated results in Figure 4-27
indicates that correlation is poor between experimental and modeled results. One reason
behind the poor correlation is the fact that Al panel material properties are unknown. Al panel
is made up of an aerospace grade Aluminum composite material; however, typical Al material
properties were used in the model. A material characterization was not performed on the Al
panel. Other major causes of the deviation may be linked to the mass difference between the
tested and modeled panels and inadequate representation of stiffness in the model. The tested
Al panel weighed 1.2 kg and the modeled one 1.15 kg. The frames and stringers that are
riveted to the base panel stiffen the Al ribbed panel which was difficult to accurately model.
More serious is the representation of the frames in terms of beams rather than plates. The
frames being large and flexible, a plate representation may have been more realistic. Although
the bare panel experimental and numerical input mobility correlation is poor, relative (in terms
of delta values rather than absolute) numerical analysis CLD can still be performed.
93
In Figure 4-28, a few mode shapes and corresponding modal frequencies are shown for
numerically modeled Al ribbed panel. Normal mode/Eigenvalue analysis was performed to
obtain the mode shapes and frequencies. Some of the numerically obtained modes correspond
to the measured ones in Figure 4-4: numerical mode shapes at frequencies of 185, 251, 309,
333 and 425 Hz correspond to measured mode shapes at similar frequencies of 190, 289, 310,
334, and 435 Hz, respectively.

Constrained layer damping vibration performance
94
185 Hz 204 Hz
251 Hz 309 Hz
333 Hz 425 Hz
433 Hz 506 Hz
Figure 4-28 : A few mode shapes and corresponding modal frequencies obtained from
displacement calculations on the surface of Al ribbed panel using Femap/Nastran
In Figure 4-29, mass corrected AQV on surface of the three central bays of the panel are
compared based on VS1 application. The results are represented in 1/3 octave frequency show

95
that VS1 damping reduces AQV on the surface of the Al ribbed panel. Increasing the
percentage coverage also further reduces the AQV. In Table 4-7, Al ribbed panel surface
overall AQV IL values in the frequency range of 50 to 1125 Hz are listed. At 50% VS1
coverage, mass corrected AQV IL (treated panel AQV is subtracted from bare panel AQV) in
the frequency range of 50 to 1125 Hz amounts to 4.0 dB and at 80% VS1 coverage 4.7 dB.
The measured modal damping loss values at -30 C were used in the model. The experimental
overall AQV IL results in the same frequency range are 3.4 dB for 50% VS1 and 4.8 dB for
80% VS1 as described in section 4.1.1. At 20 C, the numerical overall AQV IL for 50% VS1
is 3.0 dB and the experimental is 1.7 dB. The discrepancies between measured and numerical
results can be largely tied to the representation of the damping (the intrinsic properties as a
function of temperature and frequency are not known) and the inaccuracy of the used model in
representing the exact mode shapes of the tested panel.

Constrained layer damping vibration performance
96
Figure 4-29: Femap/Nastran calculated AQV for bare Al ribbed panel, panel with 50% VS1
coverage and 80% VS1 coverage – results are in 1/3 octave.
Table 4-7: Mass corrected numerical AQV IL for VS1 Mass corrected AQV IL (Treated panel AQV
subtracted from bare panel AQV) in frequency range of 50 to 1125 Hz [dB]
50% VS1 at -30 C 4.0
80% VS1 at -30 C 4.7
4.3 Conclusions
One of the objectives of the vibration tests was to categorize viscoelastic damping materials
typically used in the aircraft industry. In addition, the effects of temperature and coverage on
viscoelastic material damping were investigated. Operational modal analysis was performed
as well on representative fuselage skin structures to determine the modal resonance
frequencies.

97
Viscoelastic material comparison was performed based on measured AQV and DLF and
numerical AQV. The measurements collected on Al ribbed panel were used for viscoelastic
material comparison at low temperatures. Only one viscoelastic damping material, VS3, was
available as treatment to the carbon composite panel.
In terms of mass corrected measured overall AQV IL results, 80% coverage VS1 was found to
be the best performing viscoelastic damping material (among the tested viscoelastic materials
and configurations) on representative fuselage skin Al panel, see section 4.1.1 “Analysis of Al
ribbed panel damping”. The numerical study involving calculation of AQV of the VS1 at -30
C at 50% and 80% panel coverage was performed. The frequency based correlation between
experimental and numerical results is poor; however, in terms of trends and overall values the
correlation is good. 50% coverage VS1 is used in the comparison of viscoelastic damping
material and equivalent mass in the next two chapters.


99
Chapter 5 Viscoelastic material damping versus equivalent mass layer
The vibroacoustic performance indicators of airborne insertion loss (ABIL), structure-borne
insertion loss (SBIL), average quadratic velocity (AQV), radiation efficiency and absorption
coefficient are used to compare constraining layer viscoelastic material damping (CLD) to
equivalent mass layer. The detailed descriptions of the vibroacoustic indicators and how they
relate to each other are discussed in section 3.1 “Vibroacoustic performance indicators” on
page 25. The diffuse field excitation vibroacoustic indicator of ABIL and the point force
mechanical excitation vibroacoustic indicators of SBIL and radiation efficiency were obtained
both experimentally and numerically. The AQV results are experimental. Experimentally, the
panel was mechanically excited using a shaker at three different points and numerically for
mechanical excitation rain on the roof excitation with energy approach option was used. The
diffuse field excitation absorption coefficient was obtained numerically using Nova.
Three sets of tests were performed as part of the comparison. The main distinguishing feature
of the tests is the representative fuselage skin structure. One set of tests was performed using
flat Al panel, next set using a ribbed Al panel and the third set using a ribbed carbon
composite panel. The mechanical properties of the ribbed carbon composite and Al panels are
listed in Table 5-1 and Table 5-2, respectively.

Viscoelastic material damping versus equivalent mass
100
Table 5-1 : Mechanical properties of the ribbed carbon composite panel Material 1: woven 2D Material 2: 1D Young Modulus E1 [GPa]: 52.83 90.00 Young Modulus E2 [GPa]: 51.35 10.00 Young Modulus E3 [GPa]: 58.25 9.00 Shear Modulus G12 [GPa]: 44.34 5.23 Shear Modulus G13 [GPa]: 45.5 5.23 Shear Modulus G23 [GPa]: 45.5 5.23 Poisson ν12: 0.06 0.36 Poisson ν13: 0.06 0.36 Poisson ν23: 0.06 0.36 Density [kg/m³]: 1530 1600 Damping coefficient: 0.15 0.15 Thickness [mm]: 0.21 0.19
Table 5-2: Mechanical properties of Al panel Al panel Young Modulus [GPa]: 69.00 Shear Modulus [GPa]: 25.94 Poisson ratio: 0.33 Density [kg/m³]: 2742 Damping coefficient: 0.02 Thickness [mm]: 1.0
Both the ribbed and flat Al panels have 1.5 m width and 1 m height. The flat Al panel is 1 mm
thick and skin, frames and stringers of the ribbed Al panel are all 1 mm thick. The ribbed Al
panel has 6 stringers with a width of 0.75”, a spacing of 7” and a distance from the edges of
the panel of 2.5”. 3 frames with a spacing of 17” and a distance from the edges of 13” are also
part of the ribbed Al panel, see Figure 5-1. The bottom and top width of the frames are 0.75”
and the frame height is 2.5”. Frames are channel C shaped and stringers L shaped.

101
Figure 5-1: Picture of the ribbed Al panel
The ribbed carbon composite are made up of two materials, the mechanical properties of
which can be found in Table 5-1. The layup of the skin, frames and stringers of the ribbed
carbon composite panel can be found in Annexe C. The skin is made up of 10 layers of
Material 1 that is listed in Table 5-1. The width and height of the carbon composite panel are
1.13 m and 1.8 m, respectively, see Figure 5-2 and Annexe C.
Figure 5-2: Picture of the carbon composite panel

Viscoelastic material damping versus equivalent mass
102
The CLD and equivalent mass layer are compared as part of sound packages, which are listed
in Table 5-3 for the ribbed Al panel, in Table 5-4 for the flat Al panel and in Table 5-5 for the
ribbed carbon composite panel. The equivalent mass is a 0.06” thick layer of thermoplastic
vinyl material with a density of 1260 kg/m3 manufactured by EAR composites and named
isodamp C-1002. In Table 5-3 and Table 5-5, the abbreviations B, FB, and TC correspond to
brick, frame blanket and top cover, respectively. The design of the sound packages is
representative of the industry practices in aircraft insulation.
Table 5-3: Ribbed Al panel sound packages
Sound package ID Configuration (B: brick, FB: frame blanket, TC: top cover, CLD: Al constraining layer damping)
% panel weight
bare Ribbed Al panel bareDamp Bare with 50% Smac EX CLD 43%
mela B(2x1”Melamine) + FB(0.5” Melamine) + TC(0.5” Melamine) 15%
mela100 B(1” Melamine + 0.06” isodamp + 1” Melamine) + FB(0.5” Melamine) + TC(0.5” Melamine) 60%
mela200 B(2x1” Melamine + 0.06” isodamp) + FB(0.5” Melamine) + TC(0.5” Melamine) 60%
melaDamp 50% Smac EX + 3” Melamine 58%
fiber B(2x1” 0.6pcf FG) + FB(0.5” 0.6pcf FG) + TC(0.5” 0.6pcf FG) 23%
fiber100 B(1” 0.6pcf FG + 0.06” isodamp + 1” 0.6pcf FG) + FB(0.5” 0.6pcf FG) + TC(0.5” 0.6pcf FG) 68%
fiber200 B(2x1” 0.6pcf FG + 0.06” isodamp) + FB(0.5” 0.6pcf FG) + TC(0.5” 0.6pcf FG) 68%
fiberDamp 50% Smac EX + 3” 0.6pcf FG 66%
Table 5-4: Flat Al panel sound packages Sound package ID Configuration % panel weight
fiber150Flpanel 1”+0.5” 0.6pcf FG + 0.06” isodamp + 0.5” 0.6pcf FG 94%
fiberDampFlpanel CLD + 2x1” 0.6pcf FG 94%

103
Table 5-5: Carbon composite panel sound packages
Sound package ID Configuration (B: brick, FB: frame blanket, TC: top cover, CLD: carbon constraining layer damping)
% panel weight
cbare Bare ribbed carbon composite panel CLD Bare with 53% Smac EX carbon CLD 39%
B+FB+TC B(0.75”Melamine) + FB(1.75” Melamine) + TC(0.5” Melamine) 15%
CLD+B+FB+TC 53% Smac EX carbon CLD + B(0.75”Melamine) + FB(1.75” Melamine) + TC(0.5” Melamine) 54%
B+FB+mass+TC B(0.75”Melamine) + FB(1.75” Melamine) + 0.06” isodamp + TC(0.5” Melamine) 46%
In Figure 5-3, a picture of melamine bricks and frame blankets (used as part of carbon
composite panel sound packages) can be seen. And in Figure 5-4, melamine bricks and frame
blankets are installed to carbon composite panel.
Figure 5-3: Carbon composite panel melamine bricks and frame blankets

Viscoelastic material damping versus equivalent mass
104
(a) (b)
Figure 5-4: Melamine bricks installed to carbon composite panel (a) and melamine frame
blankets installed to carbon composite panel over bricks (b)
Two different CLD materials are used: one designed for Aluminum (Al) fuselage skin and the
other one for carbon composite fuselage skin. Both CLD’s are manufactured by SMAC
MontBlanc Technologies and their viscoelastic material is the same: Smactane EX, the
material properties of which are listed in Table 5-6. The frequency dependent material
properties of shear modulus and loss factor of Smactane EX are in the form of plots in Annexe
A.
Table 5-6: Material properties of Smactane EX Smactane EX core viscoelastic material Shear Modulus [GPa]: See Annexe A Poisson ratio: 0.499 Density [kg/m³]: 1100 Damping coefficient: See Annexe A Thickness: 1.2mm
Two CLD’s are distinguished based on the constraining layer material. CLD for Al panels has
an Al constraining layer and CLD for carbon composite panel has a carbon composite

105
constraining layer. The constraining layer material properties of Al CLD and carbon CLD are
listed in Table 5-7 and Table 5-8, respectively.
Table 5-7: Al constraining layer material properties Al constraining layer Young Modulus [GPa]: 69.00 Shear Modulus [GPa]: 25.94 Poisson ratio: 0.33 Density [kg/m³]: 2742 Damping coefficient: 0.007 Thickness [mm]: 0.6 Table 5-8 : Carbon composite constraining layer material properties
Graphite epoxy constraining layer Young Modulus E1 [GPa]: 125 Young Modulus E2 [GPa]: 10 Young Modulus E3 [GPa]: 10 Shear Modulus G12 [GPa]: 5.9 Shear Modulus G13 [GPa]: 3 Shear Modulus G23 [GPa]: 5.9 Poisson ν12: 0.4 Poisson ν13: 0.032 Poisson ν23: 0 Density [kg/m³]: 1600 Damping coefficient: 0.15 Total thickness [mm]: 0.7
Aside from CLD and mass layer, sound packages are made up of either fiberglass or melamine
foam. The material properties of the porous materials are listed Table 5-9. The melamine and
fiberglass material properties were taken from an existing database. They were not
specifically characterized. Fiberglass was modeled as a limp material and its mechanical
properties were not measured.

ρρ
ωρρρ
ωρ
ωρ

107
insertion loss) or TBLIL (turbulent boundary layer insertion loss) for a sound package can be
made by the difference of the mass term (20log(msp/mo)) from the vibroacoustic indicator
value where msp is the mass of the panel with sound package and mo is the mass of the panel
(or the panel with reference sound package).
This section is divided into three segments. Two of which include experimental and
numerical results in the title: one being for the Al panels and the other one for the carbon
composite panel. In the third segment, under the heading “Overall results and final remarks”,
an overview and final discussion of the results are given. The experimental and numerical
results segments are subdivided based on the main make-up of the sound package that being
melamine foam or fiberglass. The comparison of CLD to equivalent mass layer is mainly
discussed in section 5.3 “Overall results and final remarks”. In the next two sections, the
experimental results are primarily presented and discussed and then compared to the numerical
results. Nova software was used as part of the numerical analysis.
5.1 Experimental and numerical results obtained using Al panels &
discussion
Two different Al panels, one being flat (unribbed) and the other one ribbed, are used as part of
the comparison of CLD to equivalent mass layer. The results obtained using the ribbed Al
panel are mostly presented and discussed, since the corresponding results obtained using the
flat Al panel generally agree closely. In fact, only the results for the sound packages with
fiberglass obtained using the flat Al panel are presented and discussed due to an issue related
to the method of installation of the equivalent mass layer as part of the sound package
treatment to the ribbed Al panel. The method of installation affected the acoustic performance
of the sound package. This issue will be discussed when the related results are presented.
The vibroacoustic performance indicators of ABIL, SBIL, and AQV were experimentally
obtained. Numerically, the vibroacoustic indicators of ABIL, SBIL, absorption coefficient
and radiation efficiency were obtained. The results obtained for the ribbed Al panel (bare
panel configuration) are first presented and discussed in the next section and then the results
for the melamine foam and fiberglass sound packages in the following two sections.

Viscoelastic material damping versus equivalent mass
108
5.1.1 Bare ribbed Al panel results
The ribbed Al panel is the baseline. The sound packages are compared to each other based on
the insertion loss results obtained using the baseline. The response of the baseline to diffuse
acoustic field and mechanical excitations is reviewed in this section. The effectiveness of the
sound package is in part related to the response of the baseline. For instance, the resonant
modes and critical frequency of the panel is relevant in the selection of the sound package.
The acoustic performance of the baseline is characterized by presenting and discussing the
transmission loss (TL) and average quadratic velocity (AQV) results obtained using the ribbed
Al panel (also called bare), and bare with CLD (bareDamp) and furthermore by presenting and
discussing the SBIL results obtained using bareDamp configuration. The ribbed Al panel
sound package configurations including bare and bareDamp are listed in Table 5-3.
Bare, bareDamp and mass corrected bareDamp TL measurement results are shown in Figure
5-6. The aim is to show the characteristic of the bare panel to acoustic excitation in terms of
TL response dips and peaks. The measured bare TL has a dip at 200 Hz, slight dips at 630 Hz
and 1000 Hz. Damping does not improve the dips at 630 and 1000 Hz; however eliminates
the one at 200 Hz. Femap/Nastran modal analysis of the ribbed Al panel reveals that at 195
Hz, first mode is observed at the stringer bays (local mode), see Figure 5-5. Applying CLD
material to the panel at stringer bays improves the dip in TL at third octave 200 Hz which is
most likely due to mode at 195 Hz. Based on Femap/Nastran model, the first three stringer
bay modes are in the 200 to 400 Hz frequency range which explains one or two dB
enhancement in TL (after mass correction) due to damping at those frequencies.
The ribbed Al panel was modeled in Femap as a modified flat plate. The modifications to the
plate were made to incorporate the effect of the frames and stringers. First, the thickness of
the elements corresponding to the frames and stringers were changed. The frames were
assumed four times (the thickness of the flat plate at the frame locations is then five times) as
thick as the plate and the stringers were assumed two times as thick as the 1 mm thick plate.
Since, this way of modeling does not add in the stiffening that frames and stringers generate,
this stiffening was accounted for by increasing Young’s modulus tenfold only at the frame and
stringer locations in Femap model. The Al material properties listed in Table 4-2 were used.

109
The geometry of the Al ripped panel outlined earlier in this chapter along with clamped
constraining which represented the experimental setup was used as part of the Femap model.
Figure 5-5: Mode at 195 Hz obtained by Femap/Nastran clamped constrained modal analysis
of the ribbed Al panel
Based on the experimental set-up, the TL measurements are in fact valid at frequencies greater
than 200 Hz (based on the size of the reverberant room). The first few global modes are
below 100 Hz with global mode 3 by 2 being at 90 Hz.
The TL plots in Figure 5-6 indicate that with diffuse field excitation, the damping of the bare
panel is generally effective as extra mass except in the frequency range of 200 to 400 Hz at
which damping is effective at local resonant modes. Even if the panel is ribbed, its TL seems
to be governed by non-resonant behavior which explains why damping is not effective.
However, one should also note that much damping is also added by the mounting set-up which
suppresses the dips related to transition frequencies between local and global modes. In
consideration of the ribbed panel that is studied, global modes consist of the modes observed

Viscoelastic material damping versus equivalent mass
110
on the surface of the panel as a whole without the influence of frames and stringers. Local
modes on the other hand occur within the bays generated with incorporation of frames and
stringers. Typical transition mode would involve resonance at frames and stringers. The CLD
is expected to perform better than the mass prediction at coincidence frequency; however, the
critical frequency of the ribbed Al panel is at above 10,000 Hz.
Figure 5-6: Ribbed Al panel (bare), bare with CLD (bareDamp) and bareDamp mass corrected
measured TL plots
The narrow band AQV versus frequency plots for bare and bareDamp configurations excited
by mechanical excitation are shown in Figure 5-7. The main peak which appears to be
equivalent to the resonant mode in Figure 5-5 is at 192 Hz. This mode is also excited with the
diffuse field excitation as show in Figure 5-6 as a dip in TL plot for bare panel at third octave
200 Hz. The CLD eliminates this resonance mode. The CLD also effectively eliminates all
other resonant modes shown as peaks in AQV plot for bare panel in Figure 5-7.
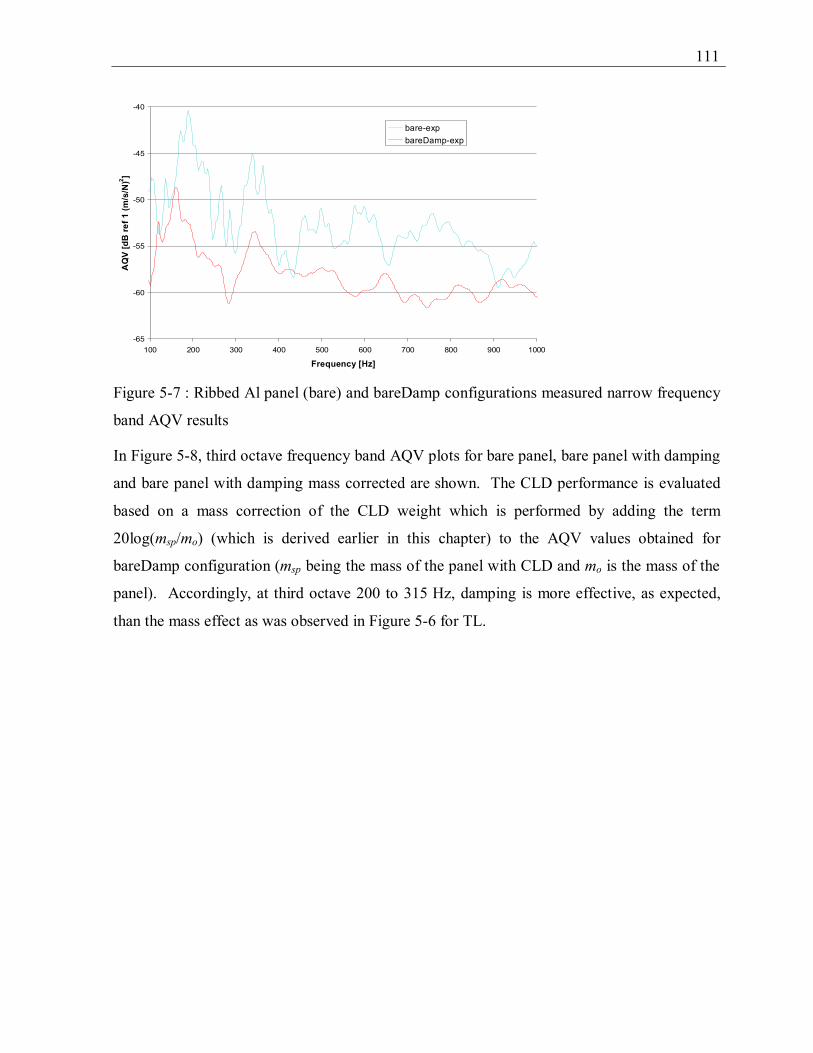
111
-65
-60
-55
-50
-45
-40
100 200 300 400 500 600 700 800 900 1000
Frequency [Hz]
AQ
V [d
B re
f 1 (m
/s/N
)2 ]bare-expbareDamp-exp
Figure 5-7 : Ribbed Al panel (bare) and bareDamp configurations measured narrow frequency
band AQV results
In Figure 5-8, third octave frequency band AQV plots for bare panel, bare panel with damping
and bare panel with damping mass corrected are shown. The CLD performance is evaluated
based on a mass correction of the CLD weight which is performed by adding the term
20log(msp/mo) (which is derived earlier in this chapter) to the AQV values obtained for
bareDamp configuration (msp being the mass of the panel with CLD and mo is the mass of the
panel). Accordingly, at third octave 200 to 315 Hz, damping is more effective, as expected,
than the mass effect as was observed in Figure 5-6 for TL.

Viscoelastic material damping versus equivalent mass
112
Figure 5-8 : Ribbed Al panel (bare), bareDamp and bareDamp mass corrected configurations
measured third octave frequency band AQV results
The ABIL and SBIL are plotted for the configuration bareDamp in Figure 5-9. The
comparison of the two plots indicates that except at third octave frequency bands of 400, 1250
and 1600 Hz, ABIL and SBIL are closely matched. The correlation of ABIL and SBIL is
expected to be good for highly damped structures since the resonant waves is reduced and the
forced wave motion is established as explained in Rhazi et al. [58]. The discrepancies may be
due to the method of excitation of the panel such that damping and mounting of the panel is
more effective (at global resonance modes) for structural noise transmission imposed by
shaker excitation in contrast to airborne noise transmission imposed by diffuse field acoustic
excitation.
The dip in SBIL for bareDamp at 400 Hz seen in Figure 5-9 is also seen in AQV plot for
bareDamp in Figure 5-8 as a peak. It appears that the mechanical excitation of the panel with
CLD treatment results in the excitation of a resonant mode and reduction in SBIL for
bareDamp configuration at 400 Hz. The reliability of SBIL measurements at frequencies
greater than 3150 Hz is questionable. The panel was difficult to mechanically excite at high
frequencies.

113
Figure 5-9: Measured ABIL and SBIL plots for ribbed Al panel (bare) with damping
configuration
The experimentally and numerically obtained TL plots for bare configuration are compared in
Figure 5-10. A ribbed Al panel with a mass of 6.35 kg was used to collect the measurements,
and the numerical analysis was performed using Nova software assuming a flat plain Al panel
with a mass of 4.17 kg.
The results are plotted at frequencies greater than 200 Hz since the test set-up is designed (the
size of the reverberant room) for measurement collection at frequencies above 200 Hz. The
minor discrepancies between the measured and numerical results are likely due to the frames
and stringers of the ribbed Al panel which were not numerically modeled. Higher measured
TL values from 400 Hz to 1000 can be tied to the frames and stringers which likely result in
additional damping and an increase in bending stiffness of the panel. The mounting of the
panel is also not accurately modeled which more resembles a clamped constraining rather than
free free modeled in TMM.
However, emphasis should be placed on the fact that the discrepancies between measured and
experimental TL results for bare panel are minor. The numerical method generally accurately
predicts the measured results as shown in Figure 5-10. A related analysis by Mejdi et al. [82]
shows that the stiffened panel has the same acoustic response as the skin without stiffeners at

Viscoelastic material damping versus equivalent mass
114
frequencies where the structural wavelengths are equal to the spacing between the stiffeners.
Furthermore, as will be shown later in this chapter, adding foam and fiberglass sound
packages to the ribbed panel generates a masking effect (damping and mounting of the panel
is masked) and the model agrees closely with the measurements.
Figure 5-10: Comparison of experimental and numerical TL for bare configuration
The experimentally and numerically obtained ABIL for bareDamp configuration are compared
in Figure 5-11. The large discrepancy from 200 to 500 Hz is likely due to the fact that the
damping was not accurately modeled. Damping is effective at modal resonant frequencies (as
shown earlier, the first stringer bay mode was observed at 195 Hz) and the measured results
show that effectiveness. The measured and numerical ABIL result discrepancies are
nevertheless expected considering that the effect of the partial coverage damping is an
estimate and the numerical results were obtained using the TMM assuming a flat Al panel
with an equivalent damping coefficient.
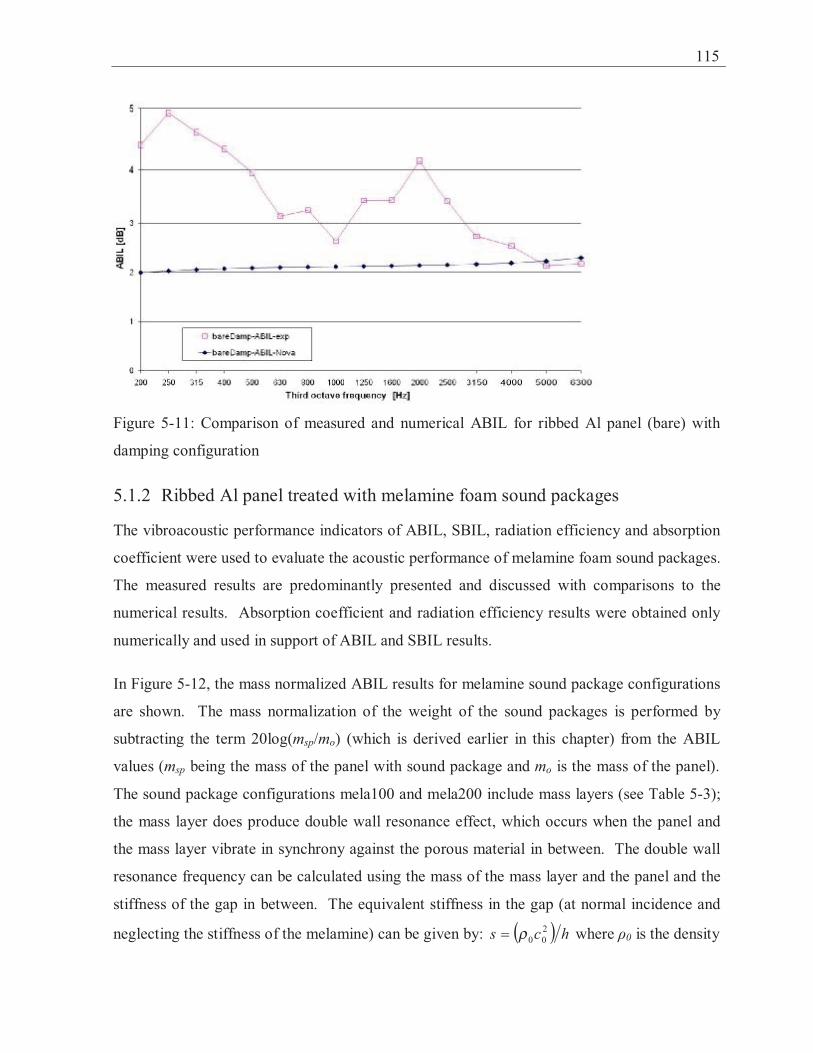
ρ

π

117
Figure 5-12: Mass corrected melamine foam sound package configurations ABIL results
In Figure 5-13, mass normalized SBIL for melamine sound package configurations are
presented. The mass normalization of the weight of the sound packages is performed by
subtracting the term 20log(msp/mo) from the SBIL values (msp being the mass of the panel with
sound package and mo is the mass of the panel). Since the experimental set-up was ideal for
measurements at frequencies higher than 200 Hz, the results at frequencies lower than 200 Hz
are ignored. MelaDamp configuration in terms of mass corrected SBIL results does not show
a better performance at 200 Hz (due to expected damping effect at first modal resonance) that
was observed in ABIL plots. In terms of SBIL, except at 400 Hz, the acoustic performance of
damping generally corresponds to the mass law estimation. CLD treatment at stringer bays
results in formation of a resonant mode at 400 Hz on SBIL plot for melaDamp sound package
as was observed for bareDamp configuration in Figure 5-9.
The melamine sound package configurations with mass layer show an anomaly. Mela200
configuration reveals the expected double wall effect, but the double wall effect is not as
pronounced with mela100 configuration, see Figure 5-13. The mela100 acoustic performance
in terms of SBIL at higher frequencies should be equivalent to mela200. Both mela100 and
mela200 however show the double wall resonance effect at lower frequencies.

Viscoelastic material damping versus equivalent mass
118
Figure 5-13: Mass corrected melamine foam sound package configurations SBIL results
Up to 5.5 dB SBIL difference observed between mela100 and mela200 configurations is likely
due to the method of installation of the mass layer. The mass layer as part of mela100
configuration was inserted in between 1” thick melamine foam bricks without using any tape
to attach to the Al panel when measuring the SBIL values. This was mainly performed to save
installation time. However, for mela200 configuration, the mass layers were taped to each
other and to the frames as seen in Figure 5-14. During TL measurements, mass layer was
taped to each other and to the frames for both mela100 and mela200 configurations and hence
this discrepancy was not observed in ABIL results in Figure 5-12.

119
Figure 5-14: Mass layer installation method for mela200 configuration
In the next three figures, Figure 5-15 to Figure 5-17, ABIL and SBIL plots for melamine foam
sound package configurations are compared. As expressed previously, for highly damped
structures where forced wave motion is prevalent, SBIL and ABIL are expected to be alike. In
Figure 5-15, mela configuration SBIL and ABIL are compared. SBIL values are consistently
2-3 dB higher than ABIL values up until third octave 3150 Hz. The reduction in SBIL at third
octave 2500 Hz and higher frequencies is likely linked to the difficulty in mechanically
exciting the panel at higher frequencies.
The difference between ABIL and SBIL is possibly linked to the excitation method. For
SBIL, the panel is directly excited and it transmits noise by radiation (resonant behavior). The
sound package then plays the role of a mask (filter). The higher the absorption and added
damping brought in by the material, the better becomes the SBIL – less overall transmitted
noise. Mass layer plays the same role for both ABIL and SBIL such that it generates a double
wall effect.

Viscoelastic material damping versus equivalent mass
120
Figure 5-15: Experimental SBIL and ABIL comparison for mela sound package
As it was previously explained, the method of installation of mela100 configuration was
different based on whether SBIL or ABIL was measured. The method used to install mela100
configuration to measure ABIL results in an apparent occurrence of the double wall effect.
The large difference between ABIL and SBIL (ABIL being significantly higher) at frequencies
higher than 2500 Hz in Figure 5-16 is due to the fact that more pronounced double wall effect
is experienced with ABIL measurements. Otherwise ABIL and SBIL comparison for mela100
is similar to the comparison for mela configuration.

121
Figure 5-16: Experimental SBIL and ABIL comparison for mela100 sound package
In each of Figure 5-15 to Figure 5-17, SBIL plots drop down at third octave 2500 Hz. The
cause of the drop was earlier tied to the difficulty in mechanically exciting the panel at high
frequencies; however, there are three other possible explanations to the occurrence of those
dips. One explanation relates the drop to the stiffening of the panel with frames and stringers.
Mejdi et al. [82], in their analysis of stiffened panels, presented that TL is lowered at certain
frequency ranges due to stiffeners below the critical frequency which is a general trend since
stiffened panels depict transition frequencies and higher radiation efficiency; this may not
apply in this case due to the extended drop. Both ABIL and SBIL are obtained from TL
measurements (with the method of excitation being different). Second explanation is tied to
occurrence of leaks in insulation and third is related to resonances in melamine system. In
Figure 5-18, mela configuration frame and top cover blanket installations are shown. Keeping
especially the top cover blankets in place was difficult. Bulging out was an issue and possibly
resulted in higher frequency leaks. A combination of the explanations is a possible
justification for the drop in SBIL at third octave 2500 and 3150 Hz.
In Figure 5-17, SBIL and ABIL measurement results for melaDamp configuration are
compared. From third octave 200 to 630 Hz, ABIL and SBIL curves match each other closely
(except at 400 Hz). The discrepancy at 400 Hz is likely due to a resonant mode that occurs
with mechanical excitation (but not with acoustical excitation).

Viscoelastic material damping versus equivalent mass
122
Figure 5-17: Experimental SBIL and ABIL comparison for melaDamp sound package
(a) (b) Figure 5-18: Melamine sound package configurations (a) frame and (b) top covers blankets
In Figure 5-19, numerically obtained absorption coefficient plots for melamine sound package
configurations are shown. The source side absorption coefficients without the panel in the
transmission configuration are plotted in Figure 5-19. The main observation is the melamine
resonance frequencies which are at third octave 800 Hz for mela200 and third octave 1600 Hz
for mela100 configurations and are confirmed by radiation efficiency plots (obtained using
mechanical <rain on the roof> excitation) in Figure 5-20. Elastic solid material characteristics
of the melamine foam allow the generation of vibroacoustic resonances. In Figure 5-16, a
reduction in the rate of increase of SBIL values is observed for mela100 configuration at 1600

123
Hz which likely corresponds to melamine resonance. The comparison of plots of ABIL and
SBIL for mela200 is in Figure D-20 in Annexe D.
0.0
0.1
0.2
0.3
0.4
0.5
0.6
0.7
0.8
0.9
1.0
Abs
orpt
ion
Coe
ffici
ent
Third octave frequency band [Hz]
mela-Abs-sourceSide-NoPanel-Nova
mela100-Abs-sourceSide-NoPanel-Novamela200-Abs-sourceSide-NoPanel-Nova
Figure 5-19: Numerically obtained absorption coefficient plots for melamine foam sound
package configurations – diffuse acoustic field excitation, source side, without panel
-90
-80
-70
-60
-50
-40
-30
-20
Radi
atio
n ef
fici
ency
[dB
ref 1
]
Third octave frequency band [Hz]
mela
mela100
mela200
Figure 5-20: Numerically obtained radiation efficiency plots for melamine sound package
configurations – rain on the roof (mechanical) excitation is used

Viscoelastic material damping versus equivalent mass
124
The experimentally obtained ABIL is compared to the one numerically obtained for melamine
foam sound packages in Figure 5-21 to Figure 5-23. The experimentally and numerically
obtained ABIL curves for mela configuration in Figure 5-21 closely match each other. The
slight discrepancy at third octave 5000 and 6300 Hz is most likely due to leaks in insulation
during measurements.
Figure 5-21: Experimental and numerical ABIL comparison for mela sound package
In order to achieve a better correlation between experimental and numerical results for
melamine sound package configurations with equivalent mass, Aluminum (the panel is made
up of Al) material property damping coefficient was set to 2%. However, the correlation is
still weak for mela100 configuration in Figure 5-22 (and for mela200 configuration in Figure
D-21 in Annexe D) due to the fact that the numerical model is not an accurate representation
of the test set-up. The mass patches were numerically modeled as one patch covering the
blankets at the surface. In contrast, the mass patches were in the size of stringer bays (see
Figure 5-14) as part of the experimental setup. With a full patch, the double wall effect is
truly experienced as can be seen in Figure 5-22. The measured ABIL dips at 5000 Hz for
mela100 configuration is likely due to leaks in insulation. For both mela200 and mela100, by
not accounting for the modal behavior of the ribbed panel, the simulations depict a narrow
double wall resonance dip. On the other hand, tests depict a wider (more damped) region and
at a higher frequency.

125
Figure 5-22: Experimental and numerical ABIL comparison for mela100 sound package
The experimentally and numerically obtained ABIL curves for melaDamp sound package are
compared in Figure 5-23. The effect of damping at local modal resonances is not modeled
accurately which is shown as a discrepancy from third octave 200 to 400 Hz. And at 5000 and
6300 Hz, the discrepancy is linked to the leaks in insulation.
Figure 5-23: Experimental and numerical ABIL comparison for melaDamp sound package
The comparison of the numerically obtained SBIL (using Nova software) to experimental
SBIL for mela configuration is shown in Figure 5-24. The CLD was partial coverage at 50%
and the mass layer coverage was 90%. Partial coverage configurations SBIL calculation is

Viscoelastic material damping versus equivalent mass
126
currently not possible using Nova software; hence, experimental and numerical SBIL
comparison was performed only for mela and fiber (next section) configurations. Rain on the
roof excitation with energy approach option was used to excite the panel for numerical
evaluation of SBIL and the measurements were based on mechanical excitation at three points
using a shaker. Considering that the numerical model is not a replication of the experimental
setup, the comparison of numerical and experimental SBIL for mela configuration in Figure
5-24 is reasonable.
Figure 5-24 : Experimental and numerical SBIL comparison for mela sound package
5.1.3 Ribbed and flat Al panels treated with fiberglass sound packages
The vibroacoustic performance indicators of ABIL, SBIL, and absorption coefficient are used
acoustically evaluate fiberglass sound packages. The results obtained for fiberglass sound
packages are similar to the ones obtained for melamine foam sound packages. However, the
double wall effect is less evident for fiberglass sound packages with mass layer, which is tied
to the method of installation of the mass layer. Mass layer remains limp without any support
from limp fiberglass.
The mass corrected ABIL plots for the fiberglass sound packages are shown in Figure 5-25.
The mass correction of the weight of the sound packages is performed by subtracting the term

127
20log(msp/mo) (which is derived earlier in this chapter) from the ABIL values (msp being the
mass of the panel with sound package and mo is the mass of the panel). The fiberglass sound
packages (see Table 5-3) mass layer was installed as part of the bricks. For fiber100
configuration, for instance, the mass layer is in between the 2x1” 0.6pcf fiberglass bricks;
similarly for fiber200 configuration, the mass layer is in the bag (used to contain fiberglass
bricks and blankets and made up of film) as the brick top layer facing inboard. The
installation of mass layer as part of fiber200 configuration is shown in Figure 5-26 which
shows that the mass layers are bulging out and sagging within the bricks resulting in source of
leaks. Those leaks are likely the reason for the reduction in ABIL at 2500 Hz for fiber100 and
fiber200 sound packages, since in Figure 5-25, fiber100 and fiber200 ABIL gradual reduce
below the level of fiber ABIL above 2500 Hz. Even with the difficulty to realize and control
double wall resonance effects due to limpness, 0.6pcf fiberglass performs better than
melamine.
The fiberglass configurations with mass layer show the double wall effect. The double wall
resonance frequencies were calculated 371 Hz for fiber100 and 263 Hz for fiber200 using
Equation 5-3. The double wall resonance frequencies that can be detected from ABIL curves
in Figure 5-25 correspond to third octave 250 Hz for fiber100 and 200 Hz or less for fiber200.
The discrepancies are related to the bulging out of the mass layer which increases the distance
to the panel resulting in lower resonant frequency and the fact that normal incidence was
assumed in the numerical method.

Viscoelastic material damping versus equivalent mass
128
Figure 5-25: Mass corrected measured ABIL plots for fiberglass sound package configurations
In Figure 5-25, fiberDamp sound package is especially effective (with performance exceeding
mass effect) in the third octave 200 to 400 Hz frequency range which corresponds to the
bareDamp and melaDamp sound package performances indicating the effectiveness of
damping at local modal resonance frequencies. The mass corrected ABIL results also indicate
that the double wall effect is less pronounced for fiberglass sound packages (in comparison to
melamine sound packages, see Figure 5-12).
Figure 5-26: Mass layer bagged as part of bricks in fiber200 sound package

129
Fiberglass sound packages measured mass corrected SBIL plots are shown in Figure 5-27. All
of the curves have a reduction in SBIL at 2500 Hz. The coherence was poor for SBIL
measurements at frequencies greater than 2500 Hz; hence, the measurements above 2500 Hz
are not reliable.
Figure 5-27: Mass corrected measured SBIL plots for fiberglass sound package configurations
In addition, the absorption coefficient curves for fiberglass configurations in Figure 5-28 do
not show a reduction in SBIL at 2500 Hz. The pictures of the fiberglass sound packages frame
and top cover blankets in Figure 5-29 show that both frame and top cover blankets were
bulging; a resonance system may have been generated incorporating the trapped air.

Viscoelastic material damping versus equivalent mass
130
0.0
0.1
0.2
0.3
0.4
0.5
0.6
0.7
0.8
0.9
1.0A
bsor
ptio
n C
oeffi
cien
t
Frequency [Hz]
fiber-Abs-sourceSide-NoPanel-Nova
fiber100-Abs-sourceSide-NoPanel-Nova
fiber200-Abs-sourceSide-NoPanel-Nova
Figure 5-28: Numerically obtained absorption coefficient plots for fiberglass sound package
configurations – diffuse acoustic field excitation, fluid domain, source side, without panel
Figure 5-29: Fiberglass sound package configurations (a) frame and (b) top covers blankets
The ABIL and especially SBIL plots in Figure 5-25 and Figure 5-27, respectively, for
measured fiberglass sound packages show that the double wall effect with equivalent mass
layer is compromised. The weakening of the double wall effect is tied to the installation
method. The significance of the method of installation of the mass layer becomes evident

131
when ABIL and SBIL measurements taken using a flat Al panel are reviewed. The fiberglass
sound package was installed such that that the mass layer was one big patch covering most of
the fiberglass layer over the flat Al panel. The ABIL plots shown in Figure 5-30 and the SBIL
plots in Figure 5-31 reveal that the double wall effect becomes pronounced if the mass layer is
one patch covering the whole surface for fiberglass sound packages. For melamine sound
packages, mass patches can be used to obtain the double wall effect as was observed for
mela200 configuration in Figure 5-14.
Figure 5-30: Flat Al panel mass corrected ABIL plots for fiberglass with mass layer and
fiberglass with CLD configurations

Viscoelastic material damping versus equivalent mass
132
Figure 5-31: Flat Al panel mass corrected SBIL plots for fiberglass with mass layer and
fiberglass with CLD configurations
The drop at 500 Hz that is observed in Figure 5-30 and Figure 5-31 for ABIL and SBIL plots
is due to the dominant contribution of absorption from the fiberglass sound package that is
observed in absorption coefficient plot in Figure 5-32. Below this frequency, the absorption
effect of the fiberglass sound package is small and the insulation system governs the
transmission.

133
0.75
0.8
0.85
0.9
0.95
1
100 125 160 200 250 315 400 500 630 800 1000 1250 1600 2000 2500 3150 4000 5000
Abs
orpt
ion
coef
ficie
nt
Third octave frequency [Hz]
2" 0.6pcf FG
Figure 5-32: Numerically obtained absorption coefficient plot for 2” fiberglass (0.6 pcf) sound
package configuration – diffuse acoustic field excitation, fluid domain, source side, without
panel
All of the fiberglass configurations SBIL plots show reductions at third octave 2500 Hz and
similar reductions are apparent in ABIL for fiber100 and fiber200 sound packages. The
reductions in SBIL are likely linked to the difficulty exciting the panel at higher frequencies.
The coherence of the SBIL measurements at frequencies above 2500 Hz was an issue that
compromises the validity of the drop in SBIL. The fact that a reduction in ABIL values can be
seen for fiber100 and fiber200 and not for fiber and fiberDamp sound packages strengthens
the argument of “insulation leaks” through the mass layer.
The comparisons of the ABIL and SBIL plots for fiberglass sound package configurations are
shown in Annexe D Figure D-24 to Figure D-27. The comparisons are very similar to the
ones obtained for melamine sound packages. In addition, the plots of the experimentally
obtained ABIL and SBIL compared to the ones numerically obtained for fiberglass sound
packages are in Annexe D Figure D-28 to Figure D-32. Those comparisons are also very
similar to the ones obtained for melamine sound packages.

Viscoelastic material damping versus equivalent mass
134
The discrepancies between numerical and experimental results for fiberglass sound packages
are likely related to the effect of fiberglass sound packages bagging and taping materials and
also the air gap between frame and top cover blankets. The bagging and taping materials and
exaggerated air gap (due to bulging out, see Figure 5-29) were not incorporated in the
numerical models.
The acoustic performance of melamine and fiberglass sound packages as treatment to a ribbed
Al panel were evaluated in this section predominantly using vibroacoustic indicators of ABIL
and SBIL. Accordingly, mass layer as part of both melamine and fiberglass sound packages
was shown to generate a double wall effect. However, both for melamine and fiberglass
sound packages with mass layer, the numerical results show a more pronounced double wall
effect. Earlier in this section, the method of installation was linked to the double wall effect;
whether the mass layer was one big patch or detached small patches made a difference. Small
detached patches as the mass layer was installed as part of sound packages are found less
effective. In addition, damping was determined to be especially effective at frequencies
between 200 to 400 Hz which was linked to the occurrence of first few local resonant modes
(of Al ribbed panel).
5.2 Experimental and numerical results obtained using carbon
composite panel & discussion
The vibroacoustic performance indicators of ABIL, radiation efficiency, and absorption
coefficient are used to acoustically evaluate sound packages as treatment to a representative
carbon composite fuselage structure. The sound packages are made up of melamine foam in
addition to CLD and equivalent mass layer, see Table 5-5. The ribbed carbon composite panel
(cbare) is chosen as the baseline configuration for ABIL measurements and calculations.
The method of installation equivalent mass layer is a factor in acoustic performance. It was
discovered that mass patches in the size of stringer bays installed as mass layer unattached to
each other reduced the double wall effect. Based on the method of installation of the mass
layer shown in Figure 5-33 for carbon composite sound packages, an apparent double wall
effect is expected.

135
Figure 5-33 : The method of installation of equivalent mass layer as part of sound package for
carbon composite panel
In Figure 5-34, the measured TL plots for ribbed carbon composite panel and the ribbed panel
damped configurations are shown. The mass corrected results of the damped ribbed panel
configuration are also plotted. The critical frequency zone is clearly seen in the TL curves at
third octave 3150 Hz. The CLD is effective at and above critical frequency and at third octave
250 to 400 Hz frequency range where there likely are local (stringer bay) resonance modes.
At third octave 1000 Hz, panel treated with damping has a dip in TL. As a consequence of
added CLD mass, the dip observed for bare panel at 1250 Hz appears to have shifted to 1000
Hz. This dip is likely related to a transition frequency between global and local behavior. As
it was the case for Al panel tests, because of the size of the reverberant room, TL
measurements are valid at frequencies greater than 200 Hz. According to Figure 5-34, other
than at the resonance mode, the coincidence frequency and third octave 1000 Hz, CLD is
acoustically effective as extra mass.

Viscoelastic material damping versus equivalent mass
136
Figure 5-34: Measured TL for composite bare panel, bare panel with damping and mass
corrected TL for bare panel with damping
The measured ABIL plots for sound packages with CLD and equivalent mass layer are shown
in Figure 5-35. The sound package configuration with mass layer (cbare+B+FB+mass+TC)
shows a double wall effect. The double wall resonance is at third octave 160 Hz according to
the numerically obtained absorption coefficient plot in Figure 5-36. Since the insertion loss
results were plotted starting at third octave 200 Hz, the double wall resonance frequency could
not be confirmed. However, the double wall resonance frequency is not observed at above
200 Hz.
As was observed on TL plot for cbare+CLD configuration in Figure 5-34, ABIL plot for
cbare+CLD+B+FB+TC also shows a dip at third octave 1000 Hz which is more pronounced
and spreads from 800 to 1250 Hz. The likely cause of this dip which is not seen on the
numerical absorption coefficient curve was linked to the generation of a transition frequency
between global and local behavior of the panel. Another dip at third octave 2000 Hz is seen
on ABIL curves for both of cbare+B+FB+mass+TC and cbare+CLD+B+FB+TC; this dip is
likely a result of the resonances in the melamine insulation system. The pictures of blanket
installation can be seen in Figure 5-4 and Figure 5-33 where bricks were first installed loosely

137
within stringer bays, the frame blankets were then installed above the bricks without using any
bonding material. If mass layer was part of the insulation, it was installed above frame
blankets and the top cover was placed over the frame blankets or the mass layer. CLD was
fastened to the panel before bricks were installed. The melamine was installed next to the skin
without bonding and likely by itself added damping to the panel.
The configuration with mass layer, cbare+B+FB+mass+TC, is slightly better than the
configuration with damping, cbare+CLD+B+FB+TC, at the panel critical frequency of 3150
Hz. Cbare+B+FB+mass+TC configuration ABIL plot flattens starting at 1600 Hz which is
likely due to the leaks in insulation. In Figure 5-33, the installation of the mass layer as part of
cbare+B+FB+mass+TC sound package configuration is shown. There clearly are gaps which
likely resulted in the leaks. The dip at 5000 Hz which is observed in Figure 5-35 is likely
caused by an insulation system coincidence frequency. This dip is seen on both ABIL curves
of cbare+B+FB+mass+TC and cbare+CLD+B+FB+TC. At third octave 1000 Hz, as was the
case for bare panel treated with damping, a dip is observed for cbare+CLD+B+FB+TC
configuration. This dip was earlier linked to a transition frequency between global and local
behavior. The radiation efficiency plot for cbare+CLD+B+FB+TC in Figure 5-38 shows high
radiation efficiency starting at 1000 Hz corroborating ABIL results.

Viscoelastic material damping versus equivalent mass
138
Figure 5-35: Mass corrected plots of measured ABIL for cbare+CLD+B+FB+TC and
cbare+B+FB+mass+TC sound package configurations
0.0
0.1
0.2
0.3
0.4
0.5
0.6
0.7
0.8
0.9
1.0
Abs
orpt
ion
Coe
ffici
ent
Frequency [Hz]
cbare+CLD+B+FB+TC-Novacbare+B+FB+mass+TC-Nova
Figure 5-36 : Numerical absorption coefficient plots for cbare+CLD+B+FB+TC and
cbare+B+FB+mass+TC configurations obtaining using diffuse acoustic field excitation, on
receiver side and in fluid domain.

139
The measured radiation efficiency results are shown in Figure 5-37 for the bare carbon
composite panel and the bare panel with CLD. The radiation efficiency plots for cbare and
cbare+CLD (except for at 250 Hz) are reflective of TL results in Figure 5-34. The effect of
damping at presumed local modal resonances is now at third octave 315 and 400 Hz instead of
250 to 400 Hz for TL plots. The critical frequency is at 4000 Hz in Figure 5-37. Damping is
effective at critical and higher frequencies.
Figure 5-37: Measured radiation efficiency plots for cbare and cbare+CLD configurations
The measured radiation efficiency plots for sound packages with CLD and equivalent mass are
shown in Figure 5-38. The radiation efficiency plots are very similar to the TL plots in Figure
5-35. The cbare+B+FB+mass+TC configuration becomes superior to the
cbare+CLD+B+FB+TC configuration in terms of radiation efficiency being lower at 250 Hz
and the cbare+B+FB+mass+TC configuration continues to have a lower radiation efficiency in
the rest of the frequency range that is plotted to third octave 6300 Hz. The TL curve of the
cbare+B+FB+mass+TC configuration shown in Figure 5-35 has a major dip at 5000 Hz that
goes below the TL measurement at third octave 5000 Hz for cbare+CLD+B+FB+TC.
However, the radiation efficiency dip at 5000 Hz for cbare+B+FB+mass+TC configuration
that was linked to an insulation system coincidence frequency is relatively minor. As was the

Viscoelastic material damping versus equivalent mass
140
case for measured TL, the measured radiation efficiency for cbare+B+FB+mass+TC
configuration shows a better performance at the critical frequency of third octave 3150 Hz.
Figure 5-38: Measured radiation efficiency plots for configurations cbare+CLD+B+FB+TC
and cbare+B+FB+mass+TC
Nova software TMM was used to obtain the numerical results. The carbon composite panel
was modeled using a symmetric composite approach. The modeled panel was a replication of
the flat base (without ribs) of the actual panel. 14 layers of 0.00019 m thick Material 2
(properties of which are listed in Table 5-1) were stacked all in 0° orientation. The ribs were
not modeled. CLD was modeled along with the panel (flat base part) in a general laminate
layout; see Nova User’s Guide [53]. The orientation of 14 layers of Material 2, viscoelastic
material layer and the constraining layer were 0°. The viscoelastic material and constraining
layer were modeled as separate entities; see Table 5-6 and Table 5-8, respectively for
properties. Melamine blankets were modeled in layers with thicknesses equivalent to the
thicknesses of brick, frame blanket and top cover listed in Table 5-5. The material properties
for melamine listed in Table 5-9 were used in the model. The CLD coverage was 53% and
mass layer coverage was 80% which were replica of coverage used in tests. Diffuse acoustic

141
field excitation with integration limit of 90° was used. FTMM (finite transfer matrix method)
was the numerical method.
The experimental and numerical TL results obtained for the bare carbon composite panel
configuration are shown in Figure 5-39 closely match each other. The coincidence frequency
was correctly predicted using the FTMM method. The critical frequency region ABIL is over
predicted by the numerical model due to inaccurate modeling of damping. A constant value of
0.15 was used as the damping coefficient for Material 2 – layer of carbon composite panel in
Table 5-1.
Figure 5-39: Comparison of experimental and numerical TL for bare carbon composite
configuration
The experimentally and numerically obtained ABIL for bare panel with damping
configuration is compared in Figure 5-40. The material properties including frequency
dependent damping loss factor provided by manufacturer were used in the model for the
viscoelastic material (see Table 5-6). The effect of damping at modal resonant frequencies
from third octave 250 Hz to 400 Hz is not shown in the numerical results. The effect of
damping at and above coincidence frequency is also not shown in the numerical results.

Viscoelastic material damping versus equivalent mass
142
Figure 5-40 : Comparison of experimental and numerical ABIL for cbare+CLD configuration
In Figure 5-41, the experimental and measured ABIL plots for the sound package
configuration that is made up of the combination of melamine foam and CLD
(cbare+CLD+B+FB+TC) are compared. Based on the comparison, the numerical model does
not account for the dip at 1000 and 2000 Hz and over predicts ABIL in the coincidence
frequency region. The dip at 1000 Hz was earlier linked to the generation of a transition
frequency between global and local behavior of the panel and the dip at 2000 Hz was linked to
melamine insulation system resonance.

143
Figure 5-41: Comparison of experimental and numerical ABIL for cbare+CLD+B+FB+TC
configuration
The experimental and numerical ABIL plots obtained using the sound package configuration
that is made of melamine foam and equivalent mass layer (cbare+B+FB+mass+TC) are
compared in Figure 5-42. The equivalent mass layer creates a double wall effect. The double
wall resonance frequency is at third octave 160 Hz according to the numerically obtained
ABIL plot. Due to the size of the reverberant room, measured ABIL results are invalid below
200 Hz.
The gap between the experimental and numerical ABIL results for cbare+B+FB+mass+TC in
the third octave frequency range of 315 to 500 Hz is likely due to the local stringer bay modal
resonances that were experimentally observed but not apparent numerically. The critical
frequency region ABIL is over predicted by the numerical model. Moreover, it was argued
earlier in this section that a coincidence in the insulation system caused the dip in ABIL in the
frequency region of 5000 Hz for cbare+B+FB+mass+TC.

Viscoelastic material damping versus equivalent mass
144
Figure 5-42: Comparison of experimental and numerical ABIL for cbare+B+FB+mass+TC
configuration
The comparison of the numerically and experimentally obtained radiation efficiency plots for
the bare carbon composite panel configuration is in Figure 5-43. The discrepancies in
experimental and numerical radiation efficiency curves are due to the fact that damping was
not correctly incorporated in the model. The damping loss factor of the panel was not
available. However, both numerical and experimental results show the peak at third octave
3150 Hz which is the panel critical frequency.

145
Figure 5-43: Experimentally and numerically obtained radiation efficiency plots for cbare
configuration
The numerically and experimentally obtained radiation efficiency plots for the
cbare+B+FB+mass+TC configuration are compared in Figure 5-44. The actual mass layer
coverage was 80% which was not correctly modeled in Nova. A proportional average of
radiation efficiencies obtained for cbare+B+FB+mass(full coverage mass layer)+TC and
cbare+B+FB+TC configurations was used without incorporating geometry. The use of
incorrect damping loss factor properties in model has also resulted in discrepancy. However,
based on the numerical radiation efficiency results, the double wall resonance frequency is at
third octave 160 Hz which complies with ABIL results. The experimental radiation efficiency
results are uncertain below 200 Hz.
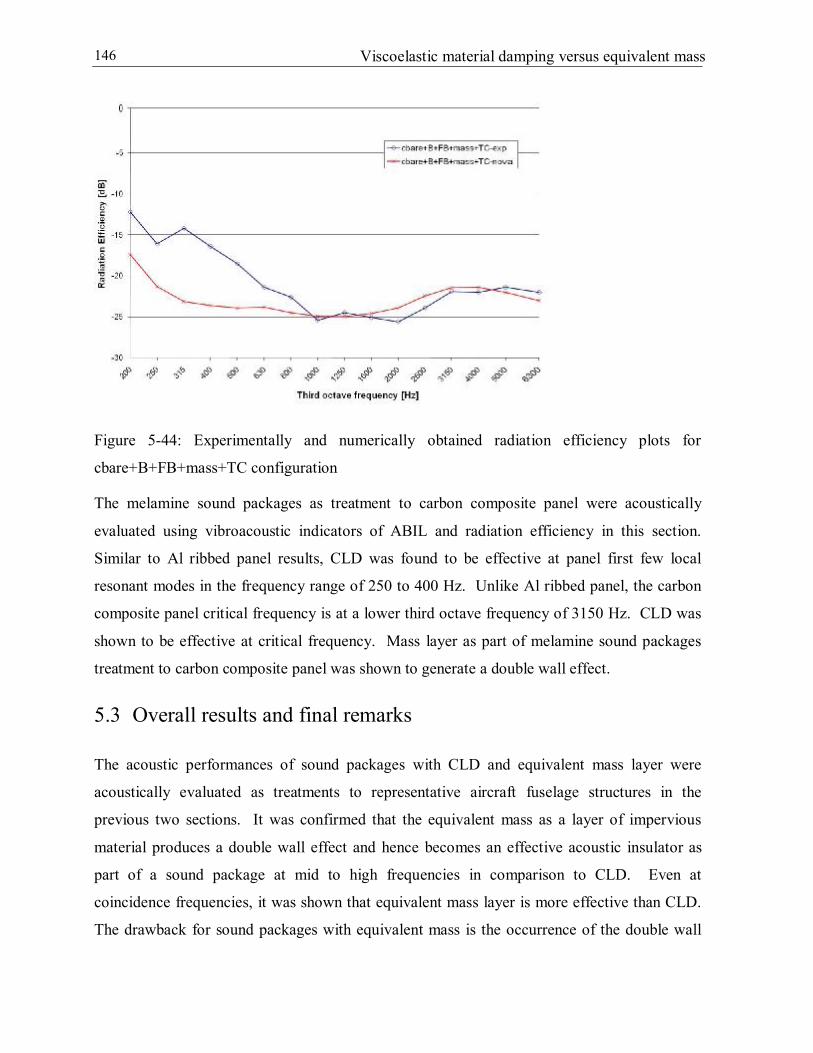
Viscoelastic material damping versus equivalent mass
146
Figure 5-44: Experimentally and numerically obtained radiation efficiency plots for
cbare+B+FB+mass+TC configuration
The melamine sound packages as treatment to carbon composite panel were acoustically
evaluated using vibroacoustic indicators of ABIL and radiation efficiency in this section.
Similar to Al ribbed panel results, CLD was found to be effective at panel first few local
resonant modes in the frequency range of 250 to 400 Hz. Unlike Al ribbed panel, the carbon
composite panel critical frequency is at a lower third octave frequency of 3150 Hz. CLD was
shown to be effective at critical frequency. Mass layer as part of melamine sound packages
treatment to carbon composite panel was shown to generate a double wall effect.
5.3 Overall results and final remarks
The acoustic performances of sound packages with CLD and equivalent mass layer were
acoustically evaluated as treatments to representative aircraft fuselage structures in the
previous two sections. It was confirmed that the equivalent mass as a layer of impervious
material produces a double wall effect and hence becomes an effective acoustic insulator as
part of a sound package at mid to high frequencies in comparison to CLD. Even at
coincidence frequencies, it was shown that equivalent mass layer is more effective than CLD.
The drawback for sound packages with equivalent mass is the occurrence of the double wall

147
resonance at lower frequencies which compromises the effectiveness of the equivalent mass
layer.
The make-up of the porous material (whether foam or fiberglass) did not influence the
presence of the double wall effect. However, the method of installation of the equivalent mass
layer determined the effectiveness of the double wall. Mass patches in the size of stringer
bays installed as mass layer unattached to each other reduced the double wall effect for the
ribbed Al panel fiberglass sound package configurations. Taping the mass patches the size of
stringer bays to each other was shown to enhance the double wall effect for melamine sound
package configurations.
Average ABIL and SBIL values in the SIL frequency range (octave 1000 to 4000 Hz) and
overall ABIL and SBIL values in the frequency range of 200 to 6300 Hz are compared in
Table 5-10 to Table 5-12. Except for the instances where installation of the mass patch
became an issue (as described earlier), the equivalent mass layer was found to be superior to
CLD in terms of average ABIL and SBIL and overall ABIL and SBIL. Overall insertion loss
(IL) values were calculated using Equation 5-4 for ABIL and Equation 5-5 for SBIL.
5-4
Where Lw-no sp is A-weighted power level for system with no sound package and Lw-sp is A-
weighted power level for system with sound package.
5-5
In Table 5-10, the average and overall ABIL results for the ribbed Al panel sound packages
are listed. Accordingly, melamine sound package configuration with equivalent mass layer
shows an improvement in average ABIL of up to 7 dB measured and numerical over CLD.
The overall ABIL improvement was up to 7 dB A measured and numerical for melamine
sound packages. The fiberglass sound package configuration with equivalent mass layer (for
which the double wall effect was reduced due to the installation method for measured values)

Viscoelastic material damping versus equivalent mass
148
shows an improvement in average ABIL of up to 2 dB measured and 7 dB numerical over
CLD. The measured overall ABIL for fiber200 configuration was in fact 2 dB A less than the
one obtained for fiberDamp due to installation. However, fiber100 performance is equivalent
to fiberDamp and both fiber100 and fiber200 were 7 dB A better than fiberDamp in terms of
numerical overall ABIL.
Table 5-10: Mass corrected average and overall ABIL for ribbed AL panel sound packages
Sound package
Average of measured ABIL at 1k, 2k, 4k Hz
1/1 octave
Average of numerical ABIL at 1k, 2k, 4k Hz
1/1 octave
Overall measured ABIL from 200 to 6300
Hz [dB A]
Overall numerical ABIL
from 200 to 6300 Hz [dB A]
mela 17 17 16 18 mela100 23 23 23 24 mela200 24 23 23 24 melaDamp 17 16 16 17 fiber 25 23 31 28 fiber100 27 29 29 34 fiber200 25 29 27 34 fiberDamp 25 22 29 27
In Table 5-11, the average and overall SBIL results for the ribbed Al panel sound packages are
listed. Numerical SBIL results were only obtained for mela and fiber configurations and are
used to correlate to the measured results. The overall SBIL improvement was up to 5 dB for
melamine sound packages. The fiberglass sound package configuration with equivalent mass
layer did not produce any improvement over CLD as the overall SBIL.
Table 5-11: Mass corrected average and overall SBIL for ribbed Al panel sound packages
Sound package
Overall measured SBIL
from 200 to 3150 Hz [dB]
Overall numerical SBIL
from 200 to 3150 Hz [dB]
mela 23 20 mela100 25 NA mela200 29 NA melaDamp 24 NA fiber 28 26 fiber100 28 NA fiber200 28 NA fiberDamp 28 NA NA: Not available

149
Average and overall ABIL values were obtained for carbon composite sound packages as
listed in Table 5-12. Accordingly, the equivalent mass layer produced 4 dB measured and 5
dB numerical improvement over CLD in terms of the average of ABIL. The overall ABIL
improvement was 3 dB A measured and 5 dB A numerical.
Table 5-12: Mass corrected average and overall ABIL for carbon composite panel sound packages
Sound package
Average of measured ABIL at 1k, 2k, 4k Hz
1/1 octave
Average of numerical ABIL at 1k, 2k, 4k Hz
1/1 octave
Overall measured ABIL
from 200 to 6300 Hz [dB A]
Overall numerical ABIL
from 200 to 6300 Hz [dB A]
CLD+B+FB+TC 16 18 13 17 B+FB+mass+TC 20 23 16 22
The correlation of the measured and numerical ABIL and SBIL results revealed that the Nova
software is a valuable tool for numerical predictions. For porous only material configurations,
the Nova results almost exactly correlated with measured results. The discrepancies were
largely linked to the problems with experimental installation and setup and difficulty to
estimate the real damping of the systems once installed.
SBIL and ABIL were distinguished by the corresponding method of excitation; SBIL was
obtained using mechanical and ABIL using diffuse acoustic field excitations. In general,
ABIL and SBIL values match each other closely within 1 to 2 dB difference in terms of
average in SIL range and overall values. Double wall effect and double wall resonance are
seen in both ABIL and SBIL results with similar patterns.
The effect of mass layer in terms of generating double wall effect and resonance was the same
in both fiberglass and melamine sound package configurations. However, acoustically, 0.6 pcf
fiberglass material used in this study consistently out-performed melamine foam. The
performance of sound packages were compared both experimentally and numerically in single
wall layer configuration using either Aluminum panel or carbon composite panel as the
representative fuselage skin structure.
The carbon composite panel results in section 5.2, confirmed that the mass patches the size of
frame bays are effective and clearly out-perform viscoelastic material damping in terms of

Viscoelastic material damping versus equivalent mass
150
average ABIL/SBIL in SIL range and overall ABIL/SBIL. The mass patches the size of
stringer bays are further studied in the next chapter especially to see how they perform
connected to each other and at reduced sizes.
151
Chapter 6 Parametric study
In Chapter 5, mass layer within fiberglass and melamine sound packages was confirmed to
perform better than viscoelastic material damping in terms of overall ABIL/SBIL (airborne
insertion loss / structure borne insertion loss) in the frequency range of 200 to 6300 Hz and
average ABIL/SBIL in SIL frequencies. In this chapter, the objective is to present the results
of parametric studies which are used to determine the effect of location, density and size of the
mass layer. Nova v2010 software FTMM (finite transfer matrix method) [53] was used to
perform the numerical parametric studies. The numerically obtained vibroacoustic
performance indicators of ABIL, SBIL and TBLIL (turbulent boundary layer excitation
insertion loss) were used in the parametric study. Tests were also performed to validate the
ABIL and SBIL numerical findings. ABIL and SBIL were calculated using the wave based
approach in Nova while modal approach was used for TBLIL calculations. The description of
the wave based and modal approaches can be found in [58]. The calculation of the ABIL,
SBIL and TBLIL were described in section 3.1 “Vibroacoustic performance indicators”.
A 1 m by 1.5 m flat Al ribbed panel was modeled as the baseline for the insertion loss
calculations. Nova calculations were performed in the frequency range of 100 to 6300 Hz.
The numerical parametric study was performed for mass layer location, density and size in
SWL (single wall layer) and DWL (double wall layer) configurations. Since SWL
configuration was strictly used in earlier chapters because a trim panel was not available for
testing; a parametric study involving SWL configuration is also investigated in this chapter.
ABIL and SBIL tests were performed to validate the results of the parametric study in SWL
and DWL configurations. The sound package materials and Aluminum ribbed panel outlined
in Chapter 5 were used in the parametric study. The sound packages included either 0.6 pcf
fiberglass or melamine foam in addition to the isodamp C-1002 mass layer. In numerical
DWL configuration calculations, a trim panel (a sandwich structure with fiberglass epoxy skin
and honeycomb core) was used, the properties of which are listed in Table 6-1 and Table 6-2.
The material properties for honeycomb are normally orthotropic; however, the modeled trim

Parametric study
152
panel is representative and was made up based on typical trim panel material properties.
Hence, isotropic properties were used for honeycomb. For experimental DWL configuration,
a plain flat Al panel (1 m by 1.5 m) was used as the second layer.
Table 6-1: Material properties of skin structure of trim panel Fiberglass epoxy Young Modulus E1 [GPa]: 56 Young Modulus E2 [GPa]: 13 Young Modulus E3 [GPa]: 13 Shear Modulus G12 [GPa]: 4.2 Shear Modulus G13 [GPa]: 4.2 Shear Modulus G23 [GPa]: 4.2 Poisson ν12: 0.26 Poisson ν13: 0 Poisson ν23: 0.06 Density [kg/m³]: 1900 Damping coefficient: 0.15 Thickness [mm]: 0.2
Table 6-2: Material properties of core structure of trim panel Honeycomb Young Modulus [Pa]: 3e7 Shear Modulus [Pa]: 1.25e7 Poisson’s ratio: 0.2 Density [kg/m³]: 48 Damping coefficient: 0.01 Total thickness [mm]: 9.5
The parametric study results for each parameter of location, size and density are discussed in
separate subsections and a fourth subsection is used for experimental results. The presentation
of the results in each subsection is organized such that first the sound package configurations
are listed; and then ABIL, SBIL and TBLIL charts are displayed and discussed with a
parameter comparison based on the overall (in the frequency range of 100 to 6300 Hz) and the
mean in SIL range (average of results at 1k, 2k, 4k 1/1 octave frequency). A collection of
parametric study third octave frequency specific ABIL, SBIL and TBLIL plots are in Annexe
E. Overall ABIL and TBLIL values were computed using Equation 5-4 in units of dBA and
overall SBIL using Equation 5-5 in units of dB.

153
6.1 Mass layer location study
The mass layer location within the thickness of the absorbing material parametric study is
performed using ABIL, SBIL and TBLIL numerical results in SWL and DWL configurations.
Melamine and fiberglass sound packages are used to determine an optimal mass layer location
among the seven locations studied. The locations range from next to the representative
fuselage skin to the surface of the melamine/fiberglass sound package. The performances of
the sound packages are assessed by the overall ABIL, SBIL and TBLIL in the frequency range
of 100 to 6300 Hz and by the mean ABIL, SBIL and TBLIL at SIL frequencies (octave 1k, 2k
and 4k Hz). All results are numerical and no mass correction was performed since the mass
layer surface weight is the same for all configurations.
The mass layer location parametric study fiberglass and melamine sound packages are listed in
Table 6-3. A 0.06” thick isodamp mass layer was placed at seven different locations from the
Al ribbed panel in each of 3” 0.6 pcf fiberglass and 3” melamine foam sound packages. The
locations were set at 0.5” intervals from outboard (representative fuselage skin) to inboard.
Table 6-3: The location parametric study sound packages Sound package ID Sound package configuration from outboard to inboard MelaL000 0.06” thick isodamp (next to fuselage skin) + 3” Melamine foam MelaL050 0.5” Melamine foam + 0.06” thick isodamp + 2.5” Melamine foam MelaL100 1” Melamine foam + 0.06” thick isodamp + 2” Melamine foam MelaL150 1.5” Melamine foam + 0.06” thick isodamp + 1.5” Melamine foam MelaL200 2” Melamine foam + 0.06” thick isodamp + 1.5” Melamine foam MelaL250 2.5” Melamine foam + 0.06” thick isodamp + 0.5” Melamine foam MelaL300 3” Melamine foam + 0.06” thick isodamp FiberL000 0.06” thick isodamp (next to fuselage skin) + 3x1” 0.6pcf FG FiberL050 0.5” 0.6pcf FG + 0.06” thick isodamp + (2x1+0.5)” 0.6pcf FG FiberL100 1” 0.6pcf FG + 0.06” thick isodamp + 2x1” 0.6pcf FG FiberL150 (1+0.5)” 0.6pcf FG + 0.06” thick isodamp + (1+0.5)” 0.6pcf FG FiberL200 2x1” 0.6pcf FG + 0.06” thick isodamp + 1” 0.6pcf FG FiberL250 (2x1+0.5)” 0.6pcf FG + 0.06” thick isodamp + 0.5” 0.6pcf FG FiberL300 3x1” 0.6pcf FG + 0.06” thick isodamp
The numerical ABIL, SBIL and TBLIL results obtained using melamine sound packages are
presented and mainly discussed; the results obtained using fiberglass sound packages are

Parametric study
154
presented in Annexe F. In Figure 6-1, ABIL results for melamine sound packages in SWL and
DWL configurations are shown. Location ABIL plots can be found in Annexe E.1 on page
215 which show that the double wall effect exists if the mass layer is at some distance from
the panel and the double wall resonance frequency is directly depended on the distance
between the panel and mass layer. In DWL configuration, the response of the sound package
with mass layer becomes more complex; however, similar to double wall effect, a multiple
wall effect exists. Both SWL and DWL results are logical and expected for diffuse acoustic
field excitation. DWL resonance decreased with an increase of the distance between the two
walls and disappears when the mass is either at the skin or the trim. Placing the mass layer at
trim panel (MelaL300) yields better acoustic performance in terms of higher ABIL values than
placing it at the skin which is also observed in terms of SBIL and TBLIL and for fiberglass
sound packages. This occurrence is the result of the combination of mass layer and trim panel
surface weight approaching the heavier weight of the skin. When the first and second layer
surface weights are equal in a DWL configuration, transmission loss is expected to be optimal
at high frequencies.
In Figure 6-1 (a), overall ABIL and mean ABIL at SIL range for melamine sound packages in
SWL configuration are compared. When the equivalent mass location in melamine foam is
central at 1” to 2.5” from the skin, the mean ABIL in SIL range is uniform within 1 dB of each
other. The equivalent mass at the locations of 0.5” and 3” from the skin however yields 1 dB
less mean ABIL in SIL range. In terms of overall ABIL, the best performance is observed
when the equivalent mass is placed 0.5” from the skin within melamine foam. The equivalent
mass at the skin yields the worst performance both in terms of overall ABIL and mean ABIL
in SIL range, which is due to the loss of the double wall effect. In DWL configuration in
Figure 6-1 (b), positioning the equivalent mass centrally at 1” to 2” from the skin yields the
greatest mean ABIL in SIL range at around 61 dB. Placing the equivalent mass at 0.5” from
either the skin or the trim panel however reduces the mean ABIL in SIL range by 2 dB to
around 59 dB. In contrast, overall ABIL values are greatest when the mass layer is positioned
0.5” from either the skin or the trim panel for DWL configuration. The mass layer generates a
multiple wall effect in DWL configuration.

155
20 30 40 50 60 70 80
MelaL000
MelaL050
MelaL100
MelaL150
MelaL200
MelaL250
MelaL300
[dB/dBA]
Soun
d pa
ckag
eEffect of location of mass layer in 3" melamine - ABIL SWL
Overall ABIL in range 100 to 6300 Hz [dB A]
Mean ABIL in SIL range [dB]
(a) SWL overall and mean ABIL
20 30 40 50 60 70 80
MelaL000
MelaL050
MelaL100
MelaL150
MelaL200
MelaL250
MelaL300
[dB/dB A]
Soun
d pa
ckag
e
Effect of location of mass layer in 3" melamine - ABIL DWL
Overall ABIL in range 100 to 6300 Hz [dB A]
Mean ABIL in SIL range [dB]
(b) DWL overall and mean ABIL Figure 6-1: Mass layer location study – SWL and DWL configuration ABIL results for
melamine sound packages
SBIL results for melamine sound packages are presented in Figure 6-2. SBIL plots for
melamine sound packages in SWL and DWL configurations are shown in Annexe E.1. The
plots display the double wall effect. The double wall resonance frequency is related to the

Parametric study
156
location of the mass layer from the Al panel. A mass layer as part of sound package within
DWL configuration results in multiple wall effect and improves the acoustic performance in
terms of SBIL.
The overall SBIL and mean SBIL in SIL range displayed in terms of bar charts in Figure 6-2
(a) show acoustic effect of the mass layer location in SWL configuration. Accordingly, the
overall SBIL is highest when the mass layer is 0.5” from the Al panel within 3” melamine
foam (sound package MelaL050). The next highest overall SBIL is obtained for sound
package MelaL150 which is 2 dB less than the one obtained for MelaL050. The mean SBIL
in SIL range is highest at 54 dB for MelaL250 and MelaL300 sound packages. The overall
SBIL and mean SBIL in SIL range in DWL configuration are compared for melamine sound
packages in Figure 6-2 (b). Both MelaL050 and MelaL250 sound packages yield the highest
overall SBIL at 91 dB. MelaL100 and MelaL200 yield overall SBIL of 91 dB while the
overall SBIL for MelaL150 is 90 dB. The mean SBIL in SIL range is however the highest for
MelaL100 and MelaL200 sound packages at 70 dB. The mean SBIL in SIL range for
MelaL050, MelaL150 and MelaL250 are respectively 69 dB, 70 dB and 68 dB.

157
(a) SWL overall and mean SBIL
(b) DWL overall and mean SBIL Figure 6-2: Mass layer location study – SWL and DWL configuration SBIL results for
melamine sound packages
TBLIL results for melamine sound packages are presented in Figure 6-3. Double and multiple
wall effects are again observed for sound packages with mass layer. Similar to SBIL results,
in SWL configuration, the greatest average TBLIL in SIL range is obtained for MelaL300

ρνπ

159
20 30 40 50 60 70 80 90
MelaL000
MelaL050
MelaL100
MelaL150
MelaL200
MelaL250
MelaL300
[dB/dBA]
Soun
d pa
ckag
eEffect of location of mass layer in 3" melamine - TBLIL SWL
Overall TBLIL in range 100 to 6300 Hz [dB A]Mean TBLIL in SIL range [dB]
(a) SWL overall and mean TBLIL
20 30 40 50 60 70 80 90
MelaL000
MelaL050
MelaL100
MelaL150
MelaL200
MelaL250
MelaL300
[dB/dBA]
Soun
d pa
ckag
e
Effect of location of mass layer in 3" melamine - TBLIL DWL
Overall TBLIL in range 100 to 6300 Hz [dB A]Mean TBLIL in SIL range [dB]
(b) DWL overall and mean TBLIL
Figure 6-3: Mass layer location study – SWL and DWL configuration TBLIL results for
melamine sound packages
In Annexe F Figure F-33 to Figure F-35, fiberglass sound package ABIL, SBIL and TBLIL,
respectively, results in SWL and DWL configurations as part of mass location parametric

Parametric study
160
study are shown. The patterns of the ABIL, SBIL and TBLIL results for fiberglass
configurations are generally very similar to the patterns of the results for melamine sound
packages. The main difference between fiberglass and melamine foam which are equivalent
in density is the superior acoustic performance of fiberglass. ABIL, SBIL and TBLIL results
obtaining using fiberglass sound packages are consistently greater than the ones obtained
using melamine foam sound packages.
Damping loss factor (DLF) was assumed constant in both SWL and DWL configurations. Al
panel was assumed to have DLF of 0.007 and trim panel DLF was 0.15. Melamine and
fiberglass ABIL, SBIL and TBLIL results in SWL and DWL configurations yield similar
patterns. Based on the results in SWL configuration, in terms of average ABIL, SBIL and
TBLIL in SIL range, mass layer at 3” from the skin is the optimal. However in terms of
overall ABIL, SBIL and TBLIL in SWL configuration, mass layer 0.5” from the skin yields
the highest values. In DWL configuration, the mass layer centrally located at 1” to 2” from
the skin is ideal for average in SIL range ABIL, SBIL and TBLIL results. The mass layer 0.5”
and 2.5” from the skin are ideal for overall ABIL, SBIL and TBLIL results.
6.2 Mass layer density study
The mass layer density parametric study is based on ABIL, SBIL and TBLIL numerical results
in SWL and DWL configurations. Melamine and fiberglass sound packages are used to
determine the effect of the density of the mass layer. The performances of the sound packages
are assessed by the overall ABIL/SBIL/TBLIL in the frequency range of 100 to 6300 Hz and
mean ABIL/SBIL/TBLIL at SIL frequencies (octave 1k, 2k and 4k Hz).
The mass layer density parametric study fiberglass and melamine sound packages are listed in
Table 6-4. 0.06” thick isodamp was used as the mass layer with the highest density and mass
layer densities 10%, 25%, and 75% of isodamp are placed 2” from the skin within each of 3”
0.6 pcf fiberglass and 3” melamine foam as sound packages. The distance of 2” between mass
layer and representative fuselage skin is chosen based on the results of mean
ABIL/SBIL/TBLIL in SIL range in DWL configuration that were presented in section 6.1
”Mass layer location study”.

161
Melamine and fiberglass sound packages with damping (MelaDamp and FiberDamp) were
used as baseline and their overall and mean in SIL range ABIL, SBIL and TBLIL were
compared to the ones obtained for sound packages with mass layer. All results were mass
normalized and are numerical.
Table 6-4: The mass layer density parametric study sound packages Sound package ID Sound package configuration from outboard to inboard Mela 3” Melamine foam
MelaD010 2” Melamine foam + mass layer (10% surface density of 0.06” thick isodamp) + 1” Melamine foam
MelaD025 2” Melamine foam + mass layer (25% surface density of 0.06” thick isodamp) + 1” Melamine foam
MelaD050 2” Melamine foam + mass layer (50% surface density of 0.06” thick isodamp) + 1” Melamine foam
MelaD075 2” Melamine foam + mass layer (75% surface density of 0.06” thick isodamp) + 1” Melamine foam
MelaD100 2” Melamine foam + mass layer (0.06” thick isodamp) + 1” Melamine foam
MelaDamp (Mela 100% CLD) 100% Smac EX + 3” Melamine foam
Fiber 3x1” 0.6pcf FG
FiberD010 2x1” 0.6pcf FG + mass layer (10% surface density of 0.06” thick isodamp) + 1” 0.6pcf FG
FiberD025 2x1” 0.6pcf FG + mass layer (25% surface density of 0.06” thick isodamp) + 1” 0.6pcf FG
FiberD050 2x1” 0.6pcf FG + mass layer (50% surface density of 0.06” thick isodamp) + 1” 0.6pcf FG
FiberD075 2x1” 0.6pcf FG + mass layer (75% surface density of 0.06” thick isodamp) + 1” 0.6pcf FG
FiberD100 2x1” 0.6pcf FG + mass layer (0.06” thick isodamp) + 1” 0.6pcf FG FiberDamp (Fiber 100% CLD) 100% Smac Ex + 3x1” 0.6pcf FG
In Figure 6-4, mass corrected ABIL results in SWL and DWL configurations are shown for
melamine sound packages. SWL and DWL ABIL plots shown in Annexe E.2 on page 221
reveal that as the density of the mass layer increases, performance of the sound package
improves. Increasing the density increases the effect of mass at frequencies above the double
wall resonance and shifts the double wall resonances to lower frequencies.

Parametric study
162
Overall and mean in SIL range ABIL results for melamine sound packages in SWL
configuration are compared in Figure 6-4 (a). MelaDamp overall and mean in SIL range
ABIL results were used as the baseline. Even MelaD010 with mass layer density that is 10%
of isodamp density performs better than the baseline. Overall and mean in SIL range ABIL
results for melamine sound packages in DWL configuration in Figure 6-4 (b) yield the same
pattern of results as was observed in SWL configuration.
10
20
30
40
50
60
70
Mela MelaD010 MelaD025 MelaD050 MelaD075 MelaD100
[dB
/dB
A]
Sound package
Effect of mass layer density in 3" melamine - ABIL SWL
Mass normalized mean ABIL in SIL range [dB]Mass normalized overall ABIL in range 100 to 6300 Hz [dB A]Baseline for mean ABIL in SIL range [dB]Baseline for overall ABIL [dB A]
(a) SWL overall and mean ABIL
10
20
30
40
50
60
70
Mela MelaD010 MelaD025 MelaD050 MelaD075 MelaD100
[dB
/dB
A]
Sound package
Effect of mass layer density in 3" melamine - ABIL DWL
Mass normalized mean ABIL in SIL range octave [dB]Mass normalized overall ABIL in range 100 to 6300 Hz [dB A]Baseline for mean ABIL in SIL range [dB]Baseline for overall ABIL [dB A]
(b) DWL overall and mean ABIL
Figure 6-4: Mass layer density study – SWL and DWL configuration ABIL plots for melamine
sound packages – all results mass normalized

163
In Figure 6-5, mass corrected SBIL results in SWL and DWL configurations are shown for
melamine sound packages. The pattern of the results in Figure 6-5 is similar the ABIL results
in Figure 6-4. As was the case for ABIL results, SBIL results reveal that as the density of the
mass layer increases, the performance of the sound package improves.
Overall and mean in SIL range SBIL results for melamine sound packages in SWL
configuration are compared in Figure 6-5 (a). MelaDamp overall and mean in SIL range SBIL
results were used as the baseline. As was the case for ABIL results, MelaD010 with mass
layer density that is 10% of isodamp density performs better than the baseline.
(a) SWL overall and mean SBIL
(b) DWL overall and mean SBIL
Figure 6-5: Mass layer density study – SWL and DWL configuration SBIL plots for melamine
sound packages – all results mass normalized

Parametric study
164
In Annexe E.2, mass corrected TBLIL plots in SWL and DWL configurations are shown for
melamine sound packages. In addition to aerodynamic coincidence frequency at third octave
5000 Hz, SWL TBLIL curve for Mela sound packages show a couple of resonance
frequencies which are at third octave 160 and 315 Hz. These resonance frequencies are also
present in SBIL curves but not present in ABIL (hence are linked to resonant transmission).
The fact that the Al panel is lightly damped (0.007) as part of the model, resonant transmission
is observed. The double wall resonance frequency is at third octave 200 Hz for mass layer
located at 2” from the skin which complies with ABIL and SBIL curves. However, the
increase in double wall resonance frequency with reduction of mass layer density that was
observed in ABIL plots was not observed as clearly in SBIL and TBLIL curves. In DWL
configuration, an obviously distinct feature to melamine sound packages was observed. In
Annexe E.2, melamine sound packages with mass layer ABIL/SBIL/TBLIL curves dip at 6300
Hz in DWL configuration. This dip is not present for fiberglass sound packages in DWL
configuration and is therefore linked to resonances in melamine sound package system.
Melamine sound packages with mass layer also display a reduction in rate of increase at 2500
Hz in both SWL and DWL configurations (more pronounced in ABIL and SBIL curves); that
reduction is also linked to resonances in melamine foam. In Figure 6-6 in terms of overall and
average in SIL range TBLIL results, as was observed for ABIL and SBIL results, MelaD010
with mass layer density that is 10% of isodamp density performs better than the baseline
(configuration with 100% viscoelastic material damping).

165
10
20
30
40
50
60
70
80
Mela MelaD010 MelaD025 MelaD050 MelaD075 MelaD100
[dB
/dB
A]
Sound package
Effect of mass layer density in 3" melamine - TBLIL SWL
Mass normalized mean TBLIL in SIL range [dB]Mass normalized overall TBLIL in range 100 to 6300 Hz [dB A]Baseline for mean TBLIL in SIL range [dB]Baseline for overall TBLIL [dB A]
(a) SWL overall and mean TBLIL
10
20
30
40
50
60
70
80
Mela MelaD010 MelaD025 MelaD050 MelaD075 MelaD100
[dB
/dB
A]
Sound package
Effect of mass layer density in 3" melamine - TBLIL DWL
Mass normalized mean TBLIL in SIL range [dB]Mass normalized overall TBLIL in range 100 to 6300 Hz [dB A]Baseline for mean TBLIL in SIL range [dB]Baseline for overall TBLIL [dB A]
(b) DWL overall and mean TBLIL
Figure 6-6: Mass layer density study – SWL and DWL configuration TBLIL plots for
melamine sound packages – all results mass normalized
In Annexe E.2, ABIL, SBIL and TBLIL plots in SWL and DWL configurations for fiberglass
sound packages are shown. In comparison to the melamine sound package results, the main
difference is the absence of the dips at 2500 Hz (in both SWL and DWL configurations) and at
6300 Hz (DWL configuration) which were linked to resonances in melamine foam. Otherwise
the observations in ABIL, SBIL and TBLIL curves are the same as the ones for melamine

Parametric study
166
foam sound packages with the same double wall resonance frequencies and aerodynamic
coincidence frequency. In DWL configuration, fiberglass ABIL and SBIL curves more clearly
(in comparison to melamine sound packages) display two double wall resonance frequencies
accounting for the triple wall effect. The second double wall resonance frequency in DWL
configuration is less pronounced in TBLIL curves. In Annexe F Figure F-36 to Figure F-38,
in terms of overall and average in SIL range ABIL, SBIL and TBLIL, the results are in the
same pattern as was the case for melamine sound packages such that at 10% equivalent mass
layer density, FiberD010 sound package performs better than the configuration with damping.
In conclusion, in terms ABIL/SBIL/TBLIL results, the higher the density of the limp mass
layer the better is the acoustic performance. The limp mass layer in consideration was
isodamp with 1260 kg/m3 density and 0.06” thickness. Density parametric study was
performed using limp mass layer in density range of 10% to 100% of isodamp with 0.06”
thickness. Both for melamine and fiberglass sound packages (each of which has density of
about 9 kg/m3), even at 10% density level, limp mass layer acoustically performs better than
the baseline configuration with damping.
6.3 Mass layer size study
The numerical method (TMM) used to formulate the effect of mass layer size/coverage is in
fact not quite valid especially for melamine sound packages since it does not take the effect of
the mass layer geometry into consideration. A parametric study is still performed using
melamine and fiberglass sound packages and the results are displayed in Annexe E.3 and
Annexe F. In the study, the size of the mass layer is determined based on the coverage of the
panel surface area. A total of 5 different mass layer sizes ranging from 50% to 100% (full)
panel surface area coverage are considered. The mass layer size parametric study fiberglass
and melamine sound packages are listed in Table 6-5.

167
Table 6-5: The mass layer size parametric study sound packages Sound package ID Sound package configuration from outboard to inboard Mela 3” Melamine foam – baseline
MelaS100 2” Melamine foam + full panel surface area coverage 0.06” thick isodamp + 1” Melamine foam
MelaS090 2” Melamine foam + 90% panel surface area coverage 0.06” thick isodamp + 1” Melamine foam
MelaS080 2” Melamine foam + 80% panel surface area coverage 0.06” thick isodamp + 1” Melamine foam
MelaS070 2” Melamine foam + 70% panel surface area coverage 0.06” thick isodamp + 1” Melamine foam
MelaS050 2” Melamine foam + 50% panel surface area coverage 0.06” thick isodamp + 1” Melamine foam
Mela 100%CLD 100% Smac EX + 3” Melamine foam Fiber 3x1” 0.6pcf FG – baseline
FiberS100 2x1” 0.6pcf FG + full panel surface area coverage 0.06” thick isodamp + 1” 0.6pcf FG
FiberS090 2x1” 0.6pcf FG + 90% panel surface area coverage 0.06” thick isodamp + 1” 0.6pcf FG
FiberS080 2x1” 0.6pcf FG + 80% panel surface area coverage 0.06” thick isodamp + 1” 0.6pcf FG
FiberS070 2x1” 0.6pcf FG + 70% panel surface area coverage 0.06” thick isodamp + 1” 0.6pcf FG
FiberS050 2x1” 0.6pcf FG + 50% panel surface area coverage 0.06” thick isodamp + 1” 0.6pcf FG
Fiber 100%CLD 100% Smac Ex + 3x1” 0.6pcf FG
The acoustic effect of the mass layer size is determined using ABIL/SBIL/TBLIL numerical
results in SWL and DWL configurations for melamine and fiberglass sound packages. The
performances of the sound packages with varying sizes of mass layer are assessed numerically
by the overall ABIL/SBIL/TBLIL in the frequency range of 100 to 6300 Hz and by mean
ABIL/SBIL/TBLIL at SIL frequencies (octave 1k, 2k and 4k Hz). The main target is to
determine minimum percentage mass layer coverage (in sound package) that can generate
equivalent acoustic performance to performance of sound packages with damping. All results
are numerical and mass normalized.
The ABIL/SBIL/TBLIL plots both in SWL and DWL configurations in Annexe E.3 on page
227 display the significance of having the mass layer fully cover the panel surface. Without
full coverage, even at 90% panel surface area coverage, double wall effect of the mass layer is

Parametric study
168
considerably compromised. Moreover, double wall resonance effect remains strong even for
the mass layer with the size of 50% panel surface area. The method of calculation of the
transmission loss (TMM was used) is the main rationale behind these observations. Partial
mass layer coverage acoustic performance was calculated as a proportional summation of
transmission coefficients obtained for sound package with full mass layer coverage and with
no mass layer coverage. The significance of the mass layer geometry was not taken into
consideration in the calculations. Idrisi et al. [43-45] has shown that the geometry of the mass
inclusions in melamine foam has a direct effect on the performance of the sound package.
They introduced concepts such as “foot print”, “effective area” and “mass interaction
distance” that relate to the effect of the geometry of the mass layer in altering the stiffness of
the sound package. The significance of the geometry of the mass layer has also emerged in
the acoustic performance comparison of viscoelastic material damping to equivalent mass in
Chapter 5. An ideal double wall was difficult to construct using stringer bay size mass layers
which were not always installed properly (especially when mass layers were bagged along
with fiberglass bricks). Hence, the numerical results for sound packages with mass layers
were simply good at predicting the pattern of the measured results.
In Chapter 5, for fiberglass sound packages with mass layer both ABIL and SBIL results
gradually reduced to the level of ABIL and SBIL for fiberglass sound package without mass
layer at frequencies greater than 2500 Hz. This occurrence was tied to leaks in insulation
system due to mass patches not fully covering the panel surface. The same pattern is not
observed in Annexe E.3, for numerical ABIL and SBIL results, respectively. The fact that the
geometry of mass patches was not accurately modeled is believed to be the cause of the
discrepancy.
An accurate analysis of the size of the mass layer could not be performed since the geometry
could only be incorporated as a proportional summation in the numerical method as explained
earlier in this section. Hence, the mass layer size analysis is incomplete. However, based on
the incomplete numerical findings, one can conclude that the acoustic effect of the size of
mass layer is similar for both melamine and fiberglass sound packages. In order to produce
overall ABIL/SBIL/TBIL and mean ABIL/SBIL/TBLIL in SIL range results that are
equivalent to the baselines, the mass layer size needs to be at least 70% of the panel surface
169
area both for melamine and fiberglass sound packages, see Annexe F Figure F-39 to Figure
F-44 for the results. The baselines are numerical ABIL results calculated using
Mela+100%CLD (for melamine sound packages) and Fiber+100%CLD (for fiberglass sound
packages). The measured ABIL results for sound packages with damping closely correlate to
their equivalent numerical estimates (see Chapter 5).
6.4 Experimental results and final remarks
The mass layer location, density and size acoustic parametric studies performed in earlier
sections in this chapter using melamine and fiberglass sound packages reveal that mass layer
can be optimized to perform better than viscoelastic material damping. The vibroacoustic
performance indicators considered were overall ABIL, SBIL and TBLIL in the frequency
range of 100 to 6300 Hz and mean ABIL, SBIL and TBLIL in SIL frequency range (octave
1k, 2k and 4k Hz). In consideration of location in SWL configuration (without a trim panel),
the mass layer positioned the closest to the skin within sound package (in 3” thick sound
package, mass layer positioned at 0.5” intervals from skin were considered, 0.5” location was
the closest position) was found optimal in terms of overall ABIL/SBIL/TBLIL results, and the
mass layer positioned at the surface of the sound package away from the skin was found
optimal in terms of mean ABIL/SBIL/TBLIL in SIL range. In DWL configuration, mass layer
located closer to either to trim or skin yielded optimal overall ABIL/SBIL/TBLIL and located
centrally in sound package generated optimal mean ABIL/SBIL/TBLIL in SIL range. In
consideration of density, higher the density the better was the performance. And in
consideration of size, full coverage of the panel surface yields the best performance.
An experimental study involving ABIL and SBIL measurements in SWL and DWL
configurations using fiberglass sound packages was performed to validate the numerical
findings. A plain Al panel (1 m by 1.5 m) was used as a second wall to construct the DWL
configuration. Both ABIL and SBIL measurements were taken in double wall configuration;
however, SBIL results were only valid up to the third octave frequency of 2000 Hz. Insulation
including skin, sound package and trim panel could not be excited at frequencies above 2000
Hz using a point force excitation. Since up to 2000 Hz is insufficient for comparison of

Parametric study
170
viscoelastic material damping to equivalent mass, DWL SBIL results were not used as part of
the parametric study.
The experimental setup is identical to the one described in Chapter 5 “Viscoelastic material
damping versus equivalent mass layer”. The sound package configurations tested are listed in
Table 6-6. The fiberglass blanket system described in Chapter 5 was used. The pictures of the
mass layers for FiberS50, FiberS75, FiberS90unconn and FiberS100 sound packages are in
Figure 6-7. Although the mass layer for FiberS100 (which was used as the mass layer in
measurements described in Chapter 5) is said to cover 100% panel surface area, it in fact does
not cover frames and has gaps at stringers (see Figure 6-7 (d)). The frame surface area alone
makes up about 12% of the panel surface area. The numerical analysis in Chapter 5 was done
assuming the mass layer coverage as 90% of the panel surface area.
Table 6-6: Sound package configurations tested as part of parametric study
Sound package ID
Configuration (B: brick, FB: frame blanket, TC: top cover, CLD: Al constraining layer damping)
% ribbed Al panel weight
bareSW Ribbed Al panel
bareDW Ribbed Al panel + 1 mm thick flat Al panel with a cavity depth of 4”
Fiber B(2x1” 0.6pcf FG) + FB(0.5” 0.6pcf FG) + TC(0.5” 0.6pcf FG) 23%
FiberS50 B(2x1” 0.6pcf FG) + 50% panel surface area coverage 0.06” thick isodamp + FB(0.5” 0.6pcf FG) + TC(0.5” 0.6pcf FG) 46%
FiberS75 B(2x1” 0.6pcf FG) + 75% panel surface area coverage 0.06” thick isodamp + FB(0.5” 0.6pcf FG) + TC(0.5” 0.6pcf FG) 57%
FiberS90 B(2x1” 0.6pcf FG) + 90% panel surface area coverage 0.03” thick isodamp + FB(0.5” 0.6pcf FG) + TC(0.5” 0.6pcf FG) 44%
FiberS100 B(2x1” 0.6pcf FG) + 100% panel surface area coverage 0.06” thick isodamp + FB(0.5” 0.6pcf FG) + TC(0.5” 0.6pcf FG) 68%
FiberDampADC 50% ADC124 + 3” 0.6pcf FG 43% FiberDamp 50% smac EX + 3” 0.6pcf FG 66%

171
(a) (b)
(c) (d)
Figure 6-7: Mass layer for sound packages (a) FiberS50; (b) FiberS75; (c) FiberS90unconn;
and (d) FiberS100
ABIL was measured for sound packages Fiber, FiberS50, FiberS75, and FiberS90 and
compared to the ABIL measured for FiberDamp (from Chapter 5). Two ABIL measurements
were collected using FiberS90 sound package. Initially, the mass layer for FiberS90 was
connected just like the mass layers for FiberS50 and FiberS75 shown in Figure 6-7 (a) and (b),
respectively. However the patches were cut apart using scissors and installed in bags as
shown in Figure 6-7 (c). The overall ABIL for FiberS90conn (mass layer connected just like
the mass layer for FiberS75) was calculated to be 31 dB A and for FiberS90unconn (mass
layer not connected) 30 dB A, and the mean ABIL in SIL range for FiberS90conn is 27 dB
and for FiberS90unconn 26 dB.
In Figure 6-8, three different mass sizes are compared acoustically using measured ABIL
results. All of the results are mass normalized. FiberDamp sound package was used as the
Parametric study
172
baseline sound package to obtain the baseline overall ABIL and mean ABIL in SIL range (see
Figure 6-8 (b)). Mass layer size with 90% panel surface coverage performs the best according
to Figure 6-8 (b) even though the surface density of the mass layer for FiberS90 is half of the
other sound packages with mass layer (FiberS50, FiberS75, and FiberS100). Good
performance of FiberS90 is consistent with numerical results such that in section 6.2 “Mass
layer density study”, reducing the mass layer density by 25% or 50% was shown to have a
minor impact on ABIL results. And in section 6.3 “Mass layer size study”, maximum mass
layer coverage was shown to be crucial for better acoustic performance. The measured results
are generally again consistent with numerical results in SWL; FiberS50 performs equivalent to
the baseline sound package (FiberDamp) in terms of ABIL experimentally in Figure 6-8 as
was observed numerically in Figure F-42 for FiberS050 and FiberS75 is superior to the
baseline both in terms of overall and mean ABIL as was the case numerically for FiberS070.
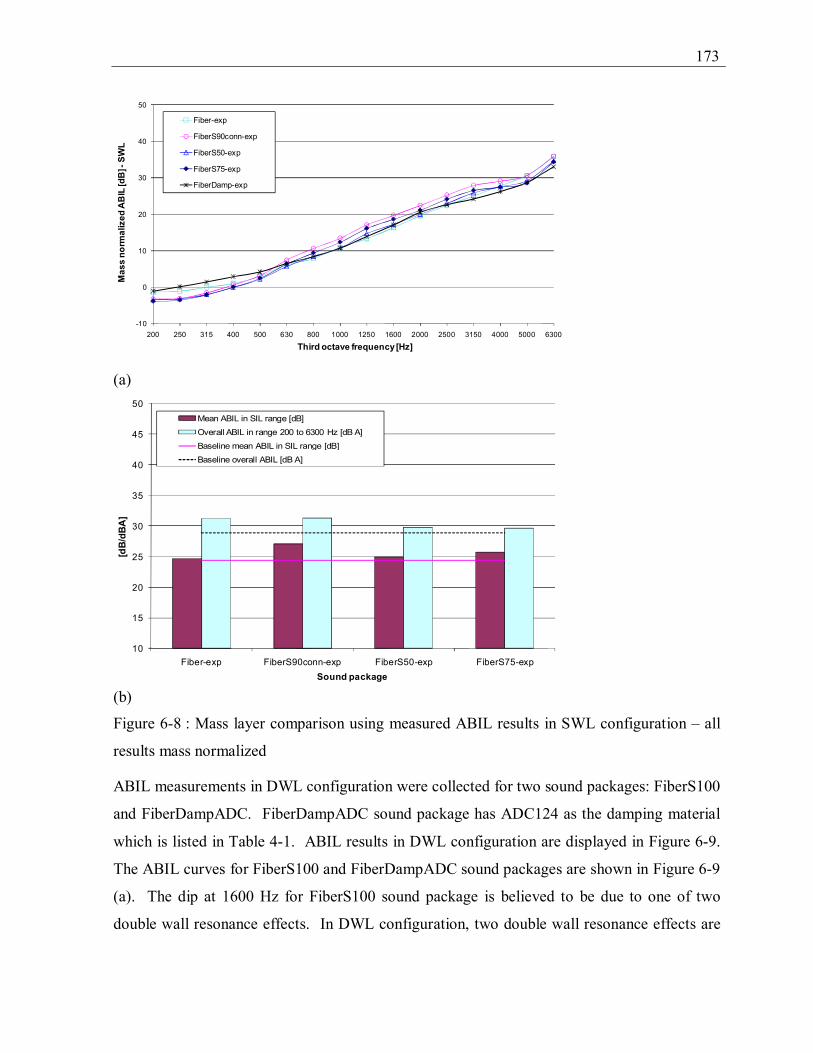
173
-10
0
10
20
30
40
50
200 250 315 400 500 630 800 1000 1250 1600 2000 2500 3150 4000 5000 6300
Mas
s no
rmal
ized
AB
IL [d
B] -
SWL
Third octave frequency [Hz]
Fiber-exp
FiberS90conn-exp
FiberS50-exp
FiberS75-exp
FiberDamp-exp
(a)
10
15
20
25
30
35
40
45
50
Fiber-exp FiberS90conn-exp FiberS50-exp FiberS75-exp
[dB
/dB
A]
Sound package
Mean ABIL in SIL range [dB]Overall ABIL in range 200 to 6300 Hz [dB A]Baseline mean ABIL in SIL range [dB]Baseline overall ABIL [dB A]
(b)
Figure 6-8 : Mass layer comparison using measured ABIL results in SWL configuration – all
results mass normalized
ABIL measurements in DWL configuration were collected for two sound packages: FiberS100
and FiberDampADC. FiberDampADC sound package has ADC124 as the damping material
which is listed in Table 4-1. ABIL results in DWL configuration are displayed in Figure 6-9.
The ABIL curves for FiberS100 and FiberDampADC sound packages are shown in Figure 6-9
(a). The dip at 1600 Hz for FiberS100 sound package is believed to be due to one of two
double wall resonance effects. In DWL configuration, two double wall resonance effects are

Parametric study
174
expected. The baseline overall ABIL and baseline mean ABIL in SIL range in Figure 6-9 (b)
were obtained using FiberDampADC. As was observed in numerical results, sound package
with mass layer performs better than the sound package with damping in terms of overall
ABIL and mean ABIL in SIL range.
-10
0
10
20
30
40
50
200 250 315 400 500 630 800 1000 1250 1600 2000 2500 3150 4000 5000 6300
Mas
s no
rmal
ized
AB
IL [d
B] -
DW
L
Third octave frequency [Hz]
FiberS100
FiberDampADC
(a)
10
15
20
25
30
35
40
45
50
FiberS100
[dB
/dB
A]
Sound package
Mean ABIL in SIL range [dB]
Overall ABIL in range 200 to 6300 Hz [dB A]
Baseline mean ABIL in SIL range [dB]
Baseline overall ABIL [dB A]
(b)
Figure 6-9: Mass layer comparison using measured ABIL results in DWL configuration – all
results mass normalized

175
In Figure 6-10, SBIL results in SWL configuration are displayed. It was difficult to obtain
valid SBIL measurements at frequencies greater than 3150 Hz (in DWL configuration 2000
Hz was the limit as was mentioned earlier); hence both overall SBIL and mean SBIL in SIL
range results are unreliable.
-10
0
10
20
30
40
50
100 125 160 200 250 315 400 500 630 800 1000 1250 1600 2000 2500 3150
Mas
s no
rmal
ized
SB
IL [d
B] -
SWL
Third octave frequency [Hz]
Fiber-expFiberS50-expFiberS75-expFiberS90unconn-expFiberS100-expFiberDamp-exp
Figure 6-10: SBIL plots in SWL configuration – all results mass normalized
Although the tests performed are not accurate representation of the numerical simulations, the
experimental results generally confirm the results of the parametric study. Experimental
ABIL and SBIL results show that the difference is minimal between 50% or 75% mass layer
coverage as was observed numerically (between 50% and 70%). And the surface density
reduction by 50% does not significantly affect ABIL and SBIL performance both
experimentally and numerically.
The main weakness of the experimental study which compromised the acoustic performance
of the mass layer in comparison to CLD was the selection mass layer in stringer bay sizes.
Frame bay size (covering 80% in the case of composite panel) or one size (again covering
80% in the case of flat Aluminum panel) were shown to be much more effective in acoustic
performance (in comparison to CLD) than the stringer bay mass layer sizes in Chapter 5.
Another observation involves mass layers being connected to each other. FiberS90 was tested

Parametric study
176
connected and unconnected; stringer bay size mass layers connected to each other acoustically
perform better than unconnected ones. This better performance is believed to be
predominantly due to the positioning of the mass layers when they are connected.
Unconnected mass layers need to be taped to remain at center of the stringer bays and quite
possibly some patches were not in position. Also the insertion loss improvement is within the
measurement error range of around 1 dB.

177
Chapter 7 Conclusion and perspectives
The primary aim of the research project was to compare the acoustic effect of viscoelastic
material damping to equivalent mass. An extensive experimental and numerical analysis
involving viscoelastic material damping of representative Aluminum (Al) and carbon
composite fuselage skin panels was first performed. A viscoelastic damping material was then
acoustically compared to equivalent mass with the use of Al and carbon composite panels
along with fiberglass and melamine sound packages. And finally a parametric study of
equivalent mass for the effects of mass location, density and size was performed. The
vibroacoustic indicators of airborne insertion loss (ABIL), structural insertion loss (SBIL) and
average quadratic velocity (AQV) were mainly used in the comparison. As part of the
parametric study, turbulent boundary layer excitation insertion loss (TBLIL) was introduced
and used in the analysis. Both SBIL and TBLIL are novel methods of evaluating the validity
of transmission loss results for other (than diffuse acoustic field) type of excitations. SBIL
results were obtained both experimentally and numerically and TBLIL results were only
numerical. TBLIL study was preliminary and requires a much deeper investigation.
Representative fuselage skin structures made up of both Aluminum and carbon composite
were used as part of the research project. Fiberglass and open cell foam porous materials
(typical aircraft insulation materials) were also utilized. The equivalent mass as a layer of
impervious material was part of the insulation system (sound package) that also included
layers of either fiberglass or melamine foam. Viscoelastic damping material was applied to
the representative fuselage skin.
7.1 Conclusions
Following an extensive experimental study, 80% coverage VS1 was determined (among the
tested viscoelastic materials) to be the best performing skin damping material for Al panel
which yields lowest AQV and highest DLF values at temperatures of -30 to -40 C. VS3 was
the only viscoleastic damping material available for the composite skin panel. Although, the

Conclusion and perspectives
178
tested viscoelastic materials are generally optimal in terms of AQV and DLF at low
temperatures, they are still effective dampers at room temperature.
In the comparison of viscoelastic material damping to equivalent mass, the equivalent mass
generates a double wall effect and hence becomes an effective acoustic insulator as part of
sound packages at mid to high frequencies. Even at coincidence frequencies (in case of the
representative carbon composite fuselage skin), the equivalent mass layer is more effective
than viscoelastic damping material. However, the drawback is the occurrence of the double
wall resonance at lower frequencies which compromises the effectiveness.
The type of the porous material (whether foam or fiberglass) did not influence the presence of
the double wall effect. However, the method of installation of the equivalent mass layer
determined the effectiveness of the double wall. Mass patches in the size of stringer bays
installed as mass layer unattached or attached to each other reduced the double wall effect
especially for fiberglass sound package configurations. The mass patch as large as possible in
one piece, for instance a patch covering the most of a frame bay, was found to acoustically
perform superior. The application of mass patch as part of aircraft insulation should be as
such that it covers each frame bay.
The majority of the experimental analysis was performed using single wall layer (SWL)
configuration. Double wall layer (DWL) configuration measurements were performed to
confirm the multiple wall effect. However, as the second panel, instead of a trim panel which
was not readily available, a flat plain Al panel was used in the experiments.
Viscoelastic damping material was as expected found to perform well at the panel modal
resonances which were in the frequency range of 200 to 400 Hz for the ribbed Al panel and
250 to 400 Hz for the ribbed carbon composite panel. The performance of viscoelastic
damping material at double wall resonance frequency was examined. Fuselage skin
viscoelastic material damping was found to have a minor effect at double wall resonance
which occurs when the panel and the mass layer vibrate in synchrony against the porous
material in between. This fact is due to both Al and carbon panels being already highly
damped with the incorporation of frames and stringers and from their installation in the TL
window (edge damping).

179
The parametric study of equivalent mass has revealed valuable facts that can be used in mass
layer optimization. The surface density of the mass layer, for instance, should be further
optimized. A numerical parametric study revealed that equivalent mass (equivalent to the
weight of the viscoelastic damping material) 2” from the skin in 3” melamine or fiberglass
sound package can be reduced to half its surface density with minor effect on its acoustic
performance which was experimentally validated. However, the results are valid for mass
layer with density of 1260 kg/m3 and porous material (fiberglass and melamine have about the
same densities) with density of about 9 kg/m3.
In terms of the size of equivalent mass, full coverage of the panel surface is ideal for superior
acoustic performance. Furthermore, the location of the mass layer within sound package is
optimal in DWL configuration when it is centrally located and is optimal in SWL
configuration when it is on the surface of the sound package away from the skin in terms of
mean ABIL/SBIL/TBLIL in SIL range. In consideration of overall ABIL/SBIL/TBLIL, the
mass layer located closer (but not next to) to either skin or trim panel is ideal.
The main objectives set out for the project were all achieved except for (i) the numerical
validation and parametric study using finite element based methods at low frequencies and (ii)
a comprehensive study involving distributed masses. The concept of distributed masses would
involve scattering point masses within foam sound package. The issues that surfaced
concerning the modeling of the distributed masses and the lack of time resulted in the removal
of that objective from the project. Along with the mass layer, distributed masses were to be
modeled and tested.
If the author were to do this project all over again, he would incorporate trim panel more
extensively in the study.
7.2 Future work
The immediate future work should involve a more comprehensive analysis of equivalent mass
within DWL configuration. Based on a preliminary numerical analysis involving mass layer
in DWL configuration with incorporation of trim panel and trim panel damping has revealed
that equivalent mass is still superior to viscoelastic damping material in terms of overall

Conclusion and perspectives
180
ABIL/SBIL/TBLIL and mean ABIL/SBIL/TBLIL in SIL range. A broad study should be
performed in this area along with an experimental analysis.
Both Al and carbon composite representative fuselage skin panels displayed the double wall
resonance effect with incorporation of mass layer in sound package. Elimination of this
double wall resonance effect is possible and should be a focus for future work. For instance, a
frequency specific insulation such as foam with distributed masses (work of Idrisi et al. [43-
45]) may be used to cancel frequency specific double wall resonance effect. Extensive
modeling is necessary before the effect of distributed masses is experimentally validated. The
use of a finite element based method (e.g. NOVAFEM) will be essential in studying and
designing these patches. Helmholtz resonators [41] can be another alternative. Particle
damping [85] should be considered. And finally, active noise control may also be an option in
elimination of double wall resonance effect.

181
Annexe A
DLF results
A.1 Aluminum ribbed panel DLF results
Figure A-1: DLF values measured at -40 °C on bare and treated Al ribbed panel

Annexe A
182
(a) (b)
(c) (d)
(e) (f)
Figure A-2: Al ribbed panel DLF plots at -40 °C (a) 80% VE1 & 50% VS1, (b) 50% VS1 & 50% VS4, (c) 50% VS4 & 50% VS3, (d) 50% VS3 & 80% VS4, (e) 80% VS4 & 80% VP1, (f) 80% VP1 & 80% VS1

183
Figure A-3: DLF values measured at -30 °C on bare and treated Al ribbed panel

Annexe A
184
(a) (b)
(c) (d)
(e) (f) Figure A-4: Al ribbed panel DLF plots at -30 °C (a) 80% VE1 & 50% VS1, (b) 50% VS1 &
50% VS4, (c) 50% VS4 & 50% VS3, (d) 50% VS3 & 80% VS4, (e) 80% VS4 & 80% VP1, (f)
80% VP1 & 80% VS1

185
Figure A-5: DLF values measured at -20 °C on bare and treated Al ribbed panel

Annexe A
186
Figure A-6: DLF values measured on bare Al ribbed panel at -40 °C, -30 °C, -20 °C, -10 °C, 0
°C, and 25 °C

187
Figure A-7: DLF values measured at temperatures of -40 °C, -30 °C, -20 °C, and -10 °C on Al
ribbed panel treated with 80% VE1

Annexe A
188
Figure A-8: DLF values measured at temperatures of -40 °C, -30 °C, -20 °C, and -10 °C on Al
ribbed panel treated with 80% VS1

189
Figure A-9: DLF values measured at temperatures of -40 °C, -30 °C, -20 °C, and -10 °C on Al
ribbed panel treated with 50% VS3

Annexe A
190
1
10
0 50 100 150 200 250 300
Mass [g]
DLF
[%]
125Hz
50% VS4
50% VS3
80% VE1 80% VP1
50% VS1
80% VS4
80% VS1
(a)
1
10
0 50 100 150 200 250 300
Mass [g]
DLF
[%]
250Hz
50% VS4
50% VS3
80% VE1 80% VP1
50% VS1
80% VS4
80% VS1
(b) Figure A-10: Treated Al ribbed panel DLF values plotted against mass of treatment at -40 °C
and at frequencies (a) 125 Hz and (b) 250 Hz

191
1
10
0 50 100 150 200 250 300
Mass [g]
DLF
[%]
500Hz
50% VS4
50% VS3
80% VE180% VP1
50% VS180% VS4
80% VS1
(a)
1
10
0 50 100 150 200 250 300
Mass [g]
DLF
[%]
1000Hz50% VS4
50% VS3
80% VE1 80% VP1
50% VS1
80% VS4
80% VS1
(b) Figure A-11: Treated Al ribbed panel DLF values plotted against mass of treatment at -40 °C
and at frequencies (a) 500 Hz and (b) 1000 Hz

Annexe A
192
1
10
0 50 100 150 200 250 300
Mass [g]
DLF
[%]
2000Hz50% VS4
50% VS3
80% VE1
80% VP1
50% VS1
80% VS4
80% VS1
Figure A-12: Treated Al ribbed panel DLF values plotted against mass of treatment at -40 °C
and at 2000 Hz

193
(a)
(b)
(c)
Figure A-13: DLF values measured on Al ribbed panel treated with 50% and 80% VS1 at
temperatures (a) -40 °C, (b) -30 °C, and (c) -20 °C

Annexe A
194
Figure A-14: DLF values measured at room temperature on Al ribbed panel treated with 20%,
50%, 80% and 100% VS1

195
Figure A-15: DLF values measured at room temperature on Al ribbed panel treated with 20%,
50%, and 100% VP1

Annexe A
196
A.2 Carbon composite panel DLF results
Figure A-16: DLF values measured at -40 °C on bare and treated carbon composite ribbed
panel

197
Figure A-17: DLF values measured at -30 °C on bare and treated carbon composite ribbed
panel

Annexe A
198
Figure A-18: DLF values measured at -20 °C on bare and treated carbon composite ribbed
panel

199
Figure A-19 DLF values measured at temperatures of -40 °C, -30 °C, -20 °C, and -10 °C on
carbon composite ribbed panel treated with 50% VS3


201
Annexe B
Smactane EX
B.1 Smactane EX shear modulus and loss angle tangent
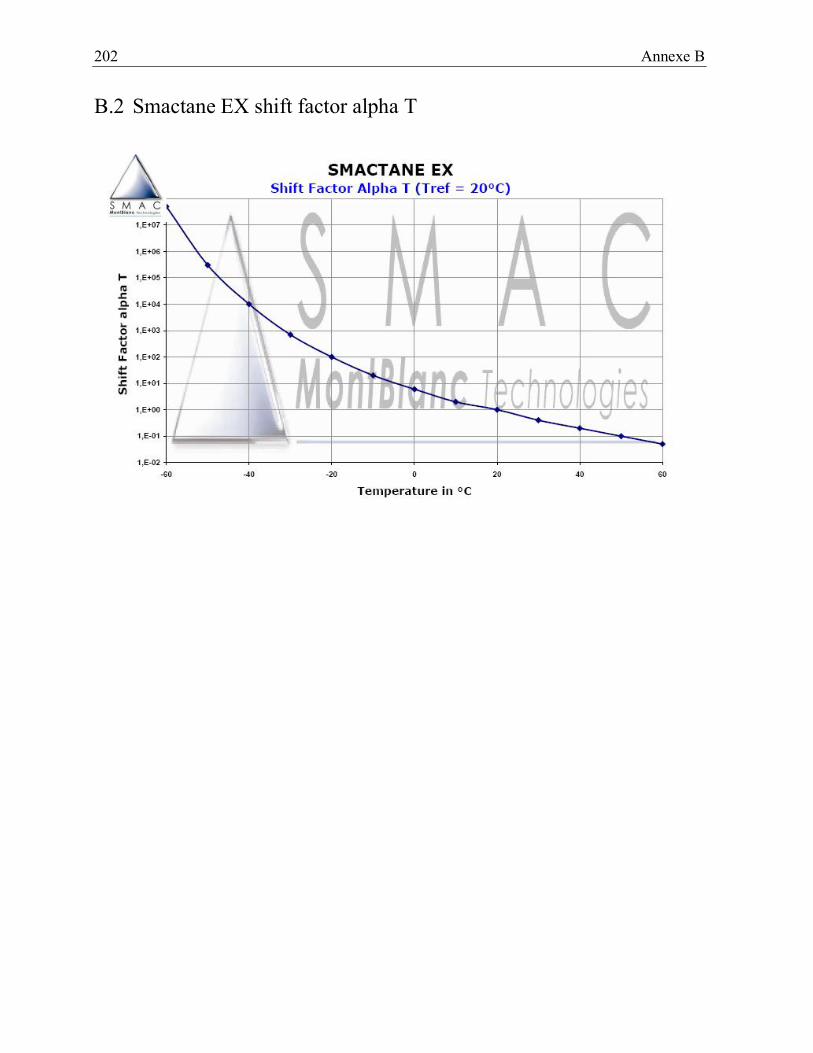
Annexe B
202
B.2 Smactane EX shift factor alpha T

203
Annexe C
Layup of the ribbed carbon composite panel
The carbon composite panel:

Annexe C
204
The skin layup of the carbon composite panel:

205
The frame layup of carbon composite panel:
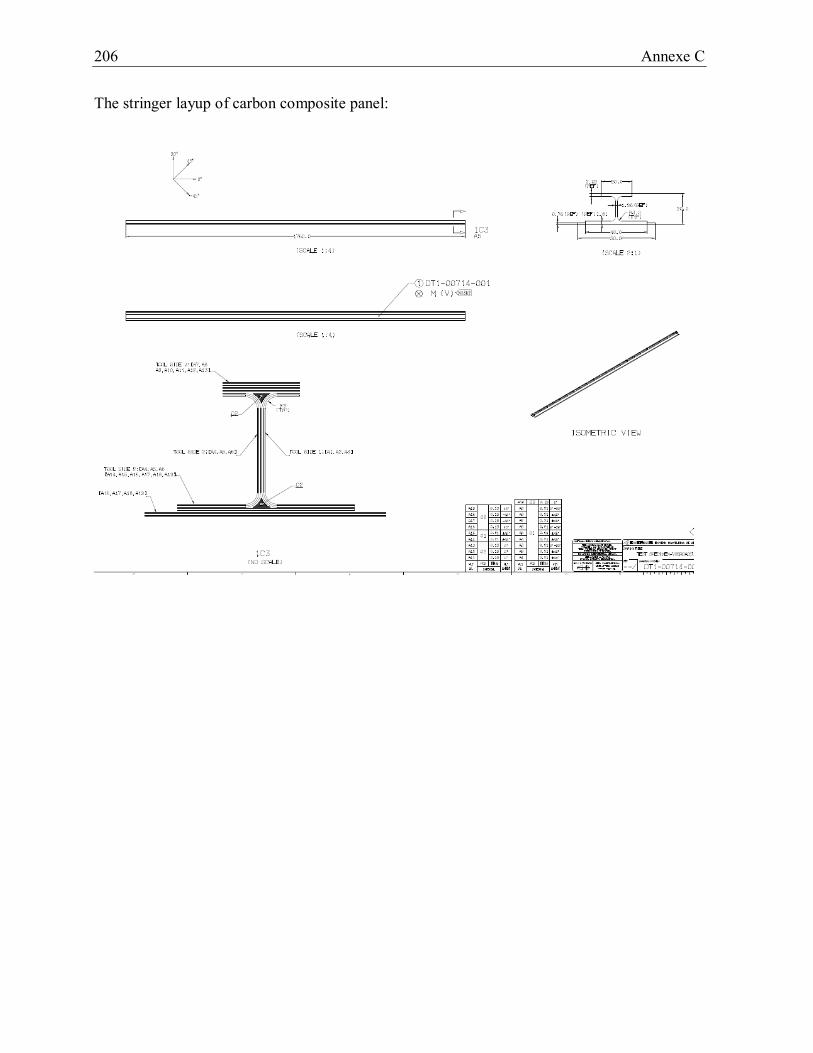
Annexe C
206
The stringer layup of carbon composite panel:
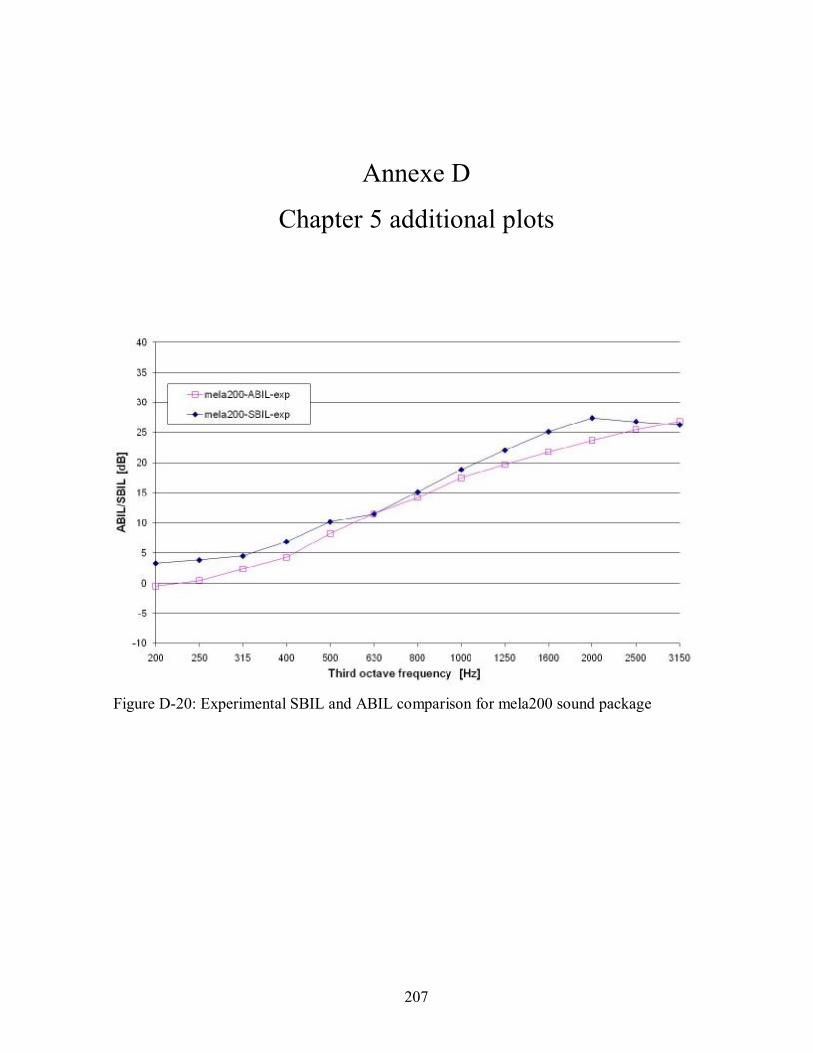
207
Annexe D
Chapter 5 additional plots
Figure D-20: Experimental SBIL and ABIL comparison for mela200 sound package

Annexe D
208
Figure D-21: Experimental and numerical ABIL comparison for mela200 sound package
Figure D-22: Measured ABIL plots for fiberglass sound package configurations

209
Figure D-23: Measured SBIL plots for fiberglass sound package configurations
Figure D-24: Comparison of the measured ABIL and SBIL plots for fiber configuration

Annexe D
210
Figure D-25: Comparison of the measured ABIL and SBIL plots for fiber100 configuration
Figure D-26: Comparison of the measured ABIL and SBIL plots for fiber200 configuration

211
Figure D-27: Comparison of the measured ABIL and SBIL plots for fiberDamp configuration
Figure D-28: Comparison of the measured and numerical ABIL plots for fiber configuration

Annexe D
212
Figure D-29: Comparison of the measured and numerical ABIL plots for fiber100
configuration
Figure D-30: Comparison of the measured and numerical ABIL plots for fiber200
configuration

213
Figure D-31: Comparison of the measured and numerical ABIL plots for fiberDamp
configuration
Figure D-32: Comparison of the measured and numerical SBIL plots for fiber configuration


215
Annexe E
Parametric study ABIL, SBIL and TBLIL plots
E.1 Location
-10
0
10
20
30
40
50
60
70
80
90
100 125 160 200 250 315 400 500 630 800 1000 1250 1600 2000 2500 3150 4000 5000 6300
ABIL
[dB
] -SW
L
Third octave frequency [Hz]
MelaL000
MelaL050
MelaL100
MelaL150
MelaL200
MelaL250
MelaL300
-10
0
10
20
30
40
50
60
70
80
90
100 125 160 200 250 315 400 500 630 800 1000 1250 1600 2000 2500 3150 4000 5000 6300
AB
IL [d
B] -
DW
L
Third octave frequency [Hz]
MelaL000
MelaL050
MelaL100
MelaL150
MelaL200
MelaL250
MelaL300

Annexe E
216
-10
0
10
20
30
40
50
60
70
80
90
100
100 125 160 200 250 315 400 500 630 800 1000 1250 1600 2000 2500 3150 4000 5000 6300
AB
IL [d
B] -
SWL
Third octave frequency [Hz]
FiberL000
FiberL050
FiberL100
FiberL150
FiberL200
FiberL250
FiberL300
-10
0
10
20
30
40
50
60
70
80
90
100
100 125 160 200 250 315 400 500 630 800 1000 1250 1600 2000 2500 3150 4000 5000 6300
AB
IL [d
B] -
DW
L
Third octave frequency [Hz]
FiberL000
FiberL050
FiberL100
FiberL150
FiberL200
FiberL250
FiberL300
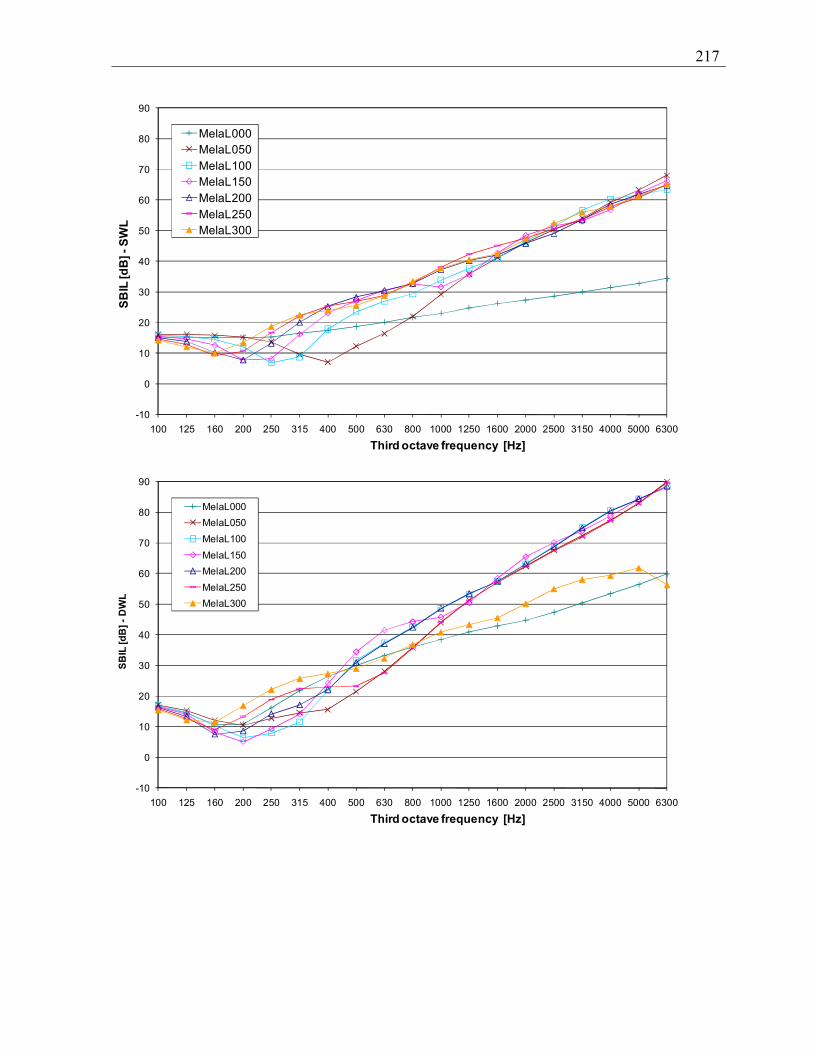
217
-10
0
10
20
30
40
50
60
70
80
90
100 125 160 200 250 315 400 500 630 800 1000 1250 1600 2000 2500 3150 4000 5000 6300
SBIL
[dB
] -SW
L
Third octave frequency [Hz]
MelaL000MelaL050MelaL100MelaL150MelaL200MelaL250MelaL300
-10
0
10
20
30
40
50
60
70
80
90
100 125 160 200 250 315 400 500 630 800 1000 1250 1600 2000 2500 3150 4000 5000 6300
SBIL
[dB
] -D
WL
Third octave frequency [Hz]
MelaL000MelaL050MelaL100MelaL150MelaL200MelaL250MelaL300

Annexe E
218
-10
0
10
20
30
40
50
60
70
80
90
100
110
100 125 160 200 250 315 400 500 630 800 1000 1250 1600 2000 2500 3150 4000 5000 6300
SBIL
[dB
] -SW
L
Third octave frequency [Hz]
FiberL000FiberL050FiberL100FiberL150FiberL200FiberL250FiberL300
-10
0
10
20
30
40
50
60
70
80
90
100
110
100 125 160 200 250 315 400 500 630 800 1000 1250 1600 2000 2500 3150 4000 5000 6300
SBIL
[dB
] -D
WL
Third octave frequency [Hz]
FiberL000FiberL050FiberL100FiberL150FiberL200FiberL250FiberL300

219
0
10
20
30
40
50
60
70
80
90
100 125 160 200 250 315 400 500 630 800 1000 1250 1600 2000 2500 3150 4000 5000 6300
TBLI
L [d
B] -
SW
L
Third octave frequency [Hz]
MelaL000MelaL050MelaL100MelaL150MelaL200MelaL250MelaL300
0
10
20
30
40
50
60
70
80
90
100 125 160 200 250 315 400 500 630 800 1000 1250 1600 2000 2500 3150 4000 5000 6300
TBLI
L [d
B] -
DW
L
Third octave frequency [Hz]
MelaL000MelaL050MelaL100MelaL150MelaL200MelaL250MelaL300

Annexe E
220
-10
0
10
20
30
40
50
60
70
80
90
100
110
100 125 160 200 250 315 400 500 630 800 1000 1250 1600 2000 2500 3150 4000 5000 6300
TBLI
L [d
B] -
SW
L
Third octave frequency [Hz]
FiberL000FiberL050FiberL100FiberL150FiberL200FiberL250FiberL300
-10
0
10
20
30
40
50
60
70
80
90
100
110
100 125 160 200 250 315 400 500 630 800 1000 1250 1600 2000 2500 3150 4000 5000 6300
TBLI
L [d
B] -
DW
L
Third octave frequency [Hz]
FiberL000FiberL050FiberL100FiberL150FiberL200FiberL250FiberL300

221
E.2 Density
-10
0
10
20
30
40
50
60
70
80
100 125 160 200 250 315 400 500 630 800 1000 1250 1600 2000 2500 3150 4000 5000 6300
Mas
s no
rmal
ized
AB
IL [d
B] -
SWL
Third octave frequency [Hz]
Mela MelaD010
MelaD025 MelaD050
MelaD075 MelaD100
-10
0
10
20
30
40
50
60
70
80
100 125 160 200 250 315 400 500 630 800 1000 1250 1600 2000 2500 3150 4000 5000 6300
Mas
s no
rmal
ized
AB
IL [d
B] -
DW
L
Third octave frequency [Hz]
Mela MelaD010
MelaD025 MelaD050
MelaD075 MelaD100

Annexe E
222
-20
-10
0
10
20
30
40
50
60
70
80
90
100 125 160 200 250 315 400 500 630 800 1000 1250 1600 2000 2500 3150 4000 5000 6300
Mas
s no
rmal
ized
AB
IL [d
B] -
SWL
Third octave frequency [Hz]
Fiber FiberD010
FiberD025 FiberD050
FiberD075 FiberD100
-20
-10
0
10
20
30
40
50
60
70
80
90
100 125 160 200 250 315 400 500 630 800 1000 1250 1600 2000 2500 3150 4000 5000 6300
Mas
s no
rmal
ized
AB
IL [d
B] -
DW
L
Third octave frequency [Hz]
Fiber FiberD010
FiberD025 FiberD050
FiberD075 FiberD100

223
0
10
20
30
40
50
60
70
80
100 125 160 200 250 315 400 500 630 800 1000 1250 1600 2000 2500 3150 4000 5000 6300
Mas
s no
rmal
ized
SB
IL [d
B] -
SWL
Third octave frequency [Hz]
Mela MelaD010
MelaD025 MelaD050
MelaD075 MelaD100
0
10
20
30
40
50
60
70
80
100 125 160 200 250 315 400 500 630 800 1000 1250 1600 2000 2500 3150 4000 5000 6300
Mas
s no
rmal
ized
SB
IL [d
B] -
DW
L
Third octave frequency [Hz]
Mela MelaD010
MelaD025 MelaD050
MelaD075 MelaD100

Annexe E
224
-10
0
10
20
30
40
50
60
70
80
90
100
100 125 160 200 250 315 400 500 630 800 1000 1250 1600 2000 2500 3150 4000 5000 6300
Mas
s no
rmal
ized
SB
IL [d
B] -
SWL
Third octave frequency [Hz]
Fiber FiberD010
FiberD025 FiberD050
FiberD075 FiberD100
-10
0
10
20
30
40
50
60
70
80
90
100
100 125 160 200 250 315 400 500 630 800 1000 1250 1600 2000 2500 3150 4000 5000 6300
Mas
s no
rmal
ized
SB
IL [d
B] -
DW
L
Third octave frequency [Hz]
Fiber FiberD010
FiberD025 FiberD050
FiberD075 FiberD100

225
-10
0
10
20
30
40
50
60
70
80
100 125 160 200 250 315 400 500 630 800 1000 1250 1600 2000 2500 3150 4000 5000 6300
Mas
s no
rmal
ized
TBL
IL [d
B] -
SWL
Third octave frequency [Hz]
Mela MelaD010
MelaD025 MelaD050
MelaD075 MelaD100
-10
0
10
20
30
40
50
60
70
80
100 125 160 200 250 315 400 500 630 800 1000 1250 1600 2000 2500 3150 4000 5000 6300
Mas
s no
rmal
ized
TBL
IL [d
B] -
DW
L
Third octave frequency [Hz]
Mela MelaD010
MelaD025 MelaD050
MelaD075 MelaD100

Annexe E
226
-10
0
10
20
30
40
50
60
70
80
90
100
100 125 160 200 250 315 400 500 630 800 1000 1250 1600 2000 2500 3150 4000 5000 6300
Mas
s no
rmal
ized
TBL
IL [d
B] -
SWL
Third octave frequency [Hz]
Fiber FiberD010
FiberD025 FiberD050
FiberD075 FiberD100
-10
0
10
20
30
40
50
60
70
80
90
100
100 125 160 200 250 315 400 500 630 800 1000 1250 1600 2000 2500 3150 4000 5000 6300
Mas
s no
rmal
ized
TBL
IL [d
B] -
DW
L
Third octave frequency [Hz]
Fiber FiberD010
FiberD025 FiberD050
FiberD075 FiberD100
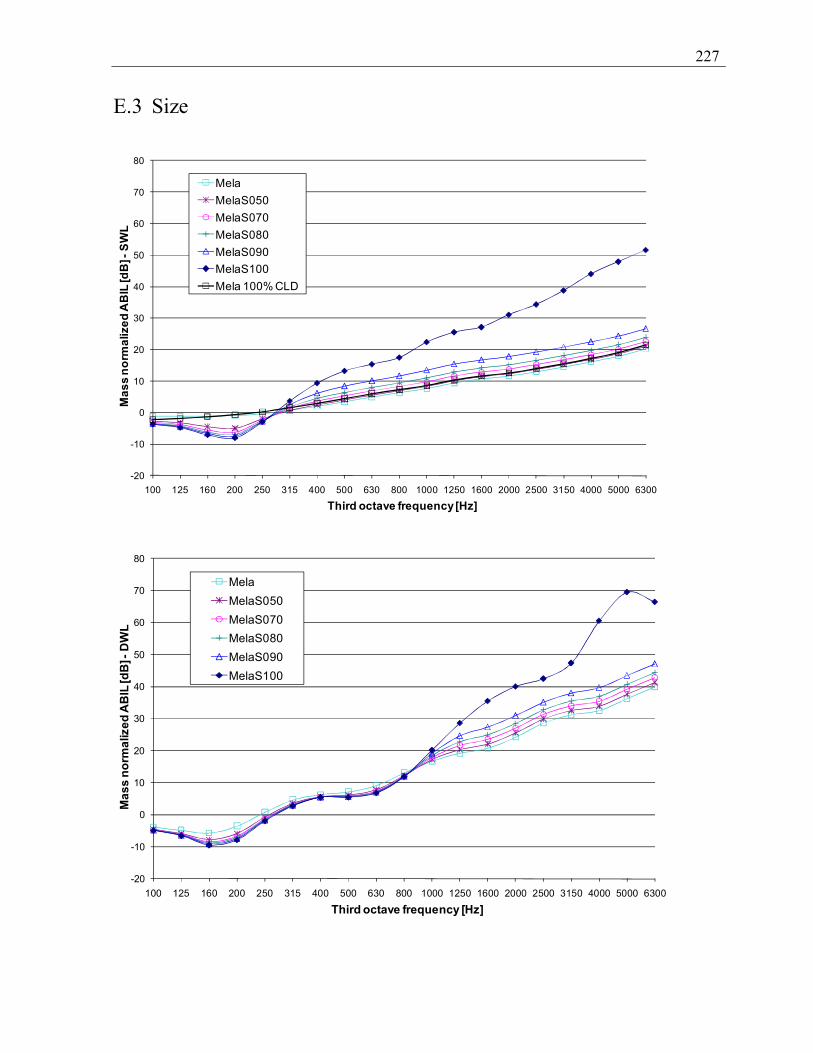
227
E.3 Size
-20
-10
0
10
20
30
40
50
60
70
80
100 125 160 200 250 315 400 500 630 800 1000 1250 1600 2000 2500 3150 4000 5000 6300
Mas
s no
rmal
ized
AB
IL [d
B] -
SWL
Third octave frequency [Hz]
MelaMelaS050MelaS070 MelaS080MelaS090MelaS100Mela 100% CLD
-20
-10
0
10
20
30
40
50
60
70
80
100 125 160 200 250 315 400 500 630 800 1000 1250 1600 2000 2500 3150 4000 5000 6300
Mas
s no
rmal
ized
AB
IL [d
B] -
DW
L
Third octave frequency [Hz]
MelaMelaS050MelaS070 MelaS080MelaS090MelaS100

Annexe E
228
-20
-10
0
10
20
30
40
50
60
70
80
90
100 125 160 200 250 315 400 500 630 800 1000 1250 1600 2000 2500 3150 4000 5000 6300
Mas
s no
rmal
ized
AB
IL [d
B] -
SWL
Third octave frequency [Hz]
FiberFiberS050FiberS070FiberS080FiberS090FiberS100Fiber 100% CLD
-20
-10
0
10
20
30
40
50
60
70
80
90
100 125 160 200 250 315 400 500 630 800 1000 1250 1600 2000 2500 3150 4000 5000 6300
Mas
s no
rmal
ized
AB
IL [d
B] -
DW
L
Third octave frequency [Hz]
Fiber
FiberS050
FiberS070
FiberS080
FiberS090
FiberS100

229
0
10
20
30
40
50
60
70
80
100 125 160 200 250 315 400 500 630 800 1000 1250 1600 2000 2500 3150 4000 5000 6300
Mas
s no
rmal
ized
SB
IL [d
B] -
SWL
Third octave frequency [Hz]
Mela MelaS050
MelaS070 MelaS080
MelaS090 MelaS100
0
10
20
30
40
50
60
70
80
100 125 160 200 250 315 400 500 630 800 1000 1250 1600 2000 2500 3150 4000 5000 6300
Mas
s no
rmal
ized
SB
IL [d
B] -
DW
L
Third octave frequency [Hz]
Mela MelaS050
MelaS070 MelaS080
MelaS090 MelaS100

Annexe E
230
-10
0
10
20
30
40
50
60
70
80
90
100
100 125 160 200 250 315 400 500 630 800 1000 1250 1600 2000 2500 3150 4000 5000 6300
Mas
s no
rmal
ized
SB
IL [d
B] -
SWL
Third octave frequency [Hz]
Fiber FiberS050
FiberS070 FiberS080
FiberS090 FiberS100
-10
0
10
20
30
40
50
60
70
80
90
100
100 125 160 200 250 315 400 500 630 800 1000 1250 1600 2000 2500 3150 4000 5000 6300
Mas
s no
rmal
ized
SB
IL [d
B] -
DW
L
Third octave frequency [Hz]
Fiber FiberS050
FiberS070 FiberS080
FiberS090 FiberS100

231
-10
0
10
20
30
40
50
60
70
80
100 125 160 200 250 315 400 500 630 800 1000 1250 1600 2000 2500 3150 4000 5000 6300
Mas
s no
rmal
ized
TBL
IL [d
B] -
SWL
Third octave frequency [Hz]
Mela MelaS050
MelaS070 MelaS080
MelaS090 MelaS100
-10
0
10
20
30
40
50
60
70
80
100 125 160 200 250 315 400 500 630 800 1000 1250 1600 2000 2500 3150 4000 5000 6300
Mas
s no
rmal
ized
TBL
IL [d
B] -
DW
L
Third octave frequency [Hz]
Mela MelaS050
MelaS070 MelaS080
MelaS090 MelaS100

Annexe E
232
-10
0
10
20
30
40
50
60
70
80
90
100
100 125 160 200 250 315 400 500 630 800 1000 1250 1600 2000 2500 3150 4000 5000 6300
Mas
s no
rmal
ized
TB
LIL
[dB
] -S
WL
Third octave frequency [Hz]
Fiber FiberS050
FiberS070 FiberS080
FiberS090 FiberS100
-10
0
10
20
30
40
50
60
70
80
90
100
100 125 160 200 250 315 400 500 630 800 1000 1250 1600 2000 2500 3150 4000 5000 6300
Mas
s no
rmal
ized
TBL
IL [d
B] -
DW
L
Third octave frequency [Hz]
Fiber FiberS050
FiberS070 FiberS080
FiberS090 FiberS100

233
Annexe F
Parametric study overall ABIL, SBIL and TBLIL results
20 30 40 50 60 70 80 90
FiberL000
FiberL050
FiberL100
FiberL150
FiberL200
FiberL250
FiberL300
[dB/dBA]
Sou
nd p
acka
ge
Effect of location of mass layer in 3" fiberglass - ABIL SWL
Overall ABIL in range 100 to 6300 Hz [dB A]
Mean ABIL in SIL range [dB]
(a) SWL overall and mean ABIL
20 30 40 50 60 70 80 90
FiberL000
FiberL050
FiberL100
FiberL150
FiberL200
FiberL250
FiberL300
[dB/dBA]
Sou
nd p
acka
ge
Effect of location of mass layer in 3" fiberglass - ABIL DWL
Overall ABIL in range 100 to 6300 Hz [dB A]
Mean ABIL in SIL range [dB]
(b) DWL overall and mean ABIL
Figure F-33: Mass layer location study – SWL and DWL configuration ABIL plots for
fiberglass sound packages

Annexe F
234
(a) SWL overall and mean SBIL
(b) DWL overall and mean SBIL Figure F-34: Mass layer location study – SWL and DWL configuration SBIL plots for
fiberglass sound packages
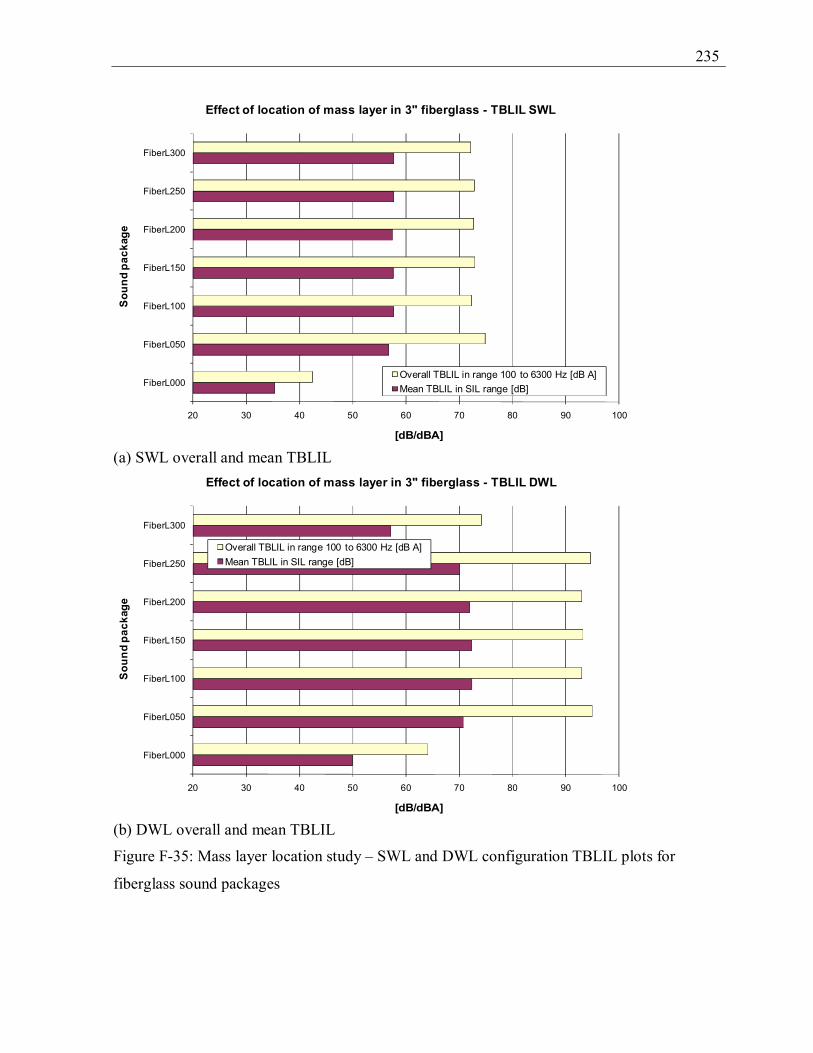
235
20 30 40 50 60 70 80 90 100
FiberL000
FiberL050
FiberL100
FiberL150
FiberL200
FiberL250
FiberL300
[dB/dBA]
Sou
nd p
acka
geEffect of location of mass layer in 3" fiberglass - TBLIL SWL
Overall TBLIL in range 100 to 6300 Hz [dB A]Mean TBLIL in SIL range [dB]
(a) SWL overall and mean TBLIL
20 30 40 50 60 70 80 90 100
FiberL000
FiberL050
FiberL100
FiberL150
FiberL200
FiberL250
FiberL300
[dB/dBA]
Sou
nd p
acka
ge
Effect of location of mass layer in 3" fiberglass - TBLIL DWL
Overall TBLIL in range 100 to 6300 Hz [dB A]Mean TBLIL in SIL range [dB]
(b) DWL overall and mean TBLIL
Figure F-35: Mass layer location study – SWL and DWL configuration TBLIL plots for
fiberglass sound packages

Annexe F
236
10
20
30
40
50
60
70
80
Fiber FiberD010 FiberD025 FiberD050 FiberD075 FiberD100
[dB
/dB
A]
Sound package
Effect of mass layer density in 3" fiber - ABIL SWL
Mass normalized mean ABIL in SIL range [dB]Mass normalized overall ABIL in range 100 to 6300 Hz [dB A]Baseline for mean ABIL in SIL range [dB]Baseline for overall ABIL [dB A]
(a) SWL overall and mean ABIL
10
20
30
40
50
60
70
80
Fiber FiberD010 FiberD025 FiberD050 FiberD075 FiberD100
[dB
/dB
A]
Sound package
Effect of mass layer density in 3" fiber - ABIL DWL
Mass normalized mean ABIL in SIL range octave [dB]Mass normalized overall ABIL in range 100 to 6300 Hz [dB A]Baseline for mean ABIL in SIL range [dB]Baseline for overall ABIL [dB A]
(b) DWL overall and mean ABIL
Figure F-36: Mass layer density study – SWL and DWL configuration ABIL plots for
fiberglass sound packages – all results mass normalized

237
(a) SWL overall and mean SBIL
(b) DWL overall and mean SBIL
Figure F-37: Mass layer density study – SWL and DWL configuration SBIL plots for
fiberglass sound packages – all results mass normalized

Annexe F
238
10
20
30
40
50
60
70
80
90
Fiber FiberD010 FiberD025 FiberD050 FiberD075 FiberD100
[dB
/dB
A]
Sound package
Effect of mass layer density in 3" fiber - TBLIL SWL
Mass normalized mean TBLIL in SIL range [dB]Mass normalized overall TBLIL in range 100 to 6300 Hz [dB A]Baseline for mean TBLIL in SIL range [dB]Baseline for overall TBLIL [dB A]
(a) SWL overall and mean TBLIL
10
20
30
40
50
60
70
80
90
Fiber FiberD010 FiberD025 FiberD050 FiberD075 FiberD100
[dB
/dB
A]
Sound package
Effect of mass layer density in 3" fiber - TBLIL DWL
Mass normalized mean TBLIL in SIL range [dB]Mass normalized overall TBLIL in range 100 to 6300 Hz [dB A]Baseline for mean TBLIL in SIL range [dB]Baseline for overall TBLIL [dB A]
(b) DWL overall and mean TBLIL
Figure F-38 : Mass layer density study – SWL and DWL configuration TBLIL plots for
fiberglass sound packages – all results mass normalized

239
10
20
30
40
50
60
70
Mela MelaS050 MelaS070 MelaS080 MelaS090 MelaS100
[dB
/dB
A]
Sound package
Effect of mass layer coverage in 3" melamine - ABIL SWL
Mass normalized mean ABIL in SIL range [dB]Mass normalized overall ABIL in range 100 to 6300 Hz [dB A]Baseline for mean ABIL in SIL range from mass normalized Mela+100% CLD [dB]Baseline for overall ABIL from mass normalized Mela+100% CLD [dB A]
(a) SWL overall and mean ABIL
10
20
30
40
50
60
70
Mela MelaS050 MelaS070 MelaS080 MelaS090 MelaS100
[dB
/dB
A]
Sound package
Effect of mass layer coverage in 3" melamine - ABIL DWL
Mass normalized mean ABIL in SIL range [dB]Mass normalized overall ABIL in range 100 to 6300 Hz [dB A]Baseline for mean ABIL in SIL range from mass normalized Mela+100%CLD [dB]Baseline for overall ABIL from mass normalized Mela+100%CLD [dB A]
(b) DWL overall and mean ABIL Figure F-39: Mass layer size study – SWL and DWL configuration ABIL plots for melamine
sound packages – all results mass normalized

Annexe F
240
(a) SWL overall and mean SBIL
(b) DWL overall and mean SBIL Figure F-40: Mass layer size study – SWL and DWL configuration SBIL plots for melamine
sound packages – all results mass normalized

241
10
20
30
40
50
60
70
80
Mela MelaS050 MelaS070 MelaS080 MelaS090 MelaS100
[dB
/dB
A]
Sound package
Effect of mass layer coverage in 3" melamine - TBLIL SWL
Mass normalized mean TBLIL in SIL range [dB]Mass normalized overall TBLIL in range 100 to 6300 Hz [dB A]Baseline for mean TBLIL in SIL range [dB]Baseline for overall TBLIL [dB A]
(a) SWL overall and mean TBLIL
10
20
30
40
50
60
70
80
Mela MelaS050 MelaS070 MelaS080 MelaS090 MelaS100
[dB
/dB
A]
Sound package
Effect of mass layer coverage in 3" melamine - TBLIL DWL
Mass normalized mean TBLIL in SIL range [dB]Mass normalized overall TBLIL in range 100 to 6300 Hz [dB A]Baseline for mean TBLIL in SIL range [dB]Baseline for overall TBLIL [dB A]
(b) DWL overall and mean TBLIL Figure F-41: Mass layer size study – SWL and DWL configuration TBLIL plots for melamine
sound packages – all results mass normalized

Annexe F
242
10
20
30
40
50
60
70
80
90
Fiber FiberS050 FiberS070 FiberS080 FiberS090 FiberS100
[dB
/dB
A]
Sound package
Effect of mass layer coverage in 3" fiberglass - ABIL SWL
Mass normalized mean ABIL in SIL range [dB]Mass normalized overall ABIL in range 100 to 6300 Hz [dB A]Baseline for mean ABIL in SIL range from mass normalized Fiber+100% CLD [dB]Baseline for overall ABIL from mass normalized Fiber+100% CLD [dB A]
(a) SWL overall and mean ABIL
10
20
30
40
50
60
70
80
Fiber FiberS050 FiberS070 FiberS080 FiberS090 FiberS100
[dB
/dB
A]
Sound package
Effect of mass layer coverage in 3" fiberglass - ABIL DWL
Mass normalized mean ABIL in SIL range [dB]Mass normalized overall ABIL in range 100 to 6300 Hz [dB A]Baseline for mean ABIL in SIL range from mass normalized Fiber+100%CLD [dB]Baseline for overall ABIL from mass normalized Fiber+100%CLD [dB A]
(b) DWL overall and mean ABIL
Figure F-42: Mass layer size study – SWL and DWL configuration ABIL plots for fiberglass
sound packages – all results mass normalized

243
(a) SWL overall and mean SBIL
(b) DWL overall and mean SBIL Figure F-43: Mass layer size study – SWL and DWL configuration SBIL plots for fiberglass
sound packages – all results mass normalized

Annexe F
244
10
20
30
40
50
60
70
80
90
Fiber FiberS050 FiberS070 FiberS080 FiberS090 FiberS100
[dB
/dB
A]
Sound package
Effect of mass layer coverage in 3" fiber - TBLIL SWL
Mass normalized mean TBLIL in SIL range [dB]Mass normalized overall TBLIL in range 100 to 6300 Hz [dB A]Baseline for mean TBLIL in SIL range [dB]Baseline for overall TBLIL [dB A]
(a) SWL overall and mean TBLIL
10
20
30
40
50
60
70
80
90
Fiber FiberS050 FiberS070 FiberS080 FiberS090 FiberS100
[dB
/dB
A]
Sound package
Effect of mass layer coverage in 3" fiber - TBLIL DWL
Mass normalized mean TBLIL in SIL range [dB]Mass normalized overall TBLIL in range 100 to 6300 Hz [dB A]Baseline for mean TBLIL in SIL range [dB]Baseline for overall TBLIL [dB A]
(b) DWL overall and mean TBLIL
Figure F-44: Mass layer size study – SWL and DWL configuration TBLIL plots for fiberglass
sound packages – all results mass normalized

245
LISTE DES RÉFÉRENCES
1. Rao, M. D. (2003). Recent applications of viscoelastic damping for noise control in
automobiles and commercial airplanes. Journal of Sound and Vibration, volume 262, numéro 3, p. 457-474.
2. Wilby, J. F. (1996). Aircraft Interior Noise. Journal of Sound and Vibration, volume 190, numéro 3, p. 545-564.
3. Wilby, J. F. et Gloyna, F. L. (1972). Vibration measurements of an airplane fuselage structure II. Jet noise excitation. Journal of Sound and Vibration, volume 23, numéro 4, p. 467-486.
4. Kuznetsov, V. M. (2003). Noise control problems of passenger airplanes. Acoustical Physics, volume 49, numéro 3, p. 241-262.
5. Wilby, J. F. et Gloyna, F. L. (1972). Vibration measurements of an airplane fuselage structure I. Turbulent boundary layer excitation. Journal of Sound and Vibration, volume 23, numéro 4, p. 443-466.
6. Bhat, W. V. (1971). Flight test measurement of exterior turbulent boundary layer pressure fluctuations on Boeing model 737 airplane. Journal of Sound and Vibration, volume 14, numéro 4, p. 439-457.
7. Atalla, Y. et Panneton, R. (2005). Inverse acoustical characterization of open cell porous media using impedance tube measurements. Canadian acoustics, volume 33, numéro 1, p. 11-24.
8. Kino, N. et Ueno, T. (2007). Investigation of sample size effects in impedance tube measurements. Applied Acoustics, volume 68, numéro 11-12, p. 1485-1493.
9. Kino, N. et Ueno, T. (2007). Improvements to the Johnson-Allard model for rigid-framed fibrous materials. Applied Acoustics, volume 68, numéro 11-12, p. 1468-1484.
10. Kino, N. (2007). Ultrasonic measurements of the two characteristic lengths in fibrous materials. Applied Acoustics, volume 68, numéro 11-12, p. 1427-1438.
11. Kino, N. et Ueno, T. (2007). Experimental determination of the micro- and macro-structural parameters influencing the acoustical performance of fibrous media. Applied Acoustics, volume 68, numéro 11-12, p. 1439-1458.
12. Bolton, J. S. et Kang, Y. J. (1997). Elastic porous materials for sound absorption and transmission control, Proceedings of SAE Noise and Vibration Conference, Paper #: 971878, p. 77-91.
13. Atalla, N., Panneton, R., Sgard, F. C. et Olny, X. (2001). Acoustic absorption of macro-perforated porous materials. Journal of Sound and Vibration, volume 243, numéro 4, p. 659-678.
14. Parkinson, J. P., Pearse, J. R. et Latimer, M. D. (2002). Sound absorption of elastic framed porous materials in combination with impervious films: effect of bonding. Applied Acoustics, volume 63, numéro 8, p. 819-828.
15. Sgard, F. C., Olny, X., Atalla, N. et Castel, F. (2005). On the use of perforations to improve the sound absorption of porous materials. Applied Acoustics, volume 66, numéro 6, p. 625-651.
16. Pipes, R.B. (2006). Functionally gradient polyimide foams with insitu carbon naotube sensors, Purdue University,

LISTE DES RÉFÉRENCES
246
https://engineering.purdue.edu/MSE/Fac_Staff/Faculty/pipes_research.html (last accessed on Nov 1, 2010).
17. Castagnède, B., Aknine, A., Brouard, B. et Tarnow, V. (2000). Effects of compression on the sound absorption of fibrous materials. Applied Acoustics, volume 61, numéro 2, p. 173-182.
18. Beranek, L. L. et Vér, I. L. (1992). Noise and vibration control engineering: principles and applications. John Wiley & Sons, New York, USA, 804 p.
19. Jones, D. I. G. (2001). Handbook of Viscoelastic Vibration Damping. John Wiley & Sons, New York, USA, 391 p.
20. Nashif, A., Jones, D. I. G. et Henderson, J. (1985). Vibrations Damping. John Wiley & Sons, New York, USA, 453 p.
21. Sun, C. T. et Lu, Y. P. (1995). Vibration Damping of Structural Elements. Prentice Hall PTR, Englewood Cliffs, NJ, USA, 372 p.
22. Jones, D. I. G. (1996). Reflections on damping technology at the end of the twentieth century. Journal of Sound and Vibration, volume 190, numéro 3, p. 449-462.
23. Kung, S. W. et Singh, R. (1998). Vibration analysis of beams with multiple constrained layer damping patches. Journal of Sound and Vibration, volume 212, numéro 5, p. 781-805.
24. Tang, H. B., Wu, C. J. et Huang, X. Q. (2007). Vibroacoustic analysis for a uniform beam using composite Green function method. Applied Acoustics, volume 68, numéro 11-12, p. 1386-1399.
25. Bloss, B. et Rao, M. D. (2002). Measurement of damping in structures by the power input method. Experimental techniques, volume 26, numéro 3, p. 30-32.
26. Gade, S. et Herlufsen, H. (1994). Digital Filter Techniques vs. FFT Techniques for Damping Measurements (Damping Part I) (Rapport technique). Brüel & Kjær, DK-2850, Nærum, Denmark, 42 p.
27. ASTM Designation: E 756-93, (1993). Standard test method for measuring vibration-damping properties of materials. Annual Book of ASTM Standards, volume 4, numéro 6, p. 827–833.
28. Nakra, B. C. (1998). Vibration control in machines and structures using viscoelastic damping. Journal of Sound and Vibration, volume 211, numéro 3, p. 449-465.
29. Fricke, J. R. (2000). Lodengraf damping – an advanced vibration damping technology. S.V. Sound and Vibration, volume 34, numéro 7, p. 22-27.
30. Thamburaj, P. et Sun, J.Q. (1999). Noise and vibration isolation across sandwich structures. SPIE Conference on Passive Damping, Newport Beach, California, USA, volume 3672, p. 156-166.
31. Marchand, V., Authesserre, J., Pouyet, J. et Bacon, C. (1996). Determination of the elastic constants of materials, in the form of plates, by a free vibration method. Journal of Sound and Vibration, volume 194, numéro 4, p. 497-512.
32. Botelho, E. C., Campos, A. N., De Barros, E., Pardini, L. C. et Rezende, M. C. (2006). Damping behaviour of continuous fiber/metal composite materials by the free vibration method. Composites Part B: Engineering, volume 37, numéro 2-3, p. 255-263.
33. Mead, D. J. (1998). Passive Vibration Control. John Wiley & Sons, Baffin Lane, Chichester, UK, 540 p.
34. Avitabile, P. (2007). Basic Modal Analysis Seminar (Rapport technique). LMS North America, Detroit, MI, USA, 105 p.

247
35. Atalla, N., Sgard, F. C. et Amédin, K. (2003). Numerical and experimental investigation of
the vibro-acoustics of a plate backed cavity coated with a heterogeneous porous material. SAE 2003 Noise and Vibration Conference, Traverse City, USA, p. 1453-1462.
36. Sgard, F. C., Atalla, N. et Amedin, C. K. (2007). Vibro-acoustic behaviour of a cavity backed by a plate coated with a meso-heterogeneous porous material. ACTA Acustica united with Acustica, volume 93, numéro 1, p.106-114.
37. Sgard, F. C., Atalla, N. et Amedin, C. K. (2003). Vibro-acoustic behaviour of a plate coated with a heterogeneous porous material radiating in a rigid walled cavity. Euronoise, Naple, Italy, May, p. 1-6.
38. Kidner, M. R. F., Fuller, C. R. et Gardner, B. (2006). Increase in transmission loss of single panels by addition of mass inclusions to a poro-elastic layer: Experimental investigation. Journal of Sound and Vibration, volume 294, numéro 3, p. 466-472.
39. Kidner, M. R. F., Howard, C. Q. et Gardner, B.K. (2005). Improvements in panel insertion loss by addition of random masses embedded in a poro-elastic layer: Modelling Procedures. Twelfth International Congress on Sound and Vibration, Lisbon, 8 p.
40. Howard, C. Q. et Kidner, M. R. F. (2006). Experimental validation of a model for the transmission loss of a plate with an array of lumped masses, Proceedings of Acoustics 2006, Christchurch, New Zealand, November 20-22, p. 1-8.
41. Estève, S.J. et Johnson, M.E. (2002). Reduction of sound transmission into a circular cylindrical shell using distributed vibration absorbers and Helmholtz resonators. Journal of Acoustic Society of America, volume 112, numéro 6, p. 2840-8.
42. Estève, S. J. (2004). Control of sound transmission into payload fairings using distributed vibration absorbers and Helmholtz resonators. Ph.D. thesis, Virginia Polytechnic Institute & State University, Virginia, USA, 255 p.
43. Idrisi, K., Johnson, M. et Carneal, J. P. (2007). Passive control of sound transmission through a double panel using heterogeneous (HG) blankets, Part I: Modeling and verification. NOISE-CON 2007, Reno, Nevada, 12 p.
44. Idrisi, K., Johnson, M. et Carneal, J. P. (2007). Passive control of sound transmission through a double panel using heterogeneous (HG) blankets, Part II: HG parametric studies. NOISE-CON 2007, Reno, Nevada, 12 p.
45. Idrisi, K., Johnson, M. et Carneal, J. P. (2007). Passive control of sound transmission through a double panel using heterogeneous (HG) blankets, Part III: HG design strategies. NOISE-CON 2007, Reno, Nevada, 12 p.
46. Idrisi, K., Johnson, M., Toso, A. et Carneal, J. P. (2009). Increase in transmission loss of a double panel system by addition of mass inclusions to a poro-elastic layer: A comparison between theory and experiment. Journal of Sound and Vibration, volume 323, numéro 1-2, p. 51-66.
47. Idrisi, K., Johnson, M., Theurich, D. et Carneal, J. P. (2010). A study on the characteristic behavior of mass inclusions added to a poro-elastic layer. Journal of Sound and Vibration, volume 329, numéro 20, p. 4136-48.
48. Efimtsov, B. M., Lazarev, L. A. et Baranov, S. N. Application of equivalent presentations for the analysis of sound transmission loss of panels with resonant systems. Central Aerohydrodynamic Institute, Moscow, Russia, http://www.sea-acustica.es/Sevilla02/num03008.pdf (last accessed on November 1, 2010).

LISTE DES RÉFÉRENCES
248
49. Bolton, J. S., Shiau, N. M. et Kang, Y.J. (1996). Sound transmission through multi-panel
structures line with elastic porous materials. Journal of Sound and Vibration, volume 191, numéro 3, p. 317-347.
50. Tang, Y. Y., Silcox, R. J. et Robinson, J. H. (1996). Sound transmission through cylindrical shell structures excited by boundary layer pressure fluctuations. NASA Langley Technical Report Server, Technical report: NASA-aiaa-96-1760.
51. Tadeu, A., António, J. et Mateus, D. (2004). Sound insulation provided by single and double panel walls – a comparison of analytical solutions versus experimental results. Applied Acoustics, volume 65, numéro 1, p. 15-29.
52. Efimtsov, B. M., Golubev, A. Y., Zverev, A. Y., Andersson, A. O. et Kravchenko, S. V. Experimental investigation of sound transmission through thin-walled structures due to non-uniform pressure-fluctuation fields Part 1: subsonic flow, http://www.sea-acustica.es/Sevilla02/arcgen003.pdf (last accessed on November 1, 2010).
53. NOVA 2009 User’s Guide, Mecanum Numerik Solution Inc., http://www.mecanum.com (last accessed on November 1, 2010).
54. NOVAFEM 2009 User’s Guide, Mecanum Numerik Solution Inc., http://www.mecanum.com (last accessed on November 1, 2010).
55. VA One, ESI Software, http://www.esi-group.com/ (last accessed on November 1, 2010). 56. Norton, M. P. et Karczub, D. G. (2003). Fundamentals of Noise and Vibration Analysis for
Engineers, 2e édition. Cambridge University Press, Cambridge, UK, 631 p. 57. Porges, G. (1977). Applied Acoustics, Edward Arnold (Publishers) Limited, London, UK,
180 p. 58. Rhazi, D. et Atalla, N. (2010). Transfer matrix modeling of the vibroacoustic response of
multi-material structures under mechanical excitation. Journal of Sound and Vibration, volume 329, numéro 13, p. 2532-2546.
59. Atalla, N., Sgard, F. C., et Amedin, C. K. (2006). On the modeling of sound radiation from poroelastic materials. Journal of Acoustical Society of America, volume 120, numéro 4, p. 1990-1995.
60. Wilcox, D. C. (1993). Turbulence modeling for CFD. DCW Industries Inc., La Canada, CA, USA, 460 p.
61. Ichchou, M. N., Bareille, O. et Jacques, Y. (2009). Journal of Wind Engineering and Industrial Aerodynamics, volume 97, numéro 2, p. 63-76.
62. Biot, M. A. (1956). Theory of Propagation of Elastic Waves in a Fluid-Saturated Porous Solid. II. Higher Frequency Range. The Acoustical Society of America, volume 28, numéro 2, p. 179-191.
63. Biot, M. A. (1956). Theory of Propagation of Elastic Waves in a Fluid-Saturated Porous Solid. I. Low Frequency Range. The Acoustical Society of America, volume 28, numéro 2, p. 168-178.
64. Allard, J. F. et Atalla, N. (2009). Propagation of Sound in Porous Media – Modeling Sound Absorbing Materials, 2e édition. John Wiley & Sons, Ltd, Hoboken, NJ, USA, 358 p.
65. Atalla, N., Panneton, R. et Debergue, P. (1998). A mixed displacement-pressure formulation for poroelastic materials. Acoustical Society of America, volume 104, numéro 3, p. 1444-1452.
66. Rigobert, S., Atalla, N. et Sgard, F. C. (2003). Investigation of the convergence of the mixed displacement-pressure formulation for three-dimensional poroelastic materials

249
using hierarchical elements. Acoustical Society of America, volume 114, numéro 5, p. 2607-2617.
67. Rothberg, S. et Coupland, J. (1996). The new laser Doppler accelerometer for shock and vibration measurements. Optics and Lasers in Engineering, volume 25, numéro 4-5, p. 217-225.
68. T. Cameron, D. Russell, Computational and experimental modal analysis of a clamped-free bar. GMI Engineering & Management Institute, Flint, MI, http://paws.kettering.edu/~drussell/GMI-Acoustics/Modal.html (last accessed on November 1, 2010).
69. Åberg, J. et Widell, B. (2004). Uniaxial material damping measurements using a fiber optic lattice: a discussion of its performance envelope. Society for Experimental Mechanics, volume 44, numéro 1, p. 33-36.
70. Sinha, J. K. (2005). On standardisation of calibration procedure for accelerometer. Journal of Sound and Vibration, volume 286, numéro 1-2, p. 417-427.
71. Kammer, D. C. et Tinker, M. L. (2004). Optimal placement of triaxial accelerometers for modal vibration tests. Mechanical Systems and Signal Processing, volume 18, numéro 1, p. 29-41.
72. Gerhardt, J. et Schlaak, H. J. (2003). Sinusoidal vibration measurements using optimal measurement intervals. Measurement, volume 34, numéro 2, p. 133-141.
73. Bolduc, M. (2006). Damping Performance Test Set-up and Description (Rapport technique). GAUS, University of Sherbrooke, Sherbrooke, Quebec, Canada, 5 p.
74. Bolduc, M. (2007). Acquiring statistical energy analysis damping loss factor for complex structures with low to high damping characteristics. PhD Thesis report, University of Sherbrooke, Sherbrooke, Quebec, Canada, 326 p.
75. Bolduc, M. (2009). Technical memo: measurement of transmission loss and structure-borne insertions loss rev. 1 (Rapport technique). University of Sherbrooke, Sherbrooke, Quebec, Canada, 7 p.
76. Anonymous (1993). Sound intensity (Rapport technique). Brüel & Kjær, DK-2850, Nærum, Denmark, 38 p.
77. Lenzi, A. (2008). Experimental transmission loss for composite reinforced panels. Effects of noise control treatment (melamine foam) (Rapport technique). University of State of Santa Catarina, Department of Mechanical Engineering, Florianopolis, Brazil, 8 p.
78. ASTM Designation: E-90 (2004). Standard test method for Laboratory measurement of airborne sound transmission loss of building partitions and elements. DOI: 10.1520/E0090-04, www.astm.org (last accessed on November 1, 2010).
79. ISO 140-3 (1995). Acoustics - Measurement of sound insulation in buildings and of building elements - Part 3: Laboratory measurements of airborne sound insulation of building elements. http://www.iso.org/ (last accessed on November 1, 2010).
80. Lenzi, A. (2009). Experimental transmission loss and radiation efficiency for composite reinforced panel type. Effects of noise control treatment (damping, equivalent mass and melamine foam) (Rapport technique). University of State of Santa Catarina, Department of Mechanical Engineering, Florianopolis, Brazil, 18 p.
81. Williams, E. G. (1999). Fourier Acoustics: Sound Radiation and Nearfield Acoustical Holography. Academic Press, San Diego, CA, USA, 306 p.

LISTE DES RÉFÉRENCES
250
82. Mejdi, A. et Atalla, N. (2010). Dynamic and acoustic response of bidirectionally stiffened
plates with eccentric stiffeners subject to airborne and structure-borne excitations, Journal of Sound and Vibration, volume 329, numéro 21, p. 4422-4439.
83. Wang, J., Lu, T. J., Woodhouse, J., Langley, R.S. et Evans, J. (2005). Sound transmission through lightweight double-leaf partitions: theoretical modeling. Journal of Sound and Vibration, volume, 286, numéro 4-5, p. 817-847.
84. Vitiello, P., De Rosa, S. et Franco, F. (2008). Convected field analysis of flat panels response to turbulent boundary layer induced excitation. Aerospace Science and Technology, volume 12, numéro 1, p. 91-104.
85. Anonymous (2004). Performance of Lodengraf damping materials versus conventional damping materials for aluminum plates (Rapport technique). TIAX LLC, Cambridge, MA, USA, 10 p.