Embed Size (px)
Citation preview

ANALOG DEVICES INC
FORM 10-Q(Quarterly Report)
Filed 02/19/13 for the Period Ending 02/02/13
Address ONE TECHNOLOGY WAY
NORWOOD, MA 02062Telephone 7813294700
CIK 0000006281Symbol ADI
SIC Code 3674 - Semiconductors and Related DevicesIndustry Semiconductors
Sector TechnologyFiscal Year 10/31
http://www.edgar-online.com© Copyright 2013, EDGAR Online, Inc. All Rights Reserved.
Distribution and use of this document restricted under EDGAR Online, Inc. Terms of Use.

UNITED STATES SECURITIES AND EXCHANGE COMMISSION
WASHINGTON, D.C. 20549
Form 10-Q
(Mark One)
For the quarterly period ended February 2, 2013
OR
For the transition period from to
Commission File No. 1-7819
Analog Devices, Inc. (Exact name of registrant as specified in its charter)
(781) 329-4700 (Registrant’s telephone number, including area code)
(Former name, former address and former fiscal year, if changed since last report)
Indicate by check mark whether the registrant: (1) has filed all reports required to be filed by Section 13 or 15(d) of the Securities Exchange Act of 1934 during the preceding 12 months (or for such shorter period that the registrant was required to file such reports), and (2) has been subject to such filing requirements for the past 90 days. YES � NO �
Indicate by check mark whether the registrant has submitted electronically and posted on its corporate Web site, if any, every Interactive Data File required to be submitted and posted pursuant to Rule 405 of Regulation S-T (§232.405 of this chapter) during the preceding 12 months (or for such shorter period that the registrant was required to submit and post such files). YES � NO �
Indicate by check mark whether the registrant is a large accelerated filer, an accelerated filer, a non-accelerated filer, or a smaller reporting company. See the definitions of “large accelerated filer,” “accelerated filer” and “smaller reporting company” in Rule 12b-2 of the Exchange Act. (Check one):
� QUARTERLY REPORT PURSUANT TO SECTION 13 OR 15(d) OF THE SECURITIES EXCHANGE ACT OF 1934
� TRANSITION REPORT PURSUANT TO SECTION 13 OR 15(d) OF THE SECURITIES EXCHANGE ACT OF 1934
Massachusetts 04-2348234 (State or other jurisdiction of incorporation or organization) (I.R.S. Employer Identification No.)
One Technology Way, Norwood, MA 02062-9106 (Address of principal executive offices) (Zip Code)
Large accelerated filer � Accelerated filer �

Indicate by check mark whether the registrant is a shell company (as defined in Rule 12b-2 of the Exchange Act). YES � NO �
As of February 2, 2013 there were 305,984,586 shares of common stock of the registrant, $0.16 2/3 par value per share, outstanding.
Non-accelerated filer � (Do not check if a smaller reporting company) Smaller reporting company �

PART I - FINANCIAL INFORMATION
See accompanying notes.
1
ITEM 1. Financial Statements
ANALOG DEVICES, INC. CONDENSED CONSOLIDATED STATEMENTS OF INCOME (Unaudited) (thousands, except per share amounts)
Three Months Ended
February 2, 2013 February 4, 2012
Revenue $ 622,134 $ 648,058 Cost of sales (1) 231,850 238,668
Gross margin 390,284 409,390 Operating expenses:
Research and development (1) 125,164 124,378 Selling, marketing, general and administrative (1) 97,560 99,045 Special charge 14,071 2,595
236,795 226,018 Operating income 153,489 183,372 Nonoperating (income) expense:
Interest expense 6,414 6,682 Interest income (3,233 ) (3,348 )
Other, net 199 (48 )
3,380 3,286 Income before income taxes 150,109 180,086 Provision for income taxes 18,887 40,704 Net income $ 131,222 $ 139,382 Shares used to compute earnings per share – basic 303,484 297,788 Shares used to compute earnings per share – diluted 310,275 305,531 Basic earnings per share $ 0.43 $ 0.47 Diluted earnings per share $ 0.42 $ 0.46 Dividends declared and paid per share $ 0.30 $ 0.25
(1) Includes stock-based compensation expense as follows:
Cost of sales $ 1,667 $ 1,807 Research and development $ 5,600 $ 5,885 Selling, marketing, general and administrative $ 5,794 $ 5,640
See accompanying notes.
2
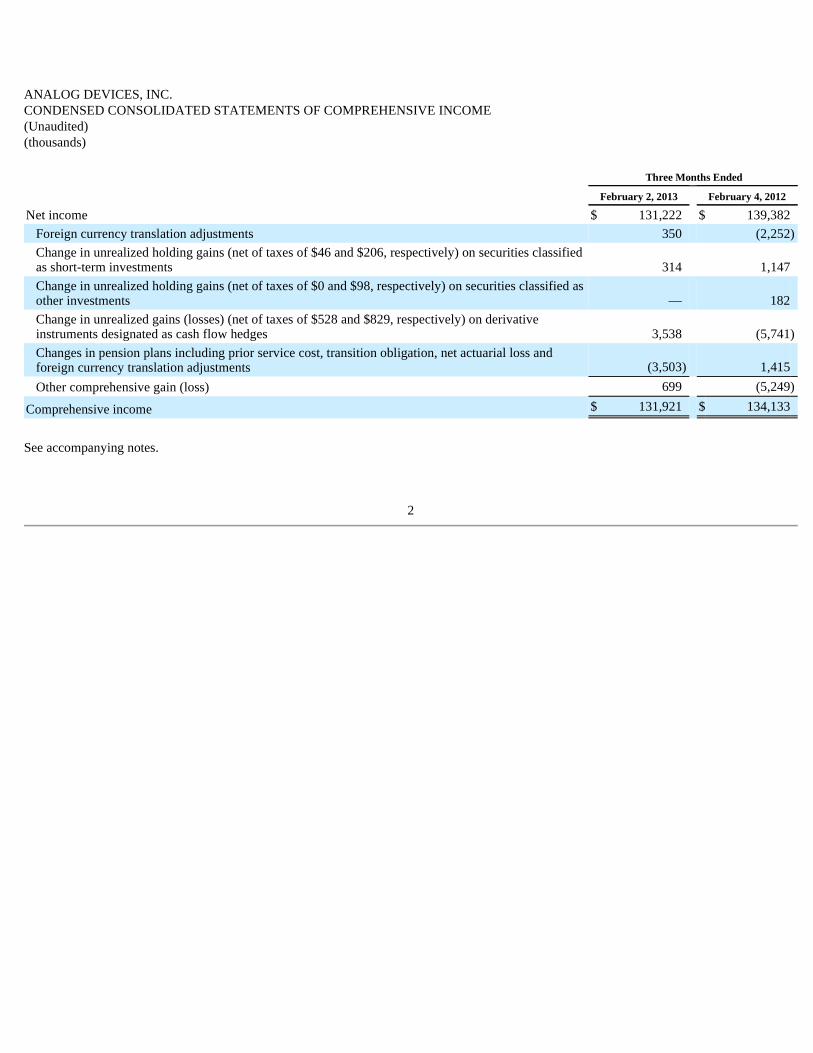
ANALOG DEVICES, INC. CONDENSED CONSOLIDATED STATEMENTS OF COMPREHENSIVE INCOME (Unaudited) (thousands) Three Months Ended
February 2, 2013 February 4, 2012
Net income $ 131,222 $ 139,382 Foreign currency translation adjustments 350 (2,252 )
Change in unrealized holding gains (net of taxes of $46 and $206, respectively) on securities classified as short-term investments 314 1,147 Change in unrealized holding gains (net of taxes of $0 and $98, respectively) on securities classified as other investments — 182 Change in unrealized gains (losses) (net of taxes of $528 and $829, respectively) on derivative instruments designated as cash flow hedges 3,538 (5,741 )
Changes in pension plans including prior service cost, transition obligation, net actuarial loss and foreign currency translation adjustments (3,503 ) 1,415 Other comprehensive gain (loss) 699 (5,249 )
Comprehensive income $ 131,921 $ 134,133

See accompanying notes.
3
ANALOG DEVICES, INC. CONDENSED CONSOLIDATED BALANCE SHEETS (Unaudited) (thousands, except share amounts) February 2, 2013 November 3, 2012
Assets
Cash and cash equivalents $ 795,797 $ 528,833 Short-term investments 3,191,182 3,371,545 Accounts receivable, net 329,578 339,881 Inventory (1):
Raw materials 26,793 28,111 Work in process 184,593 185,773 Finished goods 95,877 99,839
307,263 313,723 Deferred tax assets 84,019 90,335 Prepaid income tax 49,908 8,624 Prepaid expenses and other current assets 56,188 43,244
Total current assets 4,813,935 4,696,185 Property, plant and equipment, at cost:
Land and buildings 452,110 447,818 Machinery and equipment 1,693,388 1,681,661 Office equipment 50,010 50,042 Leasehold improvements 48,723 48,630
2,244,231 2,228,151 Less accumulated depreciation and amortization 1,752,800 1,727,284
Net property, plant and equipment 491,431 500,867 Deferred compensation plan investments 28,904 28,426 Other investments 3,816 1,816 Goodwill 284,367 283,833 Intangible assets, net 28,717 28,772 Deferred tax assets 27,556 43,531 Other assets 38,082 36,917
Total other assets 411,442 423,295
$ 5,716,808 $ 5,620,347
(1) Includes $2,381 and $2,517 related to stock-based compensation at February 2, 2013 and November 3, 2012 , respectively.

See accompanying notes.
4
ANALOG DEVICES, INC. CONDENSED CONSOLIDATED BALANCE SHEETS (Unaudited) (thousands, except share amounts) (continued) February 2, 2013 November 3, 2012
Liabilities and Shareholders’ Equity
Accounts payable $ 113,879 $ 117,034 Deferred income on shipments to distributors, net 243,396 238,541 Income taxes payable 28,199 6,097 Current portion of long-term debt — 14,500 Accrued liabilities 123,061 148,907
Total current liabilities 508,535 525,079 Long-term debt 759,672 807,098 Deferred income taxes 1,129 1,130 Deferred compensation plan liability 28,904 28,426 Other non-current liabilities 94,771 93,255
Total non-current liabilities 884,476 929,909 Commitments and contingencies
Shareholders’ Equity
Preferred stock, $1.00 par value, 471,934 shares authorized, none outstanding — — Common stock, $0.16 2/3 par value, 1,200,000,000 shares authorized, 305,984,586 shares issued and outstanding (301,389,176 on November 3, 2012) 50,998 50,233 Capital in excess of par value 507,082 390,651 Retained earnings 3,829,412 3,788,869 Accumulated other comprehensive loss (63,695 ) (64,394 )
Total shareholders’ equity 4,323,797 4,165,359
$ 5,716,808 $ 5,620,347
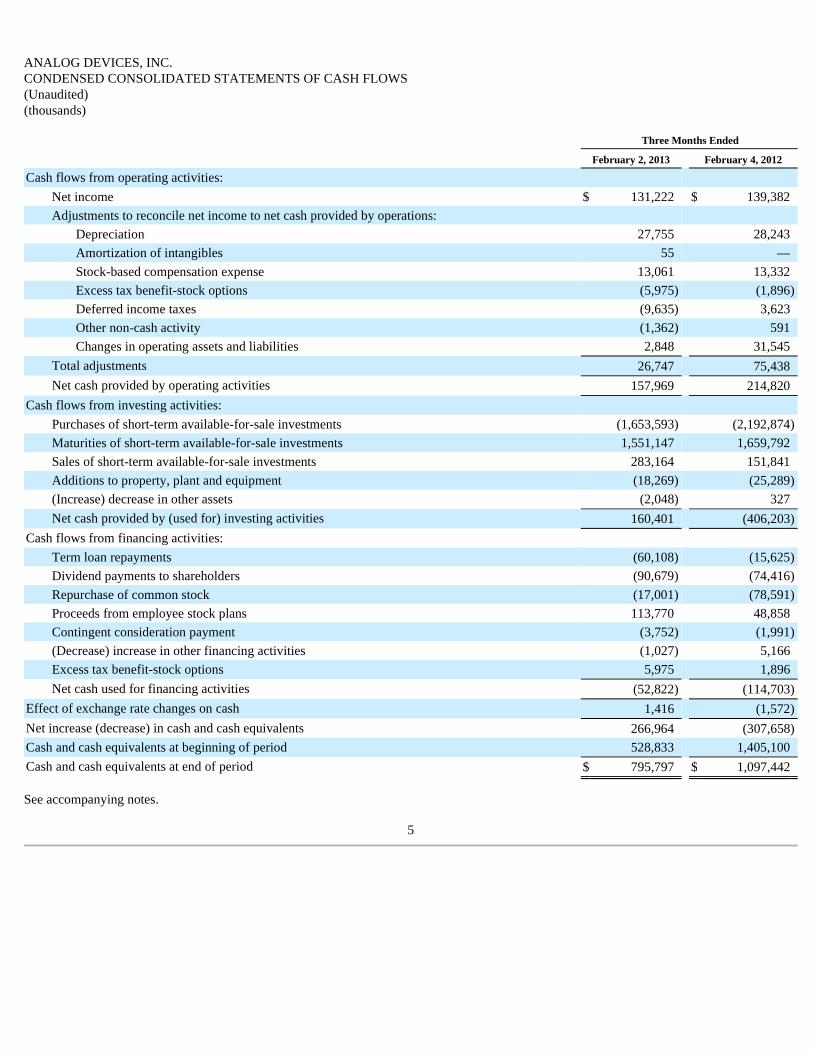
ANALOG DEVICES, INC. CONDENSED CONSOLIDATED STATEMENTS OF CASH FLOWS (Unaudited) (thousands)
See accompanying notes.
5
Three Months Ended
February 2, 2013 February 4, 2012
Cash flows from operating activities:
Net income $ 131,222 $ 139,382 Adjustments to reconcile net income to net cash provided by operations:
Depreciation 27,755 28,243 Amortization of intangibles 55 — Stock-based compensation expense 13,061 13,332 Excess tax benefit-stock options (5,975 ) (1,896 )
Deferred income taxes (9,635 ) 3,623 Other non-cash activity (1,362 ) 591 Changes in operating assets and liabilities 2,848 31,545
Total adjustments 26,747 75,438 Net cash provided by operating activities 157,969 214,820
Cash flows from investing activities:
Purchases of short-term available-for-sale investments (1,653,593 ) (2,192,874 )
Maturities of short-term available-for-sale investments 1,551,147 1,659,792 Sales of short-term available-for-sale investments 283,164 151,841 Additions to property, plant and equipment (18,269 ) (25,289 )
(Increase) decrease in other assets (2,048 ) 327 Net cash provided by (used for) investing activities 160,401 (406,203 )
Cash flows from financing activities:
Term loan repayments (60,108 ) (15,625 )
Dividend payments to shareholders (90,679 ) (74,416 )
Repurchase of common stock (17,001 ) (78,591 )
Proceeds from employee stock plans 113,770 48,858 Contingent consideration payment (3,752 ) (1,991 )
(Decrease) increase in other financing activities (1,027 ) 5,166 Excess tax benefit-stock options 5,975 1,896 Net cash used for financing activities (52,822 ) (114,703 )
Effect of exchange rate changes on cash 1,416 (1,572 )
Net increase (decrease) in cash and cash equivalents 266,964 (307,658 )
Cash and cash equivalents at beginning of period 528,833 1,405,100 Cash and cash equivalents at end of period $ 795,797 $ 1,097,442
ANALOG DEVICES, INC. NOTES TO CONDENSED CONSOLIDATED FINANCIAL STATEMENTS FOR THE THREE MONTHS ENDED FEBRUARY 2, 2013 (all tabular amounts in thousands except per share amounts and percentages) Note 1 – Basis of Presentation
In the opinion of management, the information furnished in the accompanying condensed consolidated financial statements reflects all normal recurring adjustments that are necessary to fairly state the results for these interim periods and should be read in conjunction with Analog Devices, Inc.’s (the Company) Annual Report on Form 10-K for the fiscal year ended November 3, 2012 and related notes. The results of operations for the interim periods shown in this report are not necessarily indicative of the results that may be expected for the fiscal year ending November 2, 2013 or any future period.
Certain amounts reported in previous years have been reclassified to conform to the fiscal 2013 presentation. Such reclassified amounts are immaterial. The Company has a 52-53 week fiscal year that ends on the Saturday closest to the last day in October. Fiscal 2013 is a 52 -week fiscal year and fiscal 2012 was a 53 -week fiscal year. The additional week in fiscal 2012 was included in the first quarter ended February 4, 2012 . Therefore, the first three months of fiscal 2012 included an additional week of operations as compared to the first three months of fiscal 2013.
Note 2 – Revenue Recognition
Revenue from product sales to customers is generally recognized when title passes, which for shipments to certain foreign countries is subsequent to product shipment. Title for these shipments ordinarily passes within a week of shipment. A reserve for sales returns and allowances for customers is recorded based on historical experience or specific identification of an event necessitating a reserve.
In all regions of the world, the Company defers revenue and the related cost of sales on shipments to distributors until the distributors resell the products to their customers. As a result, the Company’s revenue fully reflects end customer purchases and is not impacted by distributor inventory levels. Sales to distributors are made under agreements that allow distributors to receive price-adjustment credits, as discussed below, and to return qualifying products for credit, as determined by the Company, in order to reduce the amounts of slow-moving, discontinued or obsolete product from their inventory. These agreements limit such returns to a certain percentage of the value of the Company’s shipments to that distributor during the prior quarter. In addition, distributors are allowed to return unsold products if the Company terminates the relationship with the distributor.
Distributors are granted price-adjustment credits for sales to their customers when the distributor’s standard cost (i.e., the Company’s sales price to the distributor) does not provide the distributor with an appropriate margin on its sales to its customers. As distributors negotiate selling prices with their customers, the final sales price agreed upon with the customer will be influenced by many factors, including the particular product being sold, the quantity ordered, the particular customer, the geographic location of the distributor and the competitive landscape. As a result, the distributor may request and receive a price-adjustment credit from the Company to allow the distributor to earn an appropriate margin on the transaction.
Distributors are also granted price-adjustment credits in the event of a price decrease subsequent to the date the product was shipped and billed to the distributor. Generally, the Company will provide a credit equal to the difference between the price paid by the distributor (less any prior credits on such products) and the new price for the product multiplied by the quantity of the specific product in the distributor’s inventory at the time of the price decrease.
Given the uncertainties associated with the levels of price-adjustment credits to be granted to distributors, the sales price to the distributor is not fixed or determinable until the distributor resells the products to their customers. Therefore, the Company defers revenue recognition from sales to distributors until the distributors have sold the products to their customers.
Title to the inventory transfers to the distributor at the time of shipment or delivery to the distributor, and payment from the distributor is due in accordance with the Company’s standard payment terms. These payment terms are not contingent upon the distributors’ sale of the products to their customers. Upon title transfer to distributors, inventory is reduced for the cost of goods shipped, the margin (sales less cost of sales) is recorded as “deferred income on shipments to distributors, net” and an account receivable is recorded.
The deferred costs of sales to distributors have historically had very little risk of impairment due to the margins the Company earns on
sales of its products and the relatively long life-cycle of the Company’s products. Product returns from distributors that are ultimately scrapped have historically been immaterial. In addition, price protection and price-adjustment credits granted to distributors historically have not exceeded the margins the Company earns on sales of its products. The
6

Company continuously monitors the level and nature of product returns and is in frequent contact with the distributors to ensure reserves are established for all known material issues.
As of February 2, 2013 and November 3, 2012 , the Company had gross deferred revenue of $302.4 million and $299.0 million , respectively, and gross deferred cost of sales of $59.0 million and $60.5 million , respectively. Deferred income on shipments to distributors increased in the first three months of fiscal 2013 primarily as a result of a mix shift in favor of higher margin products sold through the channel.
Shipping costs are charged to cost of sales as incurred.
The Company generally offers a 12 -month warranty for its products. The Company’s warranty policy provides for replacement of defective products. Specific accruals are recorded for known product warranty issues. Product warranty expenses during the three-month periods ended February 2, 2013 and February 4, 2012 were not material .
Note 3 – Stock-Based Compensation
Stock-based compensation is measured at the grant date based on the grant-date fair value of the awards ultimately expected to vest, and is recognized as an expense on a straight-line basis over the vesting period, which is generally five years for stock options and three years for restricted stock units. Determining the amount of stock-based compensation to be recorded requires the Company to develop estimates used in calculating the grant-date fair value of stock options. Grant-Date Fair Value – The Company uses the Black-Scholes valuation model to calculate the grant-date fair value of stock option awards. The use of valuation models requires the Company to make estimates and assumptions such as expected volatility, expected term, risk-free interest rate, expected dividend yield and forfeiture rates. The grant-date fair value of restricted stock units represents the value of the Company’s common stock on the date of grant, reduced by the present value of dividends expected to be paid on the Company’s common stock prior to vesting.
Information pertaining to the Company’s stock option awards and the related estimated weighted-average assumptions to calculate the fair value of stock options granted during the three-month periods ended February 2, 2013 and February 4, 2012 are as follows:
Expected volatility — The Company is responsible for estimating volatility and has considered a number of factors, including third-party estimates. The Company currently believes that the exclusive use of implied volatility results in the best estimate of the grant-date fair value of employee stock options because it reflects the market’s current expectations of future volatility. In evaluating the appropriateness of exclusively relying on implied volatility, the Company concluded that: (1) options in the Company’s common stock are actively traded with sufficient volume on several exchanges; (2) the market prices of both the traded options and the underlying shares are measured at a similar point in time to each other and on a date close to the grant date of the employee share options; (3) the traded options have exercise prices that are both near-the-money and close to the exercise price of the employee share options; and (4) the remaining maturities of the traded options used to estimate volatility are at least one year.
Expected term — The Company uses historical employee exercise and option expiration data to estimate the expected term assumption for
the Black-Scholes grant-date valuation. The Company believes that this historical data is currently the best estimate of the expected term of a new option, and that generally its employees exhibit similar exercise behavior.
Risk-free interest rate — The yield on zero-coupon U.S. Treasury securities for a period that is commensurate with the expected term assumption is used as the risk-free interest rate.
7
Three Months Ended
Stock Options February 2, 2013 February 4, 2012
Options granted (in thousands) 20 49 Weighted-average exercise price $39.98 $36.99 Weighted-average grant-date fair value $5.87 $8.46 Assumptions:
Weighted-average expected volatility 24.1 % 33.3 %
Weighted-average expected term (in years) 5.3 5.3 Weighted-average risk-free interest rate 0.7 % 0.8 %
Weighted-average expected dividend yield 3.0 % 2.7 %

Expected dividend yield — Expected dividend yield is calculated by annualizing the cash dividend declared by the Company’s Board of Directors for the current quarter and dividing that result by the closing stock price on the date of grant. Until such time as the Company’s Board of Directors declares a cash dividend for an amount that is different from the current quarter’s cash dividend, the current dividend will be used in deriving this assumption. Cash dividends are not paid on options, restricted stock or restricted stock units.
Stock-Based Compensation Expense
The amount of stock-based compensation expense recognized during a period is based on the value of the awards that are ultimately expected to vest. Forfeitures are estimated at the time of grant and revised, if necessary, in subsequent periods if actual forfeitures differ from those estimates. The term “forfeitures” is distinct from “cancellations” or “expirations” and represents only the unvested portion of the surrendered stock-based award. Based on an analysis of its historical forfeitures, the Company has applied an annual forfeiture rate of 4.4% to all unvested stock-based awards as of February 2, 2013 . The rate of 4.4% represents the portion that is expected to be forfeited each year over the vesting period. This analysis will be re-evaluated quarterly and the forfeiture rate will be adjusted as necessary. Ultimately, the actual expense recognized over the vesting period will only be for those options that vest.
Additional paid-in-capital (APIC) Pool
The APIC pool represents the excess tax benefits related to share-based compensation that are available to absorb future tax deficiencies. If the amount of future tax deficiencies is greater than the available APIC pool, the Company records the excess as income tax expense in its condensed consolidated statements of income. During the three-month period ended February 2, 2013 , the Company had a sufficient APIC pool to cover any tax deficiencies recorded and as a result, these deficiencies did not affect its results of operations. During the three-month period ended February 4, 2012 , the Company recognized $1.8 million of income tax expense resulting from tax shortfalls related to share-based compensation in its condensed consolidated statements of income.
Stock-Based Compensation Activity
A summary of the activity under the Company’s stock option plans as of February 2, 2013 and changes during the three-month period then ended is presented below:
During the three months ended February 2, 2013 and February 4, 2012 , the total intrinsic value of options exercised (i.e. the difference between the market price at exercise and the price paid by the employee to exercise the options) was $52.0 million and $24.9 million , respectively, and the total amount of proceeds received by the Company from exercise of these options was $113.8 million and $48.9 million , respectively. The proceeds received include the value of shares surrendered by employees in certain limited circumstances to satisfy the exercise price of options and employee tax obligations upon vesting of restricted stock units and in connection with the exercise of stock options granted to the Company’s employees under the Company’s equity compensation plans. The withholding amount is based on the Company’s minimum statutory withholding requirement.
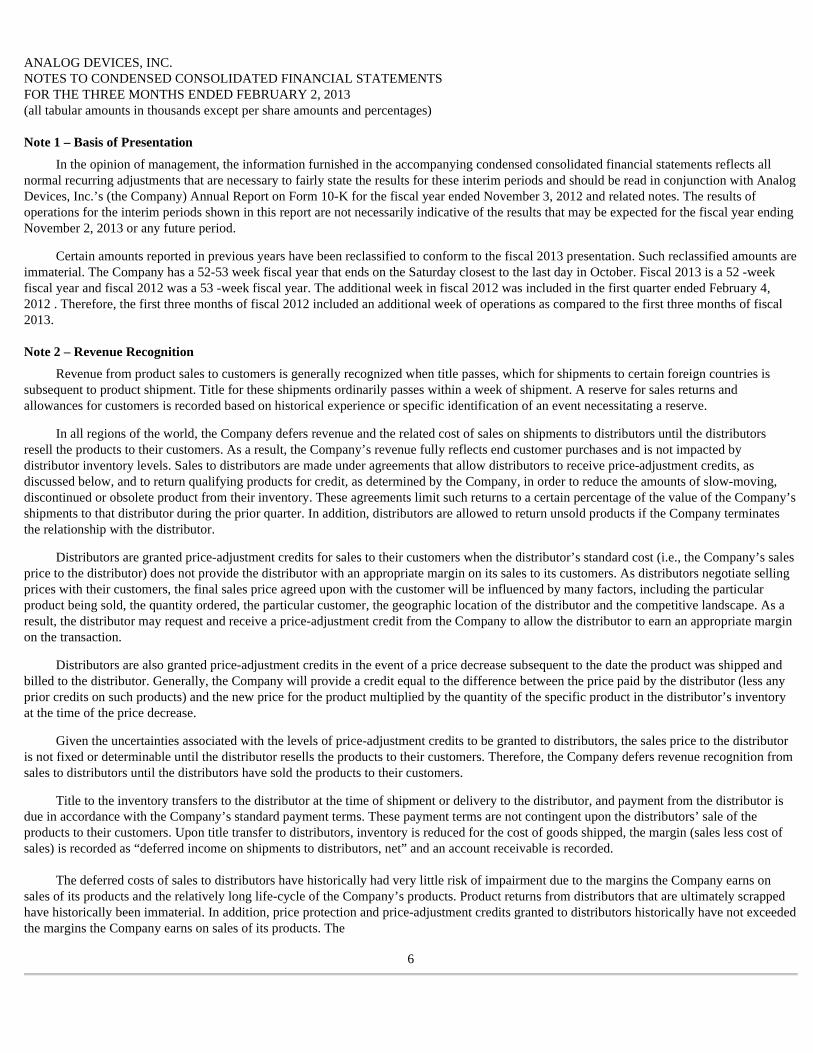
A summary of the Company’s restricted stock unit award activity as of February 2, 2013 and changes during the three-month period then ended is presented below:
8
Activity during the Three Months Ended February 2, 2013
Options Outstanding
(in thousands)
Weighted- Average Exercise Price Per Share
Weighted- Average
Remaining Contractual
Term in Years
Aggregate Intrinsic
Value
Options outstanding November 3, 2012 26,453 $31.73
Options granted 20 $39.98
Options exercised (3,937 ) $28.90
Options forfeited (102 ) $31.32
Options expired (4 ) $32.88
Options outstanding at February 2, 2013 22,430 $32.24 4.6 $279,994 Options exercisable at February 2, 2013 17,198 $31.63 3.6 $225,390 Options vested or expected to vest at February 2, 2013 (1) 22,050 $32.16 4.6 $276,865
(1) In addition to the vested options, the Company expects a portion of the unvested options to vest at some point in the future. Options expected to vest is calculated by applying an estimated forfeiture rate to the unvested options.
As of February 2, 2013 , there was $76.1 million of total unrecognized compensation cost related to unvested share-based awards
comprised of stock options and restricted stock units. That cost is expected to be recognized over a weighted-average period of 1.4 years . The total grant-date fair value of shares that vested during the three months ended February 2, 2013 and February 4, 2012 was approximately $50.2 million and $25.0 million , respectively. Note 4 – Accumulated Other Comprehensive Income (Loss)
The components of accumulated other comprehensive loss at February 2, 2013 and November 3, 2012 consisted of the following, net of tax:
The aggregate fair value of investments with unrealized losses as of February 2, 2013 and November 3, 2012 was $1,108.4 million and $1,214.1 million , respectively. These unrealized losses were primarily related to commercial paper that earns lower interest rates than current market rates. None of these investments have been in a loss position for more than twelve months.
Unrealized gains and losses on available-for-sale securities classified as short-term investments at February 2, 2013 and November 3, 2012 are as follows:
Realized gains or losses on investments are determined based on the specific identification basis and are recognized in nonoperating (income) expense. There were no material net realized gains or losses from the sales of available-for-sale investments during any of the fiscal periods presented.
9
Activity during the Three Months Ended February 2, 2013
Restricted Stock Units Outstanding
(in thousands)
Weighted- Average Grant- Date Fair Value
Per Share
Restricted stock units outstanding at November 3, 2012 3,060 $33.01 Units granted 13 $36.92 Restrictions lapsed (1,050 ) $28.86 Forfeited (28 ) $33.76
Restricted stock units outstanding at February 2, 2013 1,995 $35.22
February 2, 2013 November 3, 2012
Foreign currency translation adjustment $ 1,332 $ 982 Unrealized gains on available-for-sale securities 496 444 Unrealized losses on available-for-sale securities (161 ) (423 )
Unrealized gains on derivative instruments 4,703 1,165 Pension plans (70,065 ) (66,562 )
Total accumulated other comprehensive loss $ (63,695 ) $ (64,394 )
February 2, 2013 November 3, 2012
Unrealized gains on securities classified as short-term investments $ 618 $ 581 Unrealized losses on securities classified as short-term investments (196 ) (519 )
Net unrealized gains on securities classified as short-term investments $ 422 $ 62

Note 5 – Earnings Per Share
Basic earnings per share is computed based only on the weighted average number of common shares outstanding during the period. Diluted earnings per share is computed using the weighted average number of common shares outstanding during the period, plus the dilutive effect of potential future issuances of common stock relating to stock option programs and other potentially dilutive securities using the treasury stock method. In calculating diluted earnings per share, the dilutive effect of stock options is computed using the average market price for the respective period. In addition, the assumed proceeds under the treasury stock method include the average unrecognized compensation expense of stock options that are in-the-money and restricted stock units. This results in the “assumed” buyback of additional shares, thereby reducing the dilutive impact of in-the-money stock options. Potential shares related to certain of the Company’s outstanding stock options were excluded because they were anti-dilutive. Those potential shares, determined based on the weighted average exercise prices during the respective years, related to the Company’s outstanding stock options could be dilutive in the future.
The following table sets forth the computation of basic and diluted earnings per share:
Note 6 – Special Charges
The Company monitors global macroeconomic conditions on an ongoing basis and continues to assess opportunities for improved operational effectiveness and efficiency as well as a better alignment of expenses with revenues. As a result of these assessments, the Company has undertaken various restructuring actions over the past several years. These actions are described below.
The following tables display the special charges taken for ongoing actions and a roll-forward from November 3, 2012 to February 2, 2013 of the employee separation and exit cost accruals established related to these actions.
10
Three Months Ended
February 2, 2013 February 4, 2012
Net Income $ 131,222 $ 139,382 Basic shares:
Weighted-average shares outstanding 303,484 297,788 Earnings per share Basic: $ 0.43 $ 0.47
Diluted shares:
Weighted-average shares outstanding 303,484 297,788 Assumed exercise of common stock equivalents 6,791 7,743 Weighted-average common and common equivalent shares 310,275 305,531 Earnings per share Diluted: $ 0.42 $ 0.46
Anti-dilutive shares related to:
Outstanding stock options 5,641 7,144
Reduction of Operating Costs
Statement of Income 2010 2011 2012 2013
Workforce reductions $ 10,908 $ 2,239 $ 7,966 $ 14,071 Facility closure costs — — 186 — Non-cash impairment charge 487 — 219 — Other items 24 — 60 —
Total Charges $ 11,419 $ 2,239 $ 8,431 $ 14,071
Accrued Restructuring Reduction of
Operating Costs
Balance at November 3, 2012 $ 2,993 First quarter 2013 special charge 14,071 Severance payments (4,276 )
Effect of foreign currency on accrual 36 Balance at February 2, 2013 $ 12,824

Reduction of Operating Costs
During fiscal 2010 through fiscal 2012, the Company recorded special charges of approximately $22.1 million . These special charges included: $21.1 million for severance and fringe benefit costs in accordance with its ongoing benefit plan or statutory requirements at foreign locations for 269 manufacturing, engineering and selling, marketing, general and administrative (SMG&A) employees; $0.2 million for lease obligation costs for facilities that the Company ceased using during the third quarter of fiscal 2012; $0.1 million for contract termination costs; $0.2 million for the write-off of property, plant and equipment; and $0.5 million related to the impairment of intellectual property. The Company terminated the employment of all employees associated with these actions.
During the first quarter of fiscal 2013, the Company recorded a special charge of approximately $14.1 million for severance and fringe benefit costs in accordance with its ongoing benefit plan or statutory requirements at foreign locations for 137 manufacturing, engineering and SMG&A employees. As of February 2, 2013, the Company employed 19 of the 137 employees included in this cost reduction action. These employees must continue to be employed by the Company until their employment is involuntarily terminated in order to receive the severance benefit.
Note 7 – Segment Information
The Company operates and tracks its results in one reportable segment based on the aggregation of five operating segments. The Company designs, develops, manufactures and markets a broad range of integrated circuits. The Chief Executive Officer has been identified as the Chief Operating Decision Maker.
Revenue Trends by End Market
The following table summarizes revenue by end market. The categorization of revenue by end market is determined using a variety of data points including the technical characteristics of the product, the “sold to” customer information, the “ship to” customer information and the end customer product or application into which the Company’s product will be incorporated. As data systems for capturing and tracking this data evolve and improve, the categorization of products by end market can vary over time. When this occurs, the Company reclassifies revenue by end market for prior periods. Such reclassifications typically do not materially change the sizing of, or the underlying trends of results within, each end market.
* The sum of the individual percentages does not equal the total due to rounding.
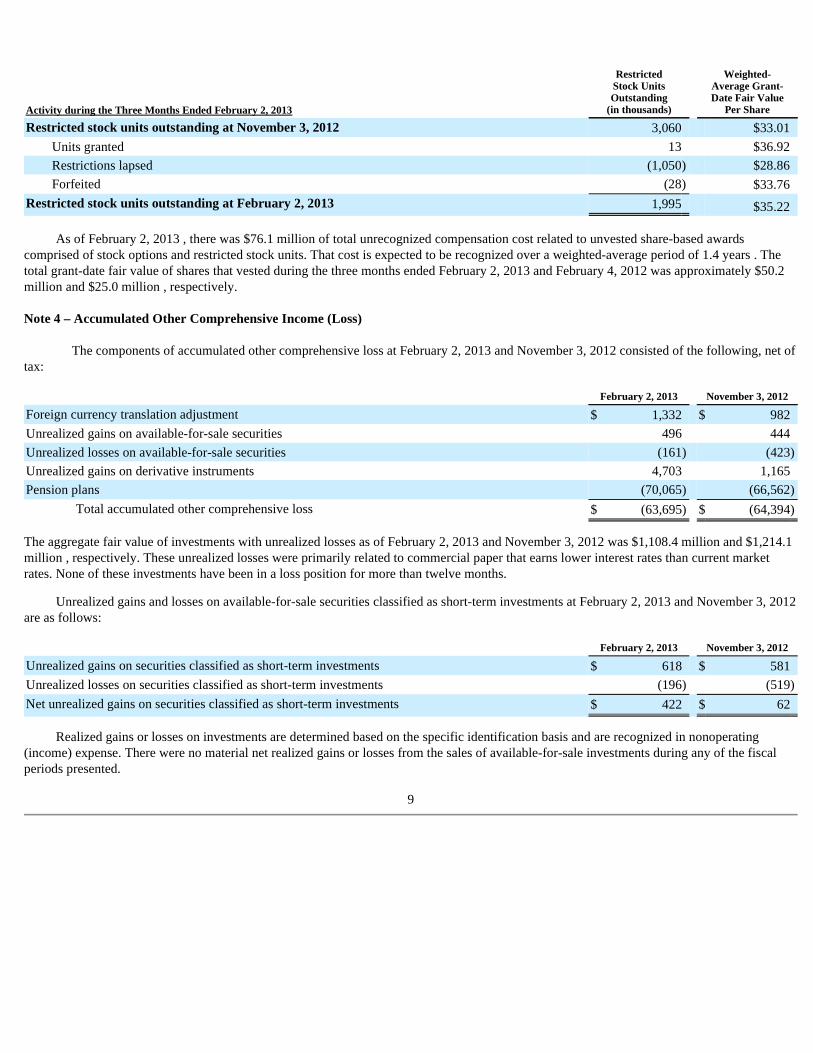
Revenue Trends by Product Type
The following table summarizes revenue by product categories. The categorization of the Company’s products into broad categories is based on the characteristics of the individual products, the specification of the products and in some cases the specific uses that certain products have within applications. The categorization of products into categories is therefore subject to judgment in some cases and can vary over time. In instances where products move between product categories, the Company reclassifies the amounts in the product categories for all prior periods. Such reclassifications typically do not materially change the sizing of, or the underlying trends of results within, each product category.
11
Three Months Ended
February 2, 2013 February 4, 2012
Revenue % of
Revenue* Y/Y% Revenue % of
Revenue*
Industrial $ 282,654 45 % (3 )% $ 290,660 45 %
Automotive 107,581 17 % (11 )% 120,588 19 %
Consumer 106,929 17 % (6 )% 114,261 18 %
Communications 124,970 20 % 2 % 122,549 19 %
Total revenue $ 622,134 100 % (4 )% $ 648,058 100 %
* The sum of the individual percentages does not equal the total due to rounding.
Revenue Trends by Geographic Region
Revenue by geographic region, based on the primary location of the Company's customers’ design activity for its products, for the three-month periods ended February 2, 2013 and February 4, 2012 were as follows:
In the three-month periods ended February 2, 2013 and February 4, 2012 , the predominant country comprising “Rest of North and South America” is Canada; the predominant countries comprising “Europe” are Germany, Sweden, France and the United Kingdom; and the predominant countries comprising “Rest of Asia” are Taiwan and South Korea.
Note 8 – Fair Value
The Company defines fair value as the price that would be received to sell an asset or be paid to transfer a liability in an orderly transaction between market participants at the measurement date. The Company applies the following fair value hierarchy, which prioritizes the inputs used to measure fair value into three levels and bases the categorization within the hierarchy upon the lowest level of input that is available and significant to the fair value measurement. The hierarchy gives the highest priority to unadjusted quoted prices in active markets for identical assets or liabilities (Level 1 measurements) and the lowest priority to unobservable inputs (Level 3 measurements).
Level 1 — Level 1 inputs are quoted prices (unadjusted) in active markets for identical assets or liabilities that the reporting entity has the ability to access at the measurement date.
Level 2 — Level 2 inputs are inputs other than quoted prices included within Level 1 that are observable for the asset or liability, either directly or indirectly. If the asset or liability has a specified (contractual) term, a Level 2 input must be observable for substantially the full term of the asset or liability.
Level 3 — Level 3 inputs are unobservable inputs for the asset or liability in which there is little, if any, market activity for the asset or liability at the measurement date.
The tables below, set forth by level, the Company’s financial assets and liabilities, excluding accrued interest components that were accounted for at fair value on a recurring basis as of February 2, 2013 and November 3, 2012 . The tables exclude cash on hand and assets and liabilities that are measured at historical cost or any basis other than fair value. As of February 2,
12
Three Months Ended
February 2, 2013 February 4, 2012
Revenue % of
Revenue* Y/Y% Revenue % of
Revenue
Converters $ 277,637 45 % (3 )% $ 285,135 44 %
Amplifiers / Radio frequency 157,853 25 % (4 )% 164,454 25 %
Other analog 95,693 15 % (1 )% 96,238 15 %
Subtotal analog signal processing 531,183 85 % (3 )% 545,827 84 %
Power management & reference 39,460 6 % (12 )% 44,865 7 %
Total analog products $ 570,643 92 % (3 )% $ 590,692 91 %
Digital signal processing 51,491 8 % (10 )% 57,366 9 %
Total revenue $ 622,134 100 % (4 )% $ 648,058 100 %
Three Months Ended
Region February 2, 2013 February 4, 2012
United States $ 204,271 $ 196,527 Rest of North and South America 23,512 31,873 Europe 189,298 206,098 Japan 64,688 80,339 China 84,769 75,576 Rest of Asia 55,596 57,645 Total revenue $ 622,134 $ 648,058
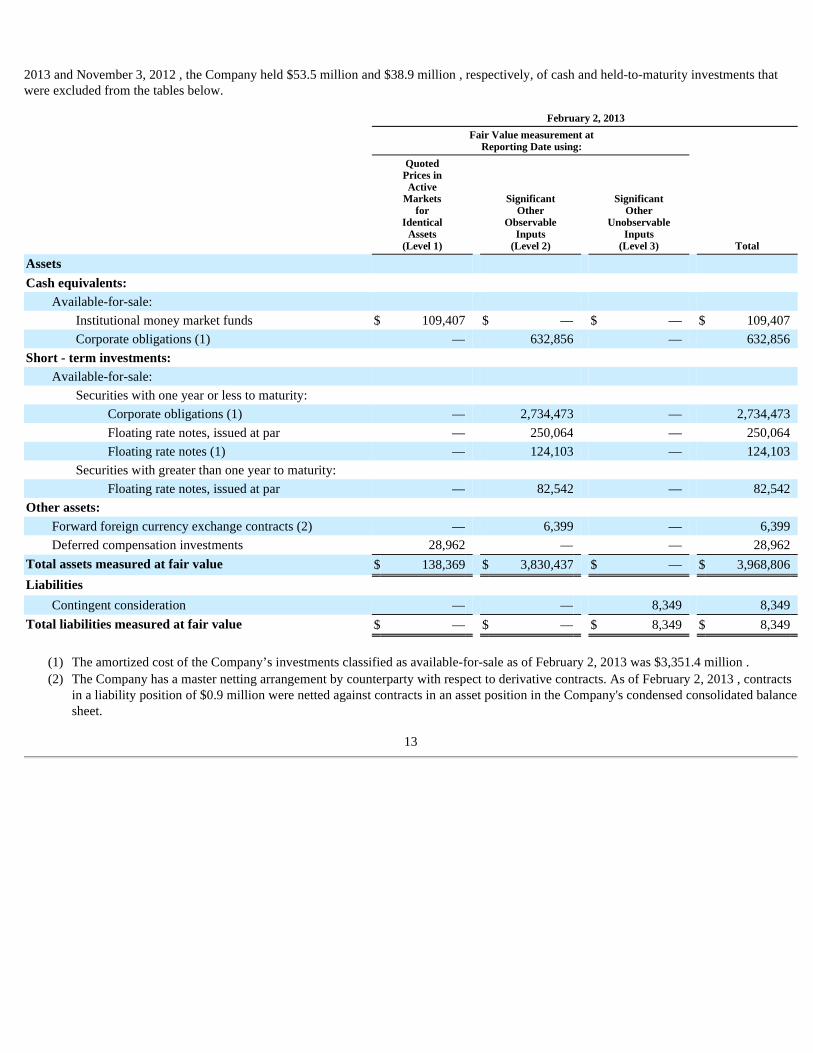
2013 and November 3, 2012 , the Company held $53.5 million and $38.9 million , respectively, of cash and held-to-maturity investments that were excluded from the tables below.
13
February 2, 2013
Fair Value measurement at
Reporting Date using:
Quoted Prices in Active
Markets for
Identical Assets
(Level 1)
Significant Other
Observable Inputs
(Level 2)
Significant Other
Unobservable Inputs
(Level 3) Total
Assets
Cash equivalents:
Available-for-sale:
Institutional money market funds $ 109,407 $ — $ — $ 109,407 Corporate obligations (1) — 632,856 — 632,856
Short - term investments:
Available-for-sale:
Securities with one year or less to maturity:
Corporate obligations (1) — 2,734,473 — 2,734,473 Floating rate notes, issued at par — 250,064 — 250,064 Floating rate notes (1) — 124,103 — 124,103
Securities with greater than one year to maturity:
Floating rate notes, issued at par — 82,542 — 82,542 Other assets:
Forward foreign currency exchange contracts (2) — 6,399 — 6,399 Deferred compensation investments 28,962 — — 28,962
Total assets measured at fair value $ 138,369 $ 3,830,437 $ — $ 3,968,806 Liabilities
Contingent consideration — — 8,349 8,349 Total liabilities measured at fair value $ — $ — $ 8,349 $ 8,349
(1) The amortized cost of the Company’s investments classified as available-for-sale as of February 2, 2013 was $3,351.4 million . (2) The Company has a master netting arrangement by counterparty with respect to derivative contracts. As of February 2, 2013 , contracts
in a liability position of $0.9 million were netted against contracts in an asset position in the Company's condensed consolidated balance sheet.

The following methods and assumptions were used by the Company in estimating its fair value disclosures for financial instruments:
Cash equivalents and short-term investments — These investments are adjusted to fair value based on quoted market prices or are determined using a yield curve model based on current market rates.
Deferred compensation plan investments and other investments — The fair value of these mutual fund, money market fund and equity investments are based on quoted market prices.
Long-term debt — The fair value of long-term debt is based on quotes received from third-party banks.
Forward foreign currency exchange contracts — The estimated fair value of forward foreign currency exchange contracts, which includes derivatives that are accounted for as cash flow hedges and those that are not designated as cash flow hedges, is based on the estimated amount the Company would receive if it sold these agreements at the reporting date taking into consideration current interest rates as well as the creditworthiness of the counterparty for assets and the Company’s creditworthiness for liabilities.
Contingent consideration — The fair value of the contingent consideration was estimated utilizing the income approach and is based upon
significant inputs not observable in the market. The income approach is based on two steps. The first step
14
November 3, 2012
Fair Value measurement at
Reporting Date using:
Quoted Prices in Active
Markets for
Identical Assets
(Level 1)
Significant Other
Observable Inputs
(Level 2)
Significant Other
Unobservable Inputs
(Level 3) Total
Assets
Cash equivalents:
Available-for-sale:
Institutional money market funds $ 143,876 $ — $ — $ 143,876 Corporate obligations (1) — 347,028 — 347,028
Short - term investments:
Available-for-sale:
Securities with one year or less to maturity:
Corporate obligations (1) — 2,818,798 — 2,818,798 Floating rate notes, issued at par — 280,065 — 280,065 Floating rate notes (1) — 234,280 — 234,280
Securities with greater than one year to maturity:
Floating rate notes, issued at par — 37,408 — 37,408 Other assets:
Forward foreign currency exchange contracts (2) — 1,061 — 1,061 Deferred compensation investments 28,480 — — 28,480
Total assets measured at fair value $ 172,356 $ 3,718,640 $ — $ 3,890,996 Liabilities
Contingent consideration — — 12,219 12,219 Total liabilities measured at fair value $ — $ — $ 12,219 $ 12,219
(1) The amortized cost of the Company’s investments classified as available-for-sale as of November 3, 2012 was $3,327.5 million . (2) The Company has a master netting arrangement by counterparty with respect to derivative contracts. As of November 3, 2012 ,
contracts in a liability position of $1.9 million were netted against contracts in an asset position in the Company's condensed consolidated balance sheet.

involves a projection of the cash flows that is based on the Company’s estimates of the timing and probability of achieving the defined milestones. The second step involves converting the cash flows into a present value equivalent through discounting. The discount rate reflects the Baa costs of debt plus the relevant risk associated with the asset and the time value of money.
The fair value measurement of the contingent consideration encompasses the following significant unobservable inputs:
Changes in the fair value of the contingent consideration subsequent to the acquisition date that are primarily driven by assumptions pertaining to the achievement of the defined milestones will be recognized in operating income in the period of the estimated fair value change. Significant increases or decreases in any of the inputs in isolation may result in a fluctuation in the fair value measurement.
The following table summarizes the change in the fair value of the contingent consideration measured using significant unobservable inputs (Level 3) as of November 3, 2012 and February 2, 2013 :
Financial Instruments Not Recorded at Fair Value on a Recurring Basis
On June 30, 2009 , the Company issued $375.0 million aggregate principal amount of 5.0% senior unsecured notes due July 1, 2014 (the 5.0% Notes) with semi-annual fixed interest payments due on January 1 and July 1 of each year, commencing January 1, 2010 . Based on quotes received from third-party banks, the fair value of the 5.0% Notes as of February 2, 2013 and November 3, 2012 was $397.9 million and $402.5 million , respectively and is classified as a Level 1 measurement according to the fair value hierarchy.
On April 4, 2011 , the Company issued $375.0 million aggregate principal amount of 3.0% senior unsecured notes due April 15, 2016 (the 3.0% Notes) with semi-annual fixed interest payments due on April 15 and October 15 of each year, commencing October 15, 2011 . Based on quotes received from third-party banks, the fair value of the 3.0% Notes as of February 2, 2013 and November 3, 2012 was $397.2 million and $402.3 million , respectively and is classified as a Level 1 measurement according to the fair value hierarchy.
Note 9 – Derivatives
Foreign Exchange Exposure Management — The Company enters into forward foreign currency exchange contracts to offset certain operational and balance sheet exposures from the impact of changes in foreign currency exchange rates. Such exposures result from the portion of the Company’s operations, assets and liabilities that are denominated in currencies other than the U.S. dollar, primarily the Euro; other significant exposures include the Philippine Peso and the British Pound. These foreign currency exchange contracts are entered into to support transactions made in the normal course of business, and accordingly, are not speculative in nature. The contracts are for periods consistent with the terms of the underlying transactions, generally one year or less . Hedges related to anticipated transactions are designated and documented at the inception of the respective hedges as cash flow hedges and are evaluated for effectiveness monthly. Derivative instruments are employed to eliminate or minimize certain foreign currency exposures that can be confidently identified and quantified. As the terms of the contract and the underlying transaction are matched at inception, forward contract effectiveness is calculated by comparing the change in fair value of the contract to the change in the forward value of the anticipated transaction, with the effective portion
15
Unobservable Inputs Range
Estimated contingent consideration payments $9,000
Discount rate 7% - 10%
Timing of cash flows 1 - 17 months
Probability of achievement 100%
Contingent
Consideration
Balance as of November 3, 2012 $ 12,219 Payment made (1) (4,000 )
Fair value adjustment (2) 130 Balance as of February 2, 2013 $ 8,349
(1) The payment is reflected in the Company's condensed consolidated statements of cash flows as cash used in financing activities related to the liability recognized at fair value as of the acquisition date and as cash provided by operating activities related to the fair value adjustments previously recognized in earnings.
(2) Recorded in research and development expense in the Company's condensed consolidated statements of income.

of the gain or loss on the derivative instrument reported as a component of accumulated other comprehensive (loss) income (OCI) in shareholders’ equity and reclassified into earnings in the same period during which the hedged transaction affects earnings. Any residual change in fair value of the instruments, or ineffectiveness, is recognized immediately in other (income) expense. Additionally, the Company enters into forward foreign currency contracts that economically hedge the gains and losses generated by the re-measurement of certain recorded assets and liabilities in a non-functional currency. Changes in the fair value of these undesignated hedges are recognized in other (income) expense immediately as an offset to the changes in the fair value of the asset or liability being hedged. As of February 2, 2013 and November 3, 2012 , the total notional amount of these undesignated hedges was $34.0 million and $31.5 million , respectively. The fair value of these hedging instruments in the Company’s condensed consolidated balance sheets as of February 2, 2013 and November 3, 2012 was immaterial .
Interest Rate Exposure Management — On June 30, 2009 , the Company entered into interest rate swap transactions related to its outstanding 5.0% senior unsecured notes where the Company swapped the notional amount of its $375.0 million of fixed rate debt at 5.0% into floating interest rate debt through July 1, 2014 . Under the terms of the swaps, the Company would (i) receive on the $375.0 million notional amount a 5.0% annual interest payment that is paid in two installments on the 1st business day of every January and July , commencing January 1, 2010 through and ending on the maturity date; and (ii) pay on the $375.0 million notional amount an annual three months LIBOR plus 2.05% interest payment, payable in four installments on the 1st business day of every January, April, July and October , commencing on October 1, 2009 and ending on the maturity date. The LIBOR-based rate was set quarterly three months prior to the date of the interest payment. The Company designated these swaps as fair value hedges. The fair value of the swaps at inception was zero and subsequent changes in the fair value of the interest rate swaps were reflected in the carrying value of the interest rate swaps on the balance sheet. The carrying value of the debt on the balance sheet was adjusted by an equal and offsetting amount. The gain or loss on the hedged item (that is, the fixed-rate borrowings) attributable to the hedged benchmark interest rate risk and the offsetting gain or loss on the related interest rate swaps for the three-month period ended February 4, 2012 were as follows:
The amounts earned and owed under the swap agreements were accrued each period and were reported in interest expense. There was no ineffectiveness recognized in any of the periods presented. In the second quarter of fiscal 2012, the Company terminated the interest rate swap agreement. The Company received $19.8 million in cash proceeds from the swap termination, which included $1.3 million in accrued interest. The proceeds, net of interest received, are disclosed in cash flows from financing activities in the Company's condensed consolidated statements of cash flows. As a result of the termination, the carrying value of the 5.0% Notes was adjusted for the change in the fair value of the interest component of the debt up to the date of the termination of the swap in an amount equal to the fair value of the swap, and will be amortized to earnings as a reduction of interest expense over the remaining life of the debt. This amortization is reflected in the Company's condensed consolidated statements of cash flows within operating activities. During fiscal year 2012, $5.3 million was amortized into earnings as a reduction of interest expense related to the swap termination. During the first three months of fiscal 2013, $2.0 million was amortized into earnings as a reduction of interest expense related to the swap termination.
The market risk associated with the Company’s derivative instruments results from currency exchange rate or interest rate movements that are expected to offset the market risk of the underlying transactions, assets and liabilities being hedged. The counterparties to the agreements relating to the Company’s derivative instruments consist of a number of major international financial institutions with high credit ratings. Based on the credit ratings of the Company’s counterparties as of February 2, 2013 , nonperformance is not perceived to be a significant risk. Furthermore, none of the Company’s derivatives are subject to collateral or other security arrangements and none contain provisions that are dependent on the Company’s credit ratings from any credit rating agency. While the contract or notional amounts of derivative financial instruments provide one measure of the volume of these transactions, they do not represent the amount of the Company’s exposure to credit risk. The amounts potentially subject to credit risk (arising from the possible inability of counterparties to meet the terms of their contracts) are generally limited to the amounts, if any, by which the counterparties’ obligations under the contracts exceed the obligations of the Company to the counterparties. As a result of the above considerations, the Company does not consider the risk of counterparty default to be significant.
The Company records the fair value of its derivative financial instruments in its condensed consolidated financial statements in other
current assets, other assets or accrued liabilities, depending on their net position, regardless of the purpose or intent for holding the derivative contract. Changes in the fair value of the derivative financial instruments are either recognized periodically in earnings or in shareholders’ equity as a component of OCI. Changes in the fair value of cash flow hedges are recorded in OCI and reclassified into earnings when the underlying contract matures. Changes in the fair values of derivatives not qualifying for hedge accounting are reported in earnings as they occur.
16
Statement of income classification
February 4, 2012
Loss on Swaps Gain on Note Net Income Effect
Other income $ (769 ) $ 769 $ —

The total notional amounts of derivative instruments designated as hedging instruments of cash flow hedges denominated in Euros, British Pounds, Philippine Pesos and Japanese Yen as of February 2, 2013 and November 3, 2012 was $157.9 million and $151.8 million , respectively. The fair values of these hedging instruments in the Company’s condensed consolidated balance sheets as of February 2, 2013 and November 3, 2012 were as follows:
The effect of derivative instruments designated as cash flow hedges on the Company's condensed consolidated statements of income for the three-month periods ended February 2, 2013 and February 4, 2012 were as follows:
The amounts reclassified into earnings before tax are recognized in cost of sales and operating expenses for the three-month periods ended February 2, 2013 and February 4, 2012 were as follows:
All derivative gains and losses included in OCI will be reclassified into earnings within the next 12 months. There was no ineffectiveness in the three-month periods ended February 2, 2013 and February 4, 2012 . Note 10 – Goodwill and Intangible Assets
Goodwill
The Company evaluates goodwill for impairment annually as well as whenever events or changes in circumstances suggest that the carrying value of goodwill may not be recoverable. The Company tests goodwill for impairment at the reporting unit level (operating segment or one level below an operating segment) on an annual basis on the first day of the fourth quarter (on or about August 4 ) or more frequently if indicators of impairment exist. For the Company’s latest annual impairment assessment that occurred on August 5, 2012 , the Company identified its reporting units to be its five operating segments, which meet the aggregation criteria for one reportable segment. The performance of the test involves a two-step process. The first step of the impairment test involves comparing the fair values of the applicable reporting units with their aggregate carrying values, including goodwill. The Company determines the fair value of its reporting units using the income approach methodology of valuation that includes the discounted cash flow method as well as other generally accepted valuation methodologies. If the carrying amount of a reporting unit exceeds the reporting unit’s fair value, the Company performs the second step of the goodwill impairment test to determine the amount of impairment loss. The second step of the goodwill impairment test involves comparing the implied fair value of the affected reporting unit’s goodwill with the carrying value of that goodwill. No impairment of goodwill resulted in any of the fiscal years presented. The Company’s next annual impairment assessment will be performed as of the first day of the fourth quarter of fiscal 2013 , unless indicators arise that would require the Company to reevaluate at an earlier date. The following table presents the changes in goodwill during the first three months of fiscal 2013 :
17
Fair Value At
Balance Sheet Location February 2, 2013 November 3, 2012
Forward foreign currency exchange contracts Prepaid expenses and other current assets $ 6,406 $ 1,161
Three Months Ended
February 2, 2013 February 4, 2012
Gain (loss) recognized in OCI on derivatives (net of tax of $760 in 2013 and $1,123 in 2012) $ 5,091 $ (7,771 )
(Gain) loss reclassified from OCI into income (net of tax of $232 in 2013 and $294 in 2012) $ (1,553 ) $ 2,030
Three Months Ended
February 2, 2013 February 4, 2012
Cost of sales $ 1,017 $ 901 Research and development $ 333 $ 623 Selling, marketing, general and administrative $ 435 $ 800
Three Months Ended
February 2, 2013
Balance at beginning of period $ 283,833 Foreign currency translation adjustment 534 Balance at end of period $ 284,367

Intangible Assets
The Company reviews finite-lived intangible assets for impairment whenever events or changes in circumstances indicate that the carrying value of assets may not be recoverable. Recoverability of these assets is measured by comparison of their carrying value to future undiscounted cash flows the assets are expected to generate over their remaining economic lives. If such assets are considered to be impaired, the impairment to be recognized in earnings equals the amount by which the carrying value of the assets exceeds their fair value determined by either a quoted market price, if any, or a value determined by utilizing a discounted cash flow technique. As of February 2, 2013 and November 3, 2012 , the Company’s finite-lived intangible assets consisted of the following which related to the acquisition of Multigig, Inc. (Note 15):
Amortization expense related to finite-lived intangible assets was $0.1 million for the three-month period ended February 2, 2013 . There was no amortization expense related to finite-lived intangible assets for the three-month period ended February 4, 2012. The remaining amortization expense will be recognized over a weighted-average period of approximately 2.2 years.
The Company expects annual amortization expense for intangible assets to be:
Indefinite-lived intangible assets are tested for impairment on an annual basis on the first day of the fourth quarter (on or about August 4 ) or more frequently if indicators of impairment exist. The impairment test involves the comparison of the fair values of the intangible assets with their carrying values. No impairment of intangible assets resulted from the impairment tests in any of the fiscal years presented.
Intangible assets, excluding in-process research and development (IPR&D), are amortized on a straight-line basis over their estimated useful lives or on an accelerated method of amortization that is expected to reflect the estimated pattern of economic use. IPR&D assets are considered indefinite-lived intangible assets until completion or abandonment of the associated R&D efforts. Upon completion of the projects, the IPR&D assets will be amortized over their estimated useful lives.
Indefinite-lived intangible assets consisted of $27.8 million of IPR&D as of February 2, 2013 and November 3, 2012 .
Note 11 – Pension Plans
The Company has various defined benefit pension and other retirement plans for certain non-U.S. employees that are consistent with local statutory requirements and practices. The Company’s funding policy for its foreign defined benefit pension plans is consistent with the local requirements of each country. The plans’ assets consist primarily of U.S. and non-U.S. equity securities, bonds, property and cash.
Net periodic pension cost of non-U.S. plans is presented in the following table:
18
February 2, 2013 November 3, 2012
Gross Carrying
Amount Accumulated Amortization
Gross Carrying Amount
Accumulated Amortization
Technology-based $ 1,100 $ 183 $ 1,100 $ 128
Fiscal Year Amortization Expense
Remainder of fiscal 2013 $165 2014 $220 2015 $220 2016 $220 2017 $92

Pension contributions of $4.4 million were made by the Company during the three months ended February 2, 2013 . The Company presently anticipates contributing an additional $12.8 million to fund its defined benefit pension plans in fiscal year 2013 for a total of $17.2 million .
Note 12 – Revolving Credit Facility
As of February 2, 2013 , the Company had $3,987.0 million of cash and cash equivalents and short-term investments, of which $1,137.0 million was held in the United States. The balance of the Company's cash and cash equivalents and short-term investments was held outside the United States in various foreign subsidiaries. As the Company intends to reinvest its foreign earnings indefinitely, this cash is not available to meet the Company's cash requirements in the United States, including cash dividends and common stock repurchases. During December 2012 , the Company terminated its five-year , $165.0 million unsecured revolving credit facility with certain institutional lenders entered into in May 2008 . On December 19, 2012 , the Company entered into a five-year , $500.0 million senior unsecured revolving credit facility with certain institutional lenders (the Credit Agreement). To date, the Company has not borrowed under this credit facility but the Company may borrow in the future and use the proceeds for repayment of existing indebtedness, stock repurchases, acquisitions, capital expenditures, working capital and other lawful corporate purposes. Revolving loans under the Credit Agreement (other than swing line loans) bear interest, at the Company's option, at either a rate equal to (a) the Eurodollar Rate (as defined in the Credit Agreement) plus a margin based on the Company's debt rating or (b) the Base Rate (defined as the highest of (i) the Bank of America prime rate, (ii) the Federal Funds Rate (as defined in the Credit Agreement) plus .50% and (iii) one month Eurodollar Rate plus 1.00%) plus a margin based on the Company's debt rating. The terms of the facility impose restrictions on the Company’s ability to undertake certain transactions, to create certain liens on assets and to incur certain subsidiary indebtedness. In addition, the Credit Agreement contains a consolidated leverage ratio covenant of total consolidated funded debt to consolidated earnings before interest, taxes, depreciation, and amortization (EBITDA) of not greater than 3.0 to 1.0 . As of February 2, 2013 , the Company was compliant with these covenants .
Note 13 – Debt
On June 30, 2009, the Company issued $375.0 million aggregate principal amount of 5.0% senior unsecured notes due July 1, 2014 (the 5.0% Notes) with semi-annual fixed interest payments due on January 1 and July 1 of each year, commencing January 1, 2010 . The sale of the 5.0% Notes was made pursuant to the terms of an underwriting agreement dated June 25, 2009 between the Company and Credit Suisse Securities (USA) LLC, as representative of the several underwriters named therein. The net proceeds of the offering were $370.4 million , after issuing at a discount and deducting expenses, underwriting discounts and commissions, which will be amortized over the term of the 5.0% Notes. The indenture governing the 5.0% Notes contains covenants that may limit the Company’s ability to: incur, create, assume or guarantee any debt for borrowed money secured by a lien upon a principal property; enter into sale and lease-back transactions with respect to a principal property; and consolidate with or merge into, or transfer or lease all or substantially all of its assets to, any other party. As of February 2, 2013 , the Company was compliant with these covenants . The notes are subordinated to any future secured debt and to the other liabilities of the Company’s subsidiaries.
On June 30, 2009 , the Company entered into interest rate swap transactions where the Company swapped the notional amount of its $375.0 million of fixed rate debt at 5.0% into floating interest rate debt through July 1, 2014 . Under the terms of the swaps, the Company would (i) receive on the $375.0 million notional amount a 5.0% annual interest payment that is paid in two installments on the 1st business day of every January and July , commencing January 1, 2010 through and ending on the maturity date; and (ii) pay on the $375.0 million notional amount an annual three month LIBOR plus 2.05% interest payment, payable in four installments on the 1st business day of every January, April, July and October , commencing on October 1, 2009 and ending on the maturity date. The LIBOR-based rate was set quarterly three months prior to the date of the interest payment. The Company designated these swaps as fair value hedges. The changes in the fair value of the interest rate swaps were
19
Three Months Ended
February 2, 2013 February 4, 2012
Service cost $ 2,856 $ 1,991 Interest cost 3,137 2,764 Expected return on plan assets (2,952 ) (2,649 )
Amortization of initial net obligation 5 5 Amortization of prior service cost (58 ) — Amortization of net loss 748 89
Net periodic pension cost $ 3,736 $ 2,200

reflected in the carrying value of the interest rate swaps in other assets on the balance sheet. The carrying value of the debt on the balance sheet was adjusted by an equal and offsetting amount. In fiscal 2012, the Company terminated the interest rate swap agreement. The Company received $19.8 million in cash proceeds from the swap termination, which included $1.3 million in accrued interest. The proceeds, net of interest received, are disclosed in cash flows from financing activities in the Company's condensed consolidated statements of cash flows. As a result of the termination, the carrying value of the 5.0% Notes was adjusted for the change in the fair value of the interest component of the debt up to the date of the termination of the swap in an amount equal to the fair value of the swap, and will be amortized to earnings as a reduction of interest expense over the remaining life of the debt. This amortization is reflected in the Company's condensed consolidated statements of cash flows within operating activities. During fiscal year 2012, $5.3 million was amortized into earnings as a reduction of interest expense related to the swap termination. During the first three months of fiscal year 2013, $2.0 million was amortized into earnings as a reduction of interest expense related to the swap termination.
On December 22, 2010 , Analog Devices Holdings B.V., a wholly owned subsidiary of the Company, entered into a credit agreement with Bank of America, N.A., London Branch as administrative agent. The borrower’s obligations were guaranteed by the Company. The credit agreement provided for a term loan facility of $145.0 million , which was set to mature on December 22, 2013 . During the first quarter of fiscal 2013, the Company repaid the remaining outstanding principal balance on the loan of $60.1 million and the credit agreement was terminated. The terms of the agreement provided for a three year principal amortization schedule with $3.6 million payable quarterly every March, June, September and December with the balance payable upon the maturity date. During fiscal 2011 and fiscal 2012, the Company made additional principal payments of $17.5 million and $42.0 million , respectively. The loan bore interest at a fluctuating rate for each period equal to the LIBOR rate corresponding with the tenor of the interest period plus a spread of 1.25% . The terms of this facility included limitations on subsidiary indebtedness and on liens against the assets of the Company and its subsidiaries, and also included financial covenants that required the Company to maintain a minimum interest coverage ratio and not exceed a maximum leverage ratio.
On April 4, 2011 , the Company issued $375.0 million aggregate principal amount of 3.0% senior unsecured notes due April 15, 2016 (the 3.0% Notes) with semi-annual fixed interest payments due on April 15 and October 15 of each year, commencing October 15, 2011 . The sale of the 3.0% Notes was made pursuant to the terms of an underwriting agreement dated March 30, 2011 between the Company and Credit Suisse Securities (USA) LLC and Merrill Lynch, Pierce, Fenner and Smith Incorporated, as representative of the several underwriters named therein. The net proceeds of the offering were $370.5 million , after issuing at a discount and deducting expenses, underwriting discounts and commissions, which will be amortized over the term of the 3.0% Notes. The indenture governing the 3.0% Notes contains covenants that may limit the Company’s ability to: incur, create, assume or guarantee any debt for borrowed money secured by a lien upon a principal property; enter into sale and lease-back transactions with respect to a principal property; and consolidate with or merge into, or transfer or lease all or substantially all of its assets to, any other party. As of February 2, 2013 , the Company was compliant with these covenants . The notes are subordinated to any future secured debt and to the other liabilities of the Company’s subsidiaries.
The Company’s principal payments related to its debt obligations are due as follows: $375.0 million in fiscal year 2014 ; and $375.0 million in fiscal year 2016 .
Note 14 – Common Stock Repurchase
The Company’s common stock repurchase program has been in place since August 2004 . In the aggregate, the Board of Directors has authorized the Company to repurchase $5.0 billion of the Company’s common stock under the program. Under the program, the Company may repurchase outstanding shares of its common stock from time to time in the open market and through privately negotiated transactions. Unless terminated earlier by resolution of the Company’s Board of Directors, the repurchase program will expire when the Company has repurchased all shares authorized under the program. As of February 2, 2013 , the Company had repurchased a total of approximately 129.2 million shares of its common stock for approximately $4,439.0 million under this program. An additional $561.0 million remains available for repurchase of shares under the current authorized program. The repurchased shares are held as authorized but unissued shares of common stock. Any future common stock repurchases will be dependent upon several factors, including the amount of cash available to the Company in the United States and the Company’s financial performance, outlook and liquidity. The Company also, from time to time, repurchases shares in settlement of employee tax withholding obligations due upon the vesting of restricted stock units, or in certain limited circumstances to satisfy the exercise price of options granted to the Company’s employees under the Company’s equity compensation plans.
Note 15 – Acquisitions
On March 30, 2012 , the Company acquired privately-held Multigig, Inc. (Multigig) of San Jose, California. The acquisition of Multigig is expected to enhance the Company’s clocking capabilities in stand-alone and embedded applications and strengthen the Company’s high speed signal processing solutions. The acquisition-date fair value of the consideration transferred totaled $26.8 million , which consisted of $24.2 million in initial cash payments at closing and an additional $2.6
20

million subject to an indemnification holdback that is payable within 15 months of the transaction date, which is included in accrued liabilities in the Company's condensed consolidated balance sheet as of February 2, 2013 . The Company’s assessment of fair value of the tangible and intangible assets acquired and liabilities assumed was based on their estimated fair values at the date of acquisition, resulting in the recognition of $15.6 million of IPR&D, $1.1 million of developed technology, $7.0 million of goodwill and $3.1 million of net deferred tax assets. The goodwill recognized is attributable to future technologies that have yet to be determined as well as the assembled workforce of Multigig. Future technologies do not meet the criteria for recognition separately from goodwill because they are a part of future development and growth of the business. None of the goodwill is expected to be deductible for tax purposes. During the third quarter of fiscal 2012, the Company reduced this holdback amount by $0.1 million as a result of indemnification claims. During the fourth quarter of fiscal 2012, the Company finalized its purchase accounting for Multigig, which resulted in adjustments of $0.4 million to deferred taxes and goodwill. In addition, the Company will be obligated to pay royalties to the Multigig employees on revenue recognized from the sale of certain Multigig products through the earlier of 5 years or the aggregate maximum payment of $1.0 million . Royalty payments to Multigig employees require post-acquisition services to be rendered and, as such, the Company will record these amounts as compensation expense in the related periods. As of February 2, 2013 , no royalty payments have been made. The Company recognized $0.5 million of acquisition-related costs that were expensed in fiscal 2012, which were included in operating expenses in the Company's condensed consolidated statement of income.
On June 9, 2011 , the Company acquired privately-held Lyric Semiconductor, Inc. (Lyric) of Cambridge, Massachusetts. The acquisition of Lyric gives the Company the potential to achieve significant improvement in power efficiency in mixed signal processing. The acquisition-date fair value of the consideration transferred totaled $27.8 million , which consisted of $14.0 million in initial cash payments at closing and contingent consideration of up to $13.8 million . The contingent consideration arrangement requires additional cash payments to the former equity holders of Lyric upon the achievement of certain technological and product development milestones payable during the period from June 2011 through June 2016 . The Company estimated the fair value of the contingent consideration arrangement utilizing the income approach. Changes in the fair value of the contingent consideration subsequent to the acquisition date primarily driven by assumptions pertaining to the achievement of the defined milestones will be recognized in operating income in the period of the estimated fair value change. As of February 2, 2013 , the Company had paid $6.0 million in contingent consideration. These payments are reflected in the Company's condensed consolidated statements of cash flows as cash used in financing activities related to the liability recognized at fair value as of the acquisition date and cash provided by operating activities related to the fair value adjustments previously recognized in earnings. The Company’s assessment of fair value of the tangible and intangible assets acquired and liabilities assumed was based on their estimated fair values at the date of acquisition, resulting in the recognition of $12.2 million of IPR&D, $18.9 million of goodwill and $3.3 million of net deferred tax liabilities. The goodwill recognized is attributable to future technologies that have yet to be determined as well as the assembled workforce of Lyric. Future technologies do not meet the criteria for recognition separately from goodwill because they are a part of future development and growth of the business. None of the goodwill is expected to be deductible for tax purposes. The fair value of the remaining contingent consideration was approximately $8.3 million as of February 2, 2013 , of which $5.6 million is included in accrued liabilities and $2.7 million is included in other non-current liabilities in the Company's condensed consolidated balance sheet. In addition, the Company will be obligated to pay royalties to the former equity holders of Lyric on revenue recognized from the sale of Lyric products and licenses through the earlier of 20 years or the accrual of a maximum of $25.0 million . Royalty payments to Lyric employees require post-acquisition services to be rendered and, as such, the Company will record these amounts as compensation expense in the related periods. As of February 2, 2013 , no royalty payments have been made. The Company recognized $0.2 million of acquisition-related costs that were expensed in fiscal 2011, which were included in operating expenses in the Company's condensed consolidated statement of income.
The Company has not provided pro forma results of operations for Multigig and Lyric herein as these acquisitions were not considered material to the Company on either an individual or an aggregate basis. The Company included the results of operations of each acquisition in its condensed consolidated statement of income from the date of each acquisition.
Note 16 – Income Taxes
The Company has provided for potential tax liabilities due in the various jurisdictions in which the Company operates. Judgment is required in determining the worldwide income tax expense provision. In the ordinary course of global business, there are many transactions and calculations where the ultimate tax outcome is uncertain. Some of these uncertainties arise as a consequence of cost reimbursement arrangements among related entities. Although the Company believes its estimates are reasonable, no assurance can be given that the final tax outcome of these matters will not be different from that which is reflected in the historical income tax provisions and accruals. Such differences could have a material impact on the Company’s income tax provision and operating results in the period in which such determination is made.
The Company's effective tax rate reflects the applicable tax rate in effect in the various tax jurisdictions around the world where its income is earned. The Company's effective tax rate for the first quarter of fiscal 2013 reflects income earned in lower
21
tax rate jurisdictions established through an international tax restructuring effective January 1, 2013. In addition, the Company's effective tax rate includes a tax benefit from the reinstatement of the U.S. federal research and development tax credit in January 2013 retroactive to January 1, 2012 which resulted in lowering the Company's effective tax rate by approximately 4% .
The Company has filed a petition with the Tax Court for one open matter for fiscal years 2006 and 2007 that pertains to Section 965 of the Internal Revenue Code related to the beneficial tax treatment of dividends paid from foreign owned companies under The American Jobs Creation Act. The potential liability for this adjustment is $36.5 million . The Company has concluded, based on discussions with its tax advisors that this item is not likely to result in any additional tax liability. Therefore, the Company has not recorded any additional tax liability for this issue.
The Company’s U.S. federal tax returns prior to fiscal year 2009 are no longer subject to examination.
The Company’s tax returns in Ireland prior to fiscal year 2008 are no longer subject to examination.
Note 17 – New Accounting Pronouncements
Standards Implemented
Comprehensive Income
In June 2011, the Financial Accounting Standards Board (FASB) issued ASU No. 2011-05, Presentation of Comprehensive Income (ASU No. 2011-05). ASU No. 2011-05 amended ASC 220, Comprehensive Income, to converge the presentation of comprehensive income between U.S. GAAP and IFRS. ASU No. 2011-05 requires that all non-owner changes in stockholders’ equity be presented in either a single continuous statement of comprehensive income or in two separate but consecutive statements and requires reclassification adjustments for items that are reclassified from other comprehensive income to net income in the statements where the components of net income and the components of other comprehensive income are presented. ASU No. 2011-05 eliminates the option to present the components of other comprehensive income as part of the statement in changes of stockholders equity. ASU No. 2011-05 was effective for fiscal years, and interim periods within those years, beginning after December 15, 2011, which was the Company’s first quarter of fiscal year 2013. The adoption of ASU No. 2011-05 in the first quarter of fiscal 2013 affected the presentation of comprehensive income but did not impact the Company’s financial condition or results of operations.
Standards to be Implemented
Balance Sheet
In December 2011, the FASB issued ASU No. 2011-11, Disclosures about Offsetting Assets and Liabilities (ASU No. 2011-11). ASU No. 2011-11 amended ASC 210, Balance Sheet, to converge the presentation of offsetting assets and liabilities between U.S. GAAP and IFRS. ASU No. 2011-11 requires that entities disclose both gross information and net information about both instruments and transactions eligible for offset in the statement of financial position and instruments and transactions subject to an agreement similar to a master netting arrangement. ASU No. 2011-11 is effective for fiscal years, and interim periods within those years, beginning after January 1, 2013, which is the Company’s fiscal year 2014. Subsequently, in January 2013, the FASB issued ASU No. 2013-01, Clarifying the Scope of Disclosures about offsetting Assets and Liabilities , which clarifies that the scope of ASU No. 2011-11 applies to derivatives accounted for in accordance with Topic 815, Derivatives and Hedging, including bifurcated embedded derivatives, repurchase agreements and reverse repurchase agreements, and securities borrowing and securities lending transactions that are either offset in accordance with Section 210-20-45 or Section 815-10-45 or subject to an enforceable master netting arrangement or similar agreement. The adoption of ASU No. 2011-11 and ASU No. 2013-01 will require additional disclosures related to offsetting assets and liabilities but will not impact the Company's financial condition or results of operations.
Comprehensive Income
In January 2013, the FASB issued ASU No. 2013-02, Reporting of Amounts Reclassified out of Accumulated Other Comprehensive Income (ASU No. 2013-02), which seek to improve the reporting of reclassifications out of accumulated other comprehensive income by requiring an entity to report the effect of significant reclassifications out of accumulated other comprehensive income on the respective line items in net income if the amount being reclassified is required under U.S. GAAP to be reclassified in its entirety to net income. For other amounts that are not required under U.S. GAAP to be reclassified in their entirety to net income in the same reporting period, an entity is required to cross-reference other disclosures required under U.S. GAAP that provide additional detail about those amounts. The amendments in ASU No. 2013-02 supersede the presentation requirements for reclassifications out of accumulated other comprehensive income in ASU No. 2011-05, Presentation of Comprehensive Income , and ASU No. 2011-12, Deferral of the Effective Date for Amendments to the Presentation of Reclassifications of Items Out of Accumulated Other Comprehensive Income in Accounting Standards Update No. 2011-05 . ASU No. 2013-02 is effective for reporting periods beginning after December 15, 2012, which is the Company's
22

second quarter of fiscal year 2013. The adoption of ASU No. 2013-02 in the second quarter of fiscal 2013 will affect the presentation of comprehensive income but will not impact the Company's financial condition or results of operations.
Note 18 – Subsequent Event
On February 18, 2013 , the Board of Directors of the Company declared a cash dividend of $0.34 per outstanding share of common stock. The dividend will be paid on March 12, 2013 to all shareholders of record at the close of business on March 1, 2013 .
23

This information should be read in conjunction with the unaudited condensed consolidated financial statements and related notes included in Item 1 of this Quarterly Report on Form 10-Q and the audited consolidated financial statements and related notes and Management’s Discussion and Analysis of Financial Condition and Results of Operations contained in our Annual Report on Form 10-K for the fiscal year ended November 3, 2012.
This Management's Discussion and Analysis of Financial Condition and Results of Operations, including in particular the section entitled “Outlook,” contains forward-looking statements regarding future events and our future results that are subject to the safe harbor created under the Private Securities Litigation Reform Act of 1995 and other safe harbors under the Securities Act of 1933 and the Securities Exchange Act of 1934. All statements other than statements of historical fact are statements that could be deemed forward-looking statements. These statements are based on current expectations, estimates, forecasts, and projections about the industries in which we operate and the beliefs and assumptions of our management. Words such as “expects,” “anticipates,” “targets,” “goals,” “projects,” “intends,” “plans,” “believes,” “seeks,” “estimates,” “may” and "will," and variations of such words and similar expressions are intended to identify such forward-looking statements. In addition, any statements that refer to projections regarding our future financial performance; our anticipated growth and trends in our businesses; our future capital needs and capital expenditures; our future market position and expected competitive changes in the marketplace for our products; our ability to pay dividends or repurchase stock; our ability to service our outstanding debt; our expected tax rate; the effect of new accounting pronouncements; and other characterizations of future events or circumstances are forward-looking statements. Readers are cautioned that these forward-looking statements are only predictions and are subject to risks, uncertainties, and assumptions that are difficult to predict, including those identified in Part II, Item 1A. "Risk Factors" and elsewhere in our Quarterly Report on Form 10-Q. Therefore, actual results may differ materially and adversely from those expressed in any forward-looking statements. We undertake no obligation to revise or update any forward-looking statements except to the extent required by law.
Results of Operations
(all tabular amounts in thousands except per share amounts and percentages)
Overview
Fiscal 2013 is a 52-week year and fiscal 2012 was a 53-week year. The additional week in fiscal 2012 was included in the first quarter ended February 4, 2012. Therefore, the first three months of fiscal 2012 included an additional week of operations as compared to the first three months of fiscal 2013.
The year-to-year revenue changes by end market and product category are more fully outlined below under Revenue Trends by End Market and Revenue Trends by Product Type .
During the first quarter of fiscal 2013, our revenue decreased 4% compared to the first quarter of fiscal 2012. Our diluted earnings per share was $ 0.42 compared to $ 0.46 in the first quarter of fiscal 2012. Cash flow from operations was $158.0 million , or 25% of revenue. We received $113.8 million in net proceeds from employee stock option exercises and $180.7 million from the net maturities of available-for-sale short term investments. We distributed $90.7 million to our shareholders in dividend payments, repaid the remaining outstanding principal balance on our $145.0 million term loan facility of $60.1 million and paid $18.3 million for property, plant and equipment additions. These factors contributed to the net increase in cash and cash equivalents of $267.0 million in the first quarter of fiscal 2013.
The year-to-year decrease in revenue was primarily attributable to one less week of operations in the first quarter of fiscal 2013 as compared to the first quarter of fiscal 2012. We continue to operate in a weak demand environment as a result of ongoing economic uncertainty. Our customers continued to reduce the inventory levels of our products during the first two months of the first quarter of fiscal 2013. We believe that our variable cost structure and continued efforts to manage production, inventory levels and expenses helped to mitigate the effect that these lower sales levels had on our earnings.
24
ITEM 2. Management’s Discussion and Analysis of Financial Condition and Results of Operations
Three Months Ended
February 2, 2013 February 4, 2012 $ Change % Change
Revenue $622,134 $648,058 $ (25,924 ) (4 )%
Gross margin % 62.7 % 63.2 %
Net income $131,222 $139,382 $ (8,160 ) (6 )%
Net income as a % of revenue 21.1 % 21.5 %
Diluted EPS $0.42 $0.46 $ (0.04 ) (9 )%

Revenue Trends by End Market
The following table summarizes revenue by end market. The categorization of revenue by end market is determined using a variety of data points including the technical characteristics of the product, the “sold to” customer information, the “ship to” customer information and the end customer product or application into which our product will be incorporated. As data systems for capturing and tracking this data evolve and improve, the categorization of products by end market can vary over time. When this occurs, we reclassify revenue by end market for prior periods. Such reclassifications typically do not materially change the sizing of, or the underlying trends of results within, each end market.
* The sum of the individual percentages does not equal the total due to rounding.
The year-to-year decrease in end market revenue in the industrial, automotive and consumer end markets in the three-month period ended February 2, 2013 was primarily due to one less week of operations in the first quarter of fiscal 2013 as compared to the first quarter of fiscal 2012. Additionally, weak market conditions contributed to the decline in the automotive end market. The year-to-year increase in communications end market revenue in the three-month period ended February 2, 2013 was primarily the result of an increase in demand for products sold into the wireless base station end market sector.
Revenue Trends by Product Type
The following table summarizes revenue by product categories. The categorization of our products into broad categories is based on the characteristics of the individual products, the specification of the products and in some cases the specific uses that certain products have within applications. The categorization of products into categories is therefore subject to judgment in some cases and can vary over time. In instances where products move between product categories, we reclassify the amounts in the product categories for all prior periods. Such reclassifications typically do not materially change the sizing of, or the underlying trends of results within, each product category.
* The sum of the individual percentages does not equal the total due to rounding.
The year-to-year decrease in total revenue in the three-month period ended February 2, 2013 was primarily the result of one less week of operations in the first quarter of fiscal 2013 as compared to the first quarter of fiscal 2012. Revenue Trends by Geographic Region
Revenue by geographic region, based upon the primary location of our customers’ design activity for our products for the three-month periods ended February 2, 2013 and February 4, 2012 were as follows:
25
Three months ended Three months ended
February 2, 2013 February 4, 2012
Revenue % of
Revenue* Y/Y% Revenue % of
Revenue*
Industrial $ 282,654 45 % (3 )% $ 290,660 45 %
Automotive 107,581 17 % (11 )% 120,588 19 %
Consumer 106,929 17 % (6 )% 114,261 18 %
Communications 124,970 20 % 2 % 122,549 19 %
Total revenue $ 622,134 100 % (4 )% $ 648,058 100 %
Three months ended Three months ended
February 2, 2013 February 4, 2012
Revenue % of
Revenue* Y/Y% Revenue % of
Revenue
Converters $ 277,637 45 % (3 )% $ 285,135 44 %
Amplifiers / Radio frequency 157,853 25 % (4 )% 164,454 25 %
Other analog 95,693 15 % (1 )% 96,238 15 %
Subtotal analog signal processing 531,183 85 % (3 )% 545,827 84 %
Power management & reference 39,460 6 % (12 )% 44,865 7 %
Total analog products $ 570,643 92 % (3 )% $ 590,692 91 %
Digital signal processing 51,491 8 % (10 )% 57,366 9 %
Total revenue $ 622,134 100 % (4 )% $ 648,058 100 %
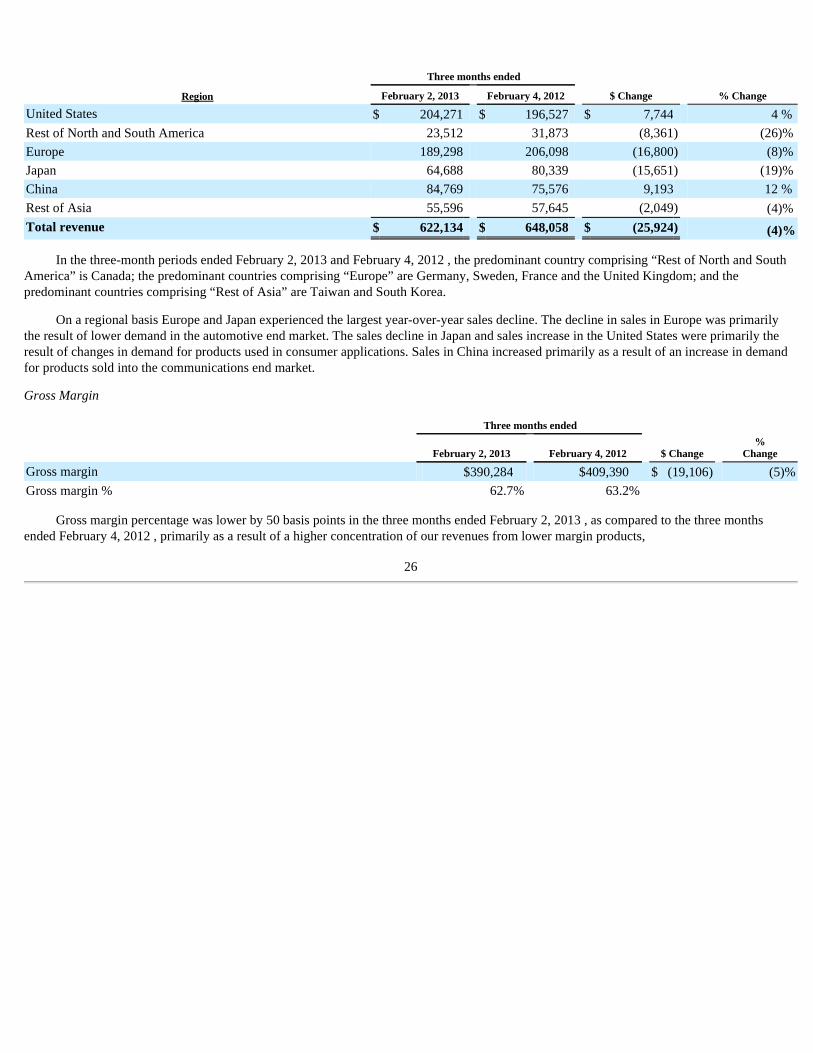
In the three-month periods ended February 2, 2013 and February 4, 2012 , the predominant country comprising “Rest of North and South America” is Canada; the predominant countries comprising “Europe” are Germany, Sweden, France and the United Kingdom; and the predominant countries comprising “Rest of Asia” are Taiwan and South Korea.
On a regional basis Europe and Japan experienced the largest year-over-year sales decline. The decline in sales in Europe was primarily the result of lower demand in the automotive end market. The sales decline in Japan and sales increase in the United States were primarily the result of changes in demand for products used in consumer applications. Sales in China increased primarily as a result of an increase in demand for products sold into the communications end market.
Gross Margin
Gross margin percentage was lower by 50 basis points in the three months ended February 2, 2013 , as compared to the three months ended February 4, 2012 , primarily as a result of a higher concentration of our revenues from lower margin products,
26
Three months ended
Region February 2, 2013 February 4, 2012 $ Change % Change
United States $ 204,271 $ 196,527 $ 7,744 4 %
Rest of North and South America 23,512 31,873 (8,361 ) (26 )%
Europe 189,298 206,098 (16,800 ) (8 )%
Japan 64,688 80,339 (15,651 ) (19 )%
China 84,769 75,576 9,193 12 %
Rest of Asia 55,596 57,645 (2,049 ) (4 )%
Total revenue $ 622,134 $ 648,058 $ (25,924 ) (4 )%
Three months ended
February 2, 2013 February 4, 2012 $ Change %
Change
Gross margin $390,284 $409,390 $ (19,106 ) (5 )%
Gross margin % 62.7 % 63.2 %
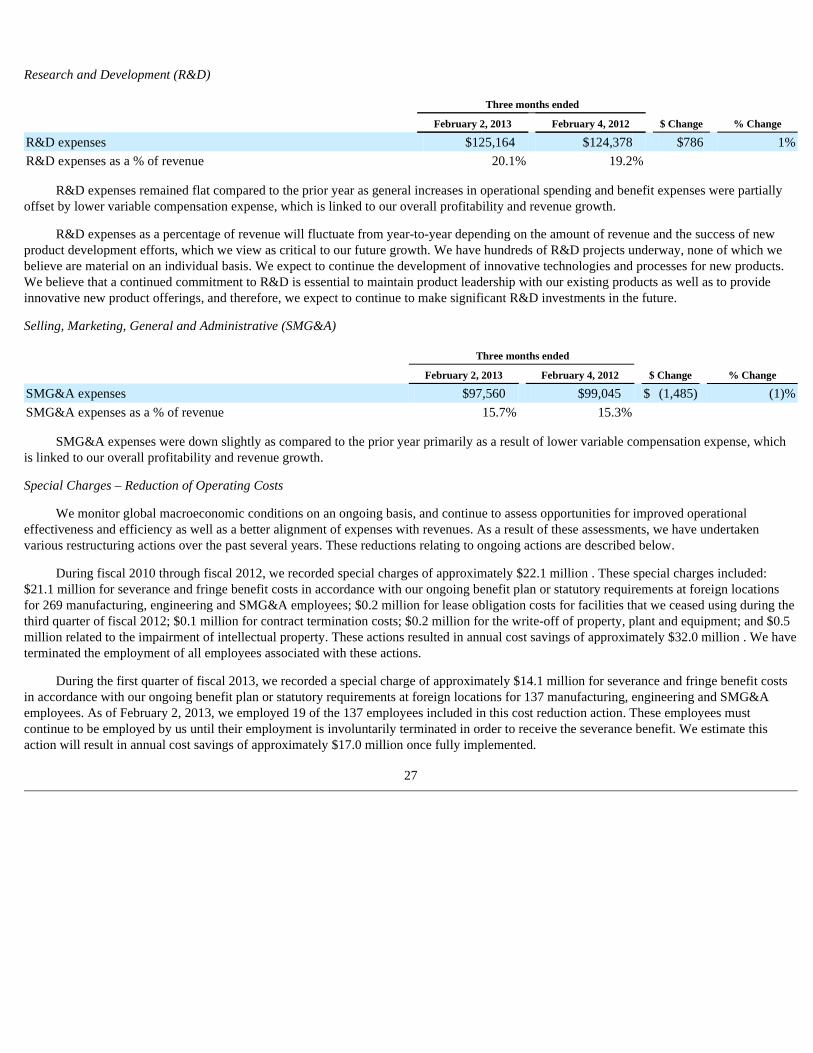
Research and Development (R&D)
R&D expenses remained flat compared to the prior year as general increases in operational spending and benefit expenses were partially offset by lower variable compensation expense, which is linked to our overall profitability and revenue growth.
R&D expenses as a percentage of revenue will fluctuate from year-to-year depending on the amount of revenue and the success of new product development efforts, which we view as critical to our future growth. We have hundreds of R&D projects underway, none of which we believe are material on an individual basis. We expect to continue the development of innovative technologies and processes for new products. We believe that a continued commitment to R&D is essential to maintain product leadership with our existing products as well as to provide innovative new product offerings, and therefore, we expect to continue to make significant R&D investments in the future.
Selling, Marketing, General and Administrative (SMG&A)
SMG&A expenses were down slightly as compared to the prior year primarily as a result of lower variable compensation expense, which is linked to our overall profitability and revenue growth.
Special Charges – Reduction of Operating Costs
We monitor global macroeconomic conditions on an ongoing basis, and continue to assess opportunities for improved operational effectiveness and efficiency as well as a better alignment of expenses with revenues. As a result of these assessments, we have undertaken various restructuring actions over the past several years. These reductions relating to ongoing actions are described below.
During fiscal 2010 through fiscal 2012, we recorded special charges of approximately $22.1 million . These special charges included: $21.1 million for severance and fringe benefit costs in accordance with our ongoing benefit plan or statutory requirements at foreign locations for 269 manufacturing, engineering and SMG&A employees; $0.2 million for lease obligation costs for facilities that we ceased using during the third quarter of fiscal 2012; $0.1 million for contract termination costs; $0.2 million for the write-off of property, plant and equipment; and $0.5 million related to the impairment of intellectual property. These actions resulted in annual cost savings of approximately $32.0 million . We have terminated the employment of all employees associated with these actions.
During the first quarter of fiscal 2013, we recorded a special charge of approximately $14.1 million for severance and fringe benefit costs in accordance with our ongoing benefit plan or statutory requirements at foreign locations for 137 manufacturing, engineering and SMG&A employees. As of February 2, 2013, we employed 19 of the 137 employees included in this cost reduction action. These employees must continue to be employed by us until their employment is involuntarily terminated in order to receive the severance benefit. We estimate this action will result in annual cost savings of approximately $17.0 million once fully implemented.
27
Three months ended
February 2, 2013 February 4, 2012 $ Change % Change
R&D expenses $125,164 $124,378 $786 1 %
R&D expenses as a % of revenue 20.1 % 19.2 %
Three months ended
February 2, 2013 February 4, 2012 $ Change % Change
SMG&A expenses $97,560 $99,045 $ (1,485 ) (1 )%
SMG&A expenses as a % of revenue 15.7 % 15.3 %
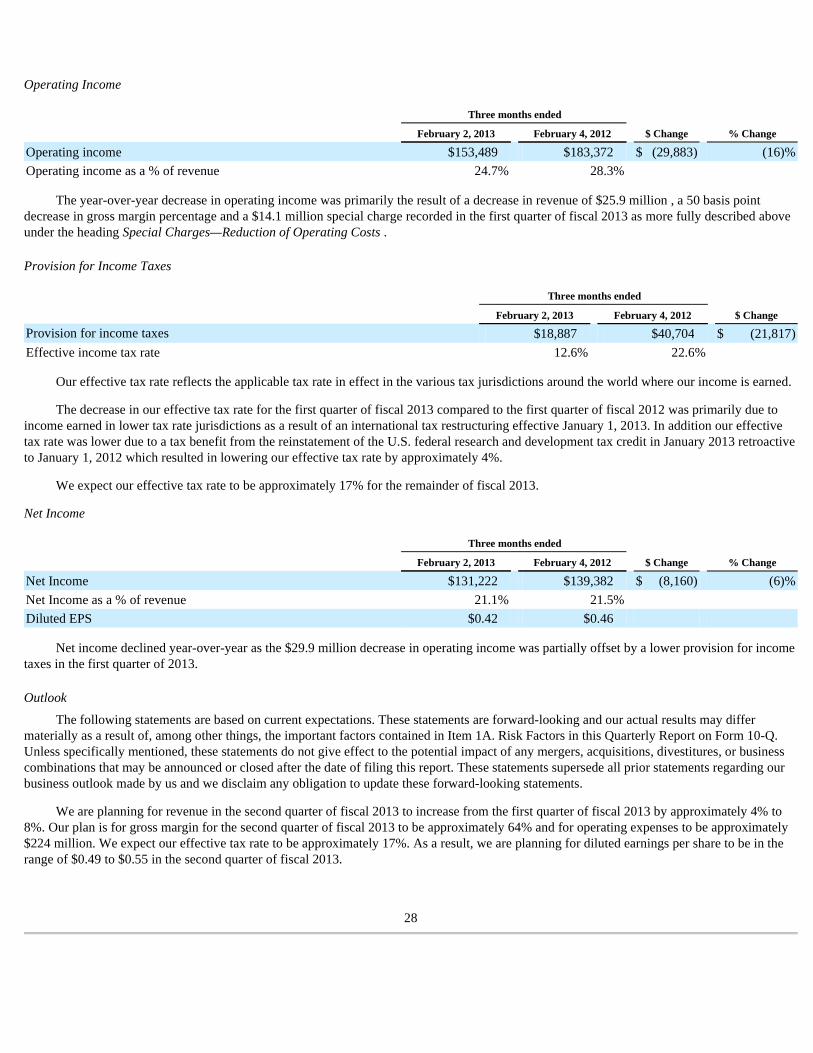
Operating Income
The year-over-year decrease in operating income was primarily the result of a decrease in revenue of $25.9 million , a 50 basis point decrease in gross margin percentage and a $14.1 million special charge recorded in the first quarter of fiscal 2013 as more fully described above under the heading Special Charges—Reduction of Operating Costs .
Provision for Income Taxes
Our effective tax rate reflects the applicable tax rate in effect in the various tax jurisdictions around the world where our income is earned.
The decrease in our effective tax rate for the first quarter of fiscal 2013 compared to the first quarter of fiscal 2012 was primarily due to income earned in lower tax rate jurisdictions as a result of an international tax restructuring effective January 1, 2013. In addition our effective tax rate was lower due to a tax benefit from the reinstatement of the U.S. federal research and development tax credit in January 2013 retroactive to January 1, 2012 which resulted in lowering our effective tax rate by approximately 4%.
We expect our effective tax rate to be approximately 17% for the remainder of fiscal 2013.
Net Income
Net income declined year-over-year as the $29.9 million decrease in operating income was partially offset by a lower provision for income taxes in the first quarter of 2013.
Outlook
The following statements are based on current expectations. These statements are forward-looking and our actual results may differ materially as a result of, among other things, the important factors contained in Item 1A. Risk Factors in this Quarterly Report on Form 10-Q. Unless specifically mentioned, these statements do not give effect to the potential impact of any mergers, acquisitions, divestitures, or business combinations that may be announced or closed after the date of filing this report. These statements supersede all prior statements regarding our business outlook made by us and we disclaim any obligation to update these forward-looking statements.
We are planning for revenue in the second quarter of fiscal 2013 to increase from the first quarter of fiscal 2013 by approximately 4% to 8%. Our plan is for gross margin for the second quarter of fiscal 2013 to be approximately 64% and for operating expenses to be approximately $224 million. We expect our effective tax rate to be approximately 17%. As a result, we are planning for diluted earnings per share to be in the range of $0.49 to $0.55 in the second quarter of fiscal 2013.
28
Three months ended
February 2, 2013 February 4, 2012 $ Change % Change
Operating income $153,489 $183,372 $ (29,883 ) (16 )%
Operating income as a % of revenue 24.7 % 28.3 %
Three months ended
February 2, 2013 February 4, 2012 $ Change
Provision for income taxes $18,887 $40,704 $ (21,817 )
Effective income tax rate 12.6 % 22.6 %
Three months ended
February 2, 2013 February 4, 2012 $ Change % Change
Net Income $131,222 $139,382 $ (8,160 ) (6 )%
Net Income as a % of revenue 21.1 % 21.5 %
Diluted EPS $0.42 $0.46
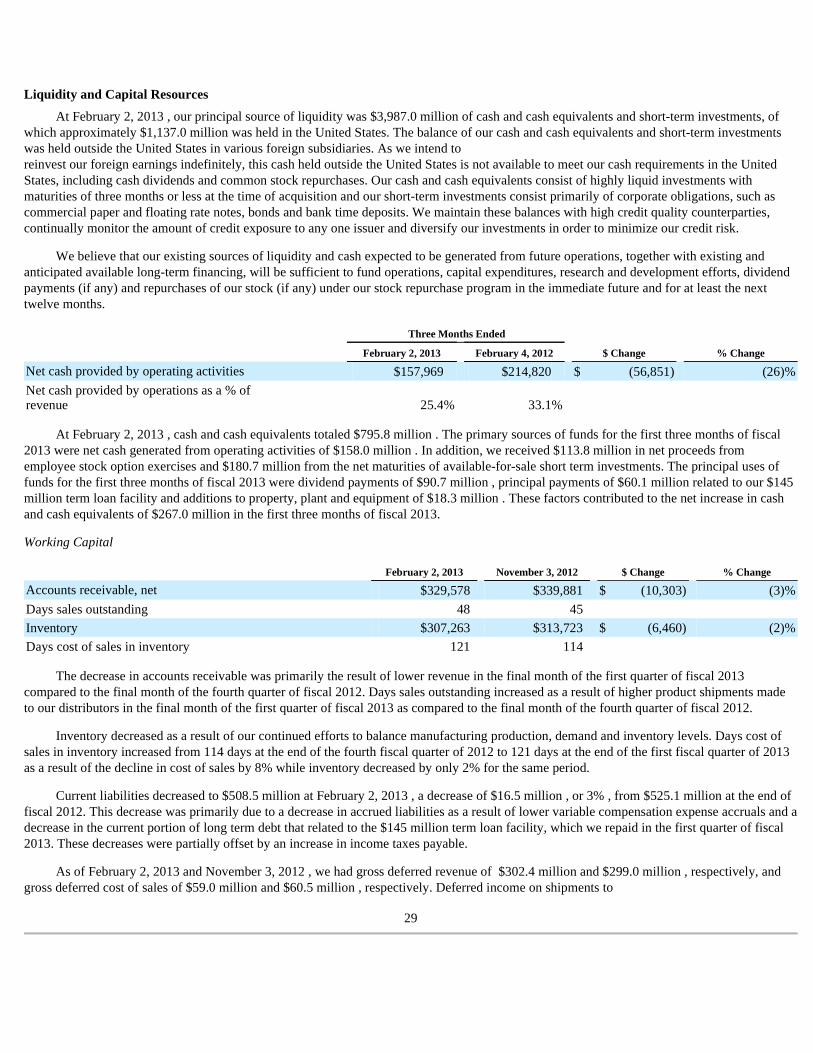
Liquidity and Capital Resources
At February 2, 2013 , our principal source of liquidity was $3,987.0 million of cash and cash equivalents and short-term investments, of which approximately $1,137.0 million was held in the United States. The balance of our cash and cash equivalents and short-term investments was held outside the United States in various foreign subsidiaries. As we intend to reinvest our foreign earnings indefinitely, this cash held outside the United States is not available to meet our cash requirements in the United States, including cash dividends and common stock repurchases. Our cash and cash equivalents consist of highly liquid investments with maturities of three months or less at the time of acquisition and our short-term investments consist primarily of corporate obligations, such as commercial paper and floating rate notes, bonds and bank time deposits. We maintain these balances with high credit quality counterparties, continually monitor the amount of credit exposure to any one issuer and diversify our investments in order to minimize our credit risk.
We believe that our existing sources of liquidity and cash expected to be generated from future operations, together with existing and anticipated available long-term financing, will be sufficient to fund operations, capital expenditures, research and development efforts, dividend payments (if any) and repurchases of our stock (if any) under our stock repurchase program in the immediate future and for at least the next twelve months.
At February 2, 2013 , cash and cash equivalents totaled $795.8 million . The primary sources of funds for the first three months of fiscal 2013 were net cash generated from operating activities of $158.0 million . In addition, we received $113.8 million in net proceeds from employee stock option exercises and $180.7 million from the net maturities of available-for-sale short term investments. The principal uses of funds for the first three months of fiscal 2013 were dividend payments of $90.7 million , principal payments of $60.1 million related to our $145 million term loan facility and additions to property, plant and equipment of $18.3 million . These factors contributed to the net increase in cash and cash equivalents of $267.0 million in the first three months of fiscal 2013.
Working Capital
The decrease in accounts receivable was primarily the result of lower revenue in the final month of the first quarter of fiscal 2013 compared to the final month of the fourth quarter of fiscal 2012. Days sales outstanding increased as a result of higher product shipments made to our distributors in the final month of the first quarter of fiscal 2013 as compared to the final month of the fourth quarter of fiscal 2012.
Inventory decreased as a result of our continued efforts to balance manufacturing production, demand and inventory levels. Days cost of sales in inventory increased from 114 days at the end of the fourth fiscal quarter of 2012 to 121 days at the end of the first fiscal quarter of 2013 as a result of the decline in cost of sales by 8% while inventory decreased by only 2% for the same period.
Current liabilities decreased to $508.5 million at February 2, 2013 , a decrease of $16.5 million , or 3% , from $525.1 million at the end of fiscal 2012. This decrease was primarily due to a decrease in accrued liabilities as a result of lower variable compensation expense accruals and a decrease in the current portion of long term debt that related to the $145 million term loan facility, which we repaid in the first quarter of fiscal 2013. These decreases were partially offset by an increase in income taxes payable.
As of February 2, 2013 and November 3, 2012 , we had gross deferred revenue of $302.4 million and $299.0 million , respectively, and gross deferred cost of sales of $59.0 million and $60.5 million , respectively. Deferred income on shipments to
29
Three Months Ended
February 2, 2013 February 4, 2012 $ Change % Change
Net cash provided by operating activities $157,969 $214,820 $ (56,851 ) (26 )%
Net cash provided by operations as a % of revenue 25.4 % 33.1 %
February 2, 2013 November 3, 2012 $ Change % Change
Accounts receivable, net $329,578 $339,881 $ (10,303 ) (3 )%
Days sales outstanding 48 45
Inventory $307,263 $313,723 $ (6,460 ) (2 )%
Days cost of sales in inventory 121 114

distributors increased in the first three months of fiscal 2013 as a result of a mix shift in favor of higher margin products in the channel. Sales to distributors are made under agreements that allow distributors to receive price-adjustment credits and to return qualifying products for credit, as determined by us, in order to reduce the amounts of slow-moving, discontinued or obsolete product from their inventory. Given the uncertainties associated with the levels of price-adjustment credits to be granted to distributors, the sales price to the distributors is not fixed or determinable until the distributors resell the products to their customers. Therefore, we defer revenue recognition from sales to distributors until the distributors have sold the products to their customers. The amount of price-adjustments is dependent on future overall market conditions, and therefore the levels of these adjustments could fluctuate significantly from period to period. To the extent that we experience a significant increase in the amount of credits we issue to our distributors, there could be a material impact on the ultimate revenue and gross margin recognized relating to these transactions.
Debt
As of February 2, 2013 , we had $750.0 million in principal outstanding on our long term debt. Our debt obligations consist of the following:
$375.0 million aggregate principal amount of 5.0% senior unsecured notes
On June 30, 2009 , we issued $375.0 million aggregate principal amount of 5.0% senior unsecured notes due July 1, 2014 (the 5.0% Notes) with semi-annual fixed interest payments due on January 1 and July 1 of each year, commencing January 1, 2010 . We swapped the fixed interest portion of these notes for a variable interest rate based on the three-month LIBOR plus 2.05%. The variable interest payments based on the variable annual rate are payable quarterly. The LIBOR based rate is set quarterly three months prior to the date of the interest payment. In the second quarter of fiscal 2012, we terminated the interest rate swap agreement. We received $19.8 million in cash proceeds from the swap termination, which included $1.3 million in accrued interest. The proceeds, net of interest received, are disclosed in cash flows from financing activities in our condensed consolidated statements of cash flows. As a result of the termination, the carrying value of the 5.0% Notes was adjusted for the change in fair value of the interest component of the debt up to the date of the termination of the swap in an amount equal to the fair value of the swap, and will be amortized to earnings as a reduction of interest expense over the remaining life of the debt. This amortization is reflected in our condensed consolidated statements of cash flows within operating activities.
$145.0 million term loan facility
On December 22, 2010 , Analog Devices Holdings B.V., our wholly owned subsidiary, entered into a credit agreement with Bank of America, N.A., London Branch as administrative agent. The credit agreement provided for a $145.0 million term loan facility, which was set to mature on December 22, 2013 . During the first quarter of fiscal 2013, we repaid the remaining outstanding principal balance on the loan of $60.1 million and the credit agreement was terminated.
$375.0 million aggregate principal amount of 3.0% senior unsecured notes
On April 4, 2011 , we issued $375.0 million aggregate principal amount of 3.0% senior unsecured notes due April 15, 2016 (the 3.0% Notes) with semi-annual fixed interest payments due on April 15 and October 15 of each year, commencing October 15, 2011.
The indenture governing the 5.0% Notes and 3.0% Notes contains covenants that may limit our ability to: incur, create, assume or guarantee any debt for borrowed money secured by a lien upon a principal property; enter into sale and lease-back transactions with respect to a principal property; and consolidate with or merge into, or transfer or lease all or substantially all of our assets to, any other party. As of February 2, 2013 , we were compliant with these covenants. See Note 13, Debt , of the Notes to our Condensed Consolidated Financial Statements contained in Item 1 of this Quarterly Report on Form 10-Q for further information on our outstanding debt.
Revolving Credit Facility
During December 2012, we terminated our five-year , $165.0 million unsecured revolving credit facility with certain institutional lenders entered into in May 2008 . On December 19, 2012 , we entered into a five-year , $500.0 million senior unsecured revolving credit facility with certain institutional lenders. To date, we have not borrowed under this credit facility but we may borrow in the future and use the proceeds for repayment of existing indebtedness, stock repurchases, acquisitions, capital expenditures, working capital and other lawful corporate purposes. The terms of the facility impose restrictions on our ability to undertake certain transactions, to create certain liens on assets and to incur certain subsidiary indebtedness. In addition, the credit agreement contains a consolidated leverage ratio covenant of total consolidated funded debt to consolidated earnings before interest, taxes, depreciation, and amortization (EBITDA) of not greater than 3.0 to 1.0 . As of February 2, 2013 , we were compliant with these covenants .
Stock Repurchase Program
30
Our common stock repurchase program has been in place since August 2004 . In the aggregate, our Board of Directors has authorized us to repurchase $5.0 billion of our common stock under the program. Under the program, we may repurchase outstanding shares of our common stock from time to time in the open market and through privately negotiated transactions. Unless terminated earlier by resolution of our Board of Directors, the repurchase program will expire when we have repurchased all shares authorized under the program. As of February 2, 2013 , we had repurchased a total of approximately 129.2 million shares of our common stock for approximately $4,439.0 million under this program. As of February 2, 2013 , an additional $561.0 million worth of shares remains available for repurchase under the current authorized program. The repurchased shares are held as authorized but unissued shares of common stock. We also from time to time repurchase shares in settlement of employee tax withholding obligations due upon the vesting of restricted stock units or the exercise of stock options, or in certain limited circumstances to satisfy the exercise price of options granted to our employees under our equity compensation plans. Any future common stock repurchases will be based on several factors, including our financial performance, outlook, liquidity and the amount of cash we have available in the United States.
Capital Expenditures
Net additions to property, plant and equipment were $18.3 million in the first three months of fiscal 2013 and were funded with a combination of cash on hand and cash generated from operations. We expect capital expenditures to be in the range of approximately $90 million to $110 million in fiscal 2013 to be used primarily for our manufacturing and engineering capabilities, which will be funded with a combination of cash on hand and cash generated from operations.
Dividends
On February 18, 2013 , our Board of Directors declared a cash dividend of $0.34 per outstanding share of common stock. The dividend will be paid on March 12, 2013 to all shareholders of record at the close of business on March 1, 2013 and is expected to total approximately $104.0 million. We currently expect quarterly dividends to continue at $0.34 per share, although they remain subject to determination and declaration by our Board of Directors. The payment of future dividends, if any, will be based on several factors, including our financial performance, outlook and liquidity.
Contractual Obligations
In the first quarter of fiscal 2013, we repaid the remaining outstanding principal balance of $60.1 million on our $145.0 million term loan. As a result of the repayment, the amounts previously reflected as “Debt obligations” in the contractual obligations table contained in the section entitled “Management’s Discussion and Analysis of Financial Condition and Results of Operations” of our Annual Report on Form 10-K for the fiscal year ended November 3, 2012 are lower by $60.1 million.
There have not been any other material changes during the first three months of fiscal 2013 to the amounts presented in the table summarizing our contractual obligations included in our Annual Report on Form 10-K for the fiscal year ended November 3, 2012.
New Accounting Pronouncements
From time to time, new accounting pronouncements are issued by the Financial Accounting Standards Board (FASB) that are adopted by us as of the specified effective date. Unless otherwise discussed, management believes that the impact of recently issued standards will not have a material impact on our future financial condition and results of operations. See Note 17, New Accounting Pronouncements , of the Notes to our Condensed Consolidated Financial Statements contained in Item 1 of this Quarterly Report on Form 10-Q for a description of recently issued and adopted accounting pronouncements, including the dates of adoption and impact on our historical financial condition and results of operations.
Critical Accounting Policies and Estimates
There were no material changes in the first three months of fiscal 2013 to the information provided under the heading “Critical Accounting Policies and Estimates” included in our Annual Report on Form 10-K for the fiscal year ended November 3, 2012.
There were no material changes in the first three months of fiscal 2013 to the information provided under Item 7A. “Quantitative and Qualitative Disclosures about Market Risk” set forth in our Annual Report on Form 10-K for the fiscal year ended November 3, 2012.
31
ITEM 3. Quantitative and Qualitative Disclosures About Market Risk
ITEM 4. Controls and Procedures
(a) Evaluation of Disclosure Controls and Procedures . Our management, with the participation of our Chief Executive Officer and Chief Financial Officer, evaluated the effectiveness of our disclosure controls and procedures as of February 2, 2013. The term “disclosure controls and procedures,” as defined in Rules 13a-15(e) and 15d-15(e) under the Securities Exchange Act of 1934, as amended (the “Exchange Act”), means controls and other procedures of a company that are designed to ensure that information required to be disclosed by a company in the reports that it files or submits under the Exchange Act is recorded, processed, summarized and reported, within the time periods specified in the SEC’s rules and forms. Disclosure controls and procedures include, without limitation, controls and procedures designed to ensure that information required to be disclosed by a company in the reports that it files or submits under the Exchange Act is accumulated and communicated to the company’s management, including its principal executive and principal financial officers, as appropriate to allow timely decisions regarding required disclosure. Management recognizes that any controls and procedures, no matter how well designed and operated, can provide only reasonable assurance of achieving their objectives and management necessarily applies its judgment in evaluating the cost-benefit relationship of possible controls and procedures. Based on the evaluation of our disclosure controls and procedures as of February 2, 2013 , our Chief Executive Officer and Chief Financial Officer concluded that, as of such date, our disclosure controls and procedures were effective at the reasonable assurance level.
(b) Changes in Internal Control over Financial Reporting. No change in our internal control over financial reporting (as defined in Rules 13a-15(f) and 15d-15(f) under the Exchange Act) occurred during the quarter ended February 2, 2013 that has materially affected, or is reasonably likely to materially affect, our internal control over financial reporting. PART II — OTHER INFORMATION
Set forth below and elsewhere in this report and in other documents we file with the SEC are descriptions of the risks and uncertainties that could cause our actual results to differ materially from the results contemplated by the forward-looking statements contained in this report. The description below includes any material changes to and supersedes the description of the risk factors affecting our business previously discussed in "Part I, Item 1A Risk Factors” of our Annual Report on Form 10-K for the fiscal year ended November 3, 2012.
Disruptions in global credit and financial markets could materially and adversely affect our business and results of operations.
There is significant continuing uncertainty regarding the stability of global credit and financial markets. These economic uncertainties may lead consumers and businesses to postpone spending, which may cause our customers to cancel, decrease or delay their existing and future orders for our products and make it difficult for us to accurately forecast and plan our future business activities. Uncertainty regarding the future stability of the Euro Zone could cause the value of the Euro to deteriorate, thus reducing the purchasing power of our European customers. In addition, financial difficulties experienced by our suppliers or distributors could result in product delays, increased accounts receivable defaults and inventory challenges. During the past few years, many governments adopted stimulus or spending programs designed to ease the economic impact of the crisis. Some of our businesses benefited from these stimulus programs and there can be no assurance that such programs will continue in the future. If economic conditions deteriorate, we may record additional charges relating to restructuring costs or the impairment of assets and our business and results of operations could be materially and adversely affected.
Our future revenue, gross margins, operating results and net income are difficult to predict and may materially fluctuate.
Our future revenue, gross margins, operating results and net income are difficult to predict and may be materially affected by a number of factors, including:
32
ITEM 1A. Risk Factors
• the effects of adverse economic conditions in the markets in which we sell our products;
• changes in customer demand for our products and for end products that incorporate our products;
• our ability to effectively manage our cost structure in both the short term and over a longer duration;
• the timing of new product announcements or introductions by us, our customers or our competitors;
• competitive pricing pressures;
• fluctuations in manufacturing yields, adequate availability of wafers and other raw materials, and manufacturing, assembly and test
capacity;
• the ability of our third-party suppliers, subcontractors and manufacturers to supply us with sufficient quantities of raw materials,
products and/or components;
In addition, the semiconductor market has historically been cyclical and subject to significant economic upturns and downturns. Our
business is subject to rapid technological changes and there can be no assurance (i) that products stocked in our inventory will not be rendered obsolete before we ship them, or (ii) that we will be able to produce products in a timely fashion to accommodate changing customer demand. As a result of these and other factors, there can be no assurance that we will not experience material fluctuations in future revenue, gross margins, operating results and net income on a quarterly or annual basis. In addition, if our revenue, gross margins, operating results and net income do not meet the expectations of securities analysts or investors, the market price of our common stock may decline.
Changes in our effective tax rate may impact our results of operations.
A number of factors may increase our future effective tax rate, including: changes in tax laws or the interpretation of such tax laws; increases in tax rates in various jurisdictions; variation in the jurisdictions in which profits are earned and taxed; any adverse resolution of ongoing tax audits or adverse rulings from taxing authorities worldwide; changes in the valuation of our deferred tax assets and liabilities; adjustments to income taxes upon finalization of various tax returns; increases in expenses not deductible for tax purposes, including executive compensation subject to the limitations of Section 162(m) of the Internal Revenue Code and amortization of assets acquired in connection with strategic transactions; decreased availability of tax deductions for stock-based compensation awards worldwide; and changes in available tax credits. Any significant increase in our future effective tax rates could adversely impact our net income during future periods.
Long-term contracts are not typical for us and reductions, cancellations or delays in orders for our products could adversely affect our operating results.
We typically do not have long-term sales contracts with our customers. In certain markets where end-user demand may be particularly volatile and difficult to predict, some customers place orders that require us to manufacture product and have it available for shipment, even though the customer is unwilling to make a binding commitment to purchase all, or even any, of the product. In other instances, we manufacture product based on forecasts of customer demands. As a result, we may incur inventory and manufacturing costs in advance of anticipated sales and are subject to the risk of cancellations of orders, leading to a sharp reduction of sales and backlog. Further, orders or forecasts may be for products that meet the customer’s unique requirements so that those canceled or unrealized orders would, in addition, result in an inventory of unsaleable products, causing potential inventory write-offs. As a result of lengthy manufacturing cycles for certain of the products that are subject to these uncertainties, the amount of unsaleable product could be substantial. Incorrect forecasts, or reductions, cancellations or delays in orders for our products could adversely affect our operating results.
Our future success depends upon our ability to continue to innovate, improve our products, develop and market new products, and identify and enter new markets.
Our future success significantly depends on our continued ability to improve our products and develop and market innovative new products. Product development, innovation and enhancement is often a complex, time-consuming and costly process involving significant investment in research and development, with no assurance of return on investment. There can be no assurance that we will be able to develop and introduce new and improved products in a timely or efficient manner or that
33
• any significant decline in our backlog;
• the timing, delay or cancellation of significant customer orders and our ability to manage inventory;
• our ability to hire, retain and motivate adequate numbers of engineers and other qualified employees to meet the demands of our
customers;
• changes in geographic, product or customer mix;
• our ability to utilize our manufacturing facilities at efficient levels;
• potential significant litigation-related costs;
• the difficulties inherent in forecasting future operating expense levels, including with respect to costs associated with labor, utilities,
transportation and raw materials;
• the costs related to compliance with increasing worldwide environmental and social responsibility regulations;
• changes in our effective tax rates in the United States, Ireland or worldwide; and
• the effects of public health emergencies, natural disasters, widespread travel disruptions, security risks, terrorist activities, international
conflicts and other events beyond our control.

new and improved products, if developed, will achieve market acceptance. Our products generally must conform to various evolving and sometimes competing industry standards, which may adversely affect our ability to compete in certain markets or require us to incur significant costs. In addition, our customers generally impose very high quality and reliability standards on our products, which often change and may be difficult or costly to satisfy. Any inability to satisfy customer quality standards or comply with industry standards and technical requirements may adversely affect demand for our products and our results of operations. In addition, our growth is dependent on our continued ability to identify and penetrate new markets where we have limited experience and competition is intense. Also, some of our customers in these markets are less established, which could subject us to increased credit risk. There can be no assurance that the markets we serve will grow in the future, that our existing and new products will meet the requirements of these markets, that our products will achieve customer acceptance in these markets, that competitors will not force price reductions or take market share from us, or that we can achieve or maintain adequate gross margins or profits in these markets. Furthermore, a decline in demand in one or several of our end-user markets could have a material adverse effect on the demand for our products and our results of operations.
We may not be able to compete successfully in markets within the semiconductor industry in the future.
We face intense technological and pricing competition in the semiconductor industry, and we expect this competition to increase in the future, including from companies located outside the United States. Many companies have sufficient financial, manufacturing, technical, sales and marketing resources to develop and market products that compete with our products. Some of our competitors may have more advantageous supply or development relationships with our current and potential customers or suppliers. Our competitors also include emerging companies selling specialized products in markets we serve. Competition is generally based on design and quality of products, product performance, features and functionality, and product pricing, availability and capacity, with the relative importance of these factors varying among products, markets and customers. Existing or new competitors may develop products or technologies that more effectively address the demands of our customers and markets with enhanced performance, features and functionality, lower power requirements, greater levels of integration or lower cost. Increased competition in certain markets has resulted in and may continue to result in declining average selling prices, reduced gross margins and loss of market share in those markets. There can be no assurance that we will be able to compete successfully in the future against existing or new competitors, or that our operating results will not be adversely affected by increased competition.
We rely on third-party suppliers, subcontractors and manufacturers for some industry-standard wafers, manufacturing processes and assembly and test services, and generally cannot control their availability or conditions of supply.
We rely, and plan to continue to rely, on suppliers, assembly and test subcontractors, and third-party wafer fabricators to supply most of our wafers that can be manufactured using industry-standard submicron processes. This reliance involves several risks, including reduced control over availability, capacity utilization, delivery schedules, manufacturing yields, and costs. We currently source a significant percentage of our wafer requirements annually from third-party wafer fabrication foundries, primarily Taiwan Semiconductor Manufacturing Company, or TSMC . In addition, these suppliers often provide manufacturing services to our competitors and therefore periods of increased industry demand may result in capacity constraints. In certain instances, the third-party supplier is the sole source of highly specialized processing services. If our suppliers are unable or unwilling to manufacture and deliver components to us on the time schedule and of the quality or quantity that we require or provide us with required manufacturing processes, we may be forced to seek to engage additional or replacement suppliers, which could result in additional expenses and delays in product development or shipment of product to our customers. If replacement suppliers or manufacturing processes are not available, we may also experience delays in product development or shipment which could, in turn, result in the temporary or permanent loss of customers.
The markets for semiconductor products are cyclical, and increased production may lead to overcapacity and lower prices, and conversely, we may not be able to satisfy unexpected demand for our products.
The cyclical nature of the semiconductor industry has resulted in periods when demand for our products has increased or decreased rapidly. If we expand our operations and workforce too rapidly or procure excessive resources in anticipation of increased demand for our products, and that demand does not materialize at the pace at which we expect, or declines, or if we overbuild inventory in a period of decreased demand, our operating results may be adversely affected as a result of increased operating expenses, reduced margins, underutilization of capacity or asset impairment charges. These capacity expansions by us and other semiconductor manufacturers could also lead to overcapacity in our target markets which could lead to price erosion that would adversely impact our operating results. Conversely, during periods of rapid increases in demand, our available capacity may not be sufficient to satisfy the demand. In addition, we may not be able to expand our workforce and operations in a sufficiently timely manner, procure adequate resources and raw materials, or locate suitable third-party suppliers, to respond effectively to changes in demand for our existing products or to the demand for new products requested by our customers, and our current or future business could be materially and adversely affected.
34

Our semiconductor products are complex and we may be subject to product warranty and indemnity claims, which could result in significant costs and damage to our reputation and adversely affect the market acceptance of our products.
Semiconductor products are highly complex and may contain defects when they are first introduced or as new versions are developed. We generally warrant our products to our customers for one year from the date title passes from us. We invest significant resources in the testing of our products; however, if any of our products contain defects, we may be required to incur additional development and remediation costs, pursuant to warranty and indemnification provisions in our customer contracts and purchase orders. These problems may divert our technical and other resources from other product development efforts and could result in claims against us by our customers or others, including liability for costs associated with product recalls, which may adversely impact our operating results. We may also be subject to customer indemnity claims. Our customers have on occasion been sued, and may in the future be sued, by third parties alleging infringement of intellectual property rights, or damages resulting from use of our products. Those customers may seek indemnification from us under the terms and conditions of our sales contracts with them. In certain cases, our potential indemnification liability may be significant. If any of our products contains defects, or has reliability, quality or compatibility problems, our reputation may be damaged, which could make it more difficult for us to sell our products to existing and prospective customers and could adversely affect our operating results.
We have manufacturing processes that utilize a substantial amount of technology as the fabrication of integrated circuits is a highly complex and precise process. Minute impurities, contaminants in the manufacturing environment, difficulties in the fabrication process, defects in the masks used in the wafer manufacturing process, manufacturing equipment failures, wafer breakage or other factors can cause a substantial percentage of wafers to be rejected or numerous dice on each wafer to be nonfunctional. While we have significant expertise in semiconductor manufacturing, it is possible that some processes could become unstable. This instability could result in manufacturing delays and product shortages, which could have a material adverse effect on our operating results.
We are involved in frequent litigation, including regarding intellectual property rights, which could be costly to bring or defend and could require us to redesign products or pay significant royalties.
The semiconductor industry is characterized by frequent claims and litigation involving patent and other intellectual property rights, including claims arising under our contractual obligations to indemnify our customers. Other companies or individuals have obtained patents covering a variety of semiconductor designs and processes, and we might be required to obtain licenses under some of these patents or be precluded from making and selling infringing products, if those patents are found to be valid and infringed. In the event a third party makes a valid intellectual property claim against us and a license is not available to us on commercially reasonable terms, or at all, we could be forced either to redesign or to stop production of products incorporating that intellectual property, and our operating results could be materially and adversely affected. Litigation may be necessary to enforce our patents or other of our intellectual property rights or to defend us against claims of infringement, and this litigation could be costly and divert the attention of our key personnel. We could be subject to indemnity, warranty or product liability claims that could lead to significant costs and expenses as we defend those claims or pay damage awards. There can be no assurance that we are adequately insured to protect against all claims and potential liabilities. We may incur costs and expenses relating to a recall of our customers’ products due to an alleged failure of components we supply. An adverse outcome in litigation could have a material adverse effect on our financial position or on our operating results or cash flows in the period in which the litigation is resolved.
We may be unable to adequately protect our proprietary intellectual property rights, which may limit our ability to compete effectively.
Our future success depends, in part, on our ability to protect our intellectual property. We primarily rely on patent, mask work, copyright, trademark and trade secret laws, as well as nondisclosure agreements and other methods, to protect our proprietary technologies and processes. Despite our efforts to protect our intellectual property, it is possible that competitors or other unauthorized third parties may obtain, copy, use or disclose our technologies, products and processes. Moreover, the laws of foreign countries in which we design, manufacture, market and sell our products may afford little or no effective protection of our proprietary intellectual property. We may also be subject to security breaches caused by computer viruses, illegal break-ins or hacking, sabotage or acts of vandalism by third parties. Our security measures or those of our third party service providers may not detect or prevent such security breaches. Any such compromise of our information security could result in unauthorized access to our confidential business or proprietary information.
There can be no assurance that the claims allowed in our issued patents will be sufficiently broad to protect our technology. In addition, any of our existing or future patents may be challenged, invalidated or circumvented. As such, any rights granted under these patents may not provide us with adequate protection. We may not be able to obtain foreign patents or pending applications corresponding to our U.S. patents and applications. Even if foreign patents are granted, effective enforcement in foreign countries may not be available. If our patents and mask works do not adequately protect our technology,
35

our competitors may be able to offer products similar to ours. Our competitors may also be able to develop similar technology independently or design around our patents.
We generally enter into confidentiality agreements with our employees, consultants and strategic partners. We also try to control access to and distribution of our technologies, documentation and other proprietary information. Despite these efforts, internal or external parties may attempt to copy, disclose, obtain or use our products or technology without our authorization. Also, former employees may seek employment with our business partners, customers or competitors, and there can be no assurance that the confidential nature of our proprietary information will be maintained in the course of such future employment.
If we do not retain our key personnel, our ability to execute our business strategy will be adversely affected.
Our continued success depends to a significant extent upon the recruitment, retention and effective succession of our executive officers and key management and technical personnel, particularly our experienced engineers. The competition for these employees is intense. The loss of the services of one or more of our key personnel could have a material adverse effect on our operating results. In addition, there could be a material adverse effect on our business should the turnover rates for engineers and other key personnel increase significantly or if we are unable to continue to attract qualified personnel. We do not maintain any key person life insurance policy on any of our officers or employees. To remain competitive, we may need to acquire other companies, purchase or license technology from third parties, or enter into other strategic transactions in order to introduce new products or enhance our existing products.
An element of our business strategy involves expansion through the acquisitions of businesses, assets, products or technologies that allow us to complement our existing product offerings, expand our market coverage, increase our engineering workforce or enhance our technological capabilities. We may not be able to find businesses that have the technology or resources we need and, if we find such businesses, we may not be able to purchase or license the technology or resources on commercially favorable terms or at all. Acquisitions and technology licenses are difficult to identify and complete for a number of reasons, including the cost of potential transactions, competition among prospective buyers and licensees, the need for regulatory approvals, and difficulties related to integration efforts. Both in the U.S. and abroad, governmental regulation of acquisitions has become more complex, increasing the costs and risks of undertaking significant acquisitions. In order to finance a potential transaction, we may need to raise additional funds by issuing securities or borrowing money. We may not be able to find financing on favorable terms, and the sale of our stock may result in the dilution of our existing shareholders or the issuance of securities with rights that are superior to the rights of our common shareholders.
Acquisitions also involve a number of risks, including:
If we are unable to successfully address these risks, we may not realize some or all of the expected benefits of the acquisition, which may have an adverse effect on our business plans and operating results.
We rely on supplies, services and manufacturing capacity located in geologically unstable areas, which could affect our ability to produce products.
We, like many companies in the semiconductor industry, rely on supplies, services, internal manufacturing capacity, wafer fabrication foundries and other sub-contractors in geologically unstable locations around the world. This reliance involves risks associated with the impact of earthquakes on us and the semiconductor industry, including temporary loss of capacity, availability and cost of key raw materials, utilities and equipment and availability of key services, including transport of our products worldwide. For example, in fiscal 2011, our revenue in Japan declined as a result of the severe earthquake and tsunami in that country. In addition, flooding in Thailand and the Philippines in 2012 had disruptive effects on local semiconductor-related businesses. Any prolonged inability to utilize one of our manufacturing facilities, or those of our subcontractors or third-party wafer fabrication foundries, as a result of fire, flood, natural disaster, unavailability of utilities or
36
• difficulty integrating acquired technologies, operations and personnel with our existing businesses;
• diversion of management attention in connection with both negotiating the acquisitions and integrating the assets;
• strain on managerial and operational resources as management tries to oversee larger operations;
• the future funding requirements for acquired companies, which may be significant;
• potential loss of key employees;
• exposure to unforeseen liabilities of acquired companies; and
• increased risk of costly and time-consuming litigation.
otherwise, could result in a temporary or permanent loss of customers for affected products, which could have a material adverse effect on our results of operations and financial condition.
We are exposed to business, economic, political, legal and other risks through our significant worldwide operations.
We have significant operations and manufacturing facilities outside the United States, including in Ireland and the Philippines. Approximately 67% of our revenue is derived from customers in international markets. Although we engage in hedging transactions to reduce our exposure to currency exchange rate fluctuations, there can be no assurance that our competitive position will not be adversely affected by changes in the exchange rate of the United States dollar against other currencies. Potential interest rate increases, as well as high energy costs, could have an adverse impact on industrial and consumer spending patterns and could adversely impact demand for our products. At February 2, 2013, our principal source of liquidity was $3,987.0 million of cash and cash equivalents and short-term investments, of which approximately $1,137.0 million was held in the United States and the remaining balance was held outside the United States in various foreign subsidiaries. As we intend to reinvest our foreign earnings indefinitely, this cash held outside the United States is not readily available to meet our cash requirements in the United States. We require a substantial amount of cash in the United States for operating requirements, stock repurchases, cash dividends and acquisitions. If we are unable to address our U.S. cash requirements through operations, through borrowings under our current credit facility, through future debt or equity offerings or from other sources of cash obtained at an acceptable cost, it may be necessary for us to consider repatriation of earnings that are permanently reinvested, and we may be required to pay additional taxes under current tax laws, which could have a material effect on our results of operations and financial condition.
In addition to being exposed to the ongoing economic cycles in the semiconductor industry, we are also subject to the economic, political and legal risks inherent in international operations, including the risks associated with the recent crisis in global credit and financial markets, ongoing uncertainties and political and economic instability in many countries around the world, as well as economic disruption from acts of terrorism and the response to them by the United States and its allies. Other business risks associated with global operations include increased managerial complexities, air transportation disruptions, expropriation, currency controls, currency exchange rate movement, additional costs related to foreign taxes, tariffs and freight rate increases, exposure to different business practices and legal standards, particularly with respect to price protection, competition practices, intellectual property, anti-corruption and environmental compliance, trade and travel restrictions, pandemics, import and export license requirements and restrictions, difficulties in staffing and managing worldwide operations, and accounts receivable collections. We also incur significant costs associated with our foreign defined benefit pension plans. There can be no assurance that the value of the plan assets will be sufficient in the future and it is possible that we may be required to make higher cash contributions to the plans in future years, which would reduce the cash available for other business purposes.
We expect to continue to expand our business and operations in China. Our success in the Chinese markets may be adversely affected by China’s continuously evolving laws and regulations, including those relating to taxation, import and export tariffs, currency controls, environmental regulations, indigenous innovation, and intellectual property rights and enforcement of those rights. Enforcement of existing laws or agreements may be inconsistent. In addition, changes in the political environment, governmental policies or U.S.-China relations could result in revisions to laws or regulations or their interpretation and enforcement, exposure of our proprietary intellectual property, increased taxation, restrictions on imports, import duties or currency revaluations, which could have an adverse effect on our business plans and operating results.
Our operating results are dependent on the performance of independent distributors.
A significant portion of our sales are through independent distributors that are not under our control. These independent distributors generally represent product lines offered by several companies and thus could reduce their sales efforts applied to our products or they could terminate their representation of us. We generally do not require letters of credit from our distributors and are not protected against accounts receivable default or declarations of bankruptcy by these distributors. Our inability to collect open accounts receivable could adversely affect our operating results. Termination of a significant distributor, whether at our initiative or the distributor’s initiative or through consolidation in the distribution industry, could disrupt our current business, and if we are unable to find suitable replacements, our operating results could be adversely affected.
We are subject to increasingly strict environmental, health and safety (EHS) regulations, which could increase our expenses and affect our operating results.
Our industry is subject to increasingly strict EHS requirements, particularly those environmental requirements that control and restrict the sourcing, use, transportation, emission, discharge, storage and disposal of certain chemicals, minerals, elements and materials used or produced in the semiconductor manufacturing process. Public attention to environmental,
37
sustainability and social responsibility concerns continues to increase, and our customers routinely include stringent environmental and other standards in their contracts with us. Changes in environmental laws or regulations may require us to invest in costly equipment or alter the way our products are made. In addition, we use hazardous and other regulated materials that subject us to risks of strict liability for damages caused by potential or actual releases of such materials. Any failure to control such materials adequately or to comply with statutory or regulatory standards or contractual obligations could result in liability for damages, penalties, and civil and criminal fines, and might damage our reputation, increase our expenses, and adversely affect our operating results.
New climate change laws and regulations could require us to change our manufacturing processes or obtain substitute materials that may cost more or be less available for our manufacturing operations. In addition, new restrictions on emissions of carbon dioxide or other greenhouse gases could result in significant costs for us. The Commonwealth of Massachusetts has adopted greenhouse gas regulations, and the U.S. Congress may pass federal greenhouse gas legislation in the future. The U.S. Environmental Protection Agency (EPA) has issued greenhouse gas reporting regulations that may apply to certain of our operations. The EPA is developing other climate change-based regulations, as are certain states, that also may increase our expenses and adversely affect our operating results. We expect increased worldwide regulatory activity relating to climate change in the future. Compliance with these laws and regulations has not had a material impact on our capital expenditures, earnings, financial condition or competitive position. There is no assurance that the cost to comply with current or future EHS laws and regulations will not exceed our estimates or adversely affect our financial condition or results of operations. Additionally, any failure by us to comply with applicable EHS requirements or contractual obligations could result in penalties, civil and criminal fines, suspension of or changes to production, legal liability and damage to our reputation.
If we are unable to generate sufficient cash flow, we may not be able to service our debt obligations, including making payments on our two issuances of $375.0 million senior unsecured notes.
In fiscal 2009, we issued in a public offering $375.0 million aggregate principal amount of 5.0% senior unsecured notes due July 1, 2014. In April 2011, we issued in a public offering $375.0 million aggregate principal amount of 3.0% senior unsecured notes due April 15, 2016. Our ability to make payments of principal and interest on our indebtedness when due depends upon our future performance, which will be subject to general economic conditions, industry cycles and financial, business and other factors affecting our consolidated operations, many of which are beyond our control. If we are unable to generate sufficient cash flow from operations in the future to service our outstanding debt, we may be required to, among other things:
Such measures might not be sufficient to enable us to service our debt, including the notes, which could negatively impact our financial results. In addition, any such financing, refinancing or sale of assets might not be possible on economically favorable terms.
Restrictions in our revolving credit facility and outstanding debt instruments may limit our activities.
Our current revolving credit facility and our 5.0% and 3.0% senior unsecured notes impose, and future debt instruments to which we may become subject may impose, restrictions that limit our ability to engage in activities that could otherwise benefit our company, including to undertake certain transactions, to create certain liens on our assets and to incur certain subsidiary indebtedness. Our ability to comply with these financial restrictions and covenants is dependent on our future performance, which is subject to prevailing economic conditions and other factors, including factors that are beyond our control such as foreign exchange rates, interest rates, changes in technology and changes in the level of competition. In addition, our revolving credit facility requires us to maintain compliance with specified financial ratios. If we breach any of the covenants under our revolving credit facility or the indenture governing our outstanding notes and do not obtain appropriate waivers, then, subject to applicable cure periods, our outstanding indebtedness thereunder could be declared immediately due and payable.
Our stock price may be volatile.
38
• seek additional financing in the debt or equity markets;
• refinance or restructure all or a portion of our indebtedness, including the notes;
• borrow under our existing revolving credit facility;
• divert funds that would otherwise be invested in our operations;
• sell selected assets; or
• reduce or delay planned capital expenditures or operating expenditures.

The market price of our common stock has been volatile in the past and may be volatile in the future, as it may be significantly affected by the following factors:
The stock market has historically experienced volatility, especially within the semiconductor industry, that often has been unrelated to the performance of particular companies. These market fluctuations may cause our stock price to fall regardless of our operating results.
39
• crises in global credit, debt and financial markets;
• actual or anticipated fluctuations in our revenue and operating results;
• changes in financial estimates by securities analysts or our failure to perform in line with those estimates or our published guidance;
• changes in market valuations of other semiconductor companies;
• announcements by us or our competitors of significant new products, technical innovations, material transactions, acquisitions or
dispositions, litigation or capital commitments;
• departures of key personnel;
• alleged noncompliance with laws, regulations or ethics standards by us or any of our employees, officers or directors; and
• negative media publicity targeting us or our suppliers, customers or competitors.

Issuer Purchases of Equity Securities
The exhibits listed in the Exhibit Index immediately preceding the exhibits are filed as part of this Quarterly Report on Form 10-Q and such Exhibit Index is incorporated herein by reference.
40
ITEM 2. Unregistered Sales of Equity Securities and Use of Proceeds
Period
Total Number of Shares Purchased
(a) Average Price
Paid Per Share (b)
Total Number of Shares Purchased as
Part of Publicly Announced Plans or
Programs (c)
Approximate Dollar Value of Shares that
May Yet Be Purchased Under
the Plans or Programs
November 4, 2012 through December 1, 2012 1,393
$ 39.73 —
$ 560,974,387
December 2, 2012 through December 29, 2012 1,040
$ 41.55 —
$ 560,974,387
December 30, 2012 through February 2, 2013
397,371
$ 42.54
—
$ 560,974,387
Total 399,804 $ 42.52 — $ 560,974,387
(a) Includes 399,804 shares withheld by us from employees to satisfy employee tax obligations upon vesting of restricted stock units granted to our employees under our equity compensation plans.
(b) The average price paid per share of stock repurchased under the stock repurchase program includes the commissions paid to the brokers. The average price paid for shares in connection with vesting of restricted stock are averages of the closing stock price at the vesting date which is used to calculate the number of shares to be withheld.
(c) Shares repurchased pursuant to the stock repurchase program publicly announced on August 12, 2004. In the aggregate, our Board of Directors has authorized us to repurchase $5 billion of our common stock. Under the repurchase program, we may repurchase outstanding shares of our common stock from time to time in the open market and through privately negotiated transactions. Unless terminated earlier by resolution of our Board of Directors, the repurchase program will expire when we have repurchased all shares authorized for repurchase under the repurchase program.
ITEM 6. Exhibits

SIGNATURES
Pursuant to the requirements of the Securities Exchange Act of 1934, the registrant has duly caused this report to be signed on its behalf by the undersigned thereunto duly authorized.
41
ANALOG DEVICES, INC.
Date: February 19, 2013 By: / S / J ERALD G. F ISHMAN
Jerald G. Fishman
Chief Executive Officer
(Principal Executive Officer)
Date: February 19, 2013 By: / S / D AVID A. Z INSNER
David A. Zinsner
Vice President, Finance
and Chief Financial Officer
(Principal Financial Officer)
Attached as Exhibit 101 to this report are the following formatted in XBRL (Extensible Business Reporting Language): (i) Condensed Consolidated Statements of Income for the three months ended February 2, 2013 and February 4, 2012, (ii) Condensed Consolidated Statements of Comprehensive Income for the three months ended February 2, 2013 and February 4, 2012, (iii) Condensed Consolidated Balance Sheets at February 2, 2013 and November 3, 2012, (iv) Condensed Consolidated Statements of Cash Flows for the three months ended February 2, 2013 and February 4, 2012 and (v) Notes to Condensed Consolidated Financial Statements.
42
Exhibit Index
Exhibit No. Description
10.1
Credit Agreement, dated as of December 19, 2012, among Analog Devices, Inc., as Borrower, Bank of America, N.A. as Administrative Agent, Swing Line Lender and L/C Issuer, and each lender from time to time party thereto, filed as an exhibit to the Company's Current Report on Form 8-K (File No. 1-7819) as filed with the Commission on December 20, 2012 and incorporated herein by reference.
31.1†
Certification Pursuant to Rule 13a-14(a) and 15d-14(a) of the Securities Exchange Act, as Adopted Pursuant to Section 302 of the Sarbanes-Oxley Act of 2002 (Chief Executive Officer).
31.2†
Certification Pursuant to Rule 13a-14(a) and 15d-14(a) of the Securities Exchange Act, as Adopted Pursuant to Section 302 of the Sarbanes-Oxley Act of 2002 (Chief Financial Officer).
32.1† Certification Pursuant to 18 U.S.C. Section 1350 (Chief Executive Officer).
32.2† Certification Pursuant to 18 U.S.C. Section 1350 (Chief Financial Officer).
101.INS XBRL Instance Document.**
101.SCH XBRL Schema Document.**
101.CAL XBRL Calculation Linkbase Document.**
101.LAB XBRL Labels Linkbase Document.**
101.PRE XBRL Presentation Linkbase Document.**
101.DEF XBRL Definition Linkbase Document.**
† Filed or furnished herewith.
** Submitted electronically herewith.

Exhibit 31.1
CERTIFICATION
I, Jerald G. Fishman, certify that:
1. I have reviewed this quarterly report on Form 10-Q of Analog Devices, Inc.;
2. Based on my knowledge, this report does not contain any untrue statement of a material fact or omit to state a material fact necessary to make the statements made, in light of the circumstances under which such statements were made, not misleading with respect to the period covered by this report;
3. Based on my knowledge, the financial statements, and other financial information included in this report, fairly present in all material respects the financial condition, results of operations and cash flows of the registrant as of, and for, the periods presented in this report;
4. The registrant’s other certifying officer and I are responsible for establishing and maintaining disclosure controls and procedures (as defined in Exchange Act Rules 13a-15(e) and 15d-15(e)) and internal control over financial reporting (as defined in Exchange Act Rules 13a-15(f) and 15d-15(f)) for the registrant and have:
a) Designed such disclosure controls and procedures, or caused such disclosure controls and procedures to be designed under our supervision, to ensure that material information relating to the registrant, including its consolidated subsidiaries, is made known to us by others within those entities, particularly during the period in which this report is being prepared;
b) Designed such internal control over financial reporting, or caused such internal control over financial reporting to be designed under our supervision, to provide reasonable assurance regarding the reliability of financial reporting and the preparation of financial statements for external purposes in accordance with generally accepted accounting principles;
c) Evaluated the effectiveness of the registrant’s disclosure controls and procedures and presented in this report our conclusions about the effectiveness of the disclosure controls and procedures, as of the end of the period covered by this report based on such evaluation; and
d) Disclosed in this report any change in the registrant’s internal control over financial reporting that occurred during the registrant’s most recent fiscal quarter (the registrant’s fourth fiscal quarter in the case of an annual report) that has materially affected, or is reasonably likely to materially affect, the registrant’s internal control over financial reporting; and
5. The registrant’s other certifying officer and I have disclosed, based on our most recent evaluation of internal control over financial reporting, to the registrant’s auditors and the audit committee of the registrant’s board of directors (or persons performing the equivalent functions):
a) All significant deficiencies and material weaknesses in the design or operation of internal control over financial reporting which are reasonably likely to adversely affect the registrant’s ability to record, process, summarize and report financial information; and
b) Any fraud, whether or not material, that involves management or other employees who have a significant role in the registrant’s internal control over financial reporting.
Dated: February 19, 2013 /s/ Jerald G. Fishman
Jerald G. Fishman
Chief Executive Officer
(Principal Executive Officer)
Exhibit 31.2
CERTIFICATION
I, David A. Zinsner, certify that:
1. I have reviewed this quarterly report on Form 10-Q of Analog Devices, Inc.;
2. Based on my knowledge, this report does not contain any untrue statement of a material fact or omit to state a material fact necessary to make the statements made, in light of the circumstances under which such statements were made, not misleading with respect to the period covered by this report;
3. Based on my knowledge, the financial statements, and other financial information included in this report, fairly present in all material respects the financial condition, results of operations and cash flows of the registrant as of, and for, the periods presented in this report;
4. The registrant’s other certifying officer and I are responsible for establishing and maintaining disclosure controls and procedures (as defined in Exchange Act Rules 13a-15(e) and 15d-15(e)) and internal control over financial reporting (as defined in Exchange Act Rules 13a-15(f) and 15d-15(f)) for the registrant and have:
a) Designed such disclosure controls and procedures, or caused such disclosure controls and procedures to be designed under our supervision, to ensure that material information relating to the registrant, including its consolidated subsidiaries, is made known to us by others within those entities, particularly during the period in which this report is being prepared;
b) Designed such internal control over financial reporting, or caused such internal control over financial reporting to be designed under our supervision, to provide reasonable assurance regarding the reliability of financial reporting and the preparation of financial statements for external purposes in accordance with generally accepted accounting principles;
c) Evaluated the effectiveness of the registrant’s disclosure controls and procedures and presented in this report our conclusions about the effectiveness of the disclosure controls and procedures, as of the end of the period covered by this report based on such evaluation; and
d) Disclosed in this report any change in the registrant’s internal control over financial reporting that occurred during the registrant’s most recent fiscal quarter (the registrant’s fourth fiscal quarter in the case of an annual report) that has materially affected, or is reasonably likely to materially affect, the registrant’s internal control over financial reporting; and
5. The registrant’s other certifying officer and I have disclosed, based on our most recent evaluation of internal control over financial reporting, to the registrant’s auditors and the audit committee of the registrant’s board of directors (or persons performing the equivalent functions):
a) All significant deficiencies and material weaknesses in the design or operation of internal control over financial reporting which are reasonably likely to adversely affect the registrant’s ability to record, process, summarize and report financial information; and
b) Any fraud, whether or not material, that involves management or other employees who have a significant role in the registrant’s internal control over financial reporting.
Dated: February 19, 2013 /s/ David A. Zinsner
David A. Zinsner
Vice President, Finance
and Chief Financial Officer
(Principal Financial Officer)

Exhibit 32.1 Certification Pursuant to 18 U.S.C. Section 1350,
As Adopted Pursuant to Section 906 of the Sarbanes-Oxley Act of 2002
In connection with the Quarterly Report on Form 10-Q of Analog Devices, Inc. (the “Company”) for the period ended February 2, 2013 as filed with the Securities and Exchange Commission on the date hereof (the “Report”), the undersigned, Jerald G. Fishman, Chief Executive Officer of the Company, hereby certifies, pursuant to 18 U.S.C. Section 1350, that:
1. The Report fully complies with the requirements of Section 13(a) or 15(d) of the Securities Exchange Act of 1934; and
2. The information contained in the Report fairly presents, in all material respects, the financial condition and results of operations of the Company.
Dated: February 19, 2013 /s/ Jerald G. Fishman
Jerald G. Fishman
Chief Executive Officer

Exhibit 32.2 Certification Pursuant to 18 U.S.C. Section 1350,
As Adopted Pursuant to Section 906 of the Sarbanes-Oxley Act of 2002
In connection with the Quarterly Report on Form 10-Q of Analog Devices, Inc. (the “Company”) for the period ended February 2, 2013 as filed with the Securities and Exchange Commission on the date hereof (the “Report”), the undersigned, David A. Zinsner, Chief Financial Officer of the Company, hereby certifies, pursuant to 18 U.S.C. Section 1350, that:
1. The Report fully complies with the requirements of Section 13(a) or 15(d) of the Securities Exchange Act of 1934; and
2. The information contained in the Report fairly presents, in all material respects, the financial condition and results of operations of the Company.
Dated: February 19, 2013 /s/ David A. Zinsner
David A. Zinsner
Chief Financial Officer