Embed Size (px)
Citation preview

Anaemia Strategy Review 1 | 1 4 0
UNHCR
Anaemia Strategy Review
Josephine Pringle and Andrew Seal
University College London
May 2013

Anaemia Strategy Review 2 | 1 4 0
TABLE OF CONTENTS
LIST OF FIGURES ..................................................................................................................... 5
LIST OF TABLES ....................................................................................................................... 7
ACKNOWLEDGEMENTS .......................................................................................................... 9
DISCLAIMER ............................................................................................................................ 9
ABBREVIATIONS .................................................................................................................... 10
EXECUTIVE SUMMARY .......................................................................................................... 11
RECOMMENDATIONS FOR THE REVISION OF THE ANAEMIA STRATEGY ................... 15
CHAPTER 1: INTRODUCTION TO THE REVIEW ................................................................. 19
Background .......................................................................................................................... 19
Methodology.........................................................................................................................20
Objectives of the review ....................................................................................................... 21
Classification and categories of malnutrition and anaemia................................................. 23
Scope and data analysis for the review ................................................................................ 24
Challenges with data collection and evaluation ................................................................... 24
CHAPTER 2: AN OVERVIEW OF THE UNHCR ANAEMIA STRATEGY AND ITS
MANAGEMENT ...................................................................................................................... 26
Summary of strategy objectives ........................................................................................... 26
Format of the strategy document ......................................................................................... 26
Management of the strategy ................................................................................................. 27
CHAPTER 3: ANALYSIS OF STRATEGY OBJECTIVES AT HEADQUARTER LEVEL ......... 28
Overview of strategy impact ................................................................................................. 28
Prevention of anaemia ......................................................................................................... 28
Public health and reproductive health activities ..................................................................30
Detection and management of anaemia .............................................................................. 31
Monitoring and evaluation................................................................................................... 32
Capacity building ................................................................................................................. 34
Additional Anaemia Strategy objectives .............................................................................. 35
CHAPTER 4: ANALYSIS OF STRATEGY ACTIVITIES AT COUNTRY LEVEL AND TREND
ANALYSIS OF NUTRITIONAL INDICATORS ........................................................................ 37
A) BANGLADESH ................................................................................................................ 37
I) Background and context ............................................................................................... 37
II) Anaemia Strategy funding and management .............................................................. 39
III) Anaemia Strategy activities ........................................................................................ 39
IV) Trend analysis of nutritional indicators ..................................................................... 42

Anaemia Strategy Review 3 | 1 4 0
B) NEPAL ................................................................................................................................. 50
I) Background and context ............................................................................................... 50
II) Anaemia Strategy funding and management .............................................................. 52
III) Anaemia Strategy activities ........................................................................................ 53
IV) Trend analysis for nutritional indicators ................................................................... 56
C) ALGERIA ............................................................................................................................. 62
I) Background and context ............................................................................................... 62
II) Anaemia Strategy funding and management .............................................................. 63
III) Anaemia Strategy activities ........................................................................................ 64
IV) Trend analysis for nutritional indicators ................................................................... 66
D) YEMEN ............................................................................................................................... 67
I) Background and context ............................................................................................... 67
II) Anaemia Strategy funding and management .............................................................. 70
III) Anaemia Strategy activities ........................................................................................ 71
IV) Trend analysis for nutritional indicators ................................................................... 74
E) ETHIOPIA .......................................................................................................................... 81
I) Background and context .............................................................................................. 81
II) Anaemia Strategy funding and management .............................................................. 85
III) Anaemia Strategy activities ........................................................................................86
IV) Trend analysis of nutritional indicators – camps other than Dollo Ado, Ethiopia .... 91
V) Trend analysis of nutritional indicators – Dollo Ado camps ....................................... 94
F) KENYA ............................................................................................................................... 101
I) Background and context ................................................................................................. 101
II) Anaemia Strategy funding and management ............................................................... 104
III) Anaemia Strategy activities ......................................................................................... 105
IV) Trend analysis of nutritional indicators - Kakuma ...................................................... 109
V) Trend analysis of nutritional indicators – Dadaab ........................................................ 114
G) DJIBOUTI ......................................................................................................................... 120
I) Background and context ................................................................................................. 120
II) Anaemia Strategy funding and management ............................................................... 122
III) Anaemia Strategy activities ......................................................................................... 123
IV) Trend analysis of nutritional indicators ...................................................................... 126
CHAPTER 5: SUMMARY OF CHANGES IN ANAEMIA PREVALENCE ............................. 132
CHAPTER 6: ANALYSIS AND INTERPRETATION OF THE FINDINGS ............................ 136
CHAPTER 7: DISCUSSION AND CONCLUSIONS ............................................................... 143
APPENDIX ............................................................................................................................. 149

Anaemia Strategy Review 4 | 1 4 0
Summary of country interventions and activities relevant to the anaemia strategy ......... 149
Overview of special nutritional products ........................................................................... 150
Capacity building for SENS ................................................................................................. 151

Anaemia Strategy Review 5 | 1 4 0
LIST OF FIGURES Figure 1: Causes of anaemia in low and middle-income countries .................................................. 19 Figure 2: Population of Nayapara and Kutupalong, 2008-2012 ...................................................... 37 Figure 3: Allocated funds from High Commissioner special fund ................................................... 39 Figure 4: Incidence of Intestinal Worms, Bangladesh, both camps ................................................. 42 Figure 5: Global Acute Malnutrition (GAM), Stunting and Total Anaemia prevalence in 6-59 months, Bangladesh ................................................................................................................................ 44 Figure 6: Total Anaemia (<11g/dl and <10g/dl) in 6-59 months, Bangladesh .................................. 45 Figure 7: Anaemia Severity Categories in 6-59 months, Bangladesh .............................................. 45 Figure 8: Mean Haemoglobin in 6-59 month children, Bangladesh ................................................ 46 Figure 9: Trends in Total Anaemia (<11g/dl) in 6-23 and 24-59 month children, Bangladesh .......... 47
Figure 10: Trends in Anaemia <10g/dl in 6-23 and 24-59 months, Bangladesh ............................... 47 Figure 11: Mean Haemoglobin in 6-23 and 24-59 months, Bangladesh .......................................... 48 Figure 12: Anaemia Severity Categories in Non-Pregnant Women, Bangladesh .............................. 48 Figure 13: Population of refugee camps in Nepal during period of Anaemia Strategy ..................... 50 Figure 14: Suspected Malaria Incidence in children 6-59 months, Nepal (2008-2012) ..................... 51
Figure 15: Incidence of intestinal worms in 6-59 months, Nepal (HIS data) .................................... 55 Figure 16: Global Acute Malnutrition (GAM), Stunting and Total Anaemia prevalence in 6-59 month children, Nepal ........................................................................................................................... 57 Figure 17: Trends of Total Anaemia (<11g/dl and <10g/dl) in 6-59 months, Nepal ......................... 58 Figure 18: Anaemia Severity Categories in 6-59 months, Nepal ..................................................... 58 Figure 19: Mean Haemoglobin in 6-59 months, Nepal .................................................................. 59
Figure 20: Prevalence of Total Anaemia (<11g/dl) in 6-23 and 24-59 months, Nepal ..................... 60 Figure 21: Prevalence of Total Anaemia (<10g/dl) in 6-23 and 24-59 months, Nepal ..................... 60
Figure 22: Mean Haemoglobin in 6-23 and 24-59 months, Nepal .................................................. 60 Figure 23: Population of Kharaz camp during period of Anaemia Strategy .....................................68 Figure 24: Confirmed Malaria Incidence in children 6-59 months, Yemen (2008-2012) ..................68 Figure 25: NutVal analysis of the general ration contents, Yemen, 2010 ......................................... 69 Figure 26 : Summary of Nutrition Services in four locations of Kharaz, Kharaz surrounding villages, Basateen and Sana’a, Yemen 2009............................................................................................... 70 Figure 27: Global Acute Malnutrition (GAM), Stunting and Total Anaemia prevalence in 6-59 months, Yemen .......................................................................................................................... 75 Figure 28: Total Anaemia (<11g/dl and <10g/dl) in 6-59 months, Yemen ....................................... 76 Figure 29: Anaemia Severity Categories in 6-59 months, Yemen ................................................... 76 Figure 30: Mean Haemoglobin in 6-59 months, Yemen ................................................................. 76 Figure 31: Prevalence of Total Anaemia (<11g/dl) in 6-23 months and 24-59 months, Yemen ......... 77
Figure 32: Prevalence of Total Anaemia (<10g/dl) in 6-23 months and 24-59 months, Yemen ......... 78 Figure 33: Mean Haemoglobin in 6-23 and 24-59 months, Yemen ................................................. 79 Figure 34: Population of refugee camps during period of Anaemia Strategy, Ethiopia ..................... 82 Figure 35: Incidence of Watery Diarrhoea in children 6-59 months, Ethiopia, various camps ........... 83
Figure 36: Incidence of Suspected Malaria in 6-59 months - Mai'Aini ........................................... 88 Figure 37: Incidence of Suspected Malaria in 6-59 months - Shimelba ...........................................89 Figure 38 : Incidence of Intestinal Worms in children 6-59 month, Ethiopia, various camps ............89 Figure 39: Total Anaemia prevalence (<11g/dl) in 6-59 months, Ethiopia, older camps ................... 91
Figure 40: Stunting in 6-59 months, Ethiopia, older camps ............................................................ 92 Figure 41: GAM in 6-59 months, Ethiopia, older camps ................................................................ 92 Figure 42: Prevalence of Anaemia (<12/g/dl) in Non-Pregnant Women, Ethiopia, older camps ........ 93

Anaemia Strategy Review 6 | 1 4 0
Figure 43: Total Anaemia prevalence (<11g/dl and <10g/dl) in 6-59 months, Ethiopia, Dollo Ado ... 94 Figure 44: Stunting in 6-59 months, Ethiopia, Dollo Ado .............................................................. 95 Figure 45: Global Acute Malnutrition prevalence in 6-59 months, Ethiopia, Dollo Ado ................... 95 Figure 46: Anaemia Severity in children 6-59 months, Ethiopia, Dollo Ado ................................... 96 Figure 47: Mean Haemoglobin in 6-59 months Ethiopia, Dollo Ado .............................................. 96 Figure 48: Total Anaemia (<11g/dl) in 6-23 months and 24-59 months, Ethiopia, Dollo Ado........... 97 Figure 49: Total Anaemia (<10g/dl) in 6-23 months and 24-59 months, Ethiopia, Dollo Ado........... 97 Figure 50: Prevalence of Anaemia in Non-Pregnant Women, Ethiopia, Dollo Ado ..........................98 Figure 51: Mean Haemoglobin in Non-Pregnant Women, Ethiopia, Dollo Ado .............................. 99 Figure 52: Total population in Kakuma and Dadaab, 3 camps, 2008-2012 .................................... 102 Figure 53: Malaria incidence in Kakuma 2008-2012 ................................................................... 103 Figure 54: Incidence of Intestinal Worms, Kakuma ..................................................................... 108
Figure 55: Global Acute Malnutrition (GAM), Stunting and Total Anaemia prevalence in 6-59 months, Kakuma ...................................................................................................................... 110 Figure 56: Mean Haemoglobin in 6-59 months, Kakuma ............................................................. 110 Figure 57: Total Anaemia (<11g/dl and <10g/dl) in 6-59 months, Kakuma .................................... 111 Figure 58: Anaemia Severity in children 6-59 months .................................................................. 111 Figure 59: Trends in Total Anaemia (<11g/dl) in 6-23 and 24-59 months, Kakuma ........................ 112 Figure 60: Trends in Anaemia <10g/dl in 6-23 and 24-59 months, Kakuma ................................... 112 Figure 61: Mean Haemoglobin in 6-23 months and 24-59 months ................................................. 113 Figure 62: Trends in total anaemia <12g/dl in non-pregnant women, Kakuma ............................... 113 Figure 63: Global Acute Malnutrition (GAM), Stunting and Total Anaemia prevalence in 6-59 months, Dadaab ......................................................................................................................... 114 Figure 64: Total Anaemia (<11g/dl and <10g/dl) in 6-59 months, Dadaab ..................................... 115 Figure 65: Anaemia Severity Categories in 6-59 months, Dadaab ................................................. 115 Figure 66: Mean Haemoglobin in 6-59 months, Dadaab ............................................................... 116 Figure 67: Prevalence of Total Anaemia (<11g/dl) in 6-23 months and 24-59 months, Dadaab ....... 116
Figure 68: Prevalence of Total Anaemia (<10g/dl) in 6-23 months and 24-59 months, Dadaab ....... 116 Figure 69: Mean Haemoglobin in 6-23 and 24-59 months, Dadaab ............................................... 117 Figure 70: Total anaemia trends (<12 g/dl) in non-pregnant women, Dadaab ................................ 118 Figure 71: Total population in Ali Addeh camp, Djibouti ............................................................ 120 Figure 72: Malaria incidence in Ali Addeh 2009-2012 ................................................................. 121 Figure 73: Global Acute Malnutrition (GAM), Stunting and Total Anaemia prevalence in 6-59 months, Djibouti ....................................................................................................................... 126 Figure 74: Total Anaemia (<11g/dl and <10g/dl) in 6-59 months, Djibouti .................................. 127 Figure 75: Anaemia Severity Categories in 6-59 months, Djibouti .............................................. 127 Figure 76: Prevalence of Total Anaemia (<11g/dl) in 6-23 and 24-59 months, Djibouti ................. 128 Figure 77: Prevalence of Total Anaemia (<10g/dl) in 6-23 and 24-59 months, Djibouti ................. 129
Figure 78: Mean Haemoglobin in children 6-59, 6-23 and 24-59 months, Djibouti ........................ 129 Figure 79: Prevalence of Anaemia (<12g/dl) in Non-Pregnant Women, Djibouti ........................... 130 Figure 80: Mean Haemoglobin in Non-Pregnant Women, Djibouti ............................................... 131 Figure 81: Comparison of Anaemia <11g/dl and <10g/dl for age categories, Bangladesh................ 141
Figure 82: Proposed positioning of the revised Anaemia Strategy in relation of other Strategic Plans*................................................................................................................................................ 143 Figure 83: Older Child consuming Nutributter® sachet in refugee camp in Djibouti ..................... 146 Figure 84: Capacity building initiative for SENS ......................................................................... 151

Anaemia Strategy Review 7 | 1 4 0
LIST OF TABLES Table 1: Classification of malnutrition and cut-offs ....................................................................... 23 Table 2: Anaemia severity categories for children 6-59 months and non-pregnant women ............... 23 Table 3: Classification of the severity of GAM, stunting and anaemia in refugee settings ................ 23
Table 4: Key information on Bangladesh ...................................................................................... 37 Table 5: Quantities and food items distributed in Bangladesh, 2013 ............................................... 38 Table 6: NutVal analysis of the general ration contents, Bangladesh .............................................. 39 Table 7: Blanket SFP interventions implemented, Bangladesh ...................................................... 40 Table 8: Coverage and Consumption of MNP ............................................................................... 41 Table 9: Mean Haemoglobin in Non-Pregnant Women, Bangladesh............................................... 49 Table 10: Key information, Nepal ................................................................................................ 50 Table 11: Quantities and food items distributed in 2011, Nepal ...................................................... 51 Table 12: NutVal analysis of the general ration contents, Nepal ..................................................... 52 Table 13: Allocated funds from High Commissioner - Nepal ......................................................... 52 Table 14: Blanket SFP intervention implemented, Nepal ............................................................... 53 Table 15: Prevalence of foods consumed in the previous 24 hours, by time of survey, Nepal ........... 55
Table 16: Key information, Algeria ............................................................................................. 62 Table 17: Quantities and food items distributed, Tindouf camps, Algeria........................................ 62 Table 18: NutVal analysis of the general ration contents, Algeria ................................................... 63 Table 19: Allocated funds from High Commissioner special fund .................................................. 63 Table 20: Blanket SFP intervention implemented, Algeria ............................................................. 64 Table 21: Key information on Yemen .......................................................................................... 67 Table 22: Quantities and food items distributed in Kharaz, Yemen, 2010 ....................................... 69 Table 23: Allocated funds from High Commissioner funds - Yemen .............................................. 70 Table 24: BSFP intervention implemented, Yemen ...................................................................... 71 Table 25: Anaemia prevalence in Non-Pregnant Women 2010 ....................................................... 79 Table 26: Baseline data for Basateen and Sana’a........................................................................... 79 Table 27: Key information for Ethiopian refugee camps ................................................................ 81 Table 28: Quantities and food items distributed, Ethiopia, 2010 ..................................................... 84 Table 29: NutVal analysis of the pre-milled general ration contents ............................................... 84 Table 30: Allocated funds from High Commissioner, Ethiopia ...................................................... 85 Table 31: Blanket SFP intervention implemented, Ethiopia ........................................................... 87 Table 32: Vitamin A vaccination / supplementation, Ethiopia, older camps ................................... 90 Table 33: Mean Haemoglobin in 6-23 and 24-59 months, Ethiopia, Dollo Ado ...............................98 Table 34: Key information, Kenya ............................................................................................. 101 Table 35: Quantities and food items distributed in Kakuma, November 2011 ................................ 103 Table 36: NutVal analysis of the general ration contents, Kakuma .............................................. 104 Table 37: Requested budget per year per camp ........................................................................... 104
Table 38: Allocated funds from High Commissioner special fund ................................................ 105 Table 39: MNP intervention, Kenya ........................................................................................... 106 Table 40: Blanket SFP intervention implemented, Kenya ............................................................ 106 Table 41: De-worming coverage in Kakuma and Dadaab ............................................................ 108 Table 42: Vitamin A coverage, Kakuma and Dadaab .................................................................. 109
Table 43: Mean Haemoglobin in non-pregnant women, Dadaab .................................................. 118 Table 44: Key information, Djibouti .......................................................................................... 120 Table 45: Quantities and food items distributed in 2011, Ali Addeh, Djibouti ................................ 121 Table 46: NutVal analysis of the general ration contents, Djibouti ............................................... 122

Anaemia Strategy Review 8 | 1 4 0
Table 47: Allocated funds from the High Commissioner special fund ........................................... 122 Table 48: Blanket SFP intervention implemented, Djibouti ......................................................... 123 Table 49: Summary of Anaemia Prevalence in Children 6-59 months (all countries in the review) . 132 Table 50: Anaemia Prevalence in Non-Pregnant Women, all countries in the review ..................... 134 Table 51: Anaemia prevalence in 6-23 and 24-59 months in selected camps ................................. 140 Table 52: Factors affecting success of small-scale agriculture projects in camps ........................... 144 Table 53: Iron requirements provided in the general ration - analysis by NutVal across countries ... 144 Table 54: Overview of Nutritional Activities and Interventions per country between 2008 and 2012................................................................................................................................................ 149 Table 55: Overview of Malarial and Intestinal Parasitic Activities per country .............................. 149 Table 56: Special products overview .......................................................................................... 150

Anaemia Strategy Review 9 | 1 4 0
ACKNOWLEDGEMENTS
This review was funded by UNHCR under a sub-agreement with the Emergency Nutrition Network (ENN). UCL was sub-contracted by ENN to conduct the review. We would like to gratefully acknowledge the various UNHCR offices and UNHCR HQ individuals who contributed their time to this review as key informants, as well as the member of WFP and IPs who also contributed to these interviews. They have not been named to preserve anonymity, but their support is greatly appreciated. Special thanks and acknowledgement also go to the following individuals from UNHCR, for their extensive support:
• Caroline Wilkinson • Ellen Andresen • Melody Tondeur • Allison Oman
Thanks and acknowledgement also to Dr. Mezan Rahman from UNHCR, who was kind enough to conduct additional data analysis for the review.
DISCLAIMER The information in this review has been extracted from the reports that were made available to the authors and from key informant interviews. Background information provided in this report from each refugee operations was not verified by individual operations and therefore may contain some errors. The views expressed in this report are those of the authors and do not, necessarily, reflect those of UNHCR.

Anaemia Strategy Review 10 | 1 4 0
ABBREVIATIONS ACF – Action Contre La Faim AMDA – Association of Medical Doctors of Asia ARRA - Administration for Refugee-Returnee Affairs BCC – Behaviour change communications BSFP – Blanket supplementary feeding programme CDC – Centre for Disease Control and Prevention CSSW – Charitable Society for Social Welfare GAM – Global Acute Malnutrition GFD – General Food Distribution IDF - Interaction in Development Foundation IEC – Information, Education and Communications Hb - Haemoglobin HIS – Health Information System JAM – Joint Assessment Mission LLINs – Long lasting insecticide-treated nets LNS – Lipid nutrient supplement M&E – Monitoring and Evaluation MSF – Médicins Sans Frontières MAM – Moderate acute malnutrition MOU – Memorandum of Understanding OG – Operational Guidance on the Use of Special Nutritional Products to Reduce Micronutrient Deficiencies and Malnutrition in Refugee Populations PLW – Pregnant and lactating women SAM – Severe acute malnutrition SFP – Supplementary feeding programme SHS – Society for Humanitarian Solidarity TFP – Therapeutic feeding programme WASH – Water, Sanitation and Hygiene WFP – World Food Programme WHO – World Health Organisation WSB – Wheat Soy Blend UNICEF – United Nations Children’s Fund UNHCR – United Nations High Commissioner for Refugees

Anaemia Strategy Review 11 | 1 4 0
EXECUTIVE SUMMARY
The UNHCR Strategic Plan for Anaemia Prevention, Control and Reduction (2008-2010)1 was developed in 2008 in response to the extremely high prevalence of anaemia that had been measured in refugee camp populations. The strategy proposed a multi-sectoral approach to improve the nutrient content of food, reduce disease prevalence, improve diagnosis and treatment, and strengthen monitoring. This review aims to understand the process of Anaemia Strategy implementation and assess its effectiveness, in order to offer guidance on the revised strategy that is being developed in 2013. A wide range of documents and data have been analysed and 15 key informant interviews conducted.
To what extent have objectives been addressed and where can focus be strengthened? The Anaemia Strategy provided the initiative and funds to enable anaemia control activities to be mainstreamed into standard nutrition and healthcare services. One of the most notable achievements of the Anaemia Strategy has been to shift mindsets towards the need for prevention, rather than only treatment. Blanket SFPs (BSFP) using special nutritional products have been successfully established in all countries covered by the review, and through the development of the ‘Operational Guidance on the Use of Special Nutritional Products’ (OG), a best practice approach to programme implementation and management has been developed. This has helped to address the various logistical challenges encountered with implementing these BSFP, including delays, procurement issues, and storage problems. Small-scale agriculture and animal husbandry initiatives have also been supported through the strategy, although these have shown varying degrees of success. Disease control activities seem to have been up-scaled in several camps, although for malaria this may be the result of initiatives put in place through the Malaria Strategic Plan, rather than the Anaemia Strategy itself. With respect to de-worming, the level of achievement is mixed. In Bangladesh coverage of de-worming seems to have improved, as reported by nutrition surveys, and HIS data shows the incidence of intestinal worms to be low. On the other hand, in camps in Djibouti, coverage of de-worming is not reported in nutrition surveys, and levels of intestinal worms on HIS are not only high, but have increased during the period of the anaemia strategy. Despite comprising one of the major objectives of the Anaemia Strategy, information on detection and management of anaemia does not seem to be readily available. Routine monitoring of anaemia with HemoCue™ in ANC should be prioritised for the upcoming strategy revision, and uploading of this data to TWINE should be explored as a possibility. The capacity building initiative that has been born out of Anaemia Strategy funding is commendable. Individuals have been trained on the OG and Standardised Expanded Nutrition Survey (SENS) guidelines, and national consultants have been hired. Moving forward, it will be important to continue to invest in human resources and global training initiatives, incentivise or re-emphasise the responsibility to pass on training locally, and to follow up on these initiatives.
1 For brevity, the ‘UNHCR Strategic Plan for Anaemia Prevention, Control and Reduction (2008-2010)’ is referred to as the ‘Anaemia Strategy’ throughout this review. Although the Anaemia Strategy was dated 2008-2010, the implementation period was extended through to 2013.

Anaemia Strategy Review 12 | 1 4 0
The Anaemia Strategy clearly recognised the fact that proposed activities were a transitional approach, in preparation for a time when the general food ration provided by WFP fully addresses micronutrient needs and refugees can engage in income-generating and livelihoods activities to further supplement their diet. Such activities, with clear specifications, will be vital to reinforce the revised Anaemia Strategy and ensure that reliance on special products for prevention is a short-term solution. Food vouchers and cash programmes currently under consideration by UNHCR HQ offer important opportunities in several of the camps covered by this review. Overall, the original strategy is a thorough and comprehensive document, but the sheer scope of the strategy has meant that certain areas have been prioritised and others need further attention moving forward. To ensure this, improvements could be made to the structure of the strategy document, to more clearly delineate objectives and responsibilities and reduce repetitiveness. In addition, a number of related and relevant strategy documents currently exist within UNHCR, such as the ‘Nutrition and Food Security Strategic Plan’ and the ‘Malaria Strategic Plan’. It is recommended that the revised Anaemia Strategy document draws on these plans, ensuring consistency in terms of activities and indicators. Current involvement of Public Health, Reproductive Health, and WASH in the Anaemia Strategy could be further developed; integration between these teams and nutrition is recommended to ensure that the multi-dimensional approach of the Anaemia Strategy is realised at both HQ and country level. Explicitly drawing on these strategic plans during formulation of the revised Anaemia Strategy will help to develop an integrated approach. How well was the Anaemia Strategy monitored? Monitoring throughout the period of the anaemia strategy has been mixed. Some of the data available to review the influence of the Anaemia Strategy on nutritional indicators is challenging to work with. Overall, it is suggested that the Anaemia Strategy would benefit from a clear and consistent set of indicators by which to judge progress. The development of SENS is likely to further improve the quality of nutrition surveys, but data on programme monitoring seems also to have been relatively poor in several countries in this review. However, no field missions were able to be undertaken to explore this in more detail. In the upcoming strategy, the importance and challenges of programme monitoring must be highlighted. With regards to the use of special products, key informant interviews suggest that poor programme monitoring is due both to lack of clarity on indicators and lack of capacity to deliver to the standards outlined in the Operational Guidance. Monitoring of adherence is particularly important for programmes using special products, especially for MNP. For Nutributter® and CSB++, the need for a deeper understanding of the usage of special products has also become apparent due to widespread, anecdotal, accounts of sharing. To what extent has anaemia reduction been achieved over the course of the strategy?

Anaemia Strategy Review 13 | 1 4 0
Over the course of the strategy significant reductions in anaemia prevalence have been shown in all countries, except for Algeria for which results are pending2. In Djibouti and Kenya, reductions shown during intervention with Nutributter® are particularly impressive and consistent. Delays in implementing BSFP have meant a significant difference was only shown by 2010 in Ali Addeh, and by 2011 in Kakuma and Dadaab. In Bangladesh and Nepal, BSFP using MNP were quick to be established. Despite this, no significant change was reported in Nepal until 2011, and in Bangladesh anaemia increased considerably in 2010, which is thought to be linked to disruptions due to a switch in special product use. Nevertheless, a significant reduction is now shown compared to baseline. In Yemen, a significant reduction in anaemia was shown in the first year of strategy, which coincided with a Premix intervention. In Ethiopia, the situation is slightly different in that the original funds outlined for activities in camps were redirected to the Dollo Ado crisis in 2011. Planned activities therefore changed and trend data is limited for many of the other camps. Nevertheless, significant reductions in anaemia have been shown in Sheder and Shimelba, and in Melkadida camp in Dollo Ado. Data on non-pregnant women is sparse in Asia, but anaemia prevalence results from the Horn of Africa region are encouraging, showing particularly impressive reductions in Dollo Ado and Djibouti. Analysis of anaemia severity categories reveals three major findings. Firstly, that Anaemia Strategy activities seem to have preferentially reduced the prevalence of severe and moderate anaemia. Secondly, countries with a higher proportion of severe and moderate anaemia have shown greater reductions in anaemia. In other words, if the baseline situation of the camp is poorer, more significant gains can be made. Thirdly, despite Anaemia Strategy activities, mild anaemia seems to be relatively consistent at around 20-30%. As such, no country reached a ‘low’ level of anaemia for children at any point of the Anaemia Strategy. Analysis of age categories reveals some of the contributing factors to this high prevalence of ‘mild’ anaemia. Primarily, and as expected, ‘anaemia’ prevalence is much higher in younger children – this may reflect natural changes in haemoglobin composition and concentration during growth. Secondly, although in most countries the prevalence of anaemia amongst ages 24-59 months has crossed the 40% threshold from a ‘high’ to ‘medium’ public health concern, the prevalence amongst 6-23 months almost always remains above 40%. Although anaemia control activities for this younger group clearly need to be strengthened, it is suggested that the application of WHO public health targets to this sub-group may be overly ambitious. To what extent has a reduction in stunting been achieved over the course of the strategy? With respect to stunting, in both Nepal and Bangladesh, where MNP interventions were introduced, stunting reduced significantly by the third year from baseline. However, the prevalence of stunting remains extremely high in camps in Bangladesh, and a medium public health concern in camps in Nepal3. In other countries / camps, where interventions such as Nutributter were introduced, no notable or consistent changes in stunting prevalence have been reported. In Dollo Ado, Ethiopia, stunting has shown some sign of reduction in two camps between 2011 and 2012. However, stunting data in this camp may be less reliable due to problems of age verification, increasing camp populations and ongoing security challenges impacting upon camp stability and data collection.
2 At time of report finalisation, preliminary results from the October / November 2012 surveys were available for Algeria and showed reductions in anaemia in women and children. 3 Nepal data from 2011 nutrition survey, Bangladesh data from 2012 nutrition survey

Anaemia Strategy Review 14 | 1 4 0
To conclude, the first five years of the Anaemia Strategy have shown some encouraging reductions in anaemia, but anaemia remains a high / medium public health problem for children (6-59 months) in all camps under this review. A number of recommendations are made in the following section to strengthen and focus the revised Anaemia Strategy in 2013.
Anaemia Strategy Review 15 | 1 4 0
RECOMMENDATIONS FOR THE REVISION OF THE
ANAEMIA STRATEGY
The 2013 revision of the Anaemia Strategy is taking place in a challenging economic and political climate. The following recommendations are made to try to maximise the value of the Anaemia Strategy whilst respecting restricted funds. Anaemia Strategy Document:
1. Consider restructuring the strategy document to include one iteration of objectives; merging the current ‘Action Points’, ‘Detailed Activities’, and ‘Country Proposal Objectives’.
2. Programme monitoring requirements should be made more explicit. Consideration should be
given to including measureable (SMART) indicators for evaluation. Consistency in indicators should be maintained between the Anaemia Strategy, country proposals and the indicators described in UNHCR’s Strategic Plan for Nutrition and Food Security, the Strategic Plan for Malaria Control, and other relevant strategic plans.
3. Consider changing the title of the strategy to the ‘Integrated Strategy to address Anaemia and Micronutrient Deficiencies in Refugee Populations’, in order to reflect the multi-sectoral approach taken within the strategy and the overlap with other UNHCR strategic plans. Within the strategy, make explicit reference to the ‘Nutrition and Food Security Strategic Plan’ and the ‘Malaria Strategic Plan’ and ensure consistency in approaches.
Management:
4. Action points specific to UNHCR HQ may benefit from being organised into a tangible working document, similar to the work plans for country programmes, with roles and responsibilities and internal deadlines specified to ensure clarity to all relevant parties.
5. Tracking of funds and their allocation to different activities should be done as one means of monitoring whether strategic objectives are being addressed. Improvements in the tracking of fund allocations would also facilitate work on describing the costs and cost:benefit of specific interventions.
Integration:
6. Seek ways to further build partnership and integration between Nutrition, Public Health, and WASH to ensure the multi-sectoral approach of the strategy is fully addressed.
7. An interesting opportunity exists in the development of ‘Anaemia and Micronutrient Factsheets’ through UNHCR TWINE. Various indicators could be collated, including nutrition survey anaemia results and trends, malaria, WASH, IYCF. This could be shared between UNHCR HQ, local UNHCR offices and IPs. Such factsheets would help to monitor trends, identify key areas to target to reduce anaemia and improve integration at local level.

Anaemia Strategy Review 16 | 1 4 0
However, this possibility should be considered in light of an apparent proliferation of data collection tools that may make analysis and decision support harder.
8. At a country level, the ‘Integrated Health Programming’ model, adopted in camps such as Kakuma, that uses community health promoters to deliver comprehensive and consistent messages regarding health, mosquito nets, sanitation, and hygiene promotion, may help to integrate anaemia control activities. This model offers the opportunity to minimise vertical programming, duplication of efforts and protect capacity and budgetary constraints.
Public Health and Reproductive Health:
9. Deworming has improved in many camps, but the revised strategy may wish to consider extending de-worming to adolescent children, for example in Bangladesh, and other countries. Basic de-worming services also need to be strengthened in Djibouti and Ethiopia, as evidenced by HIS data from different camps and reports of high worm infestation amongst children visiting the clinics in Dollo Ado.
10. Malaria control activities will continue to be essential and further integration with the ‘Malaria Strategic Plan’ in terms of indicators and outcomes is recommended
11. Little information on the use of HemoCue™ haemoglobin measurements in ANC was available but it is thought that coverage has not reached 100%. Ensuring HemoCues™ are available and used appropriately in all ANCs and clinics, and that systems are in place for consumables procurement, analyser servicing, and data recording and compilation will be important for the revised strategy. Efforts could also be made to improve upon the quality of Haemoglobin (Hb) data in ANC.
12. It is suggested that anaemia measurements from ANC are incorporated into TWINE. This will be important not only for tracking purposes but also to incentivise staff to conduct this routine monitoring. Investment may be needed in terms of training local staff on the TWINE system and data input. If Hb / anaemia data is included in TWINE, it will be important to seek ways to improve upon the ‘joint ownership’ of the data locally. At present, HIS data is useful primarily as a knowledge base at UNHCR HQ level. Encouraging joint ownership and use of the data by colleagues working in the field would help to incentivise good quality data entry.
13. It is recommended that prevalence estimates for anaemia for children and non-pregnant women continue to be measured only in nutrition surveys, as this is the optimal approach for ensuring quality control.
Special nutritional products:
14. Plans are in place for special products to be rolled out in an increasing number of camps. Responsibility must be taken and implementation research conducted to understand the effects of these products. These products are not without potential short term negative effects, such as toxicity, nor without potential long-term adverse effects. For LNS, these may include displaced breastfeeding, effects on taste and food preferences, the double burden of malnutrition, dental health, and others.

Anaemia Strategy Review 17 | 1 4 0
15. To better understand usage of special products, compliance studies that incorporate qualitative / anthropological approaches are recommended. This will be important to explore both under-consumption of micronutrient powder (MNP) as well as sharing of Nutributter® and CSB++. Gathering insight into key drivers of sharing will ensure relevant communications are developed.
16. Further consultation on assessing and improving adherence in camps is recommended, ideally through an expert panel meeting.
17. The introduction of MNP to a new setting should be considered carefully. Although MNP seems to be a less costly option, the programmatic burden is substantial. If MNP programmes are to continue to be introduced, it is essential that the support systems are in place to guarantee sensitisation, behaviour change communications (BCC) and programme monitoring, and that programme managers are familiarised with the Operational Guidance.
Livelihood activities and reducing reliance:
18. It is important to note that initiatives such as special products were originally considered to be a ‘transitional strategy’ until better fortification of staple foods in the general ration, diversification of the diet, and livelihood options were put in place. In the Anaemia Strategy 2013 it will be important to emphasis this next stage.
19. Greater support and commitment is needed to offer small-scale agriculture projects the
greatest chance of success. It would help if funding were regularised and provision of materials carefully planned.
20. Further trialling of voucher and / or cash programmes for camps where functional markets are in place is highly recommended. A number of key informants requested for voucher programmes to be introduced, suggesting these will be welcomed in relevant camps.
21. Greater support of income generating activities (IGAs) is essential to limit the selling of the ration that is apparent to varying degrees in most refugee settings and to encourage self-reliance and diversity in diet.
Adequacy of the general ration:
22. For anaemia to be reduced at the population level, it will be essential that WFP and UNHCR work together to address both the nutrient gap in the general food ration as well as the provision of complementary foods and products for SFP.
23. Staple food fortification has been demonstrated to be an effective intervention to improve micronutrient intakes and reduce anaemia in vulnerable refugee populations. It is recommended that more emphasis is placed upon the adequacy of the general ration and the means to achieve this in the revised Anaemia Strategy.

Anaemia Strategy Review 18 | 1 4 0
Monitoring and evaluation:
24. Given the evident difficulties in obtaining monitoring data from country programmes, clearer emphasis must be placed on core programme monitoring requirements. A useful future exercise would be to prioritise and clarify which indicators should be considered as essential or non-essential, with a view to reducing the burden of data collection and analysis.
25. It is recommended that the current tools in the Operational Guidance are condensed and
simplified in order to help ensure that countries adhere to a basic set of minimum reporting requirements.
26. Additional consideration needs to be given as to which organisations are being tasked with conducting M&E for the various anaemia control activities, and whether IPs in specific contexts have the means and interest to undertake the data collection and analysis that is required. Where interest or capacity is lacking, more consideration needs to be given as to how this can be incentivised.
27. Universal adoption of the standardised measurement and analysis of anaemia during
nutritional surveys of refugees will be an important next step for the revised strategy of 2013. Advanced planning and funding of routine surveys to ensure they are implemented at the same time of every year would help to reduce any possible seasonal variation and enable more reliable assessment of intervention impacts.
Nutrition survey analysis:
28. Further investigation is needed to understand the prevalence of anaemia that might be expected in refugees and their host populations under conditions of ‘adequate’ nutrition and health. This would allow an assessment of whether the current target of <20% in 6-59 months children is realistic and appropriate for all geographic regions and populations.
29. Analysis of 6-23 months and 24-59 months age groups clearly shows differentiation in terms of their mean haemoglobin levels and /or susceptibility to anaemia. What is the best way, therefore, to approach this data when conducting and analysing nutrition surveys and response to interventions?
a. A number of more ‘accurate’ analytic approaches exist (age-standardisation instead
of age categorisation, Hb-for-age curve with z-score cut-offs as for height). However, these approaches would be too complicated in most of the contexts in which UNHCR works
b. Therefore, it is recommended that sufficient sample sizes of each age group are ensured in nutrition surveys, to enable robust analysis of data for the 6-23 months and 24-59 months age groups is possible.

Anaemia Strategy Review 19 | 1 4 0
CHAPTER 1: INTRODUCTION TO THE REVIEW
Background
Anaemia is a condition in which low levels of haemoglobin in the blood result in diminished oxygen transport. Iron deficiency is estimated to be the cause of about half of all anaemia cases4. Anaemia can also be caused by a deficiency in vitamin B-12, folate, and other nutrients, parasitic infections, bleeding due to other causes, haemoglobinopathies resulting in abnormal haemoglobin formation (such as in sickle cell anaemia), thalassaemia, chronic disease, or rupture of red blood cells (haemolytic anaemia)5 (see Figure 1).
Figure 1: Causes of anaemia in low and middle-income countries6
Anaemia is one of the most common and widespread conditions in the world, and is a public health problem in both developed and developing countries7. Recent estimates from the World Health Organization (WHO)8 suggest that the global prevalence of anaemia is 24.8%, with the highest rates reported in sub-Saharan Africa, amongst preschool-age children (67.6%) and pregnant women (57.1%). To note, however, studies show that healthy people of African extraction of all age groups at all times other than the perinatal period, have haemoglobin concentrations 0.5 to 1.0 g/dL below those of whites9,10 - suggesting ‘anaemia’ may in part be due to genetic heterogeneity. 4 Crawley J. (2004) Reducing the burden of anemia in infants and young children in malaria-endemic countries of Africa: from evidence to action. Am J Trop Med Hyg Vol 71(Suppl) pp25–34 5 Balajaran Y, Ramakrishnan U, Özaltin Em, Shankar A, Subramanian S (2011) Anaemia in low-income and middle-income countries. The Lancet Vol 378 (9809) pp 2123–2135 6 See 3 7 McLean E, Cogswell M, Eglis I, Wojdyla D and De Benoist B (2008) Worldwide prevalence of anaemia, WHO Vitamin and Mineral Nutrition Information System, 1993–2005. Public Health Nutrition . Vol 12(4) pp444-54 8 World Health Organization (2008) Worldwide prevalence of anaemia 1993–2005. Geneva. World Health Organization. 9 INACG / USAID (2002) Adjusting hemoglobin values in program surveys. Washington. USAID. 10 Perry G, Byers T, Yip R, Margen S (1992) Iron nutrition does not account for the haemoglobin differences between blacks and whites. J Nutr Vol 122 pp1417–1424

Anaemia Strategy Review 20 | 1 4 0
Refugees are thought to be particularly vulnerable to anaemia due to inadequate iron intake and other nutritional deficiencies, lack of appropriate complementary foods, and high rates of infection that are characteristic of crowded camp environments11,12. Nutritional iron deficiency is common in settings with monotonous plant based diets and low meat intake, such as is exemplified by the refugee diet13. Anaemia can be a potentially life threatening condition in its severe forms. In women, anaemia contributes to excess maternal deaths as a result of a diminished resistance to bleeding, pre and post-delivery14. In children, anaemia is recognised to adversely affect the cognitive performance15, behaviour and physical growth of infants preschool and school-aged children 16, and increase the likelihood of associated morbidities17. Anaemia occurs in all ages and both sexes, however is more prevalent in pregnant and lactating women and young children. Other at-risk groups include adolescent children and people living with HIV/AIDs. Anaemia is not only an indicator of potential iron deficiency in populations, but can also be taken as a proxy indicator for other micronutrient deficiencies. Measuring anaemia is a relatively simple process, and therefore these measurements offer a practical means by which to explore the micronutrient status of refugee populations. The multi-dimensional causes of anaemia dictate the need for various programs in health, nutrition and other sectors. This complex aetiology was acknowledged and formed the fundamental basis of the Anaemia Strategy, which proposed a multi-pronged approach to tackle the condition and its debilitating consequences in some of the most vulnerable groups, mothers and children.
Methodology
This review took place between September 2012 and February 2013. Data sources A number of sources of information were utilised from each country, including:
• Nutrition surveys • Annual reports • Joint Assessment Missions (JAMs) • Acceptability studies
11 Seal A, Creeke P, Mirghani Z, Abdalla F, McBurney R, Pratt L, Brookes D, Ruth L, & Marchand E (2005) Iron and vitamin A deficiency in long-term African refugees. J. Nutr . Vol 135 pp 808-813 12 Kemmer T, Bovill M, Kongsomboon W, Hansch S, Geisler K, Cheney C, Shell-Duncan B, & Drewnowski A (2003) Iron deficiency is unacceptably high in refugee children from Burma. J.Nutr. Vol 133 pp 4143-4149 13 Zimmermann M and Hurrell R. (2007) Nutritional iron deficiency. The Lancet. Vol 370 pp511–20 14 Khan K, Wojdyla D, Say L, Gülmezoglu A, Van Look P (2006) WHO analysis of causes of maternal death: a systematic review. The Lancet. Vol 367 pp1066–74 15 Grantham-McGregor S, Ani C (2001) A review of studies on the effect of iron deficiency on cognitive development in children. J Nutr Vol 131(2S-2) pp649-666 16 Lawless J, Latham M, Stephenson L, Kinoti S, Pertet A (1994) Iron supplementation improves appetite and growth in anaemic Kenyan primary school children. J Nutr Vol 124 pp 645–54 17 World Health Organisation (2001) Iron Deficiency Anaemia Assessment, Prevention, and Control: A guide for programme managers. Available online at http://whqlibdoc.who.int/hq/2001/WHO_NHD_01.3.pdf

Anaemia Strategy Review 21 | 1 4 0
• Mid-term / quarterly reports • Training documents • Published literature • Nutrition surveys • Global database • HIS data
Qualitative component The consultant’s presence at the Operational Guidance workshop of 2012 offered an opportunity to meet with various country representatives relevant for the review. In addition to this, contact was made with key informants in the review countries, and either Skype, telephone or open ended questionnaires used to gather their information. A number of challenges with this must be noted, including lack of response or delayed response, language barriers and key personnel involved in the Anaemia Strategy having left UNHCR or being uncontactable for other reasons. Interviews, where possible, were conducted for 1 hour, although this varied depending on the amount of time that the individual was able to allocate. The qualitative process was iterative in that as themes were identified these were then taken and used as stimulus for questioning in further interviews. In total, 15 in-depth-interviews were conducted. These included: UNHCR / IP / WFP Country programmes key informants: • Programme officers • Programme assistants • Nutritionists • Public Health Officers • WFP employee • Breakdown of key informants by country: Algeria x 2; Bangladesh x 2; Djibouti x 1; Ethiopia x 1;
Nepal x 1; Kenya / Dadaab x 1; Kenya / Kakuma x 2; Yemen x 1 UNHCR Headquarters key informants: • Nutrition, Geneva x 2 • Regional Support Hub, Nairobi x 1 • Public Health, Geneva x 1 Lastly, the consultant’s attendance at the Technical Meeting on Anaemia and Micronutrient Deficiencies in Refugee Populations in December 2012 also offered an opportunity to gather information from experts in the field.
Objectives of the review The overall objective of the review is to:

Anaemia Strategy Review 22 | 1 4 0
Conduct a review of the implementation of the strategy in the initial 7 countries targeted for intervention. Document available data on the process and impact of the strategy implementation and
describe lessons learnt. Findings are to support revision of the Anaemia Strategy in 2013
To meet these objectives, the review has addressed both the Anaemia Strategy at Headquarters level, including meeting internal objectives, as well as conducting an analysis at country level – for which a detailed analysis of anaemia trends is one important objective. At country level, this review explores the following areas for each of the seven countries: Bangladesh, Nepal, Algeria, Yemen, Ethiopia, Djibouti, Kenya.
1) Background and context 2) Anaemia Strategy funding and management 3) Anaemia strategy activities 4) Trend analysis of the nutritional indicators in children and non-pregnant women
a. 6-59 months i. Trends for anaemia at < 11g/dl and < 10g/dl
ii. Mean heamoglobin iii. Severity categorisation of anaemia
b. 6-23 months and 24-59 months i. Trends for anaemia at < 11g/dl and < 10g/dl
ii. Mean heamoglobin c. Non-pregnant women reproductive age
i. Trends for anaemia at <12g/dl ii. Mean heamoglobin

Anaemia Strategy Review 23 | 1 4 0
Classification and categories of malnutrition and anaemia
Evaluated data utilises the following classification for GAM, stunting, and anaemia:
Table 1: Classification of malnutrition and cut-offs
Malnutrition classification WHO Z-Score
Global acute malnutrition (GAM) WHZ<-2 and / or oedema
Chronic malnutrition (stunting) HAZ < -2
Table 2: Anaemia severity categories for children 6-59 months and non-pregnant women18
Haemoglobin concentration (g/dl)
Anaemia category Children 6-59 months Non-pregnant women
(15-49 years)
Total anaemia <11g/dl <12g/dl
Mild anaemia 10-10.9g/dl 10-11.9 g/dl
Moderate anaemia 7 - 9.9g/dl 7-9.9 g/dl
Severe anaemia < 7g/dl <7 g/dl
In addition, the following public health thresholds have been defined by UNHCR, based on WHO 2001 thresholds19, to help categorise the nature and magnitude of the problems of GAM, stunting, and anaemia in refugee camps.
Table 3: Classification of the severity of GAM, stunting and anaemia in refugee settings20
Prevalence (%) High Medium Low
GAM ≥ 15
Critical 10-14
Serious 5-9 <5
Stunting ≥30 20-29 <20
18 Assuming altitudes of <1000 feet; adjustment required for higher altitutdes 19 WHO/UNICEF/UNU (2001) Iron deficiency anaemia: assessment, prevention, and control. Geneva: World Health Organization 20
UNHCR (2011) Operational Guidance on the use of Special Nutritional Products to Reduce Micronutrient Deficiencies and Malnutrition in Refugee Populations. Geneva. UNHCR

Anaemia Strategy Review 24 | 1 4 0
Anaemia in 6-59 months ≥40 20-39 5-19
Scope and data analysis for the review Due to the scope of the information that could be included in this report, public health and WASH activities have not been addressed in significant detail. De-worming and malaria control are two areas of public health that are given some attention, however, as they formed a major objective of the anaemia strategy. Regarding nutritional interventions, it was agreed that the focus would be placed on blanket supplementary feeding programmes (BSFP) as opposed to targeted SFP and TFP. The timeline scope for data analysis was agreed as from 2008 to 1st quarter 2012, although, where possible, additional data from 2012 has been recognised in summary tables. Nutritional indicator data used within this review has been collated from nutrition survey reports rather than from re-analysis of datasets. However, for Kenya and Djibouti, original datasets were re-analysed by Sarah Style, consultant for UCL, and the results are included in this review. For age categorisation in Bangladesh, data has been re-analysed thanks to the support of Dr. Mezan Rahman. Some analysis of the original dataset for Nepal 2011 was also conducted by UCL. Prevalence data for severity of anaemia <10g/dl was not always explicitly reported in nutrition surveys but was calculated from prevalence data from moderate and severe anaemia.
Challenges with data collection and evaluation
A number of challenges were encountered during the process of accessing and analysing data. Data collection • Non-response from country informants • Lack of programme monitoring data Nutrition survey data • Nutrition surveys were not conducted annually in some countries, due to reasons such as security
concerns (details of nutrition survey dates and months is given in the Appendix) • Nutrition surveys have been conducted at different points in the year in countries such as Nepal,
which leaves the anaemia data open to being affected by seasonal patterns • In some cases non-pregnant women are not included in the scope of the surveys • Analysis of the anaemia data is inconsistent
o Age breakdowns (6-23, 24-59 months) are not always included or different categorisations are used
o Confidence intervals were not always included in the survey reports o Mean haemoglobin was also not always included o Severities of anaemia were not always included
Interpretation and assessment of effect

Anaemia Strategy Review 25 | 1 4 0
• The cross sectional data and multi-dimensional approach to the strategy prevents the attribution of changes to one intervention or another
• Potential confounders, lack of stability in camps, shifting populations, outbreaks of disease could have biased results one way or another
• Other non-UNHCR interventions taking place during the period of the strategy may not have been recognised by this review
• Small sample sizes for 6-23 months and 24-59 month reduce the potential for interpretation Lack of complete HIS data for contextual analysis and assessment of confounding is an issue for some camps. For example, HIS data is prohibited from being collected in Algeria, and Data on intestinal worms is not collected in Yemen

Anaemia Strategy Review 26 | 1 4 0
CHAPTER 2: AN OVERVIEW OF THE UNHCR ANAEMIA
STRATEGY AND ITS MANAGEMENT
Summary of strategy objectives
The Anaemia Strategy did not include explicit objectives as such, but instead presented ‘Action Points’, within the main text and a number of ’detailed activities’ within an annex. In addition to these, a separate proposal template was subsequently produced and sent to country offices.
1. Referring to the general anaemia programme: a broadening of approach to address prevention and control of micronutrient deficiencies. To be used as a transitional strategy, rolled out in countries starting with the initial seven this review addresses
2. Preventative interventions including use of special products (MNP and LNS) and reinforcement of public health activities
3. Continuing treatment of anaemia 4. Improving screening and diagnosis of anaemia in children and pregnant women 5. Commodities and evaluating their cost effectiveness and improving packaging 6. Assuring data collection, assessment, and monitoring and evaluation systems are put in place
In addition to the ‘Action Points’, a number of detailed activities were given in the Annex of the Anaemia Strategy. These were presented in 3 groups:
1. Reinforcement of existing activities 2. New priority actions 3. Monitoring and evaluation, and Operational Research
A separate proposal template was sent to countries in which four clear objectives were identified:
1. To reduce the prevalence of diseases that affect anaemia status through disease control 2. To reduce the prevalence of anaemia among vulnerable refugee population groups through
increased intake of micronutrients 3. To improve detection and management of anaemia and malnutrition among vulnerable groups 4. To set-up an anaemia monitoring and evaluation system
The focus of this review will concentrate first on corresponding action points and detailed activities presented in the strategy annex and use these to evaluate the initiatives of UNHCR at HQ level in Geneva (chapter 3). It will then turn to the ‘country objectives’ and use these to evaluate the initiatives of country programmes (chapter 4). Before moving to this detailed analysis, some key findings on the format of the Anaemia Strategy document and strategy management are given below.
Format of the strategy document
• Having three iterations of the strategy (Action points, Annex, Country proposal template) does not seem necessary or desirable. The Action Points, Annex and Country Objectives are not always aligned, and some activities cross over with actions points, others do not. This approach risks neglecting key activities should they not be included in both the Action points and Annex.

Anaemia Strategy Review 27 | 1 4 0
• No core indicators against which to judge progress were described in the Anaemia Strategy. Country proposals included various indicators, based on a LogFrame. However, country proposals were inconsistent in the indicators selected to determine performance, which makes it more difficult to compare programmes between countries.
• There are a number of indicators within the UNHCR Nutrition and Food Security Strategic
Plan21 that may be helpful to incorporate into the Anaemia Strategy – this would help to integrate the two plans and could contribute to maximising the efforts made by country offices to deliver this data. At the moment, indicators such as anaemia and acute malnutrition prevalence, and Vitamin A supplementation are included as indicators for both strategic plans. Moving forward, it might be helpful to also include indicators such as the following in both strategies:
o Number of UNHCR Public Health and Nutrition/ Food Security coordinators o Number of public health coordination meetings with integrated nutrition and food
security component held per year
Management of the strategy
• In practise, only some of the programme monitoring indicators contained in the country proposals seem to have been monitored.
• Most of the action points within the Anaemia Strategy did not have specific internal deadlines. Updating the MoU and development of the Operational Guidance for Use of Special Nutritional Products (OG) were two initiatives that were exceptions; both of these were prioritised and finalised very soon after internal deadlines.
• Various references to documenting costs are made in the Anaemia Strategy:
Action 1.4. UNHCR will make sure that costs are factored in and documented from the start in order to assess the cost-effectiveness of the proposed interventions. Sustainability and maximization of resources for greatest impact will be used as guiding principles.
However, information on costs at a country level does not seem to have been closely monitored or gathered centrally in a way that was easily accessible to the review. Cost analysis that is available (other than for Ethiopia) is relatively rudimentary, showing the overall HC funds that were allocated per country per year. It is not broken down by nutritional vs. diagnostics vs. WASH vs. monitoring interventions, or other components of the strategy.
• In addition, the description of funding in both the Anaemia Strategy and Country Proposals refers to the overall budget (full cost including programme budget), with no breakdown of the funds allocated specifically to meet Anaemia Strategy objectives. It is therefore difficult to analyse expenditure on the Anaemia Strategy in relation to the budget stated in the strategy, to see if yearly disbursement targets were met.
21 UNHCR Strategic Plan for Nutrition and Food Security 2008-2012

Anaemia Strategy Review 28 | 1 4 0
CHAPTER 3: ANALYSIS OF STRATEGY OBJECTIVES AT
HEADQUARTER LEVEL To explore the extent to which objectives were met, the Action Points and Detailed Activities described in the Anaemia Strategy have been groups together by theme. They have therefore been re-ordered as necessary, but their original numeric values are shown. The narrative and analysis below is derived from key informant interviews and a review of available reports and other documentation.
Overview of strategy impact
• Several key informants spoke of the value of a tangible strategy document, promoted by the High Commissioner, in drawing attention to the problem of anaemia and micronutrient deficiencies.
• Having a global strategy document helped to guide country programmes and could be adapted to local settings. Planning of programmes was facilitated by having a strategy document and work plan to base initiatives on.
• The Anaemia Strategy helped anaemia control activities to be mainstreamed. Most of the ideas and elements of the strategy involved making improvements to current public health / nutrition activities and could therefore be integrated into the regular activities in the camps.
Prevention of anaemia
Prevention of anaemia through increasing the micronutrient content of the diet was a core component of the strategy:
Action 1.1. UNHCR’s anaemia strategy will be broadened to include the prevention and control of micronutrients deficiencies Action 2.1. Population level interventions will be oriented to household and individual supplementation where a very high prevalence of anaemia is found among pregnant women and young children (details in Appendix) Action 2.2. Actions using micronutrient supplements (e.g. MNP) and Ready to Use Foods (RUF) will be simultaneously coupled with nutrition education to promote better infant feeding practises, better understanding of micronutrients and sources, and better understanding of the impact of nutrition on health. This education will be especially important to avoid dependency on “specially formulated” products and to advocate for positive behavioural change of certain habits, particularly the consumption of tea in some cultures. Action 2.3. As part of the means to address anaemia and other micronutrient deficiencies in very young children, especially where prevalence of global anaemia is high, UNHCR will use Ready to Use Lipid-based Foods (RULbF) in blanket feeding of children 6 to 24 months. Annex A: Reinforcement of existing activities: A2. Micronutrient content of general food aid rations. A3. Homestead small-scale food production. Annex A: New priority actions B2. Implement preventive actions for moderate anaemia through HH based interventions and targeted feeding of vulnerable groups
Anaemia Strategy Review 29 | 1 4 0
Household level: Small-scale agriculture and animal husbandry
• Small-scale agriculture projects seem to have been partially successfully, but not without
major challenges. Local context plays a major role, due to factor such as space availability, water availability. However the support provided and reliability of funding available for them also impacts greatly.
• Importantly, reports suggest that gardening activities (in general) are greatly appreciated by refugees. They seem to play an important psychosocial role in building confidence and team work and cultivating skills. These programmes also help to diversify not only the refugees’ foods through spices such as chillies and herbs, diversify their daily activities and promote a less dependent environment.
• Animal husbandry seems to have been less successful than small-scale agriculture projects, for various reasons such as lack of feed, poor veterinary services and poor shelter for the animals. Again, the support systems around these projects are essential to their success, as is careful planning and consideration of the particularities of local context.
Individual level: Blanket Supplementary Feeding Programmes (BSFP)
• Although targeted feeding programmes are in place for children with MAM or SAM, rather than targeted feeding for anaemia, a BSFP for children of 6-59 months was decided upon. This was chosen as the appropriate route on the basis of the generally high prevalence of anaemia in refugee camps, particularly amongst children of 6-59 months.
• BSFP have been introduced in all seven countries, and use a variety of special products: MNP, low quantity LNS Nutributter®, medium quantity LNS Plumpy’doz™ and FBF+ / FBF++. The different products have been used in the following countries.
o MNP: Bangladesh, Nepal, Kakuma, Algeria and Yemen o Nutributter®: Kenya, Djibouti, Algeria o Plumpy’doz™: Bangladesh o CSB++: Ethiopia Dollo Ado, Kenya Kakuma and Dadaab (transition from
Nutributter®) o Premix with Famix / CSB+: Ethiopia other camps
• What is clear from the MNP intervention is that investment in sensitisation and behaviour
change communications is absolutely essential to MNP programmes – much more so than other products. Initial acceptability tests are not an indication of long term adherence, and managing expectations around the impact of MNP is crucial. Compliance is a major problem with MNP. (Further details provided in country sections and conclusions).
• Nutributter® and Plumpy’doz™ are considerably more acceptable in terms of their taste and usability. A challenge with these products, however, is sharing between family members at household level, such as was reported in Bangladesh for Plumpy’doz™. Further details provided in country sections and conclusions).

Anaemia Strategy Review 30 | 1 4 0
The Operational Guidance
• At the point of initiation of the strategy, experience of using special nutritional products to address micronutrient deficiencies was limited. Lessons were learnt through the adoption of special products in camps, particularly in Nepal, Bangladesh and Kenya. The Operational Guidance (OG) manual was developed to reflect this emerging knowledge base, address challenges experienced by camps, and support the implementation process of special nutritional product programmes in other countries. Through the OG initiative, knowledge of special products not only within UNHCR but amongst WFP, IPs and other organisations, has been advanced.
• The Operational Guidance initiative has been an important endeavour that showed leadership
on the use of these products. As a result, a number of the challenges experienced by countries in this review have been recognised and addressed, such as the importance of formative research, BCC, and sensitisation. These programmatic features can greatly influence success.
• The finalised OG was rolled out in December 2011. The fact that there was no recognised best practise for special product implementation before this time may help to explain some of the poor programmatic monitoring in these settings. It is hoped, moving forward, that special product programme monitoring will now improve with the help of these guidelines. However, a major concern is that the OG manual, in its intentions to lay out ‘best practise’, may be overly ambitious for many settings. Although the investment already placed in developing the OG has resulted in a very useful best practice manual, in the future there may be the need and opportunity for smaller, simplified reference documents.
Public health and reproductive health activities
The following objectives were included in the Anaemia Strategy:
Action 2.5. All existing general assistance and public health programmes that are implemented to control the multi-dimensional causes of anaemia in refugees will be strengthened by UNHCR through reinforcement of existing interventions. Annex A: Reinforcement of Existing Activities A5. Promotion of appropriate infant and young child feeding (IYCF) practices, including complementary infant foods. A6. Antenatal care services including adherence of women to iron and folate supplementation, intermittent preventive treatment (IPT) of pregnant women with sulphadoxinepyrimethamine (SP) and distribution of long-lasting insecticide treated nets (LLINs), as appropriate. A7. Appropriate obstetric care including the use of delayed cord clamping. A8. Postnatal care according to established guidelines. A9. Malaria prevention and control activities including case management with appropriate antimalarial drugs, vector control activities, and distribution of LLINs. A10. Water and sanitation provision and promotion. A11. De-worming programmes. A12. Schistosomiasis control programmes, where appropriate.

Anaemia Strategy Review 31 | 1 4 0
In depth analysis of public health activities at country and HQ level was deemed outside of the scope of this review. However, from key informant interviews, the following findings were collated: Key findings:
• The multi-dimensional approach proposed in the Anaemia Strategy is a welcome one, and
necessarily recognises the various causal pathways to anaemia.
• The objectives clearly identify the need to reinforce Public Health, including Reproductive Health, and WASH activities. However in practise, at HQ level, activities are not felt to have been influenced by the Anaemia Strategy itself. At HQ level, no special fund was allocated by the Nutrition team for Public Health activities as a result of the Anaemia Strategy. Public Health activities relevant to anaemia are thought to have moved along their own trajectory, with parallel initiatives such as the ‘Malaria Strategic Plan’. It is encouraging for anaemia that such plans were put in place, and these may have had an indirect impact on Anaemia. Nevertheless, it seems that communication and collaboration between WASH, Public Health and Nutrition at an HQ level could be developed further.
• However, at country level Anaemia Strategy funds seem to have been fed into a diverse set of activities including Public Health activities. As they were supplementing general budget lines, however, the funds were diluted as they reached the Branch Offices and then the IP. This disconnect between resource flows and outputs means that determining the impact of the Anaemia Strategy as opposed to more general improvements to public health programmes is not possible.
• At country level, understanding about the role of intestinal worms and malaria on the prevalence of anaemia seems to be well developed. A wider gap seems to exist between WASH and nutrition than Public Health and nutrition. Very little knowledge of WASH activities was exhibited by key informants. A stronger understanding and communication between these departments is desirable to strengthen the Anaemia Strategy implementation process.
Detection and management of anaemia Two UNHCR ‘new priorities’ were described in the Annex of the Anaemia Strategy regarding improving screening and diagnosis:
Annex A: Reinforcement of Existing Activities A1. Clinical diagnosis and treatment of anaemia according to existing protocols (including appropriate treatment with iron in malaria endemic areas). Annex A: New priorities

Anaemia Strategy Review 32 | 1 4 0
B1. Expand the use of point-of-care diagnostic technology for diagnosing cases of moderate and severe anaemia in primary and secondary health care facilities; this will include capacity building for staff. B2. Treatment of severe anaemia through improved screening of high risk individuals. B3. Develop a simplified treatment action flow chart for diagnosing and treating anaemia in individuals and for determining interventions at the camp level.
Key findings:
• Specific information regarding changes to diagnostics and laboratories has either not been
monitored or was not accessible to the review. Although there are some anecdotal suggestions from country camps, such as Kakuma, that such diagnostic capacities have improved, no evidence for this has been documented. As a result, centralised knowledge of improvements to POC diagnostic technology is limited.
• Although a treatment action flow chart was developed, this was found to be largely redundant
in most settings as national protocols are adhered to in clinics.
• Screening of high risk individuals is not thought to have changed considerable, other than the improved method (HemoCue™) being standardised – although this is yet to reach 100% coverage.
Monitoring and evaluation
Monitoring and evaluation (M&E) is recognised to be absolutely essential to understanding the impact of interventions and programmes and to improve upon services. As such, M&E constituted a core part of the Anaemia Strategy:
Action 6.2. The monitoring and evaluation strategy will ensure that: · Partners are well versed and on the requirements to prepared and implement such programmes. Guidance will be provided on ways to deal with compliance, nutrition education components, and community preparation; · Initial assessment and collection to determine baseline data (including qualitative and quantitative) are standardised but can be modified according to context; · A monitoring scheme is built into the programme and staff are trained accordingly; · A standardised evaluation with agreed upon indicators will be conducted to determine the impact of the programme including areas such as cost effectiveness and compliance. (see Appendix for details) Annex A: Monitoring and Evaluation, and Operational Research C1. Compliance. A simple acceptability and adherence measurement tool will be developed to allow monitoring and evaluation of these aspects during their introduction. A similar tool will also be used to investigate adherence to established iron tablet supplementation programmes where the need for this information is established.

Anaemia Strategy Review 33 | 1 4 0
Various components of M&E are important to the Anaemia Strategy. At the country level, to understand how well interventions are working, a combination of programme coverage data, anaemia prevalence data, and contextual data regarding other interventions or influencing factors is needed. At HQ level, annual nutrition surveys are vital information sources.
Country programme monitoring
• Programme monitoring data over the period of the Anaemia Strategy has been difficult to
obtain. Unfortunately, even what might seem the most essential core information such as the month in which a nutrition intervention was started, is not always possible to obtain or conflicting information is received, for example regarding the Nutributter® intervention in Kakuma and the tuna fish intervention in Yemen. Although in some countries information was recorded formally, in others it is subject to key informant recollection, which is further challenged by turnover of the relevant staff involved.
• Monitoring at household level is lacking for most countries. It seems there is poor accountability and delineation of roles and responsibilities for monitoring of nutritional programmes. Key informants state this is due to a number of factors including lack of capacity, resources, competing priorities within nutrition and, where relevant, security problems. Security issues have impeded monitoring in Yemen, Algeria, and Dadaab.
• For those countries that have developed more structured systems for household monitoring, namely Nepal and Bangladesh, it was widely felt that this monitoring does not necessarily reflect the reality of the situation. In Nepal, the monitoring conducted has led to informant fatigue; questions are felt to be monotonous and informants tend to answer what they know is required as the ‘correct’ answer.
• Regarding compliance, although an ‘adherence, usage and monitoring’ tool has been developed and described in the OG, the use of this tool locally appears to be patchy. Compliance continues to pose a significant challenge to iron tablet supplementation and special nutritional product use. For example, in Bangladesh, one key informant commented about MNP “they know exactly what to do and do completely different”
Nutrition surveys
Annex A: Monitoring and Evaluation, and Operational Research B4. Universalise and standardise the measurement of anaemia in surveys. C3. Standardise measurements
• At the start of the Anaemia Strategy, measurement of anaemia prevalence during nutritional surveys was undertaken using various different measurement and analysis procedures, due to the wide number of partners implementing surveys. Surveys were inconsistent and often lacked key indicators.
• Standardisation of surveys is an initiative that the UNHCR nutrition team has taken clear
ownership of, investing heavily in the development of the Standardised Expanded Nutrition

Anaemia Strategy Review 34 | 1 4 0
Survey (SENS) Guidelines for Refugee Populations. The SENS initiative builds on the standardisation efforts of SMART and others.
• Nutrition surveys are starting to show improvements in quality through the development of SENS. This is clear, for example, in the nutrition surveys from Ethiopia in 2008 vs. 2012. Confidence intervals are now included, analysis such as mean Haemoglobin is now included in reports as standard, and more rigorous comparisons can be made between camps and countries.
• The broader, inclusive remit of the current SENS comes with its own challenges, however. Key informants recognise the additional pressure on capacity and time to complete SENS vs. basic nutritional indicators.
• The SENS approach to nutrition surveys has not been universalised as yet, but is increasingly being incorporated in camp nutrition surveys.
Capacity building
Although capacity building was not a core component of the original Anaemia Strategy, throughout the course of the strategy this became an important objective. Capacity was built on three fronts: monitoring and evaluation (training on SENS), programme support (training on the OG), and the recruitment of national consultants.
Monitoring and evaluation - training on SENS
Training has been conducted on SENS since 2010: • Relevant individuals from UNHCR / IPs in all 7 countries in the strategy have been trained on
SMART / SENS: • 51 individuals in total have been trained on SENS (across a wide range of countries) • 84% of participants went on to use SENS in some capacity after the first three SENS training
i.e. not including participants from November 2012 – 26% went on to lead surveys – 37% went on to assist surveys – 9% went on to use SENS in another capacity, as a consultant, a trainer or in office
• 10 individuals received additional ‘on the job’ in field training from specialists in UNHCR and / or UCL, particularly in Algeria
Programme support – training on the ‘Operational Guidance for use of Special Products’ Training on the OG was conducted in Mombasa in July 2011 and Geneva in October 2012 (15 participants from 10 countries, details out of the scope for this review).
• 20 participants from 12 countries were trained in Mombasa 2011 – 3/12 countries went on to use the OG after staff attended the Mombasa training event – 4/12 countries used the OG training to some extent to further improve existing
programmes.

Anaemia Strategy Review 35 | 1 4 0
– However participants from the remaining 5/12 countries are not reported to have used the training as yet
• Importantly, despite the expectations to pass on the OG training locally, in the vast majority of cases this has not happened. In only 2 of the countries participating in Mombasa has training been passed on. Reasons for this need to be investigated more closely to ensure the benefits of investing in such training are maximised.
National consultants
In addition to capacity building of current staff and IPs, funds were also allocated to hiring the individuals as national consultants specifically to support the Anaemia Strategy in the following countries:
• Kenya x1, Djibouti x1, Rwanda x1, Eritrea x1, Uganda x1 This is believed to have added great value to the countries in question. For example, the nutrition consultant in Djibouti made particular efforts to pass on the Operational Guidance training to IP staff and nutrition cluster partners.
Additional Anaemia Strategy objectives
Several outstanding and specific activities are outlined in Annex A of the Anaemia Strategy. These include:
B5. Revise policy and the WFP/UNHCR MOU (2002) with regards to responsibilities in commodity provision and fortification responsibilities. B6. Advocate for additional funds and donations in kind to prevent and treat micronutrient malnutrition. B7. Other agencies, such as UNICEF, have been working on various approaches for improving the micronutrient content of food aid. UNHCR will explore areas of potential collaboration at an operational level with these agencies. B8. Develop IEC for anaemia prevention and reduction and to support compliance through interagency collaboration (e.g. UNICEF), and to develop behaviour change in areas such as tea consumption and/or consumption of foods that enhance iron absorption (e.g. fermented food and animal protein, etc.). B9. Iron Dosage. An area of uncertainty raised by field operations concerns the appropriate dose of iron that should be provided. Published evidence on this issue will be reviewed and practical guidance produced and disseminated via UNHCR Health Coordinators. This guidance will form part of a simplified anaemia diagnosis and treatment flow chart that will be developed for use by implementing partners
Key findings:
• The final revised MOU was consolidated in January 2011, just after the intended deadline of December 2010. The new MOU clearly outlines the joint partnership, roles and responsibilities of the UNHCR and WFP with regards to special nutritional products.
• HC special funding supported the strategy between 2008 and 2012. Additional proposals were written to the Gates Foundation and a UAE Foundation but both were refused. Proposal
Anaemia Strategy Review 36 | 1 4 0
writing appears to be done on a relatively ad-hoc basis and perhaps would benefit from more clearly outlined roles, responsibilities and timelines.
• No particular evidence has been found to suggest linkages with UNICEF and other agencies have improved or specific efforts made in this direction. This is potentially an area of unexploited opportunity for UNHCR.
• Behaviour change communications (BCC) were addressed in the Operational Guidance, and countries such as Nepal are reported to developed and implemented these well. Gaps however exist in other countries, such as Yemen, where high tea consumption is prevalent and BCC may not have been effectively implemented.
• It is not known to the authors whether a review of appropriate iron dosage has been conducted by UNHCR and practical guidance made available

Anaemia Strategy Review 37 | 1 4 0
CHAPTER 4: ANALYSIS OF STRATEGY ACTIVITIES AT
COUNTRY LEVEL AND TREND ANALYSIS OF NUTRITIONAL
INDICATORS
A) BANGLADESH
I) Background and context
Myanmar refugees reside in the two camps of Bangladesh, Kutupalong and Nayapara. These camps were established in 1991-92 by UNHCR and the refugees are receiving basic humanitarian assistance including primary health, water, sanitation and shelter from UNHCR, while WFP provides the food ration. The camps are ‘closed’ in that refugees are not officially allowed to leave and engage in income generating activities.
Table 4: Key information, Bangladesh
Bangladesh - camps within review
Majority ethnicity Malaria Implementing partner for nutrition
Kutupalong Nayapara
Myanmar Endemic ACF
The registered populations in the camps of Cox’ Bazaar have remained relatively stable, moving from an estimated 10,800 to 12,160 in Kutupalong and 16,720 to 17,900 in Nayapara (Figure 2). However, in May 2009, around 5,000 refugees registered with UNHCR living inside the camps were not getting general food ration as they were not registered with the Government of Bangladesh. Additional pressures on services, sharing of food provisions, and various other factors may have had a detrimental effect on the nutritional status of those within the camp. Figure 2: Population of Nayapara and Kutupalong, 2008-2012

Anaemia Strategy Review 38 | 1 4 0
Data on Malaria incidence from HIS The confirmed incidence of malaria in the two camps is very low, with an average of 1.07 cases / 1000 / month between 2008 and 2012, and ranging from 0 to 11.27 (HIS data) General food distribution The planned general ration has a target of 2,100 kcal/person/day. The food basket is made up of 2,190 kcal, including 50 g of protein and 25 g of fat and some essential micronutrients. Although energy and protein requirements are met, the basket provides only 60% of the requirement for fat and is very low in iron content. This food basket provides limited dietary diversity and diet quality and has not changed since 2001. Complementary foods including fresh items are extremely limited22. The 2010 JAM recommended introduction of fortified wheat flour instead of blended food. From September 2011, WFP adapted the contents of the basket to include WSB+ / SuperCereal. Table 5: Quantities and food items distributed in Bangladesh, 2013
Food commodity Amount per person per day (g)
Par boiled rice 450
Lentils / pulses 40
Vegetable oil (enriched with Vitamin A) 20
WSB+ / Supercereal 50
Sugar 10
Iodised Salt 10
The Nutrient Gap
22 Source: JAM 2010

Anaemia Strategy Review 39 | 1 4 0
Analysis of the nutrient adequacy of the planned general ration was performed using NutVal23, and demonstrates how the crucial micronutrients, iron and vitamin A, are both inadequate in the ration, in addition to riboflavin, calcium, and fat. This is likely to be a major contributor to population levels of anaemia. Table 6: NutVal analysis of the general ration contents, Bangladesh
Energy Protein Fat Calcium Iron Iodine VitA ThiamineRiboflavin Niacin VitC
Requirements provided by ration (%)
104% 97% 64% 57% 60% 413% 87% 144% 54% 213% 189%
SFP and OTP SFP and TFP services are in place for acute malnutrition in the camps.
II) Anaemia Strategy funding and management Funding for strategy in Bangladesh Funds requested in the country proposal (to be allocated from both HC special fund and standard programme budget) totalled USD $ 1,236,153. Information on programme funding is not available, but funds allocated from the HC special fund are as follows: Figure 3: Allocated funds from High Commissioner special fund
Bangladesh Allocated Funds ($)
Funds allocated in 2009
Funds allocated in 2010
Funds allocated in 2011
Funds allocated in 2012
Total allocated funds
395,547 139,594 375,000 130,000 1,040,141
Anaemia strategy management issues No specific management issues or challenges have been identified other than those relating to special products (see below).
III) Anaemia Strategy activities Diversification of Food and Reducing Reliance - Agriculture and Animal Husbandry
23 ‘NutVal 3.0 A Spreadsheet Application for Planning, Calculating, and Monitoring the Nutritional Value of Food Aid’ http://www.nutval.net

Anaemia Strategy Review 40 | 1 4 0
• Small-scale agriculture and animal husbandry projects were introduced and up-scaled as part of the Anaemia Strategy. However, it seems these interventions were not entirely successful, due primarily to lack of space for gardening activities. Poor coordination was cited as a reason for failure of egg laying projects. The host government also acted as a barrier, prohibiting the introduction of small fish ponds.
Use of Special Nutritional products in BSFP
• Although initial plans within the country proposal were for all refugees over 6 months to receive MNP, the strategy ultimately adopted in Bangladesh was a blanket SFP just for children aged 6-59 months.
• MNP was distributed to all children 6-59 months between August 2008 and August 2009. In response to a high GAM prevalence measured in that years’ nutrition survey (GAM of 18.7, 95% CI 16.2-21.2), Plumpy’doz™ was introduced for 6-35 months and MNP for 36-59 months, for a period of 4 months, before MNP was reinstated for all these children.
Table 7: Blanket SFP interventions implemented, Bangladesh
Experience of BSFP implementation
• The switch between MNP and LNS and then back to MNP (August – December 2009) caused
considerable disruption to services and frustration amongst beneficiaries; key informants speak of the ‘violent reaction’ to the return of MNP and demands for Plumpy’doz™ to be reinstated. Beneficiaries no longer came to the distribution centre to collect their MNP, causing major disturbance to the programme.
BSFP and Nutritional Supplement Programmes
Regimen Target Delivery Start date End date
MNP 1 sachet every
other day 6-59 months
Monthly in GMP
Aug / Sept 2008
On-going with break Aug 2009-Dec
2009
MNP 1 sachet every
other day 36-59 months
Monthly in GMP
Aug 2009 Dec 2009
LNS: Plumpy’doz™
4 pots per month
6-35 months Monthly in
GMP Aug 2009 Dec 2009
Iron / folic acid tablet
1 tablet / day Blanket pregnant
women (2nd and 3rd trimester)
Weekly 2010? Ongoing
Calcium tablet 1 calcium
lactate tablet/day
Blanket pregnant women (2nd and 3rd
trimester) Weekly by SFP 2010? Ongoing

Anaemia Strategy Review 41 | 1 4 0
• It is clear that Plumpy’doz™ was much more acceptable to beneficiaries than MNP, due to its preferable taste and usability, as well as being ‘ready to use’ – particularly attractive in the camps of Bangladesh where fuel shortages are an issue.
• Unfortunately, no acceptability trial was done before the introduction of MNP / LNS, only a cohort study during the intervention in 2010 to explore these issues. This did not raise particular concerns with either MNP or Plumpy’doz™. This suggests that the acceptability studies are not necessarily indicative of long term uptake and compliance.
• As with several other countries, rumours propagated around the nature of MNP, including that it would promote skin disfigurement. Expectations were raised inaccurately with regards to the ability of MNP to promote weight gain and strength in the child; this prompted criticism over efficacy and may have reduced adherence.
• Compliance is a major problem with MNP in Bangladesh. Although the distribution levels of MNP are excellent, household consumption is estimated at as little as 50%.
Table 8: Coverage and Consumption of MNP
Distribution Coverage Consumption at household level
MNP program 2010 >90% Around 40% of beneficiaries24
MNP program 2011 >90% Around 50% of beneficiaries25
• The problem of under-consumption was not experienced with Plumpy’doz™ according to key
informant interviews. Malaria control
• Malaria control activities include the introduction and sustained use of long-lasting insecticide treated bednets (LLINs) and institutionalization of the use of new generation, more effective, anti malarial medicines 26. However, the 2010 JAM also reported the selling of the ration to acquire non-food items including bed-nets, therefore review of the distribution is needed. Nevertheless, it does seem that advances have been made in malaria incidence, which is now extremely low (see above). No information is available on IRS spraying.
De-worming
• De-worming activities were up-scaled during the strategy period. De-worming is conducted for children of 6 months and older, in schools on national de-worming day, and as a blanket intervention for pregnant women in the 2nd trimester.
• In 2012 de-worming coverage from nutrition surveys across both camps was 92.5% (90.5%-94.5%), increasing considerably from 67.9% in 200927 (no data available for baseline 2008).
• Incidence of worms reported in HIS is extremely low and no particular spike might have affected nutrition survey results (Figure 4).
24 Rah J, De Pee S, Kraemer K, Steiger G, Bloem M, Spiegal P, Wilkinson C, Bilukha O (2012) Program Experience with Micronutrient Powders and Current Evidence. J. Nutr Vol 142 pp191–196 25 Presentation from Bangladesh - Workshop on ‘Operational Guidance on the use of Special Nutritional Products to Reduce Micronutrient Deficiencies and Malnutrition in Refugee Population’. October 2012 26 2010 JAM Bangladesh 27 Bangladesh Nutrition Survey 2012

Anaemia Strategy Review 42 | 1 4 0
Figure 4: Incidence of Intestinal Worms, Bangladesh, both camps28
Vitamin A supplementation:
• Vitamin A supplementation has been excellent in the camps. In 2008 the prevalence was 93% amongst both camps, which has increased to 96.7% (95.5%-97.9%) in 2012.
IYCF
• Various IYCF services are in place, including breastfeeding support groups, although it is unknown whether these have changed considerably due to the strategy.
• Exclusive breastfeeding prevalence was moderate, at 68.6% (59.8%-77.4%) in 2012. • Consumption of iron rich foods amongst 0-23 months was also reasonable, around 75.2%
(72.7%-77.7%). Iron supplementation in ANC
• The proportion of mothers receiving Iron Folic Acid pills in 2012 was 72.1% (63.0-81.3) in 2012 in both camps. There is a gap between ANC coverage and receipt of IFAs which needs to be addressed.
Other
• WASH: Camp sanitation and personal hygiene, as well as solid waste management, continue to be an issue and could be linked to anaemia levels (JAM 2010).
• IEC : Although not specifically identified as an issue, the extremely low literacy levels in the camps (70% heads of households without any formal education) may be impacting on the delivery of communication messages on special products, as well as general health, nutrition and IYCF practises.
IV) Trend analysis of nutritional indicators Data Caveat:
• One important note is necessary regarding the Bangladesh survey data from 2008 and 2009. In these years, the surveys were planned to be representative of both camps combined. It was only from 2010 onwards that representative surveys were conducted separately for each camp. This was due to emerging observations of the differences between the camps. As such, the disaggregated data per camp for 2008 and 2009 should be interpreted with caution,
28 Health Information System data
* * * *

Anaemia Strategy Review 43 | 1 4 0
particularly when disaggregating for categories of anaemia (<10g/dl, <11g/dl) and age. The data from 2010 onwards is considered to be more robust.
Children 6-59 months Total Anaemia trends (<11g/dl):
• Baseline data for Bangladesh is taken as 2008 • In children 6-59 months, total anaemia <11g/dl has fluctuated considerably over the course of
the Anaemia Strategy. – A significant reduction was shown in the first year of the strategy, however this was
followed by a significant increase in 2009, likely due in part to the disruption of the BSFP as a result of the product switch from Plumpy’doz™ back to MNP
– Between 2010 and 2012 there has been a significant decrease in total anaemia – Overall, between 2008 and 2012 anaemia has moved from a being a ‘high’ to
‘medium’ public health concern
Stunting: • Stunting prevalence shows a significant decrease between 2008 and 2011/2012. However, the
prevalence remains extremely high at 60.5% (59.0-62.0) in 2012, double the threshold for being a ‘high’ public health concern (≥30%)
– No significant difference in stunting prevalence was observed until the third year of strategy implementation
GAM: • A significant spike in the prevalence of GAM was reported in 2009, increasing from 8.9%
(6.9-10.9) to 19.1% (15.6-22.6) – the reasons for this are unknown • GAM has remained a ‘high’ public health problem this increase in 2009 • GAM was also ‘critical’ in 2011, with a prevalence of 16.6% (14.6-18.6)

Anaemia Strategy Review 44 | 1 4 0
Figure 5: Global Acute Malnutrition (GAM), Stunting and Total Anaemia prevalence in 6-59 months, Bangladesh29
Total Anaemia trends (<11 and <10g/dl) and severity categories
• Interestingly, although total anaemia <11g/dl fluctuated considerably between 2008 and 2012, total anaemia <10g/dl shows a smooth downward slope, with no particular spike reported in 2010 in both camps
• Looking at severity, it seems the spike in anaemia in 2010 was primarily due to a substantial increase in mild anaemia - almost doubling from 20% to 39% between 2009 and 2010 in both camps. In Nayapara, whilst in 2008 mild and moderate anaemia has been in equal proportion (at 28%), in 2010 mild anaemia makes up 43% of the total anaemia, and moderate only 10%
• The overall composition of ‘anaemia’ has changed between 2008 and 2012. Substantially less moderate and severe anaemia are reported, but levels of mild anaemia remain similar (24% in 2008 and 25% in 2012). Moderate anaemia has reduced every year since 2008, and the prevalence of severe anaemia has also remained at 0% since 2010, compared to 2% in both camps in 2008
• These results are encouraging, therefore, suggesting the Anaemia Strategy may have had a particular effect on severe and moderate anaemia – which might not be otherwise visible from the total anaemia <11g/dl graphs
29
Note: Although dates of the special nutritional product interventions have been illustrated on the graph, it is recognised that other interventions and activities may also be contributing to the observed changes

Anaemia Strategy Review 45 | 1 4 0
Figure 6: Total Anaemia (<11g/dl and <10g/dl) in 6-59 months, Bangladesh
Figure 7: Anaemia Severity Categories in 6-59 months, Bangladesh
Mean Haemoglobin in 6-59 month children

Anaemia Strategy Review 46 | 1 4 0
• As might be expected from the anaemia prevalence results, only in Nayapara has mean haemoglobin increased significantly between 2008 and 2012. Fluctuations are shown throughout the period in both camps, and no overall increase is shown in Kutupalong.
Figure 8: Mean Haemoglobin in 6-59 month children, Bangladesh
Age categorisation Total Anaemia trends (<11g/dl, <10g/dl) in 6-23 and 24-59 months, Bangladesh
• As expected, anaemia prevalence (total <11g/dl) is much higher and mean haemoglobin much lower in 6-23 months than 24-59 months, as shown in the figure below.
• Interestingly, it seems a substantial reduction in total anaemia in 24-59 months in Nayapara is driving the entire reduction in total anaemia seen in 6-59 months (20010-2012, both camps). Between 2010 and2012, no significant change in total anaemia has been shown in 6-23 months in either camp.
• Overall, the results tentatively suggest that children 24-59 months have been more susceptible to the Anaemia Strategy interventions, and that Nayapara has had more success in addressing anaemia. There is a possibility that having a poorer health and nutrition status initially offers more opportunity to make advances.
• Again, data from 2008 / 2009 should be interpreted with significant caution due to the caveat explained at the start of this section

Anaemia Strategy Review 47 | 1 4 0
Figure 9: Trends in Total Anaemia (<11g/dl) in 6-23 and 24-59 month children, Bangladesh
Figure 10: Trends in Anaemia <10g/dl in 6-23 and 24-59 months, Bangladesh

Anaemia Strategy Review 48 | 1 4 0
Mean Haemoglobin concentration in 6-23 months and 24-59 months
• Amongst children 6-23 and 24-59 months, Mean haemoglobin remains unchanged in Kutupalong, but has significantly increased in 24-59 months in Nayapara, as shown below.
Figure 11: Mean Haemoglobin in 6-23 and 24-59 months, Bangladesh
Non-pregnant women • Unfortunately, data on anaemia in non-pregnant women is only available for 2011/2012; this
was not collected in prior nutrition surveys. • As shown in the figure below, there has been no significant change in total anaemia between
2011 and 2012 in either camp, however moderate anaemia has reduced in Kutupalong camp since 2011.
• Anaemia is now a moderate public health problem in the camps in Bangladesh today. Figure 12: Anaemia Severity Categories in Non-Pregnant Women, Bangladesh

Anaemia Strategy Review 49 | 1 4 0
Table 9: Mean Haemoglobin in Non-Pregnant Women, Bangladesh
Camp 2011 Mean Hb (g/dl) (95% CI) 2012 Mean Hb (g/dl) (95% CI)
Nayapara 12.8 (12.6-12.9) 12.8 (12.6-12.9)
Kutupalong 12.7 (12.5-12.9) 13.0 (12.8-13.1)
Both Camps 12.7 (12.6-12.9) 12.8 (12.7-12.9)
Summary:
• A number of activities have been introduced or up-scaled through the Anaemia Strategy. BSFP with MNP was initiated promptly, but it is unfortunate that a switch of product was necessitated in 2009, as this has somewhat disrupted analysis of the BSFP intervention. The spike in anaemia is likely to be due to disruptions to adherence as a result of switching products.
• Food diversification activities were not completely successful due to a number of reasons but efforts were made nonetheless. Public health services seem to have improved, particularly de-worming. Lastly, monitoring data from Bangladesh is good, and reveals the important problem of compliance to MNP.
• Anaemia prevalence reduced significantly in the first year of implementation, before spiking considerably, and then reducing again to a significantly lower level than in 2008. More reliable and representative data is provided from 2010 to 2012, which shows a reduction in anaemia in both Kutupalong and Nayapara. GAM remains a high public health problem, of particularly critical concern in 2009 and 2011. Stunting is extremely high, despite decreasing between 2008 and 2011.

Anaemia Strategy Review 50 | 1 4 0
B) NEPAL
I) Background and context Ethnic persecution in 1991 led to approximately 100,000 Bhutanese of Nepali ethnicity settling in 7 refugee camps of South-Eastern Nepal. The refugees in the camps remain highly dependent on food aid, receiving rations from WFP, and primary healthcare services from UNHCR through its implementing partner, the Association of Medical Doctors of Asia (AMDA). Table 10: Key information, Nepal
Nepal - Camps within review Majority ethnicity Malaria Implementing
partner for nutrition
Damak: originally 7 camps, reduced to 2: Beldangi and
Sanischare Bhutanese Low prevalence AMDA
A major resettlement programme has been in action since 2007/2008, with some 65,325 refugees having been resettled in third countries, resulting in a population of approximately 47,000 by mid-2012. The resettlement programme is continuing, with departures of 12,000 to 18,000 per year; in five years time it is expected that only 10,000 refugees from Bhutan will remain in Nepal. Figure 13: Population of refugee camps in Nepal during period of Anaemia Strategy30
Reports, surveys and key informant interviews indicate that the resettlement programme has substantially changed camp dynamics. Management has been more challenging. It has been suggested that those that were resettled more quickly were those from a higher socioeconomic level than those
30 Health Information System data

Anaemia Strategy Review 51 | 1 4 0
remaining, although this is not subject to any formal evidence. In addition, families with children with health complications may be slower, or faster, to resettle. Data on Malaria incidence from HIS
• Malaria incidence is very low in Damak and unlikely to be a driver of anaemia.
Figure 14: Suspected Malaria Incidence in children 6-59 months, Nepal (2008-2012)31
General food distribution The food basket has had few adjustments since the 2008 JAM, other than slightly increasing the salt quantity and changing chickpeas (20 g) to dried beans (40 g) and reducing lentils from 40 g to 20 g. Table 11: Quantities and food items distributed in 2011, Nepal
In addition, UNHCR provides 250 grams of seasonal fresh vegetables and 10 grams of ginger per person per week in order to supplement the basic ration and provide some variation in the diet (JAM 2008).
31 Health Information System data
Food Commodity Quantity (grams/person/day)
Rice 400
Dried beans 40
Lentils 20
Fortified Vegetable Oil (Vit A and D) 25
Sugar 20
Fortified Blended Food (WSB/Unilito/SuperCereal) 35
Iodized Salt 8

Anaemia Strategy Review 52 | 1 4 0
The Nutrient Gap Analysis of the adequacy of the planned general ration was performed using NutVal. Although the ration provides 100% of energy needs, it seems to be inadequate in terms of protein, fat, calcium, iron, iodine, Vitamin A and riboflavin. This may be having a major impact upon anaemia levels in the camps. Table 12: NutVal analysis of the general ration contents, Nepal
Energy Protein Fat Calcium Iron Iodine VitA ThiamineRiboflavin Niacin VitC
Requirements provided by ration (%)
100% 91% 75% 53% 58% 329% 81% 137% 48% 194% 131%
Acute malnutrition services
• Both SFP and TFP for MAM and SAM are in place in the camps in Nepal.
II) Anaemia Strategy funding and management Funding for the Anaemia Strategy in Nepal Funds requested in the country proposal (to be sourced from regular budget for country programmes as well as HC special funds): USD $1,553,460. Information on programme budgets is unavailable, but funds allocated from the HC special fund are as follows: Table 13: Allocated funds from High Commissioner - Nepal
NEPAL – Allocated funds ($)
Funds allocated in 2009
Funds allocated in 2010
Funds allocated in 2011
Funds allocated in 2012
Total allocated funds
561,392 80,000 0 0 641,392
Anaemia strategy management issues
• Ensuring services are delivered efficiently despite the resettlement programme is a major
challenge for the Nepalese camps. Not only is there an extremely high turnover of AMDA staff, both national and refugees leaving on resettlement, but the remaining staff are said to lack engagement and commitment to improving services.
• Resignation of the national nutrition consultant during the start-up phase of the Anaemia Strategy also affected initiation of the main components; the replacement only arrived in January 2010.
• Some funding issues were raised, reportedly reduced funds as a result of the resettlement.

Anaemia Strategy Review 53 | 1 4 0
• An encouraging example of knowledge sharing emerges from Nepal, where the nutrition officer’s mission to Cox’s Bazaar as well as a workshop in Bangkok provided opportunities for discussion of best practise including routine household monitoring of MNP consumption, which was henceforth implemented.
III) Anaemia Strategy activities Diversification of Food and Reducing Reliance - Agriculture and Animal Husbandry
• A home gardening program was implemented on a wide scale in the camps, encouraging
refugee families to grow fresh fruits and vegetables in small kitchen gardens, provided education and supported the practicalities of seed, tool and water provision32.
• The objective of the country proposal was to enable up to 30% of the vegetables bought by the refugee household to be substituted by home-grown vegetables – details on whether this target has been met are not available.
Use of Special Nutritional products in BSFP
• An MNP supplementation programme for children was introduced by AMDA, with the support of UNHCR and WFP. MNP was the chosen approach due to both high levels of anaemia and stunting but low GAM.
Table 14: Blanket SFP intervention implemented, Nepal
• A custom-formulation was developed by DSM Nutritional Products Ltd that took into account
the provisions in the GFD, so as to avoid excessive micronutrient intake. This led to a formulation that had:
o Reduced vitamin A and iodine (given fortified food in the GFD) o Reduced copper (to avoid 1mg’day maximum dosage for 1-3yr olds) o Addition of Vitamin K (due to inadequate vegetable consumption) o In April 2009, Vitamin C was doubled from 30 mg to 60 mg to increase iron
absorption33 Experience of BSFP implementation 32 Rah J, De Pee S, Kraemer K, Steiger G, Bloem M, Spiegal P, Wilkinson C, Bilukha O (2012) Program Experience with Micronutrient Powders and Current Evidence. J. Nutr Vol 142 pp191–196 33 Bilukha O, Howard C, Wilkinson C, Bamrah S, and Husain F (2011) Effects of multimicronutrient home fortification on anemia and growth in Bhutanese refugee children. Food and Nutrition Bulletin Vol 32(3) pp264-276
BSFP and Nutritional Supplement Programmes
Target Regimen Delivery Start date End date
MNP 6-23 1 sachet/ alternate
day Monthly during GMP March 2008 On-going
MNP 24-59 1 sachet/ alternate
day Bi-Monthly during
GMP March 2008 On-going

Anaemia Strategy Review 54 | 1 4 0
• Delays preparing the new formula MNP and passing of the DLUO of the old ones caused disruption to distribution of MNPs
• No acceptability study was conducted (the Operational Guidance tool had yet to be developed)
• MNP programme monitoring and evaluation in Nepal is relatively well established, through monthly monitoring and weekly ‘random hut visits’.
o Distribution coverage of MNP was high amongst the target population, at 96.1% (2011). Follow ups are made by community health workers for those who have reportedly not attended distribution.
o In 2011, over 90% of carers reported their child’s consumption of MNP at the last meal
• However, there is a concern amongst AMDA staff that adherence to MNP is not nearly as good as monitoring would suggest. The key challenges for compliance include changes to the colour and smell of food, as well as reported side effects. In the Nutrition Survey 2011:
o 64.1% reported changes to the colour of food when mixed with MNP o 12% reported a change in smell o 6.3% side effects ( nausea being the most common) o However, the majority of respondents also reported an increase in their child’s
appetite (87.9%), energy level (91.9%), and health (87.7%) since the child started consuming the MNP.34
• Key informants in AMDA also spoke of ‘respondent fatigue’ – that refugees are becoming exasperated by the levels of monitoring and are answering the questions in a scripted fashion. This is important to note – the additional monitoring is not necessarily adding to the quality of data reported, only the quantity. Reliable information at household level is therefore lacking.
• It might be more effective to conduct less frequent monitoring, but to spend more time using qualitative and anthropological techniques to fully engage with programmatic issues such as compliance.
Malaria control
• Malaria control activities are in place, including IRS before the seasonal outbreak and bed net distribution. Incidence is extremely low in the camp.
De-worming
• Children aged 12 to 59 months are de-wormed with Albendazole following the same twice a year schedule.
• Coverage of the de-worming program increased from 89% in 2007 to 95% in 2010 and then back to 90% in 2011. However, this apparent decrease may in fact be due to a change in methodology – prior surveys relied upon self-report of de-worming, while the current survey requires confirmation by card.
• Incidence of intestinal worms in children 6-59 months was very low throughout the Anaemia Strategy period, and is unlikely to have influenced anaemia levels (see figure below). No particular spikes in incidence were revealed by HIS data that may have affected nutrition survey anaemia results.
34 Nutrition and Micronutrient Survey among Bhutanese Refugee Children - Damak, Nepal (2011)

Anaemia Strategy Review 55 | 1 4 0
Figure 15: Incidence of intestinal worms in 6-59 months, Nepal (HIS data)
Vitamin A supplementation:
• Children aged 6 to 59 months received vitamin A supplements (200,000 IU) twice a year, with coverage above 90% in all years. However, from 2007 to 2011 there was in fact a slight decrease in coverage from 96.6% to 91.9%.
IYCF:
• Close to 100% of children aged 6-23 months were breastfed, decreasing gradually from then. Behaviour change communications:
• In early 2009, educational messages intended to reduce tea consumption in children were introduced. This seems to have had a dramatic impact, as the following table demonstrates:
Table 15: Prevalence of foods consumed in the previous 24 hours, by time of survey, Nepal35
Indicator Jan 2007 Oct 2008 May 2009 May 2010
Tea consumption in 6-23 months
30.8% 33.1% 3.9% 1.5%
Tea consumption in 24-59 months
62.2% 69.0% 16.0% 8.3%
Other:
• Food consumption: Importantly in 2011, the nutrition survey reports on changes in the amount and nutritional value of food consumed outside of the GFD. The number of children consuming iron rich meat and eggs during the past day (83.0%) had significantly increased from 2010. Conversely, only 43.2% of children had consumed Super Cereal almost every day
35 Rah J, De Pee S, Kraemer K, Steiger G, Bloem M, Spiegal P, Wilkinson C, Bilukha O (2012) Program Experience with Micronutrient Powders and Current Evidence. J. Nutr Vol 142 pp191–196

Anaemia Strategy Review 56 | 1 4 0
in 2011. The role of meat, therefore, is important to recognise alongside any potential impact of SuperCereal or the MNP intervention on anaemia levels in 2011.
• Diarrhoea: May have affected anaemia levels; the percentages of children admitted to the health clinic for diarrhoea remained consistently high at 75% to 80%36
• Iron supplementation in ANC: No information is available. The focus in Nepal is on Bhutanese children.
IV) Trend analysis for nutritional indicators Baseline data
• Baseline data for Nepal is taken as 2007, as this was the survey prior to initiation of strategy activities.
• Unfortunately surveys were conducted at very different times of the year which reduces comparability of the results: March 2007, October 2008, May 2009, May 2010 and December 2011.
Children 6-59 months Total Anaemia trends (<11g/dl)
• The results from the nutrition surveys conducted between 2007 and 2011 show a decreasing trend in Anaemia prevalence. However, no significant change in anaemia prevalence was shown in the first year of the strategy between 2007 (43.3%) and 2008 (43.6%), or between 2007 and 2010 (40.2%). Anaemia prevalence was significantly lower than baseline data in 2009 (35.9%) and 2011 (26.1%).
• Anaemia prevalence in 2011 showed a dramatic reduction compared to 2010 and across the four year period, and a significant increase in mean haemoglobin from 2007 to 2011 (11.2 to 11.5 g/dl)
• The 2011 results add to the published data by Rah et al (2012) evaluating the effectiveness of MNP in Nepal up to and including 2010 data.
• Although outside of the scope of this study, preliminary results from 2012 indicate that the Anaemia prevalence, rather than continuing on a downward trend, has in fact increased substantially in 2012, reaching a prevalence of 49.9%.
Stunting:
• The prevalence of stunting decreased significantly every year from 2007-2010. In 2007 the prevalence was recorded as 39.2% which reduced significantly to 23.4% in 2010 (p<0.001); a relative decrease of 40%.
• Important to note here is the fact that measurements of stunting in Nepal have good reliability, as the vast majority of infants’ birthdates are verified through reliable documentation such as birth certificates.
GAM:
36 Rah et al 2012 (as above)

Anaemia Strategy Review 57 | 1 4 0
• GAM has fluctuated slightly but remained under 10% throughout the Anaemia Strategy, at levels categorised between low to medium by the Operational Guidance. However, it did in fact increase significantly in the first year of the strategy, from 4.2% to 9.2%.
Figure 16: Global Acute Malnutrition (GAM), Stunting and Total Anaemia prevalence in 6-59 month children, Nepal
Trends in Anaemia (<11 and <10g/dl) and severity categorisation
• As shown in the figure below, interestingly, despite an increase in total anaemia (<11g/dl) in 2010, anaemia <10g/dl (i.e. only severe and moderate) continued to decrease, albeit non-significantly from 14.8% to 14.4%.
• Mild anaemia has maintained relatively stable, at around 20-25% prevalence. The results from 2011 are particularly interesting to look at, as they show that whilst moderate anaemia reduces by almost 50% (from 14.4% to 7.6%), the prevalence of mild anaemia drops proportionally by much less, from 25.8% to 18.5%.
• Together these observations suggest that the Anaemia Strategy interventions may have been having a greater protective effect on the more severe forms of Anaemia, than on mild anaemia.
MNP intervention March 2008 onwards

Anaemia Strategy Review 58 | 1 4 0
Figure 17: Trends of Total Anaemia (<11g/dl and <10g/dl) in 6-59 months, Nepal
Figure 18: Anaemia Severity Categories in 6-59 months, Nepal
Mean Haemoglobin in children 6-59 months

Anaemia Strategy Review 59 | 1 4 0
• No significant change in mean haemoglobin was shown in the first four years of the intervention, as demonstrated in the figure below. However a significant increase was reported in 2011 – as expected from the prevalence data.
Figure 19: Mean Haemoglobin in 6-59 months,
Nepal Age Categorisation Total Anaemia trends (<11g/dl, <10g/dl) in 6-23 and 24-59 months, Nepal
• The prevalence of Anaemia was much higher in the younger age group (6-23 months) than in the
24-59 month group. In this younger group anaemia remains a high public health concern. • Anaemia prevalence in ages 6-23 months decreased significantly from 71.6% in 2007 to 41.0% in
2011, although no significant change was shown in the intermediate years. Anaemia prevalence in the 24-59 month age group showed a similar pattern; little change before 2010, but a significant reduction in 2011.
• Looking at anaemia <10g/dl, it seems moderate and severe anaemia reduced substantially from 33.7% in 2007 to 14.5% in 2011. In the 24-59 month group, the reduction is also considerable, from 11.3% to only 3.5% in 2011. To note, baseline levels of anaemia <10g/dl were lower than in most other countries.

Anaemia Strategy Review 60 | 1 4 0
Figure 20: Prevalence of Total Anaemia (<11g/dl) in 6-23 and 24-59 months, Nepal
Figure 21: Prevalence of Total Anaemia (<10g/dl) in 6-23 and 24-59 months, Nepal37
Mean Haemoglobin
• Mean haemoglobin seems to have increased more substantially in the younger age group (6-23 months), but again only in the last year. Mean Haemoglobin is considerably higher in children 24-59 months in Nepal
Figure 22: Mean Haemoglobin in 6-23 and 24-59 months, Nepal38
37 Confidence intervals not available for 2011 38 Confidence intervals not available for mean haemoglobin. For standard errors see nutrition survey data.

Anaemia Strategy Review 61 | 1 4 0
Non-Pregnant Women
• Data on Anaemia prevalence in non-pregnant women was collected only in 2007 and 2009. No significant change was shown between these years. Anaemia prevalence was reported as 13.2% (10.2 to 16.9) in 2007 and 14.2% (11.4 to 17.5) in 2009. Preliminary results from 2012, unfortunately, show that Anaemia has increased to 26.9%.
Summary:
• A BSFP using MNP has been implemented without a break for four years now. Other activities include education on tea consumption which seems to have been very successful. Unfortunately, implementation of activities has been hampered by the impact of the resettlement programme on human resources and staff commitment.
• No significant reduction in anaemia prevalence was shown in the first three years of interventions. The significant reduction shown in 2011 was promising but the change cannot be attributed to the introduction of any particular intervention. Preliminary reports from 2012 indicate anaemia has increased once again. However, stunting did show a consistent and significant decrease in the first three years of the MNP intervention. GAM has remained stable at a medium level.
• A surprising and significant increase in iron consumption via meat and eggs in 2011 may have contributed to the sudden drop in anaemia in this year, alongside the other interventions in place. No changes in the MNP programme or other services have been reported.

Anaemia Strategy Review 62 | 1 4 0
C) ALGERIA
I) Background and context
The Saharawi refugee situation in Tindouf is protracted and particularly politicised. Since 1986, UNHCR and WFP have been supporting the Government of Algeria (via the main national IP, the Algerian Red Crescent (ARC)) to assist the refugees. The harsh, desert, remote area is highly inhospitable, limiting productive activity, meaning the refugees remain mostly dependent on humanitarian assistance for their survival. No reliable population data is available for the Algerian camps due to political sensitivities, nor is any other HIS data available.0961848 Table 16: Key information, Algeria
Country Camps within review
Majority ethnicity Malaria IP for nutrition
Algeria (Tindouf camps)
Awserd Dakhla
Laayoune Smara
Saharawi Non endemic Algerian Red Crescent (ARC)
General food distribution
The planned ration is described below, although this is not necessarily what was distributed or received by the refugees. CSB was included in 2009 to improve the micronutrient value of the food basket.
• It is intended that fresh products are provided 11 months of the year, through UNHCR, AECID and ECHO, including dates, camel meat, onions and potatoes, in a ration varying between 3.5 and 4.5 kg per household per month. However, it is not known the extent to which this has been implemented.
• As per the Anaemia Strategy and the MOU, some complementary foods including tea and yeast were provided by UNCHR, and canned fish (tuna / mackerel) by Swedish NGO Praktisk Solidarität in collaboration with the Italian NGO CISP. Gofia (a toasted maize meal) has been provided by the Spanish Government through WFP in 2009, 2011, and 2012, and through the Spanish Red Cross in 2010.
Table 17: Quantities and food items distributed, Tindouf camps, Algeria39
39 2011 JAM Algeria
Food Commodity Quantity (grams/person/day)
Cereals (wheat flour, rice, barley) 400
Pulses (lentils, beans, chickpeas) 67
Vegetable oil 31

Anaemia Strategy Review 63 | 1 4 0
The Nutrient Gap Despite the fortified CSB+ in the food ration, there is a clear nutrient gap with extremely low levels of Iron and Riboflavin, another important micronutrient for anaemia. Table 18: NutVal analysis of the general ration contents, Algeria40
Energy Protein
Fat
Calcium Iron Iodine VitA ThiamineRiboflavin Niacin VitC
Requirements provided by ration (%)
102% 136% 92% 92% 77% 16% 112% 137% 54% 181% 216%
Acute malnutrition services
• Services are in place for treatment of MAM and SAM
II) Anaemia Strategy funding and management Funding for the Anaemia Strategy in Algeria
Funds requested in country proposal (to be allocated from both HC special fund and standard programme budget) totalled USD $2,543,0555. Information on programme funding is not available. Funds allocated from HC special fund are as follows:
Table 19: Allocated funds from High Commissioner special fund
ALGERIA – Allocated HC funds ($)
Funds allocated in 2009 Funds allocated in 2010 Funds allocated in 2011 Funds allocated in 2012
777,213 50,000 125,000 75,000
Anaemia strategy management issues The Anaemia Strategy in Algeria took over a year to be launched fully for a number of reasons:
• Primarily, local particularities necessitate all programmes to be delivered with close involvement of the refugee authorities, through the PISIS framework, the (Integrated Programme of Saharawi Child Health). The PISIS management structure involves the collaboration of NGOs, Ministry of Co-operation, UN partners, and ECHO in making decisions for the refugee children’s health. Coordination between the various actors has been a significant challenge to programme delivery; bureaucracy and competing agendas delay decision making and implementation. Lack of clearly delineated roles and responsibilities continue to hamper efforts.
40 Note: Wheat Flour, White and WFP specifications for vegetable oil used in NutVal analysis
Sugar 33
CSB+ / Supercereal 33

Anaemia Strategy Review 64 | 1 4 0
• Recruitment and human resources were an additional problem, and ultimately the local IP put in place was felt to be unprepared vis-à-vis capacity.
• Internal UNHCR support for nutrition interventions was seen to be lacking; nutrition was perceived to be de-prioritised in favour of other Public Health programmes
• Delays in the release of funds from ARC Algiers to ARC in the camp were reported, and associated with the delayed launching of activities
III) Anaemia Strategy activities Diversification of Food and Reducing Reliance - Agriculture and Animal Husbandry
• Small-scale agriculture and animal husbandry have shown some sign of success. In 2011, 57% of families declared having 1 animal, usually sheep or goats, while 2.5% owned some chickens. In 2011, 18% of families had a garden. This has increased considerably since the JAM in 2007. However, lack of support for the gardens is a major obstacle to fresh produce production of any notable value; tools, seeds, water access and other are restraining factors. Support staff are limited.41
• Diversification of the food basket with products such as rice, pasta, fish, and cheese could be improved through improved coordination between WFP and bilateral contributions.
• Opportunities may also exist to introduce food for work (FFW) or cash/ voucher schemes with particular attention to vulnerable groups.42
Use of Special Nutritional products in BSFP
• The joint 2009 UNHCR/WFP nutrition mission, the UNHCR/WFP Joint Assessment Mission (JAM), and the Sahrawi Nutrition Strategy recommended an intervention to reduce the very high anaemia prevalence and stunting in children aged 6-59 months and anaemia in PLW.
• The intervention introduced was a blanket supplementary feeding programme of Micro-Nutrient Powder (MNP) to PLW and children aged 36-59 months and a Lipid-based Nutrient Supplement (LNS) to children aged 6-35 months. This was initiated in December 2010.
• The acceptability study of August 2009 was found to be encouraging. Table 20: Blanket SFP intervention implemented, Algeria
BSFP and Nutritional Supplement Programmes
Target Regimen Delivery Start date End date
Chaila (MNP) 36-59 Flexible - 15
sachets/ month Monthly in
health centres Dec-10 On-going
Gazela (Nutributter®)
6-35 Flexible - 15
sachets/ month Monthly in
health centres Dec-10 On-going
Local name: Chaila (Hexagon)
PLW 30 sachets/month Monthly in
health centres Dec-10 On-going
High energy biscuit School children
1 sachet/day for 8 In schools Dec-10 On-going
41 2011 JAM Algeria 42 See 33

Anaemia Strategy Review 65 | 1 4 0
months/year
Experience of BSFP implementation A number of major challenges were experienced with regards to the BSFP nutrition intervention, many of them specific to this particular setting. These included:
• Expiry of product, due to the product being procured before an IP was in place to distribute it. Although a product extension was granted, distribution was refused by the Sahrawian authorities and new products had to be procured.
• Determining the quantity of products required is an on-going problem, given that reliable population figures are not available.
• Supply chain problems; a large WFP order of Nutributter® to another country is said to have meant all other shipments were delayed.
• Storage of LNS due to lack of warehouse capacity. This has led to storage of LNS in the central pharmacy, the capacity of which is seriously challenged by the additional nutritional products
• Over-stacking of boxes is against manufacturer’s specifications, risking damage to product. • Reliance on Central Pharmacy staff to gain access to the products was found to disrupt
distribution to services. • Misuse of MNP; 60% of beneficiaries were discovered to be taking MNP with 1 spoon of
food (as shown on the packaging). Picture was removed and clarity of instructions improved. • Religious objections and rumours of the product deriving from camel bones (due to the
picture of a camel on packaging) were identified and seem to have been addressed. • No data is available on programme monitoring; key informants suggest this is not undertaken • Furthermore, BCC activities related to MNP consumption and compliance have been slow to
establish, and non-functioning during time of the 2011 JAM. Malaria control
• Malaria incidence is thought to be negligible in the area; no specific activities are implemented.
De-worming
• De-worming activities are only made available to children in the SFP (not BSFP) and school children. This is a key area of concern for anaemia.
• Prevalence of intestinal worms is suspected to be very high in various age groups, through indirect proofs such as prevalence of diarrheic diseases, prevalence in children going to Europe on holidays during summer and when considering the standard prevalence in this area of Algeria43. However, inclusion of other groups in de-worming activities has been prohibited by national protocol / PISIS arrangements.
IYCF
• IYCF practises may be linked to poor nutritional status. Consumption of iron rich foods amongst 6-23 months is low at 44.9% (38.5% - 51.2%).
Other
43 2011 JAM Algeria

Anaemia Strategy Review 66 | 1 4 0
• WASH: High levels of Anaemia in the camp may be linked to poor personal hygiene and sanitation. The 2011 JAM cites traditional practises and poor WASH facilities as possible reasons for the hygiene problems.
• No information has been collated on Iron supplementation in ANC, Vitamin A supplementation or BCC.
IV) Trend analysis for nutritional indicators From interviews with key informants, and from JAM 2011 information, it seems that baseline data for the Anaemia strategy should be taken as the nutrition survey of October / November 2010, as implementation of the strategy started just after this survey in December 2010. However the nutrition survey of 2011 was cancelled due to security issues and survey results from 2012 are pending. The baseline data of 2010 indicated high levels of anaemia and stunting. In 2010, overall, 52.8% (95% C.I. 49.1-56.6) of children aged 6-59 months suffered from anaemia. The most common type of anaemia in children was moderate (30%), followed by mild (21%) and severe (2%).44
44 Nutrition Survey Western Sahara Refugee Camps, Tindouf, Algeria (2010)

Anaemia Strategy Review 67 | 1 4 0
D) YEMEN
I) Background and context
Yemen, although itself one of the poorest countries in the world, lies on a well established migration route bridging the Horn of Africa with the wealthy countries of the Gulf. In 1991, the collapse of the Siad Barre government led to an influx of Somali refugees to Yemen. On-going conflict in Somalia and the emergency of 2011 has led to a continued stream of refugees crossing the Gulf of Aden, often in treacherous conditions. Somalis are granted refugee status on a prima facae basis. In addition to settling in Kharaz refugee camp, refugees have spread throughout the country, with an increasing presence in the urban centres of Basateen and Sana’a. Whilst refugees in the camp are reliant on food distributions, urban refugees in Basateen and Sana’a must provide themselves with food. Surrounding Kharaz camp live the local Yemeni host community, constituting a relatively small population. For ethical and humanitarian principles, food and healthcare provisions as well as activities under the Anaemia Strategy were provided to the local host community in Kharaz, who shall be included in the review. The causes of high anaemia amongst refugees in Yemen are not well known. Yemen is prone to Malaria epidemics resulting in high mortality and morbidity, affecting approximately 60% of the population (IRIN, Nutrition survey 2009). The south of Yemen, where Kharaz camp is situated, is particularly well known for its malaria. Addressing malaria formed a core component of the original country proposal (“objective 1”). This population is also known for high tea consumption; the Somali pancake is soaked in tea before it is served to the child. A combination of limited iron availability in the food ration combined with the inhibitory effect of tea may greatly contribute to the high prevalence of anaemia. Lastly, livelihood diversification possibilities and coping mechanisms are limited, making the vast majority of the population entirely dependent on food aid.
Table 21: Key information on Yemen
Country Camps / urban setting
Majority ethnicity Malaria prevalence
Implementing partner for nutrition
Yemen Kharaz camp Kharaz villages
Basateen Sana’a
Somali majority; surrounding villages
are Yemeni
Endemic IDF, CSSW, SHS
The population of Kharaz camp remained relatively stable up to 2011, shifting from around 11,400 in January 2008 to around 13,000. It is in 2011 that we see the sharp influx, due to the emergency situation in the Horn region, with the population reaching around 15,850 in March 2012. No survey data has been conducted since this time period, but it is likely to influence upcoming nutrition survey results. In the villages surrounding Kharaz camp there are around 2,500 individuals, and an unknown number in the urban settings of Basateen and Sana’a.

Anaemia Strategy Review 68 | 1 4 0
Figure 23: Population of Kharaz camp during period of Anaemia Strategy
Data on Malaria incidence from HIS HIS data reveals that confirmed Malaria incidence in children is relatively low, although in 2009 we see spikes in malaria. There higher prevalence in 2009 may have had a potential effect on the June 2009 survey results. Malaria is unlikely to be a major driver of anaemia in the following years, however, as incidence is so low (and suspected incidence is nil in these years).
Figure 24: Confirmed Malaria Incidence in children 6-59 months, Yemen (2008-2012)45
General food distribution The daily ration in 2010 is described below, with NutVal analysis to explore the nutrient adequacy of the ration. It is not known if the GFD has since been adjusted. In addition, it is important to recognise that this is the planned ration, not necessarily what was distributed or received by the refugees.
45 Health Information System data

Anaemia Strategy Review 69 | 1 4 0
Table 22: Quantities and food items distributed in Kharaz, Yemen, 201046
Food Commodity Quantity (grams/person/day)
Wheat Flour 300
Rice 150
Pulses 60
Sugar 20
Oil (fortified with Vit A/D) 25
Salt 5
The Nutrient Gap NutVal analysis reveals that despite the energy content of the ration reaching 100% of the 2100 Kcal minimum requirement, there is inadequate supply of fat, calcium, iron, iodine, vitamin A, thiamine, ribosflavin and vitamin C. Lack of iron and vitamin A, in particular, are likely contributors to the anaemia levels. Figure 25: NutVal analysis of the general ration contents, Yemen, 201047
Energy Protein Fat Calcium Iron Iodine VitA ThiamineRiboflavin Niacin VitC
Requirements provided by ration (%)
100% 118% 77% 20% 52% 0% 46% 89% 23% 163% 13%
Importantly, various documents raise the need for a fortified staple product, but as yet, no fortified wheat flour or other staple has been introduced in the camp. Some complementary foods have been introduced, however. Tomato paste was provided in the GFD (15 sachets of 70g / person / month) for a period (months unconfirmed). Acute Malnutrition Services
• Some important restrictions to the treatment for acute malnutrition were recognised by the 2009 JAM, and may be playing a role in poor nutritional status in the camp and surrounding areas. The Outpatient Therapeutic Programme (OTP) for the treatment of severe malnutrition was available only in the Basateen clinic and not to patients in Kharaz camp, villages, or Sana’a. Treatment of moderate acute malnutrition (MAM) was available only in Kharaz camp - children were referred to the hospital in the governorate of Lajh when necessary.
46 Nutrition Survey, Yemen 2010 47
White wheat flour, polished rice and lentils used as pulses in analysis

Anaemia Strategy Review 70 | 1 4 0
Figure 26 : Summary of Nutrition Services in four locations of Kharaz, Kharaz surrounding villages, Basateen and Sana’a, Yemen 200948
II) Anaemia Strategy funding and management
Funding for the Anaemia Strategy in Yemen Funds requested are not stated on the country proposal. Information on programme funding is not available. Funds allocated from HC special fund are as follows:
Table 23: Allocated funds from High Commissioner funds - Yemen YEMEN – Allocated HC funds ($)
Funds allocated in 2009
Funds allocated in 2010
Funds allocated in 2011
Funds allocated in 2012
Total allocated funds
190,516 150,000 0 0 340,516
Anaemia Strategy Management Issues
• Human resources were a challenge in that Kharaz camp is remote and the difficult climate means individuals are averse to residing there for long periods. At the start of the strategy there were delays in securing a UNHCR Health Coordinator, which prevented implementation of activities early in 2009. Since then and until today, there has been considerable delay recruiting a nutritionist for the strategy.
48 2009 JAM Yemen

Anaemia Strategy Review 71 | 1 4 0
III) Anaemia Strategy activities Diversification of Food and Reducing Reliance - Agriculture and Animal Husbandry
• Refugees in Kharaz and surrounding villages have limited dietary diversity, as confirmed by the 2009 JAM. High levels of poverty also mean most refugees with children are unable to afford milk, an indicator of poor food access in that context49.
• Home gardens and Multi-storey gardens were introduced in 2009 and 2010 respectively. However, there seems to be a lack of enthusiasm for this project – community mobilisation was recommended to address these barriers but it is unknown to what extent this was implemented.
• Animal husbandry was yet to be initiated in 2010 and no more recent information could be obtained.
• Food voucher schemes have been initiated in the urban areas, but would not be an option in the camp due to the remoteness and lack of access to markets.
Use of Special Nutritional products in BSFP
• Feedback from key informants on nutritional interventions, including their nature and
timelines, has not been completely consistent. For example, for a reported tuna fish intervention is remains unclear whether it was a BSFP or provided in the GFD, and the time period was given initially as 2008/2009 to May 2010, then as March 2010- February 2011. Clarification on which type of intervention, and whether one, or both of these dates is correct has not been achieved. There was also some lack of consensus on the premix intervention. Together, these highlight the important point of ensuring a system by which interventions are tracked and recorded over time, for future reference, evaluation, and transparency to donors.
• In November 2011, MNP was introduced to the camp. A suitable formulation of MNP was developed according to the Kharaz camp context, with the support of UNHCR, WFP HQ and ENN, and a culturally appropriate name, ‘Dheef’ was given.
Table 24: BSFP intervention implemented, Yemen
Kharaz camp and surrounding villages
BSFP and Nutritional Supplement Programmes
Regimen Target Delivery Start date End date
Tuna fish in vegetable oil
Daily, 200 g /week 6-36
months Nutrition unit every 2 weeks
? 2008/2009 OR March 2010
June 2010
Premix (WSB+Sugar+Oil)
100 g /child/day (80, 10, 10 g)
6-59 months
Health centre May/ June 2010 ? December 2010
MNP - ‘DHEEF’ 15 /month 6-59
months Health centre November 2011 On-going
49 2009 JAM Yemen

Anaemia Strategy Review 72 | 1 4 0
Basateen
BSFP and Nutritional Supplement Programmes
Regimen Target Delivery Start date End date
MNP – ‘DHEEF’ 15 sachets /month 6-59
months Alternate months
to monthly June 2012 On-going
There has also been some suggestion of a Premix BSFP for PLW in Kharaz camp, villages and Basateen, but further information has not been obtainable. Sana’a: no special product intervention has been introduced in Sana’a, but discussions are underway to explore this. Experience of Implementing BSFP
• Major challenges have been experienced during the implementation of the use of special nutritional products. These include procurement, storage, sensitisation, packaging, and cultural feeding practises:
o Some procurement problems were experienced, as well as quantity calculation before the tool to facilitate this was developed.
o Warehouse capacity is limited; MNP is stored half in Kharaz, where there are electricity problems that can impact upon it being kept at the appropriate temperature. The other half is stored in Sana to keep cool, but this is some distance from the camps.
o Sensitisation to MNP was relatively poor and unrealistic expectations were raised. o With regards to packaging, as the place of manufacturing and the date of expiry were
lacking from the product packaging, this was promoting rumours and suspicions around the product and its origins.
o Culturally, MNP is not very well suited to the feeding practises of these refugee families. The norm is to share the family meal from a single bowl; beneficiaries may not even have separate bowl and cutlery for the child, particularly those from lower socioeconomic groups. In addition, the consistency of the local flatbread ‘Lahooh’ did not lend itself to mixing the MNP. However, it is important to point out is that MNP itself was not designed to be mixed with such food, its original purpose was for complementary foods.
• These experiences collectively highlight the importance of conducting thorough formative research to identify potential issues and cultural barriers.
• An acceptability study conducted in November 2010, prior to the intervention, indicated MNP was accepted well, liked by 91%, found easy to use by 97.7% and was not associated with side effects in 98% of a sample of the refugee community. However in feedback reports from the IP, it appears acceptability is a problem, and on-going efforts are being made to address it.
• No programme monitoring data is available from Yemen.
Malaria control

Anaemia Strategy Review 73 | 1 4 0
• Malaria is one of the most serious public health problems in Yemen, and is recognised to be a potential contributor to the high anaemia burden. The first nutrition survey conducted by MENTOR in June 2009, in support of the Anaemia Strategy, was designed specifically to investigate the relationship between Malaria and Anaemia in the refugee setting. Anaemia was tested using HemoCue™ , and Malaria using Rapid Diagnostic Tests (RDTs). It is an innovative example of integration by UNHCR Yemen.
• However, a major limitation to the survey was that it was conducted during the low transmission season of malaria, therefore the prevalence of malaria was, unsurprisingly, extremely small. The survey concluded that the Anaemia burden could not be attributed to P.falciparum malaria burden. Despite high anaemia levels, malaria prevalence was small. Moreover the anaemia is likely to be due to iron deficiency, micronutrient deficiencies or gastrointestinal infections (Helminths etc). That is not to say, however, that in high transmission season malaria is not an additional driver of anaemia.
• The coverage of LLINs in the 2009 survey was extremely low. LLINs were due to be distributed in 2009 (post-nutrition survey of June). In Kharaz camp, 66.7% had an observable bed net, in the villages 7.3% had an observable bed nets, and in Basateen only 0.2% (one household of 456) had an observable bet net. It would have been interesting to know the level of coverage of LLINs in camps in 2010 after more than a year of the Anaemia Strategy (and the Malaria Strategic Plan running in parallel) however this information was not collected.
• In Yemen, UNHCR works in conjunction with the Ministry of Health and the National Malaria Control Program (NMCP) on addressing endemic malaria. Various vector control activities were suggested by the nutrition survey in 2009; first and foremost indoor residual spraying. Key informants speak of vector control programmes and bed net distribution having been implemented with success via the Ministry of Health. For example, from key informant interviews, it seems there were targeted distributions of LLINs for 6-59 month children and pregnant mothers in the Basateen area. However, no specific details are available, and other reports suggest that the national malaria prevention strategy has not been implemented at scale.
De-worming
• Intestinal worms are not considered by key informants to be a major problem in Yemen. However, the nutrition survey of 2010 recommends implementing de-worming programs for all children 24 months and older, and in the ANC, but this is not thought to have been initiated in any systematic fashion. In 2010, no de-worming campaigns were in place, and by 2012 only infrequent de-worming initiatives were reportedly carried out.
• No data on intestinal worms is given in the HIS system therefore it is difficult to know the levels recorded amongst refugees.
ANC
• It is known that HemoCue™ machines were provided to the ANC clinics in 2009, but the extent of their use is unknown.
• Pregnant and lactating women were provided with Iron and Folate acid and in ANC, both during pregnancy as a prophylaxis and as a treatment dose for moderate and severe anaemia.

Anaemia Strategy Review 74 | 1 4 0
Other • No information is available on Vitamin A supplementation. • Poor literacy levels in Yemen and amongst the refugee population, particularly women,
compounds challenges for IEC / BCC activities.
IV) Trend analysis for nutritional indicators Baseline data
• Baseline data for Yemen is determined as: o 2009 for Basateen (all activities started after this) o 2008 for Kharaz camp and surrounding villages
• The main focus of the data for Yemen will therefore look at Kharaz camp and the surrounding villages, as:
o Only baseline data is available for Basateen as no survey was conducted in this setting in 2010
o Before June 2012 no major interventions had been introduced for children in Basateen
• Unfortunately, the effectiveness of the anaemia strategy cannot fully be assessed, as no nutrition survey has been conducted since major activities were initiated. The most recent nutrition survey was conducted in July 2010, prior to MNP initiation in November 2011.
o There is a lack of coherent information and documentation on other interventions during the time period in which we have survey data. It is thought activities were either yet to be initiated or were in their early stages, e.g. animal husbandry, gardening, livelihood activities, capacity building.
• A final data limitation is that the nutrition survey of 2009 was conducted in June, during the summer months and there was significant malfunction of the HemoCue™ analysers during this survey.
Children 6-59 months50 Total Anaemia trends (<11g/dl):
• Anaemia significantly decreased in Kharaz camp between 2009 and 2010 (p=<0.05) in children 6-59 months; the significant decrease has been calculated independently but a limitation to this data is the lack of confidence intervals from 2008 or 2009. No significant decrease was shown in Kharaz surrounding villages.
• In both years, anaemia was extremely high. The results in 2009 may have been affected by the spikes in malaria prevalence during this year.
Stunting:
• Stunting has not changed significantly in Kharaz camp, with a reported prevalence of 16.5% (12.3-20.7) in 2008 and 22.0% (17.4 -27.3) in 2010.
GAM:
• GAM has remained on a relatively stable trend, increasing only non-significantly from 7% to 9% between 2009 and 2010 in Kharaz camp.
50 Confidence intervals for anaemia are included where they are reported in nutrition survey results
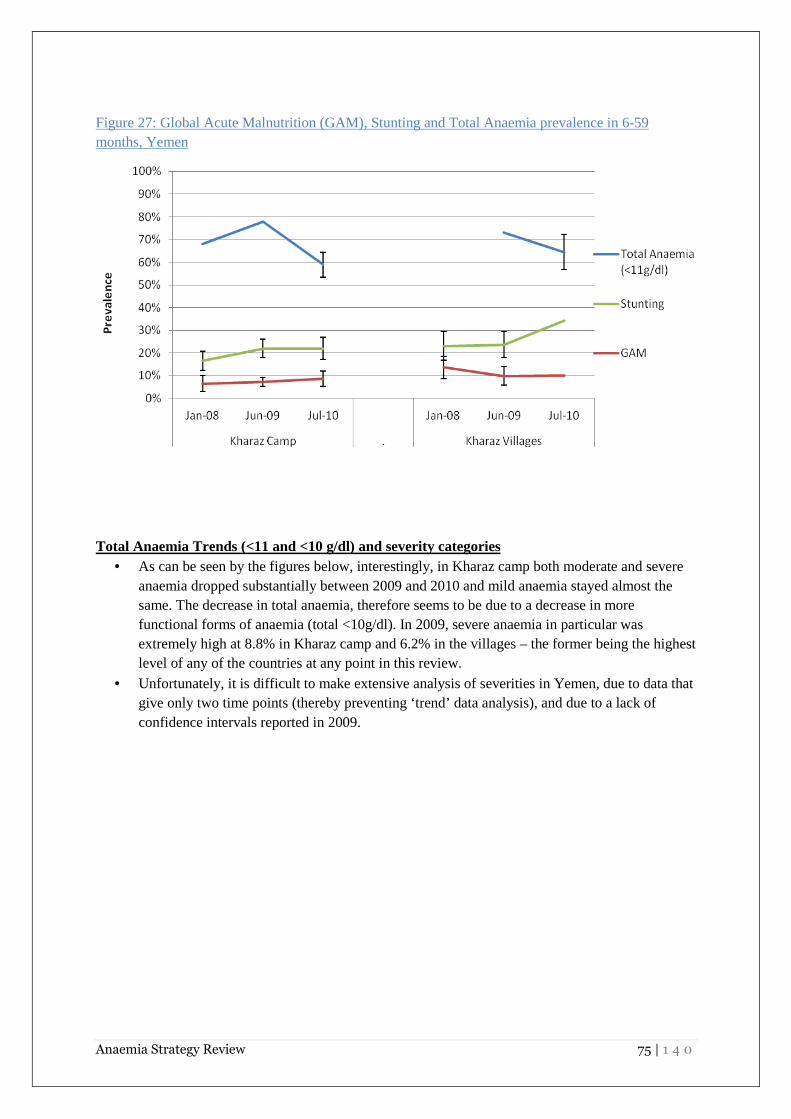
Anaemia Strategy Review 75 | 1 4 0
Figure 27: Global Acute Malnutrition (GAM), Stunting and Total Anaemia prevalence in 6-59 months, Yemen
Total Anaemia Trends (<11 and <10 g/dl) and severity categories
• As can be seen by the figures below, interestingly, in Kharaz camp both moderate and severe anaemia dropped substantially between 2009 and 2010 and mild anaemia stayed almost the same. The decrease in total anaemia, therefore seems to be due to a decrease in more functional forms of anaemia (total <10g/dl). In 2009, severe anaemia in particular was extremely high at 8.8% in Kharaz camp and 6.2% in the villages – the former being the highest level of any of the countries at any point in this review.
• Unfortunately, it is difficult to make extensive analysis of severities in Yemen, due to data that give only two time points (thereby preventing ‘trend’ data analysis), and due to a lack of confidence intervals reported in 2009.

Anaemia Strategy Review 76 | 1 4 0
Figure 28: Total Anaemia (<11g/dl and <10g/dl) in 6-59 months, Yemen
Figure 29: Anaemia Severity Categories in 6-59 months, Yemen
Mean Haemoglobin in 6-59 months, Yemen
• Mean haemoglobin seems to have increased in Kharaz camp although remains in 2010 within the threshold for ‘anaemia’.
Figure 30: Mean Haemoglobin in 6-59 months, Yemen

Anaemia Strategy Review 77 | 1 4 0
Age Categorisation Total Anaemia trends (<11g/dl, <10g/dl) in 6-23 and 24-59 months, Yemen51
• Only lines, not ‘trends’ can be analysed due to only two data points. • As expected, children less than 2 years old seem to be the least affected by anaemia. • Neither category crosses the threshold for ‘high’ public health problem. • Some disparity is noted between Kharaz camp and the surrounding villages. When looking at
total anaemia <11g/dl, we find more impressive reductions in the 24-59 month age group in Kharaz camp, but in Kharaz villages the opposite is true – more impressive reductions are shown in the 6-23 month group. Similarly, when looking at anaemia <10g/dl (moderate and severe anaemia), reductions are more substantial in the 24-59 months age group than the 6-23 month age group in Kharaz camp, and yet in the villages again, the opposite is shown.
• Overall, due to data limitations few conclusions can be drawn other than the fact that, as expected 6-23 month age group has notably higher levels of total anaemia, but that in both groups this can be categorised as a high public health severity.
Figure 31: Prevalence of Total Anaemia (<11g/dl) in 6-23 months and 24-59 months, Yemen
51 Confidence intervals are not available for any 6-23 and 24-59 months data

Anaemia Strategy Review 78 | 1 4 0
Figure 32: Prevalence of Total Anaemia (<10g/dl) in 6-23 months and 24-59 months, Yemen
Mean Haemoglobin in 6-23 and 24-59 months, Yemen
• Mean haemoglobin is higher in children 24-59 months than those 6-23 months, but low in both groups overall.
• Mean haemoglobin has shown a more impressive increase in Kharaz camp in those 24-59 months, moving from 9.8-10.9g/dl, and in Kharaz villages moving from 9.3 to 9.9g/dl in 6-23 month group. Again, however, confidence intervals are not available for this data, only standard deviations and only for 2009.

Anaemia Strategy Review 79 | 1 4 0
Figure 33: Mean Haemoglobin in 6-23 and 24-59 months, Yemen52
Non-Pregnant Women
• In Kharaz camp and villages, data on anaemia for non-pregnant women is only available for
2010. In 2010, anaemia amongst non-pregnant women was a high public health problem in both the camp and the surrounding villages.
Table 25: Anaemia prevalence in Non-Pregnant Women 2010
Anaemia prevalence in Non-Pregnant women 2010
Total Anaemia (Hb<12 g/dl)
Mild (Hb 11-11.9 g/dl)
Moderate (Hb 8-10.9 g/dl)
Severe (Hb<8 g/dl)
Mean Hb ± SD
Kharaz camp 48.4% (41.8-54.7)
25.6% (20.4-31.7)
22.0% (17.2-28.0)
0.9% (0.2-3.2)
12.0±1.6
Kharaz villages 54.8% (46.1-63.2)
28.6% (21.4-37.0)
26.2% (19.3-34.5)
0 11.9±1.5
Urban Settlements: For Sana’a, data only exists for 2009, therefore no trends or changes can be explored over the period of the strategy. The data from Sana in 2009 was however of real significance, being the first nutrition survey to give a clear picture of the nutritional status of this urban settlement. Table 26: Baseline data for Basateen and Sana’a53
52 Standard deviations, but not confidence intervals were included in nutrition surveys 53 Note: Confidence intervals included where reported in nutrition surveys

Anaemia Strategy Review 80 | 1 4 0
Location Survey
year Total Anaemia (Hb<11 g/dl)
Severe and moderate anaemia
(<10g/dl) GAM(<-2 z-score)
Stunting (<-2 z-score)
Basateen 2008 40.9% n/a 24.9% (19.7-30.1) 24.9% (19.7-30.1)
2009 47.5% 26.1% 9.2% (6.2-13.5) 21.3% (17.8-25.2)
Sana’a 2009 44.3% 27.9% 10.9% (8.0-14.6) 19.4% (16.0-23.4)
Summary
• A number of challenges were experienced with the MNP intervention including product storage, sensitisation and incompatibility with cultural eating habits. No monitoring data is available to review the MNP intervention. There remains a major nutrient gap in the food basket in terms of iron and vitamins, with no FBF in the food basket. Nutrition services for malnutrition are lacking in Kharaz. Few diversification strategies were implemented; gardens and animal husbandry were relatively unsuccessful. High tea consumption is also a major problem to address. Innovative initiatives were adopted to explore the link between malaria and anaemia though; malaria seems to be a less influential factor than poor diet. Nevertheless, malaria control activities are not reaching the coverage that would be expected for malaria endemic zone.
• Anaemia has reduced significantly in Kharaz camp but was still at a high level in 2010. Unusually, there is more severe / moderate anaemia than mild anaemia observed in children 6-59 months. Lack of baseline data for non-pregnant women unfortunately prohibits any comparison in this population group. No changes in GAM are observed, with GAM prevalence being at a medium level in 2010. No changes in stunting are reported; stunting was a medium public health problem in 2010.
• The Blanket SFP is unlikely to have contributed considerably to the reduction in anaemia, as it had only been running for a month or so, and was reportedly poorly delivered in 2010. The tuna fish provisions may have helped nutritional indicators. There is also the possibility, however, that baseline data of 2009 was inaccurate due to reported malfunctioning of the HemoCue™ analysers in the heat.

Anaemia Strategy Review 81 | 1 4 0
E) ETHIOPIA
I) Background and context Historically, Ethiopia has acted generously in its housing of a number of refugee populations from surrounding, troubled areas. The refugee camps are categorised as Eritrean, Sudanese and Somali in the North, West, and South / South-East respectively. Dollo Ado in Southern Ethiopia has been supporting Somali refugees since 2009. In response to growing food insecurity in the Horn region and the catastrophic famine of 2011, a number of additional refugee camps were established in the region to support the rising influx: Kobe, Hiloweyn, and Bur Amino were opened in addition to Boqolmayo that was opened in 2009 and Melkadida in 2010. The population of refugees in the Dollo Ado camps nearly doubled in size in 2011, increasing from 88,771 in July 2011 to 142,306 in December 2011.
All refugees are receiving basic humanitarian assistance including primary health, water, sanitation and shelter from UNHCR, while WFP provides the general food ration. In terms of assessment of effect of the Anaemia Strategy, this review shall differentiate between the ‘older’ camps that were established in 2008 and before, and the ‘newer’ camps that have been established since then in the Dollo Ado region. This is because differing interventions were received and Dollo Ado was particularly affected by the emergency, which limits interpretation of the results from these camps. Table 27: Key information for Ethiopian refugee camps
OLDER CAMPS Population Jan 2008-Mar 2012 (rounded to
nearest hundred)
Majority ethnicity
Malaria prevalence
Implementing partner for nutrition
Fugnido Sherkole
21,000-22,600 4,800-10,000
Sudanese Medium Administration for Refugee-Returnee Affairs (ARRA)
Kebribeyah AwBarre Sheder
16,800-16,300 8,800-13,300 8,000-11,400
Somali Negligible
Shimelba Mai-Aini
10,800-7,500 16,900-16,300
Eritrean Very high
DOLLO ADO REGION CAMPS
Population Jan 2008-Mar 2012
Majority ethnicity
Malaria prevalence
Implementing partner for nutrition
Boqolmayo Melkadida Hiloweyn
Kobe Buramino
16,100-39,000 (‘09-’12) 28,100-40,200 (’11-’12) 6,700-7,000 (’11-’12)
25,800-26,500 (‘11-’12) 13,500 (’12)
Somali Low ARRA
Population and demography

Anaemia Strategy Review 82 | 1 4 0
The population of most of the older camps in the review has remained relatively stable over the period of the Anaemia Strategy, even reducing in some cases due to relocations and shifting between camps. In Mai-Aini, however, the reduction in population in 2010 is explained by the revalidation exercise, when the population moved from 17,000 to 11,000. Although resettlement has not begun, this is likely to be due to the illegal movement of refugees within Ethiopia, Sudan and other neighbouring countries54. Some clear demographic differences exist between the camps. In the Eritrean camps Shimelba and Mai-Aini (although Adi Harush is also in this area), the population consists predominantly of young educated men. In 2010, in Shimelba 66% of the population were male, and in Mai-Aini 71% were male. These particularities may be a factor that influences anaemia levels. HIS data for Ethiopia is considerably poorer than HIS data for the other countries in the region. The reasons for this need further exploration. Figure 34: Population of refugee camps during period of Anaemia Strategy, Ethiopia
a) Older camps
54 2010 JAM,Ethiopia

Anaemia Strategy Review 83 | 1 4 0
b) Newer camps, Dollo Ado region
Diarrhoea: It is likely that a major cause of malnutrition in Shimelba and Mai-Aini is watery diarrhoea, as significant levels are reported in HIS, compared to other camps in Ethiopia e.g. Fugnido on the Sudanese border or AwBarre on the Somali South-East border. Poor feeding and childcare practices in certain clans such as the Kunama clan / ethnic group are thought to be driving this. Figure 35: Incidence of Watery Diarrhoea in children 6-59 months, Ethiopia, various camps55
General food distribution The general food ration in Ethiopian camps provides an average 2,226 kcal / person / day, when accounting for an estimated 20% loss of cereal due to milling. 55 Health Information System data

Anaemia Strategy Review 84 | 1 4 0
Table 28: Quantities and food items distributed, Ethiopia, 2010
Food Commodities Quantity (grams / person / day)
Cereals (wheat or maize grain) 533
CSB+ / Famix 50
Pulses (dried peas) 50
Oil 30
Salt 5
Sugar 15
Kcal 2455 or 2226 after milling
Nutrition surveys and JAMs highlight the problem of selling of food items to buy other preferred food items and non-food items. Refugees in Ethiopia sell between 25-75% of the food ration to buy more palatable foods such as sorghum and pasta, as well as spices and non-food items. Monetizing the ration may be impacting upon nutritional status. The Nutrient Gap Analysis of the nutrient value of the planned general ration is not reflective of the micronutrient content availability to refugees, as it does not account for the effect of milling of the whole wheat flour. Although the cereal ration increased between 2008 and 2010 from 13.5 kg to 16 kg per person / month to compensate for losses or costs incurred from milling the whole grain cereal, milling and transportation costs continue to account for an estimated 33% of the cereal ration56. In some camps mills are provided by IPs and managed by the refugees themselves as an income generation scheme, however operational constraints and poor maintenance necessitates the continued use of commercial mills at considerable disadvantage to the refugees. As recommended by the 2010 JAM, increased efforts are required to support the maintenance of refugee-managed mills. Table 29: NutVal analysis of the pre-milled general ration contents57
Energy Protein Fat Calcium Iron Iodine VitA ThiamineRiboflavin Niacin VitC
Requirements provided by ration (%)
116% 163% 107% 93% 128% 214% 114% 249% 59% 393% 183%
Acute malnutrition services
• Supplementary feeding programmes are in place for vulnerable groups including pregnant women and moderate malnourished children.
56 2010 JAM Ethiopia 57 Wheat grain is used in the following analysis

Anaemia Strategy Review 85 | 1 4 0
II) Anaemia Strategy funding and management Funding for the Anaemia Strategy in Ethiopia Funds requested in country proposal (to be sourced from regular budget for country programmes as well as HC special funds): $1,946,837.00. Information on programme funding is not available. Funds allocated from HC special are as follows: Table 30: Allocated funds from High Commissioner, Ethiopia
ETHIOPIA – Allocated funds from HC special fund ($)
Funds allocated in 2009
Funds allocated in 2010
Funds allocated in 2011
Funds allocated in 2012
Total allocated funds
499,131 200,000 750,000 360,000 $1,809,131
Further budget was made available under the ‘Expanded Anaemia Strategy 2011’ 58. These funds were not implemented as initially planned, as these vital resources were necessarily diverted to deliver the emergency response in Dollo Ado. In summary, the Expanded Anaemia Strategy budget of 2011 has reportedly been used for:
• Procurement of complementary foods / BSFP products (Famix, tomato paste) • The Natural Resources Development Programme (NRDP) for household food security in
Shimelba and Eritrean camps • Purchase of anthropometric and anaemia nutrition survey materials and supplies • MUAC screening in Dollo Ado • Plumpy’Nut® procurement for CMAM in Dollo Ado • Dollo Ado emergency response e.g. providing hot meals at reception and transit centres • Capacity building through hiring national nutrition consultant, staff and community outreach
workers for Dollo Ado Anaemia strategy management issues
• Considerable pressure was placed on funds, resources and capacity as a result of the drought
and famine in the Horn of Africa region. • The older camps benefited from having a stable IP in place, ARRA, with systems and
processes to manage the nutrition situation in these camps. However in Dollo Ado, new systems had to be established and new IP staff trained, which as might be expected was extremely challenging. Employees were working under conditions of extreme hardship.
58 Detailed use of the budget can be found in the ‘Report of Expanded Anaemia Strategy 2011’.

Anaemia Strategy Review 86 | 1 4 0
III) Anaemia Strategy activities Diversification of Food and Reducing Reliance - Agriculture and Animal Husbandry
• Small-scale agricultural projects and animal husbandry were initiated and up-scaled in three camps, Shimelba, Kebribeyah and Aubarie. In 2009, 500 households (167 in each camp) were established with MSGs. The MSG manual was translated into refugee language in selected camps (Somali and Tigrigna) by ZOA Refugee Care. Poultry was also distributed (1 cock and 2 laying hens to all these 500 households59. In 2009, findings from the Senior Regional Nutrition and Food Security Coordinator’s mission described how MSG technology was understood well, collection of waste water was accepted, gardens required less water than in-ground planting, vegetable yield was high and there was a high user satisfaction.
• However, following the encouraging start, in 2010 a formal evaluation of the project reported
a number of problems and brought to light the failings of the implementing partner in terms of provisions of necessary support and training, as well as the problem of irregular and insufficient funding for the IP. Water availability was a major obstacle for the gardening activities, in addition to difficulties procuring good quality, non-expired seeds, insect infestation, rocky soil (particularly in Somali camps), and livestock eating their produce.
• Adjustments have been made and small-scale agriculture initiatives continue; in 2011 a
reported 870 Somali households had been established with MSG, and 95 households (380 individuals) assisted by NRDP in the Eritrean camps.
• In the Eritrean refugee camps, Kunama refugees are able to engage in some agricultural activities due to private agreements with the host community – not through activities under the Anaemia Strategy. The produce is used for personal consumption and not sold. To complement this, livestock such as goats, donkey and cattle are reared. In terms of programmes implemented under the Anaemia Strategy, the MSG project has been terminated due to the departure of the IP and lack of funding to continue the project, much to the disappointment of the refugees. The Tigrinya refugees also have access to some due to running of small businesses such as cafes, hotels and even cinemas. In turn, their dependence on food aid is somewhat alleviated, enabling more choice and diversity in their diet. Conversely, in the Somali refugee camps, few income generation activities are in place, and micro credit schemes and training are minimal. Only a few engage in backyard gardening.
• The practicalities of animal husbandry were a major challenge. Shelter for chickens was inadequate. Chicken feed was insufficient to the point that some families were using their GFD provisions to feed them. Similar issue were had with goats, as well as clashes with local host community over grazing territory. Transporting animals to remote camps was also an obstacle. The IP, ZOA refugee care, transported chickens over a range of 700-1100km to the camps, leading to the death of many poultry in transit. Lastly, in 2010 this animal husbandry livelihoods project run by ZOA was terminated due to an audit issue.
59 First Quarter Updates 2009

Anaemia Strategy Review 87 | 1 4 0
• Although it is recognised that these activities are challenging in their implementation, the benefits not only nutritionally but psychosocially and symbolically are important to consider. Refugees are keen for these activities to continue, and to move towards a situation in which they are less food aid dependent. However, they will only be able to do this with adequate provision of support and funding.
• A livelihood officer was recruited in 2011 to support livelihood activities in Jijiga (AwBarre, Sheder, Kebribeyah) but no report has been made available on these initiatives.
Use of Special Nutritional Products in BSFP Premix has been used in a BSFP in the older camps, and CSB++ for the younger age groups in Dollo Ado camps. Table 31: Blanket SFP intervention implemented, Ethiopia60
Camp BSFP and Nutritional Supplement Programmes
Regimen Target Delivery Start date End date
All camps excluding the
newly established in Dollo Ado and
Assossa
Premix: Famix / CSB+
295 g Premix / person /day
(250 g Famix / CSB+, 25 g oil,
20 g sugar)
6-23 months
and PLW Monthly May 2008 Ongoing
Tomato paste 70 g / person /
day
6-23 months
and PLW Monthly n/a n/a
Camps
BSFP and Nutritional Supplement Programmes
Regimen Target Delivery Start date End date
Dollo Ado CSB++ 200 g / person /
day 6-23
months Monthly January 2012 Ongoing
Dollo Ado Premix
245 g Premix / person / day
(200 g CSB+, 25 g oil,
20 g sugar)
24-59 months
Monthly January 2012 Ongoing
Doll Ado Tomato paste,
peanut butter and lentils
n/a Pregnant women
Monthly n/a n/a
60 Note: N/A indicates that no information has been accessed for the review

Anaemia Strategy Review 88 | 1 4 0
Whilst none of the older camps that fell under the Anaemia Strategy have, as yet, introduced blanket CSB++ for children, CSB++ has been introduced since August 2012 in Bambasi in Assossa (a Sudanese refugee camp), and in Asayta in Afar (an Eritrean refugee camp). Experience of Implementing BSFP
• Other than the significant challenges of 2011 identified above, no particular challenges have been identified with procurement or distribution of the special products. However, almost none of the older camps are receiving the newer products such as MNP, Nutributter®, or CSB++. In these camps in early 2011, UNHCR and IPs were poised to introduce special products such as MNP or LNS, however, activities did not even get to pilot stage due to the emergency, as well as concerns from the unsuccessful experience of using MNP in Kakuma, Kenya.
• No information is available on programme coverage • A well recognised concern of CSB++ is the problem of sharing within families, which
continues despite attempts to address this through IEC campaigns. Malaria control
• Endemic malaria in Shimelba and Mai-Aini does not seem to have been thoroughly addressed over the course of the Anaemia Strategy. For example, Shimelba in 2010 there was a 38% shortage of bednets61. Various activities were recommended in nutrition surveys for Shimelba and Mai-Aini such as the draining of water ponds62, but no information is available on improvements since then.
• In Mai’Aini, anaemia levels in the nutrition survey of 2011 may have been influenced by a spike in Malaria late 2010 / early 2011. Encouragingly, malaria incidence in Shimelba was lowest in 2011 /2012, compared to all other years.
Figure 36: Incidence of Suspected Malaria in 6-59 months -
Mai'Aini
61 2010 JAM Ethiopia 62 Shimelba and Mai-Aini nutrition survey 2010

Anaemia Strategy Review 89 | 1 4 0
Figure 37: Incidence of Suspected Malaria in 6-59 months - Shimelba
De-worming
• De-worming campaigns were functioning in the Eritrean, Sudanese and Somali camps by 2010.
• However, no information is available on de-worming coverage from nutrition surveys in 2008 / 2009 / 2010. Nutrition surveys of 2009 commented that de-worming was ‘not properly run’.
• Indeed, the incidence of intestinal worms is substantially more than in other countries in this review. HIS data shows that the levels of intestinal worms in Shimelba, Sherkole and Sheder were all extremely high in 2010, stabilising once more (at a high level still) in 2011. Intestinal worms are one of the most common causes of morbidity according to HIS.
• In camps in Dollo Ado, such as Kobe and Hiloweyn, there have been reports of high worm infestation amongst children visiting the clinics. Routine de-worming campaigns have yet to be established and are urgently needed to help address anaemia in these settings.
Figure 38 : Incidence of Intestinal Worms in children 6-59 month, Ethiopia, various camps

Anaemia Strategy Review 90 | 1 4 0
Vitamin A supplementation
• Routine Vitamin A supplementation was ‘not properly run’ according to the survey of 2009 in various camps. Vitamin A supplementation is very low still in various camps. This may not necessarily be a result of lack of services, but of poor general health seeking behaviour, as is reported in the nutrition surveys of 2011.
Table 32: Vitamin A vaccination / supplementation, Ethiopia, older camps63
Vitamin A vaccination / supplementation coverage
Coverage year
Fugnido Sherkole AwBarre Kebribeyah Sheder Shimelba Mai’Aini
2008
85.1% /80.6 (Nure/ Anuak)
No Survey
55.6% (T/Ber)
97% No Survey 99.4% No survey
2009 87.2% 96.3% 92.9% 97.8% 75.3% 97% 69.3%
2010 48.7% No
Survey 91.0% 93.9%
75.9%
97.1% 80.6%
2011 No Survey 59.9% No Survey No Survey No Survey 96.3% 36.1%
Other
• IYCF : Information from nutrition surveys on IYCF practises is relatively poor in the surveys from the older camps. Again, many of the basic services in Dollo Ado are still establishing themselves.
63
Note: Data shown is either parental confirmation or with card

Anaemia Strategy Review 91 | 1 4 0
IV) Trend analysis of nutritional indicators – camps other
than Dollo Ado, Ethiopia Baseline data and interpretation of results:
• Baseline data for the older camp so Ethiopia is taken as 2008, other than for Mai-Aini which opened in 2008, for which baseline will be taken as 2009.
• To note, for the purposes of this review, nutrition survey data for Ethiopia was challenging to use for a number of reasons, such as missing data between years, lack of confidence intervals and lack of core indicators such as Mean Hb.
Children 6-59 months
Total Anaemia trends (<11g/dl)
• Overall the results from Ethiopia are encouraging for anaemia, although data is available only up to 2010 for most. In Fugnido, Kebribeyah and Sheder total Anaemia reduced significantly between 2009 and 2010 (p<0.05) and in Shimelba between 2008 and 2009 (p<0.05). In AwBarre a non-significant decreasing trend is also shown. Anaemia was a problem of medium public health significance for all of the older camps, as per latest data.
• Unfortunately, for the older camps, no trends can be demonstrated with regards to Total Hb <10g/dl, as information on the difference severities is not reported before 2011. Where severe anaemia is reported, mild and moderate are grouped together meaning evaluating total <10g/dl is not possible.
Figure 39: Total Anaemia prevalence (<11g/dl) in 6-59 months, Ethiopia, older camps

Anaemia Strategy Review 92 | 1 4 0
Stunting: • Little evaluation of the effect of the Anaemia strategy on stunting can be made in Ethiopia.
Age documentation is poor (use of manifests and other non-reliable sources), therefore, the little stunting data that is available should be interpreted with caution.
• Only Shimelba and Mai-Aini show two reported data points; in both stunting has increased – but this may be due to a number of reasons including the emergency context of 2011.
Figure 40: Stunting in 6-59 months, Ethiopia, older camps
GAM:
• Only in Fugnido and Sherkole was GAM above threshold for a ‘high’ public health problem in 2010 / 2011, although results from Sherkole are hard to interpret due to a huge confidence interval with the 2011 data.
• GAM has remained stable in Fugnido, AwBarre and Mai’Aini, the latter having very low prevalence of GAM. Reductions in GAM have been made in Kebribeyah and Shimelba.
Figure 41: GAM in 6-59 months, Ethiopia, older camps

Anaemia Strategy Review 93 | 1 4 0
Mean Haemoglobin in 6-59 months
• Unfortunately Mean Hb was not reported in nutrition survey data before 2011. Encouragingly,
for the results available for the older camps, Mean Hb is reported with 11.4 g/dl in Sherkole, 11.9 g/dl in Shimelba and 11.9 g/dl in Mai’Aini.
Age Categorisation, Ethiopia:
• Unfortunately no data is available from the nutrition surveys in the older camps that breaks
down the age categorisations of Anaemia into 6-23 months and 24-59 months, nor into severities.
Non-Pregnant Women
• Interestingly, the prevalence of anaemia in non-pregnant women in the older camps in Ethiopia
is categorised as ‘low’ in all but one camp, Fugnido, in which it is a public health problem of ‘medium’ severity. These impressive results are interesting in comparison to the 6-59 months results.
• No significant decrease in the prevalence of Anaemia in non-pregnant women was shown in any of the older camps in Ethiopia over the course of the Anaemia Strategy.
Figure 42: Prevalence of Anaemia (<12/g/dl) in Non-Pregnant Women, Ethiopia, older camps

Anaemia Strategy Review 94 | 1 4 0
V) Trend analysis of nutritional indicators – Dollo Ado camps
Baseline Data: • Importantly, caution must be taken when interpreting the biological impact of the
anaemia strategy in Ethiopia due to the impact of the Horn of Africa emergency in 2011 • Nevertheless, Dollo Ado has been included to show how Anaemia Strategy activities,
including BSFP using CSB++, might influence nutritional indicators in an emergency environment.
• To note, the BSFP of CSB++ for 6-24 months and Premix for 24-59 months was introduced in January 2012 to Dollo Camps. The nutrition surveys of this year were conducted in March 2012 in Boqolmayo, Melkadida and Bur Amino and in June 2012 in Kobe and Hilaweyn. Therefore, CSB++ BSFP had been running for 2 months for Boqolmayo, Melkadida and Bur Amino and for 5 months in Kobe and Hilaweyn when the most recent surveys were conducted.
Children 6-59 months
Total Anaemia trends (<11g/dl)
• In Dollo Ado, anaemia remains a public health problem of high significance. • No significant change in anaemia prevalence has been shown since 2011 in camps other than
Melkadida, which shows overall lower levels of anaemia and a significant reduction between 2011/ and 2012.
• Total anaemia <10g/dl makes up around half of the anaemia prevalence in these camps.
Figure 43: Total Anaemia prevalence (<11g/dl and <10g/dl) in 6-59 months, Ethiopia, Dollo Ado

Anaemia Strategy Review 95 | 1 4 0
Stunting:
• In Dollo Ado, stunting has reduced significantly in Boqolmayo and Kobe, and shows no change in 2 other camps (2011-2012). The validity of age documentation is unknown.
Figure 44: Stunting in 6-59 months, Ethiopia, Dollo Ado
GAM:
• Thankfully, in the camps of Dollo Ado, the nutrition situation with respect to GAM has been greatly improved since 2011, although in all camps it remains a concerning ‘high’ level, and in Melkadida, Hiloweyn and Buramino a ‘critical’ level with levels of 15.0%, 15.9% and 32.5% respectively. This may be due to the poor condition of incoming new arrivals.
Figure 45: Global Acute Malnutrition prevalence in 6-59 months, Ethiopia, Dollo Ado

Anaemia Strategy Review 96 | 1 4 0
Total Anaemia Trends (<11 and <10/dl) and severity categorisation
Figure 46: Anaemia Severity in children 6-59 months, Ethiopia, Dollo Ado
Mean Haemoglobin in children 6-59 months • No particular changes are shown in mean haemoglobin for the Dollo Ado camps.
Figure 47: Mean Haemoglobin in 6-59 months Ethiopia, Dollo Ado
Age Categorisation Total Anaemia trends (<11g/dl, <10g/dl) in 6-23 and 24-59 months, Ethiopia, Dollo Ado
• The available data on anaemia prevalence is shown in the figure below. Unfortunately, ‘trends’ cannot be analysed due to only two data points

Anaemia Strategy Review 97 | 1 4 0
• As expected, anaemia <11g/dl is higher amongst 6-23 month children. In all camps the prevalence of anaemia is well above threshold of 40% severe public health problem.
• When considering only 24-59 month children, in two camps the prevalence of total anaemia <11g/dl drops below the ‘high’ threshold into ‘medium’ – the other two camps are very near the threshold also
• Improvements seem to be more substantial in the 24-59 months group than the younger age group; all camps show a decreasing trend
• Looking at anaemia <10g/dl, again this seems to be more consistently reducing in the 24-59 months group. Anaemia <10g/dl is high in the younger age group, for example with 46% of children 6-23 months in Hiloweyn having either moderate or severe anaemia in 2012.
• Note: prevalence is not weighted, and confidence intervals cannot be attained for the total <10g/dl data without further analysis of the original datasets
Figure 48: Total Anaemia (<11g/dl) in 6-23 months and 24-59 months, Ethiopia, Dollo Ado
Figure 49: Total Anaemia (<10g/dl) in 6-23 months and 24-59 months, Ethiopia, Dollo Ado

Anaemia Strategy Review 98 | 1 4 0
Mean Haemoglobin in 6-23 and 24-59 months, Dollo Ado Mean haemoglobin data is only available from nutrition surveys for 2012 for 3 camps for the age categories 6-23 and 24-59 months. This data is tabulated below:
Table 33: Mean Haemoglobin in 6-23 and 24-59 months, Ethiopia, Dollo Ado
Mean haemoglobin data by age group
Camp Year 6-23 months 24-59 months
Boqolmayo 2012 10.2g/dL (1.39 SD)
[5.7g/dL min, 13.4g/dL max] 11.1 (SD and range
unavailable)
Melkadida 2012 10.7g/dL (1.13 SD.)
[6.8g/dL min, 13.4 g/dL max] 11.5 (SD and range
unavailable)
Buramino 2012 10.1g/dL (1.50 SD.)
[4.0g/dL min, 14.0g/dL max] 10.9 (SD and range
unavailable)
Total Anaemia in Non-Pregnant Women, Dollo Ado
• In the newer Dollo Ado camps, as might be expected, anaemia is considerably higher, and data from 2011 should be recognised as coming from an emergency situation. Nevertheless, some impressive gains have been made since then, with significant reductions in the camps between 2011 and 2012, particularly in Melkadida which has seen anaemia reduce from 49.7% (41.4-58.0) to 24.0% (18.6-30.1). All the newer camps other than Buramino now have anaemia prevalence of a ‘medium’ public health problem. In Buramino, the Anaemia prevalence remains very high, at 48.3% (40.0-56.7).
Figure 50: Prevalence of Anaemia in Non-Pregnant Women, Ethiopia, Dollo Ado

Anaemia Strategy Review 99 | 1 4 0
Mean Haemoglobin in Non-Pregnant Women, Dollo Ado
• As can be seen from the graph below, despite the seeming gains in anaemia prevalence, the mean haemoglobin levels in Boqolmayo and Hiloweyn have actually decreased since 2011.
Figure 51: Mean Haemoglobin in Non-Pregnant Women, Ethiopia, Dollo Ado
Summary
• Implementation of the Anaemia Strategy was limited by the necessity to divert resources to address the emergency unveiling in the newly formed camps in the Dollo Ado region. As such, activities and monitoring in the more stable older camps were de-prioritised from 2011. Nevertheless, BSFPs for children and PLW have been established in all camps, and small-scale agriculture projects and capacity building were important achievements – alongside the vital emergency response in Dollo Ado for which Anaemia Strategy funds were used. BSFP using CSB++ has been introduced in Dollo Ado, whereas the older camps are currently continuing with Premix. Gaps do seem to exist in public health services across Ethiopia, such as deworming (esp. Dollo Ado), malaria control (esp. Shimelba and Mai’aini) and Vitamin A supplementation (esp. Fugnido, Sherkole and Mai’aini), although detailed documentation is lacking.
• Camps other than Dollo Ado: Encouraging results are reported from the older camps. Anaemia is a ‘medium’ public health concern, lower than in many other countries in this review and shows a declining trend in most camps. GAM has remained stable or decreased; while stunting data is too sparse or unreliable to analyse. Interestingly, anaemia in non-pregnant women is considerably lower than in other country camps. This may be in part due to the fact that it is also the only country that does not have a nutrient gap in the planned general ration for either Iron or Vitamin A, and due to the stability of IPs and services in these camps. For Shimelba and Mai-Aini the demographic make-up of the camps (high proportion of males) may also play a role in this.
• Dollo Ado camps: Results from Dollo Ado must be seen within the context of an unfolding emergency, with a number of systems being established as events unfurled. Nevertheless, Anaemia Strategy funds were used in these camps, therefore it is important to review the

Anaemia Strategy Review 100 | 1 4 0
evidence for any impact. Again, whilst results are extremely encouraging for GAM with considerable reductions made, anaemia has shown little change as yet in children, although quite significant reductions are reported in non-pregnant women. In children, worryingly, moderate and severe anaemia make up a considerable proportion of the anaemia in these camps. Anaemia in the older age group seems to be declining more, although CIs are not available and therefore analysis was limited. Moving forward, now that stability is being established in the Dollo Ado region, survey data will help to understand the influence of interventions such as BSFP using CSB++, on anaemia and anthropometric indicators.

Anaemia Strategy Review 101 | 1 4 0
F) KENYA
I) Background and context Kakuma refugee camp is located in the Turkana district, in the north western region of Kenya. The camp was established in 1992 to accommodate south Sudanese refugees fleeing civil war. The demographics of Kakuma have changed considerably over the last 10 years; due to large repatriation of the Sudanese and resettlement of Somalis; Somali refugees are now in the majority. The United Nations High Commission for Refugees (UNHCR) and the World Food Programme (WFP) have been working together, in partnership, to ensure that food security and essential services for the refugees are adequately addressed. Interestingly, an ‘integrated model’ has been adopted in Kakuma that attempts to coordinate the various services such as public health, nutrition and IYCF, to avoid duplication of efforts and messages, and move away from vertical programming that was deemed inefficient in terms of staff and resources. The Dadaab refugee camps in North Eastern Province of Kenya now comprise 5 camps (Hagadera, Ifo, and Dagahaley which have been established for over 2 decades, and Ifo-2 and Kambioos which were set up from 2011 onwards). The nutrition situation in Dadaab is more precarious but was improving at the time the Anaemia Strategy was introduced, with GAM dropping below the 15% emergency threshold for the first time in several years in 2008. The majority of the refugee population is largely dependent on the general food ration (GFR) distributed by WFP as their source of food. A number of IPs are in place in the camps, such as SCUK which introduced a Fresh Food Voucher System in 2010. Table 34: Key information, Kenya
Country Camps within review Majority ethnicity Malaria IP for nutrition
Kenya Kakuma
Sudanese, Somali, Congolese
High prevalence
IRC
Dadaab: Hagadera (Hag), Ifo, Dagahaley (Dag) camps. To note, Ifo-2 and Kambiopos are not included in this review
Somali Low prevalence MSF CH, IRC
The population in Dadaab has been steadily increasing over the past few years, with a major influx in 2011 during the crisis in the Horn region, as shown in the figure below.

Anaemia Strategy Review 102 | 1 4 0
Figure 52: Total population in Kakuma and Dadaab, 3 camps, 2008-2012
Data on Malaria incidence from HIS In Kakuma, as the figure below demonstrates, the incidence of malaria shows a considerable peak around August 2011 and 2012. This may have affected level of anaemia during this time, as well as the reported prevalence of anaemia in nutrition surveys conducted in November of these years.

Anaemia Strategy Review 103 | 1 4 0
Figure 53: Malaria incidence in Kakuma 2008-2012
General food distribution The daily ration is described below - to note, this is the planned ration, not necessarily what was distributed or received by the refugees. The food basket was enhanced in Dadaab in 2010 and in Kakuma in October 2011 with the introduction of improved CSB+. Table 35: Quantities and food items distributed in Kakuma, November 201164
Food Commodity Quantity (grams / person / day)
Maize 210
Wheat Flour 210
Pulses 60
Vegetable oil 35
CSB+ 40
Salt 5
Complementary foods were provided when available, but have not been introduced for a prolonged period: • Green grams were introduced but suspended in Dadaab • Tuna was introduced twice and also green grams in Kakuma but neither have been available for a
while.
The Nutrient Gap
Analysis of the nutrient adequacy of the planned general ration was performed using NutVal. This reveals there to be a considerable gap in iron, calcium and riboflavin in the general food ration.
64 Nutrition Survey 2011, Kakuma

Anaemia Strategy Review 104 | 1 4 0
Table 36: NutVal analysis of the general ration contents, Kakuma65
Energy Protein
Fat
Calcium Iron Iodine VitA ThiamineRiboflavin Niacin VitC
Requirements provided by ration (%)
102% 130% 126% 52% 79% 211% 109% 176% 67% 146% 157%
Acute malnutrition services Services for treatment of MAM and SAM are in place. In Dadaab, Integrated Management of Acute Malnutrition (IMAM) has been adopted, which endeavours to ensure early diagnosis and treatment for malnourished children through involvement of the community in identification and management.
II) Anaemia Strategy funding and management Funding for the Anaemia Strategy in Kenya
Funds requested in the country proposal were: USD $5,729,256 +265,000 for staffing (to be allocated from both HC special fund and standard programme budget). Requested budget is given below:
Table 37: Requested budget per year per camp Year Dadaab Kakuma Total
2008 573 284 191, 095 764,378
2009 1,756,452 785, 484 2,51,936
2010 1,667,207 755, 736 2,422,942
Total 3,996,943 1,332,315 5,729,256
+265,000 for staffing
Information on programme funding is not available, but the amount allocated from the HC special fund is shown below.
65 Note: Lentils used for pulses and wheat flour white used in NutVal analysis

Anaemia Strategy Review 105 | 1 4 0
Table 38: Allocated funds from High Commissioner special fund
Kenya – Allocated HC funds ($)
Funds allocated in 2009 Funds allocated in 2010 Funds allocated in 2011 Funds allocated in 2012
1,582,604 641,144 500,000 40,000
Anaemia strategy management issues • Dadaab was faced with an emergency situation in 2011, with security issues and a
considerable influx due to food insecurity and famine in the region. Camp instability made it difficult to provide high quality services and capacity is said to have been extremely stretched. A national consultant had been recruited in Dadaab to support management using Anaemia Strategy funds, which is likely to have helped considerably. Thankfully also, existing partners were in place in Dadaab during the emergency therefore capacity building of new IPs was not an issue as was seen in, for example, Dollo Ado, Ethiopia. Systems were in place to support the influx.
III) Anaemia Strategy activities
Diversification of Food and Reducing Reliance – Agriculture and Animal Husbandry
• Small-scale agriculture projects have been quite successful in Kakuma, but less so in Dadaab. • In Kakuma, small-scale kitchen gardens, growing mainly vegetable crops include spinach,
kale, cowpea, okra, tomatoes etc., have been up-scaled through Anaemia Strategy funds. The produce is generally used for personal consumption, but households also frequently sell their produce in order to further diversify their diets or buy non-food items. This helps to protect the GFR from resale. In 2012, around 20% of households had kitchen gardens. This is mainly households with at least one child of 6-59 months, the elderly, or those with special nutritional needs. Whilst not without challenges such as funding availability for tools, seeds and soils, and concerns of water point tap stands that serve as breeding grounds for mosquito parasites, generally kitchen gardens show encouraging promise and efforts should be continued to maintain them.
• In Dadaab, a number of local and management issues meant, unfortunately, that coverage of MSGs dropped from 2,480 to 200 between 2008 and 2010. Key challenges identified included costly and labour intensive transport of materials to the camps and to block level, lack of coordination and communication issues, and water availability in Dadaab, amongst others.66
• Animal husbandry projects do not seem to have been very successful in Kenyan camps. In Dadaab a number of challenges were encountered, such as broiler chickens brought in for production that were not suited to the hot climate, insufficient veterinary support and vaccinations against diseases, lack of feed and space to contain the animals.
66 See report ‘MSG consultation on multi-storey gardens in Kenya and Ethiopia’ by Dr.Wagah (2010)

Anaemia Strategy Review 106 | 1 4 0
Use of Special Nutritional products in BSFP Blanket SFPs were introduced in both Kakuma and Dadaab. These were a particularly important initiative, as many other services such as de-worming and Vitamin A supplementation were already in place (see below), yet anaemia levels remained high. A population based MNP intervention was also initiated in Kakuma in 2009 after an encouraging acceptability study: Table 39: MNP intervention, Kenya
Camp
BSFP and Nutritional Supplement Programmes
Target Regimen Delivery Start date End date
Kakuma MNP Population 1 sachet /
person / day Monthly with
GFD February
2009 June 2010
This MNP intervention suffered major programmatic challenges (see details below). More recently, in Kakuma and Dadaab, BSFPs first with LNS Nutributter® and now with CSB++ were introduced with the following protocol: Table 40: Blanket SFP intervention implemented, Kenya
Experience of Implementing BSFP MNP The Kakuma MNP programme is generally recognised to have been an unsuccessful attempt at reducing micronutrient deficiency in the population; a number of problems were identified in a qualitative study exploring this experience.67 ,68 67 Kodish S, Rah J, Kraemer K, De Pee S, Gittelsohn J (2010) Understanding low usage of micronutrient powder in the Kakuma Refugee Camp, Kenya: findings from a qualitative study. Food and Nutrition Bulletin Vol 32(3) pp292-303 68 Ndemwa P, Klotz C, Mwaniki D, Sun K, Muniu E, Andango P, Owigar J, Rah J, Kraemer K, Spiegel P,
Camp
BSFP and Nutritional Supplement Programmes
Target Regimen Delivery Start date End date
Kakuma
Nutributter® 6-23 months Daily Monthly Apr-11 Oct-11
CSB++ 6-23 months 6 kg/ month Monthly Nov-11 Ongoing
CSB+ PLW 1.61 kg/ biweekly
Biweekly
Dadaab
Nutributter® 12-35 months Daily Monthly Nov-09 Jun-10
Nutributter® 6-23 months Daily GMP twice monthly Dec-10 Aug-11
CSB++ 6-59 months 6 kg/ month Monthly Sep-11 Ongoing

Anaemia Strategy Review 107 | 1 4 0
Summarising this report:
• The programme began with high uptake at distribution of 99% falling to an average of 45-50% uptake of MNP.
• Programmatic and management failures meant sensitisation and IEC were poorly conducted and cultural barriers were not addressed. Community health workers were inadequately trained and communicated inaccurate message. Scoopers provided inaccurate information at distribution points.
• This led to a number of rumours propagating about MNP: o Family planning due to recurring images of a single child and packaging that
resembled condoms and was offensive to Islam in the depiction of a ‘ghost’ o Suspicion over the ingredient base e.g. meat, halal / haram o Side effects attributed to MixMe™.
• Lastly, MixMe™ (due to a delayed launch) was initiated at the same time as a cohort study involving blood drawing and anthropometric measurements; this led to distrust and resentment about the use of refugees as research subjects for the development of MixMe™.
A key lesson learnt from this intervention is the importance of IEC campaigns that have sufficient coverage, intensity and cultural relevance when implementing MNP programmes. Dadaab did not ever introduce MNP due to caution after the Kakuma experience and shifting priorities during the 2011 emergency. LNS • Overall, it seems the LNS programme was implemented relatively smoothly. Nutributter® was
accepted well although there were concerns over sharing of the product. Challenges identified included a 4 month pipeline breakdown in for Nutributter® in 2011 in Dadaab.69
• CSB++ has also been accepted well, although again the extent of sharing has not been explored. Anecdotal accounts suggest this may be a problem.
Coverage data is not available for Nutributter® in Kakuma. In Dadaab, coverage was reportedly >90% at any given time70. No adherence data has been collected although empty sachets are collected in Kakuma and follow ups made as necessary. No acceptability study was conducted although in Kakuma some taste tests and cooking demonstrations for CSB++ were conducted initially. Malaria control
• Only in Kakuma is malaria a significant problem. With the support of the strategy, malaria control activities have been up-scaled, including active case-finding, annual indoor mass spraying campaign, distribution of mosquito nets. However, to note there was no IRS conducted in 2012. All efforts must be made to continue these core activities.
• In Dadaab, household IRS is conducted 2x per year before the seasonal rains in April and September.
Bloem M, De Pee S, Semba R (2011) Relationship of the availability of micronutrient powder with iron status and hemoglobin among women and children in the Kakuma Refugee Camp, Kenya. Food and Nutrition Bulletin . Vol 32 (3) pp286-292 69 For full details on the Nutributter® intervention and impact see report by Style S, UCL (2013) Assessment of the effectiveness of Nutributter® distribution on anaemia and stunting in refugee populations in Djibouti and Kenya 70 See 60

Anaemia Strategy Review 108 | 1 4 0
De-worming • Bi-annual (6 monthly) mass de-worming campaigns have been running in Dadaab and
Kakuma throughout the period of the Anaemia Strategy for children 6-59 months. • However by card or recall, de-worming coverage does not seem to have improved since 2008.
Table 41: De-worming coverage in Kakuma and Dadaab71
De-worming by card or recall
2008 2011
Kakuma 93.1% 89.6% (85.0-94.2)
Dadaab - Hagadera 84.6% 81.7 (74.9-88.5)
Dadaab - Ifo 80.5 79.6 (71.6-87.6)
Dadaab - Dagahaley 84.4 77.1 (68.6-85.7)
• The incidence of intestinal worms has remained relatively stable and not particularly high, around 10-50 cases / 1000 / month, with similar levels in Dadaab and Kakuma.
Figure 54: Incidence of Intestinal Worms, Kakuma72
Vitamin A supplementation • In Kakuma, Vitamin A supplementation is established as a routine 6 monthly distribution. In
addition, children receive vitamin A supplementation when enrolled in a feeding programme, as do new arrivals. However, coverage of Vitamin A supplementation has actually decreased since the start of the anaemia strategy, being lower in 2010 than in 2008 or 2009. Results in 2011 were not available as supply issues meant there was no supplementation in November 2011 (instead it was conducted December 2011).
• In Dadaab, reported supplementation coverage has remained stable. • In neither camp has Vitamin A supplementation reached the target of >90%.
71 Source: Nutrition surveys 2008 and 2011. To note, results are considerably lower by card alone). 72 Health Information System data
0
10
20
30
40
50
60
Jun
Aug Oct
De
c
Feb
Apr Jun
Aug Oct
De
c
Feb
Apr Jun
Aug Oct
De
c
Feb
Apr Jun
Aug Oct
De
c
Feb
Apr Jun
Aug
2008 2009 2010 2011 2012
Mal
aria
inc
iden
ce
(cas
es/1
000/
mon
th)
Intestinal worms <5 incidence

Anaemia Strategy Review 109 | 1 4 0
Table 42: Vitamin A coverage, Kakuma and Dadaab
Vitamin A coverage by card or recall
2008 2011
Kakuma 93.8% 2011 not available. 2010 = 76.6%
Dadaab - Hagadera 87.9 86.8 (82.1-91.5)
Dadaab - Ifo 86.5 85.5 (79.5-91.6)
Dadaab - Dagahaley 89.6 78.8 (69.5-88.2)
Iron supplementation in ANC
• Routine screening of pregnant women and iron supplementation is in place. As with many countries, the acceptability of Iron and Folate is questionable. No study has been implemented to examine uptake at household level.
IV) Trend analysis of nutritional indicators - Kakuma73 Children 6-59 months Total Anaemia trends (<11g/dl):
• Baseline data for Kakuma is taken as 2008 • Anaemia showed no change before the November 2011 survey. Importantly, it was in April
2011 that Nutributter® was introduced, suggesting this had a major influence over anaemia in the camp.
• Similarly, mean haemoglobin showed a significant increase between the 2010 and 2011 nutrition surveys.
• By 2012, total anaemia prevalence had dropped below the threshold of ‘high’ public health concern to become of medium concern.
Stunting:
• Stunting fluctuated over the course of the strategy, but remained below 30%, the threshold for becoming of high concern. No significant changes have been reported since the Nutributter® / CSB++ BSFPs.
GAM: • GAM in 6-59 months showed a significant spike in 2009 but otherwise hovers below 10%
73 For further details on the Nutributter® intervention and biological trend data in Kakum and Dadaab, see Style S, UCL (2013) Assessment of the effectiveness of Nutributter®® distribution on anaemia and stunting in refugee populations in Djibouti and Kenya. Figures for children 6-59 months have been adapted from this report.

Anaemia Strategy Review 110 | 1 4 0
Figure 55: Global Acute Malnutrition (GAM), Stunting and Total Anaemia prevalence in 6-59 months, Kakuma74
Figure 56: Mean Haemoglobin in 6-59 months, Kakuma
Total Anaemia trends (<11 and <10 g/dl) and severity categorisation
• Total anaemia <10g/dl (severe and moderate anaemia) have reduced considerably over the course of the strategy, as shown by the two figures below. Moderate anaemia has dropped from 49.2% to 15.5% between 2008 and 2012, and severe anaemia 8.3 to 0.2%.

Anaemia Strategy Review 111 | 1 4 0
Figure 57: Total Anaemia (<11g/dl and <10g/dl) in 6-59 months, Kakuma
Figure 58: Anaemia Severity in children 6-59 months
Age categorisation
• Similar patterns are shown between both ages 6-23 months and 24-59 months. Both show insignificant changes in the first few years of the strategy, and then significant reductions from 2011 onwards, the first survey after Nutributter® was introduced for 6-23 months.
• Anaemia <11g/dl results for the age group 24-59 months are particularly impressive, reducing from 70.8% in 2008 to 25.5% in 2012. This is surprising, considering the BSFP was only introduced for the younger age group.
• Results for anaemia <10 g/dl are more align with each other. It seems this level of anaemia was extremely high in both age groups at the start of the anaemia strategy, and has markedly fallen.

Anaemia Strategy Review 112 | 1 4 0
Figure 59: Trends in Total Anaemia (<11g/dl) in 6-23 and 24-59 months, Kakuma
Figure 60: Trends in Anaemia <10g/dl in 6-23 and 24-59 months, Kakuma
Mean Haemoglobin concentration in 6-23 months and 24-59 months
• In ages 6-23 and 24-59 months, mean haemoglobin increases significantly between 2010 and 2011 / 2012, during the period of Nutributter® intervention for 6-23 months. No significant changes were reported in either age group prior to this. Patterns of change are extremely similar between each age group.
• Mean haemoglobin, as may be expected, is consistently higher in children 6-23 months.

Anaemia Strategy Review 113 | 1 4 0
Figure 61: Mean Haemoglobin in 6-23 months and 24-59 months
Non-pregnant women
• Anaemia in non-pregnant women has fluctuated considerably. It shows a substantial increase in 2010 (60.5%; 95% CI 54.6-66.5), before returning to levels similar to 2008 / 2009 in 2011 (31.1%; 95% CI 24.6-36.6). The reason for this spike is not known; no specific changes to services were reported in this time.
• Mean haemoglobin was not reported in nutrition surveys until 2011 (12.6g/dl; 95% CI 12.4-12.7).
Figure 62: Trends in total anaemia <12g/dl in non-pregnant women, Kakuma

Anaemia Strategy Review 114 | 1 4 0
V) Trend analysis of nutritional indicators – Dadaab
Children 6-59 months75 Total Anaemia trends (<11 g/dl):
• Total anaemia in children showed no significant change in the first year of the Anaemia Strategy, but has significantly reduced between 2009 and 2011 in all three camps, during the period of the Nutributter® intervention.
GAM
• GAM remained relatively stable before increasing in 2011 due to the emergency in the Horn Region. Levels of GAM were high in all camps in 2011.
Stunting
• Stunting has shown little change in IFO and fluctuated in the other camps. Levels of stunting are of medium concern in 2011.
Figure 63: Global Acute Malnutrition (GAM), Stunting and Total Anaemia prevalence in 6-59 months, Dadaab
Total Anaemia Trends (<11 and <10 g/dl) and severity categorisation
• The prevalence of anaemia <10g/dl has markedly reduced in Dadaab, as was shown in Kakuma. Severity categories reveal that both moderate and severe anaemia have shown considerable reductions. Levels of mild anaemia have remained relatively stable.
75 Note: Survey data from August 2008, August 2009, August 2010 and September 2011 is reported.

Anaemia Strategy Review 115 | 1 4 0
Figure 64: Total Anaemia (<11g/dl and <10g/dl) in 6-59 months, Dadaab
Figure 65: Anaemia Severity Categories in 6-59 months, Dadaab
Mean Haemoglobin in 6-59 months
• As shown by the figure below, mean haemoglobin has increased significantly in all camps since 2009, as might be expected from the prevalence results.

Anaemia Strategy Review 116 | 1 4 0
Figure 66: Mean Haemoglobin in 6-59 months, Dadaab
Age Categorisation Total Anaemia trends (<11g/dl, <10g/dl) in 6-23 and 24-59 months, Dadaab
• Interestingly, as can be seen from the figures below, greater reductions in anaemia <10g/dl
and <11g/dl by age group 24-59 months. Anaemia reduction in 6-23 months shows a gentler decline in Dagahaley and Ifo, and fluctuates in Hagadera – whilst in 24-59 months a sharp reduction is shown.
Figure 67: Prevalence of Total Anaemia (<11g/dl) in 6-23 months and 24-59 months, Dadaab
Figure 68: Prevalence of Total Anaemia (<10g/dl) in 6-23 months and 24-59 months, Dadaab

Anaemia Strategy Review 117 | 1 4 0
Mean Haemoglobin in 6-23 and 24-59 months, Dadaab
• In all camps and both age groups, mean Haemoglobin has increased over the course of the Anaemia Strategy, with more substantial improvements in the 24-59 month group.
Figure 69: Mean Haemoglobin in 6-23 and 24-59 months, Dadaab
Non-Pregnant Women • Total anaemia prevalence (<12g/dl) in non-pregnant women decreased significantly between
2010 and 2011 in all three camps. Before this, no significant changes were reported. • Anaemia remains a ‘high’ public health problem, above 40% in all three camps. • Mean haemoglobin was only reported in 2011; in this year in Ifo and Dagahaley Mean Hb
was below the threshold for anaemia (<12g/dl).

Anaemia Strategy Review 118 | 1 4 0
Figure 70: Total anaemia trends (<12 g/dl) in non-pregnant women, Dadaab76
Table 43: Mean Haemoglobin in non-pregnant women, Dadaab
Camp Mean Haemoglobin (g/dl) (95% CI) in 2011
Hagadera 12.1 g/dL (11.9-12.4)
Dagahaley 11.8 g/dL (11.5-12.1)
Ifo 11.6 g/dL (11.3-12.0)
Summary:
• Increasing population particularly in Dadaab but also in Kakuma. Malaria incidence increasing in Kakuma, investigation is needed into more effective control activities for this. GFD has a nutrient gap for Iron. Kakuma agriculture programmes have been relatively successful despite challenges, however local issues mean success is limited in Dadaab. Neither de-worming not vitamin A supplementation have reached targeted coverage levels, and have even decreased. The MNP intervention at population level was unsuccessful on several counts, but BSFP using both Nutributter® and CSB++ have been well accepted.
• Kakuma results: Anaemia in children has decreased since the Nutributter® intervention started, but not beforehand. Severe and moderate anaemia have particularly decreased in both
76 Confidence intervals were not reported in nutrition surveys from 2008 /2009

Anaemia Strategy Review 119 | 1 4 0
age groups (6-23 and 24-59 months). GAM remains relatively stable below 10%. Stunting has shown no change. Anaemia in non-pregnant women has fluctuated.
• Dadaab results: Anaemia in children has reduced in Dadaab between 2009 and 2011, which coincides with the Nutributter® intervention. Severe and moderate anaemia have particularly reduced. GAM was stable but increased in 2011. Stunting has fluctuated. Anaemia in non-pregnant women has decreased significantly in the last year of study.

Anaemia Strategy Review 120 | 1 4 0
G) DJIBOUTI
I) Background and context
Ali Addeh refugee camp was established in the Al Sabieh district of Djibouti after the collapse of the Siad Barre Somali government in 1991, to host refugees fleeing the civil war. It has since also offered refuge to Ethiopian and Eritrean refugees. The camp is situated in a remote semi-arid region prone to drought and with poor livelihood opportunities. The camp is administered by the Government of Djibouti through the camp commander, under the jurisdiction of the Ali Sabieh Commissioner and the National Emergency and Disaster Relief Organization. UNHCR is responsible for the protection and humanitarian assistance programmes in the camp. The refugees in Ali Addeh are largely dependent upon food aid; a monthly food ration is provided by WFP in collaboration with UNHCR. Table 44: Key information, Djibouti
Country Camps within
review Majority ethnicity Malaria IP for nutrition
Djibouti Ali Addeh Somali majority (96%), Ethiopian
and Eritrean
Endemic with seasonality March
and October AMDA
Data on shifting population from HIS The population of Ali Addeh camp has increased due to the drought in the Horn of Africa region, but this is not thought to have significantly influenced the nutrition situation of the overall camp as only 3.7 % of the new arrivals that arrived between January 2011 and January 2012 were children under five; most newcomers were young single adults. Figure 71: Total population in Ali Addeh camp, Djibouti77
77 Health Information System data (to note, data only started to be collected for Ali Addeh in 2009)

Anaemia Strategy Review 121 | 1 4 0
Data on Malaria incidence from HIS Malaria incidence in children 6-59 months is not as high as some camps such as Kakuma, Kenya, but certainly at levels that are a concern and could contribute to anaemia prevalence in the camp. Spikes are shown throughout the period of the Anaemia Strategy, suggesting that malaria control activities could be up-scaled. Figure 72: Malaria incidence in Ali Addeh 2009-201278
General food distribution The daily ration is described below - to note, this is the planned ration, not necessarily what was distributed or received by the refugees. Table 45: Quantities and food items distributed in 2011, Ali Addeh, Djibouti79
Food Commodity Quantity (grams / person / day)
Wheat flour 400
WSB 50
Pulses (beans, lentils etc) 60
Vegetable oil 30
Sugar 20
Salt 5
From January to May 2011, canned tuna was provided to all refugees through the general distribution as well as complementary food from UNHCR.
78 Health Information System data 79 Adapted from the Nutrition Survey Djibouti 2011

Anaemia Strategy Review 122 | 1 4 0
The Nutrient Gap The general food ration in 2011 meets the recommended energy intake but does not cover all the nutritional needs. With particular relevance to anaemia, the iron content is very low at 65%. Table 46: NutVal analysis of the general ration contents, Djibouti80
Energy Protein Fat Calcium Iron Iodine VitA ThiamineRiboflavin Niacin VitC
Requirements provided by ration (%)
102% 136% 99% 66% 65% 213% 106% 107% 44% 160% 193%
Acute malnutrition services
• The 2009 JAM reports that nutritional services provided in the camp have improved since 2007; community management of acute malnutrition is ensuring the ‘rapid and successful’ rehabilitation of malnourished children and PLW. The SFP food consists of a WSB/oil/sugar premix and is distributed once every 2 weeks with an additional canned tuna, tomato paste and pulse for anaemic children and PLW.
• However, levels of acute malnutrition are alarmingly high, at 15% in 2012 suggesting that detection and management could be further improved.
• Coverage of SFP and TFP for children aged 6-59 months with SAM or MAM is low (22.2% (0 - 35.5) and 14.5% (6.2 - 21.8) respectively.
II) Anaemia Strategy funding and management Funding for the Anaemia Strategy in Djibouti Funds requested in country proposal (to be allocated from both HC special fund and standard programme budget): USD $ 493,771 (for 2008 / 2009). Table 47: Allocated funds from the High Commissioner special fund
Djibouti – Allocated HC funds ($)
Funds allocated in 2009 Funds allocated in 2010 Funds allocated in 2011 Funds allocated in 2012
139,711 100,000 150,000 120,000
80
Note: NutVal analysis using wheat flour, white and WFP specs for salt and vegetable oil

Anaemia Strategy Review 123 | 1 4 0
Anaemia strategy management issues
• Funding issues were reported with regards to procurement of tools and supplies for Multi-Storey Gardens; insufficient funding was available for this.
• Human resources were a major barrier to initial implementation of activities; the first UNHCR Nutrition officer started in 2010. The high turnover of IP staff was also a challenge.
III) Anaemia Strategy activities
Diversification of Food and Reducing Reliance - Agriculture and Animal Husbandry • Multi-storey gardening has been introduced in Ali Addeh but key informant interview suggest
this activity was slow to get off the ground, and meant the targeted coverage (gardening to be expanded by 100%) has not been achieved to date.
• The extreme climate, lack of hydraulic infrastructure and water availability were a major challenge to agricultural projects in this camp (JAM 2009). Given the poor water availability, it is suggested that WASH become more involved in use of water not suitable for human consumption for small-scale agriculture (Nutrition survey 2011). Other limitations include insufficient provisions of tools and seeds, and complaints included seeds not being adapted to the refugee tastes. Furthermore, most refugees come from either an urban setting or a nomadic background and therefore lack agricultural skills. Nevertheless, the JAM 2009 reports that there was significant interest in learning new agricultural technologies such as MSG.
• Animal husbandry activities are in place but no information has been gathered on their coverage / scale. Limited pasture land has a great impact on the livestock population. Key informants, however, are keen to maintain and upscale this programme.
• Unfortunately, possibilities for the introduction of other livelihood and food diversity activities, such as fresh food voucher programmes, is limited by the lack of market in close proximity to the camp.
• Although there were discussions around introducing animal livers, that are not eaten by the host community, as a way to diversify the diet but due to cold chain and transportation issues from Djibouti city this initiative was not implemented.
Use of Special Nutritional products in BSFP Table 48: Blanket SFP intervention implemented, Djibouti
BSFP and Nutritional Supplement Programmes
Regimen Target Delivery Start date End date
Nutributter® 1 sachet / day
6-23 months GFD: 14 sachets
every 2 weeks
Dec 2009 Aug 2010
6-36 months
June 2010
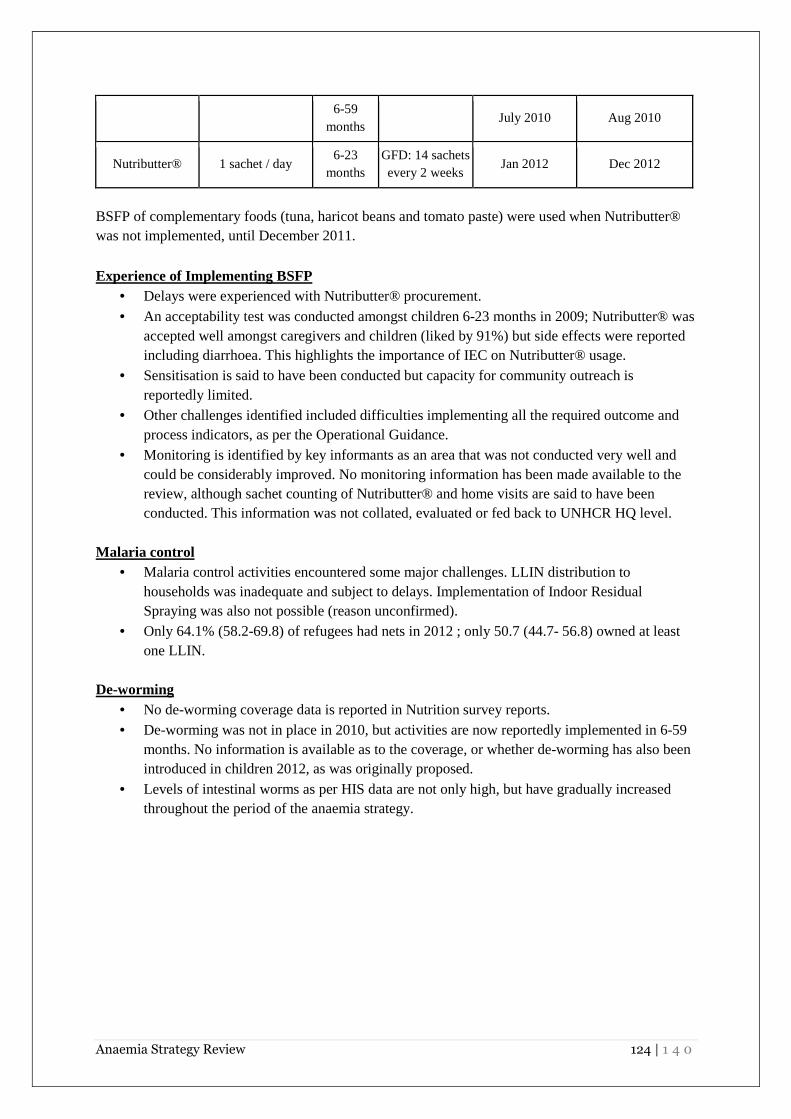
Anaemia Strategy Review 124 | 1 4 0
6-59 months
July 2010 Aug 2010
Nutributter® 1 sachet / day 6-23
months GFD: 14 sachets every 2 weeks
Jan 2012 Dec 2012
BSFP of complementary foods (tuna, haricot beans and tomato paste) were used when Nutributter® was not implemented, until December 2011.
Experience of Implementing BSFP • Delays were experienced with Nutributter® procurement. • An acceptability test was conducted amongst children 6-23 months in 2009; Nutributter® was
accepted well amongst caregivers and children (liked by 91%) but side effects were reported including diarrhoea. This highlights the importance of IEC on Nutributter® usage.
• Sensitisation is said to have been conducted but capacity for community outreach is reportedly limited.
• Other challenges identified included difficulties implementing all the required outcome and process indicators, as per the Operational Guidance.
• Monitoring is identified by key informants as an area that was not conducted very well and could be considerably improved. No monitoring information has been made available to the review, although sachet counting of Nutributter® and home visits are said to have been conducted. This information was not collated, evaluated or fed back to UNHCR HQ level.
Malaria control
• Malaria control activities encountered some major challenges. LLIN distribution to households was inadequate and subject to delays. Implementation of Indoor Residual Spraying was also not possible (reason unconfirmed).
• Only 64.1% (58.2-69.8) of refugees had nets in 2012 ; only 50.7 (44.7- 56.8) owned at least one LLIN.
De-worming
• No de-worming coverage data is reported in Nutrition survey reports. • De-worming was not in place in 2010, but activities are now reportedly implemented in 6-59
months. No information is available as to the coverage, or whether de-worming has also been introduced in children 2012, as was originally proposed.
• Levels of intestinal worms as per HIS data are not only high, but have gradually increased throughout the period of the anaemia strategy.

Anaemia Strategy Review 125 | 1 4 0
Vitamin A
• Vitamin A supplementation is intended to be conducted for children 6-59 months and pregnant women, however coverage in 2011 was low for children (66.0 % (56.0- 76.0 95% CI by card or recall).
ANC
• The Djibouti Anaemia Strategy proposal highlighted the high number of pregnant women arriving in clinics already severely anaemic. Addressing anaemia in PLW was a major objective of the country specific proposal.
• Key informant interviews suggest that routine surveillance, treatment and management of anaemia have improved considerably. Activities include the upscaling of iron / iron folate supplementation. Assessment with HemoCue™ as well as general detection and treatment of Anaemia amongst vulnerable groups is thought to have improved considerably over the course of the strategy; however, no specific documentation is available.
IYCF : • Timely initiation of breastfeeding within one hour was only 61.7% (54.2 -75.2) in 2011, and
18.4% (10.1 -26.7) of mothers did not exclusively breastfeed up to 6 months81. The lack of continuous sensitization about IYCF practices for mothers, and a gap of follow up by health medical nurses at birth is suggested to be contributing to poor IYCF.
IEC • Communications and education to address tea consumption is lacking in Ali Addeh;
consumption of tea amongst children under 6 months in 2011 was 51.2% with milk and 3.5% without. This may be having the adverse effect of lowering iron availability.
Other
• WASH: The 2009 JAM reports some water points not suitable for the drinking and prone to mosquito and other pathogen infestation. Water points are reportedly not managed or cleaned adequately, and an inadequate water supply with old water system is still in use. Refugees have a limited number of latrines – in 2009 this was 1 latrine per 17 individuals.82
81 Nutrition Survey Djibouti 2011 82 2009 JAM Djibouti

Anaemia Strategy Review 126 | 1 4 0
IV) Trend analysis of nutritional indicators
Children 6-59 months Total Anaemia trends (<11g/dl):
• Baseline data for Ali Addeh is taken as the December 2008 nutrition survey. • The prevalence of total anaemia reduced significantly between 2008 and 2010. Although
there was no significant change between 2011 and 2012 (42.4 95% CI 38.5-46.4), the overall prevalence dropped below the threshold of 40% to be categorised as a ‘medium’ public health problem.
Stunting
• Stunting in Ali Addeh has shown no improvement over the course of the strategy. The prevalence of stunting is concerning, ranging from 38.3% (95% CI 32.9-43.7) in 2008 to 42.9% (95% CI 37.5-43.7) in 2010 – above the threshold for a ‘high’ public health concern (30%).
GAM
• GAM has remained above the 10% ‘high’ threshold every surveyed year between 2008-2011,with levels defined as ‘critical’ in 2010 (16.2%; CI 12.3-21.1) and 2011 (15.0%; CI 10.9-20.4).
Figure 73: Global Acute Malnutrition (GAM), Stunting and Total Anaemia prevalence in 6-59 months, Djibouti
Total Anaemia Trends (<11 and <10 g/dl) and severity categorisation
• As shown below, a reduction in moderate and severe anaemia (total <10g/dl) is clearly responsible for the reduction in total anaemia (<11g/dl) between 2008 and 2010.
• Moderate anaemia has more than halved in Ali Addeh between 2008 and 2011, moving from 36.5% (30.7-41.2) to 16.0% (12.3-19.7).

Anaemia Strategy Review 127 | 1 4 0
Figure 74: Total Anaemia (<11g/dl and <10g/dl) in 6-59 months, Djibouti
Figure 75: Anaemia Severity Categories in 6-59 months, Djibouti

Anaemia Strategy Review 128 | 1 4 0
Age Categorisation:
• Interestingly, anaemia prevalence in both age groups decreases between 2008 and 2010, despite the BSFP Nutributter® at this time being only for 6-23 months children. During the period in which children 24-59 months are included, no further reduction is shown.
• As expected the prevalence of anaemia in children 6-23 months is higher in both <10g/dl (moderate and severe) and <11 g/dl (mild, moderate and severe) categories, than in children 24-59 months
• The prevalence of anaemia in children aged 24-59 months crossed the threshold into a ‘medium’ public health problem, whilst the prevalence in 6-23 months did not
• Both age categories 6-23 months and 24-59 months seem to have responded in parallel to the anaemia strategy; there is little differentiation between the relative improvements
• Similarly, mean haemoglobin concentration has increased in Ali Addeh, with a similar pattern of improvement in 6-23 months and 24-59 months. As expected, mean haemoglobin concentration is higher in children 24-59 months.
Figure 76: Prevalence of Total Anaemia (<11g/dl) in 6-23 and 24-59 months, Djibouti

Anaemia Strategy Review 129 | 1 4 0
Figure 77: Prevalence of Total Anaemia (<10g/dl) in 6-23 and 24-59 months, Djibouti
Figure 78: Mean Haemoglobin in children 6-59, 6-23 and 24-59 months, Djibouti

Anaemia Strategy Review 130 | 1 4 0
Non-Pregnant Women
• As shown in the figure below, prevalence of total anaemia (<12g/dl) amongst non-pregnant women significantly reduced in Ali Addeh between 2008 (44.5%; CI 37.6-50) and 2011 (27.2%; CI 22.7-31.7)
• However no significant reduction was shown in the first year of the strategy • Mean haemoglobin has also increased between 2008 and 2011 from 12.0 (SD 1.6) to 12.7g/dl
(CI 12.5-12.9%)
Figure 79: Prevalence of Anaemia (<12g/dl) in Non-Pregnant Women, Djibouti

Anaemia Strategy Review 131 | 1 4 0
Figure 80: Mean Haemoglobin in Non-Pregnant Women, Djibouti83
Summary
• In Djibouti, the Anaemia Strategy has not been implemented to full effect. A BSFP using Nutributter® has been introduced (with a break as per Operational Guidance recommendations). However, public health activities such as malaria control, de-worming and vitamin A supplementation do not seem to have been adequately implemented, monitored or show poor coverage respectively.
• Anaemia has reduced amongst children 6-59 months since the Nutributter® intervention,
which is driven primarily by a reduction in severe and moderate anaemia. Similar patterns of reduction are shown in both 6-23 months and 24-59 months age groups – despite the Nutributter® only being targeted to children 6-23 months during the period of anaemia reduction (2008 / 2010). Mean haemoglobin also increased in both groups during this time. Levels of GAM and stunting have not changed and are both high. Anaemia has also shown encouraging reductions in non-pregnant women.
• Anaemia prevalence could be further improved through addressing the food basket which
contains inadequate levels of iron in the food basket, reinforcing basic public health activities (malaria, de-worming, vitamin A supplementation), and addressing poor IYCF practises. Whilst detection and treatment, at least amongst women seems to have improved, opportunities within prevention still need to be addressed.
83 Confidence intervals not reported in 2010 / 2011

Anaemia Strategy Review 132 | 1 4 0
CHAPTER 5: SUMMARY OF CHANGES IN ANAEMIA
PREVALENCE Table 49: Summary of Anaemia Prevalence in Children 6-59 months (all countries in the review)
Anaemia Prevalence (<11g/dl) in Children 6-59 months
Country 2008 2009 2010 2011 2012
Significant reduction
during first two years of
strategy
Significant reduction baseline to
latest survey
Bangladesh 47.9% (44.1-
51.6) 28.9% (23.2-
34.7) 50.2% (45.9-
54.5 36.1% (30.4-
41.8) 29.8% (26.9-
32.8) Yes Yes
Nepal 43.6% (39.3-
48.1) 35.9% (32.0-
40.0) 40.2% (34.0-
47.3) 26.1% (22.5-
29.9) 49.9% (45.7-
54.5) No P<0.05 in 2011
Yemen - Kharaz camp
68.0% 77.9% 58.9%
(53.2-64.4) N/S N/S No No
Yemen - Kharaz villages
N/S 73.9% 64.5%
(56.4-72.0) N/S N/S No No
Algeria 62.0% N/S 52.8%
(49.1-56.6) N/S
Results Pending
n/a No
Djibouti 66.6
(60.8-71.2) Dec
N/S 42.5
(37.1-47.8) Apr
38.7 (34.5-42.9)
Oct N/A n/a P<0.05
Kenya – camps
Kakuma 73.3
(65.8-80.7) Oct
73.7 (69.2-78.2)
Nov
73.3 (66.8-79.8)
Nov
44.0 (38.5-49.5)
Nov
34.4 (29.0-39.8)
Nov No P<0.05
Dadaab - Dagahaley
72.5 (63.7-81.3)
Aug
75.0 (68.2-81.8)
Aug
65.9 (58.6-73.2)
Aug
47.6 (42.9-52.2)
Aug N/A No P<0.05
Dadaab - Hagadera
71.1 (64.2-78.0)
68.2 (59.2-77.2)
72.3 (67.2-77.5)
45.3 (40.4-50.2)
N/A No P<0.05
Dadaab - Ifo 71.0 (63.6-
78.5) 82.8
(76.7-88.9) 73.4
(68.2-78.7) 54.4
(49.5-59.2) N/A No
P<0.05
Ethiopia – camps
Camp 2008 2009 2010 2011 2012
Significant reduction
during first two years of
strategy
Significant reduction baseline to
latest survey

Anaemia Strategy Review 133 | 1 4 0
Fugnido 38.6%
(32.1-45.5) 42.3%
34.4% (33.0-35.8)
N/S N/S No No
Sherkole N/S 21.5% N/A 38.1%
(34.4-41.8) N/S No No
AwBarre 35.6%
(30.8-40.6) 32.1% 30.1% N/S N/S No No
Kebribeyah 35.7%
(31.2-40.4) 38.2%
24.8% (22.9 -26.7)
N/S N/S No P<0.05
Sheder N/S /
opening year 38.0% 26.6% N/S N/S P<0.05 n/a
Shimelba 35.9% 22.1% 22.3%
(20.3-24.3) 20.9% N/S P<0.05 P<0.05
Mai'Aini N/S /
opening year 27.8%
(25.3-30.3) 21.2% N/S n/a n/a
Boqolmayo N/S /
opening year 34.3% (32.4 -
36.2) 53.4% (48.5-
58.2) 50.2 (46.6-
53.0) No No
Melkadida N/S /
opening year 55.5% (51.5-
59.4) 39.0 (35.8-
42.3) Yes Yes
Hiloweyn 53.1% (48.9-
57.3) 49.6 (45.4-
53.8) No No
Kobe 51.6% (47.8-
55.3) 43.9 (39.7-
48.3) No No
Buramino 54.5 (50.2-
58.7) n/a n/a
Where the camp had not yet opened the cells are cross-hatched N/A, survey is reported to have been done but report was not available N/S, survey was not conducted The relevant month is given for years where two surveys were conducted

Anaemia Strategy Review 134 | 1 4 0
Table 50: Anaemia Prevalence in Non-Pregnant Women, all countries in the review
Anaemia (<12g/dl) Prevalence in Non-Pregnant Women
Country 2008 2009 2010 2011 2012
Significant reduction
during first two years of
strategy
Significant reduction baseline to
latest survey
Yemen - Kharaz camp
N/A 48.4%
(41.8-54.7) N/S N/S N/A N/A
Yemen – Kharaz villages
N/A 54.8%
(46.1-63.2) N/S N/S N/A N/A
Algeria 54.0% No survey 48.9% (45.3 - 52.5)
N/S N/S No Results pending
Bangladesh N/A N/A N/A 26.7%
(22.7-30.7) 22.1%
(18.8-25.4) No
No
Nepal N/A 14.2%
(11.4-17.5) N/A N/A N/A N/A
N/A
Djibouti
44.5 (37.6-50.4) Aug
N/S 37.9 (33.3-
42.8) 27.2 (22.7-
31.7) N/A N/A Yes
Kenya – camps
Kakuma 30.9 Aug
34.4 (31.0-38.0)
60.5 (54.6-66.5)
31.1 (24.6-36.6)
25.8 (19.532.0)
No No
Dadaab – Dagahaley
67.7 Aug
73.1 Aug
65.2 (60.8-69.7)
49.8 (41.3-58.3)
N/A No N/A (no CIs or design
effect to calculate
significance to baseline data)
Dadaab – Hagadera
67.4 64.0 61.2 (56.7-
65.8) 43.4 (35.6-
50.9) N/A No
Dadaab – Ifo
62.9 71.6 69.1 (42.8-
59.0) 50.9 (42.8-
59.0) N/A No
Ethiopia – camps
Fugnido N/A 27.6% 25.5%
(24.0–27.0) N/A N/S N/A N/A
Sherkole N/S 6.3% N/S 9.4%,
(6.1-13.7%) N/S N/A N/A
AwBarre N/A 14.6% 12.7% N/S N/S N/A N/A
Kebribeyah N/A 13.7% 16.2% N/S N/S N/A N/A
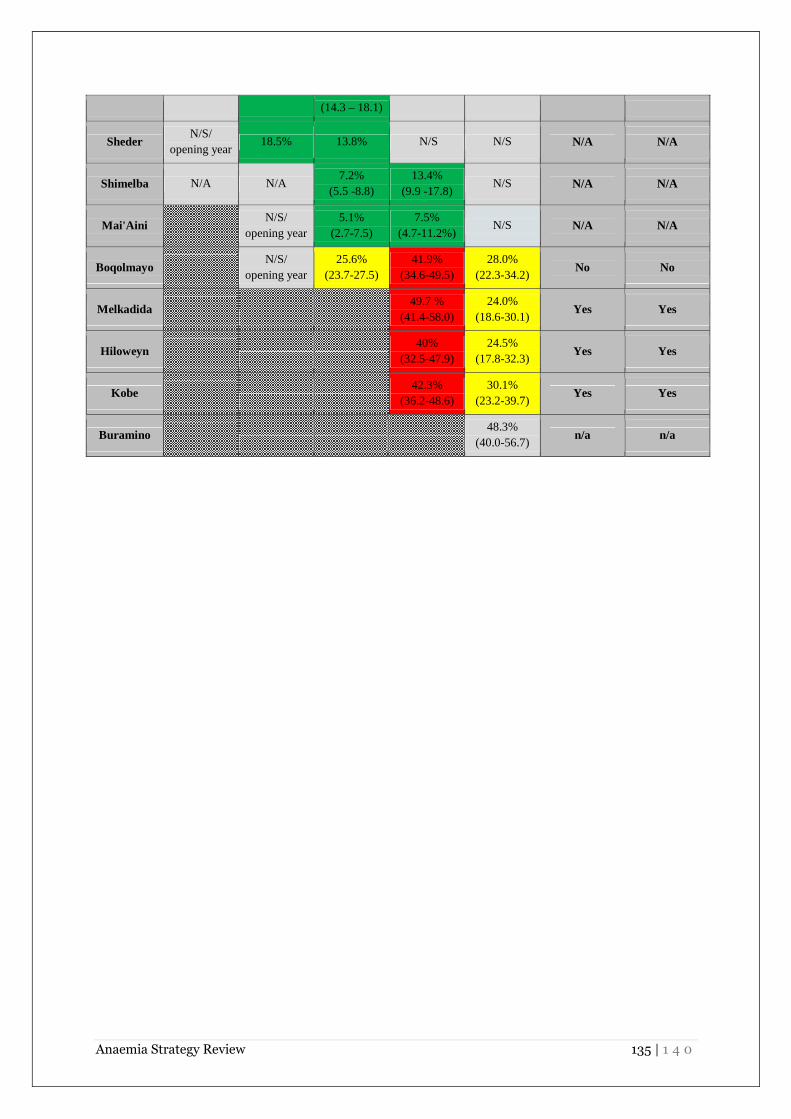
Anaemia Strategy Review 135 | 1 4 0
(14.3 – 18.1)
Sheder N/S/
opening year 18.5% 13.8% N/S N/S N/A N/A
Shimelba N/A N/A 7.2%
(5.5 -8.8) 13.4%
(9.9 -17.8) N/S N/A N/A
Mai'Aini N/S/
opening year 5.1%
(2.7-7.5) 7.5%
(4.7-11.2%) N/S N/A N/A
Boqolmayo N/S/ opening year
25.6% (23.7-27.5)
41.9% (34.6-49.5)
28.0% (22.3-34.2)
No No
Melkadida
49.7 % (41.4-58.0)
24.0% (18.6-30.1)
Yes Yes
Hiloweyn
40% (32.5-47.9)
24.5% (17.8-32.3)
Yes Yes
Kobe
42.3% (36.2-48.6)
30.1% (23.2-39.7)
Yes Yes
Buramino
48.3% (40.0-56.7)
n/a n/a

Anaemia Strategy Review 136 | 1 4 0
CHAPTER 6: ANALYSIS AND INTERPRETATION OF THE
FINDINGS Anaemia:
• Several countries / camps over the course of the strategy have reduced their anaemia prevalence levels from a ‘high’ to ‘medium’ public health problem (Bangladesh, Ali Addeh, Kakuma, Nepal (although in Nepal anaemia increased again in 2012).
• Significant reductions were shown within the first year of the Anaemia Strategy (2008/2009) in only Bangladesh and Shimelba, Ethiopia. Shimelba was running a BSFP of Premix for 6-23 months, and Bangladesh the MNP programme for 6-59 months.
• The results from Bangladesh show an overall decreased in anaemia between baseline and 2012, albeit with a substantial spike in anaemia in 2010. This is thought to be due to adverse beneficiary reactions to MNP being reinstated after a four month product switch to Plumpy’doz™ in 2009. The MNP intervention may be contributing to a reduction in anaemia, although compliance levels are poor. In addition public health activities such as de-worming and vitamin A supplementation also showed considerable improvements. Population based strategies seem to have been less successful in Bangladesh.
• In Nepal, no significant change in anaemia in 6-59 months was shown from 2008 up to 2010, but in 2011 a significant reduction was shown compared to baseline and the previous year’s results. However, the preliminary results from 2012 suggest anaemia has once again risen. The resettlement programme is thought to have had a major effect on services and in addition the demographic / socioeconomic profile of remaining refugees may be influencing results. Interestingly, although an MNP intervention was taking place in Nepal in 2011 when a particular drop in anaemia was noted, the survey also reports a significant increase in the amount of iron rich foods (meat, eggs) consumed compared to the previous nutrition survey of 2010. Compliance is thought to be poor with MNP in Nepal.
• In Yemen, between the second and third year of the strategy, anaemia prevalence decreased significantly, albeit remaining at an extremely high level. The Blanket SFP of Premix for 6-59 months may have contributed, although it had only been in action for a month or so. A complementary tuna fish intervention may have also helped to address anaemia. Interesting explorations into the link between malaria and anaemia have been made in Yemen, which hesitantly suggest malaria to be of lesser influence than might have been expected in this endemic region. Nevertheless, further coordination between the MoH is recommended to improve malaria control activities.
• In Djibouti, Dadaab and Kakuma, a significant difference in anaemia prevalence in 6-59 months was shown that coincided with the Nutributter® BSFP. Small-scale agriculture has been successful in Kakuma and may be improving nutritional outcomes alongside relatively strong public health activities.

Anaemia Strategy Review 137 | 1 4 0
• In Ethiopia, results from the older camps show that anaemia is a ‘medium’ public health concern, lower than in many other countries in this review. A BSFP of Premix and small-scale agriculture in three camps may be controlling anaemia. Anaemia has shown little change in Dollo Ado as yet; CSB++ BSFP has only recently been introduced.
• Data from the 2012 survey in Algeria is currently pending and no conclusions can be drawn until this is released. Preliminary analysis does, however, suggest a reduction in anaemia.
Stunting:
• In Nepal, in the first few years of the Anaemia Strategy (including the MNP intervention), the prevalence of stunting showed a steady decrease, significant from 2007-2010. This is interesting, particularly because age documentation is extremely reliable in Nepal. Additional encouraging evidence comes from Bangladesh, which has shown a decreasing trend in stunting, which is significant between 2008 and 2011 (but not before then). However, stunting is still extremely high here. This is suggestive that MNP, given that it was introduced in both these settings, may have contributed in some way to linear growth, but that these effects need several years to manifest.
• Stunting has shown some reductions in Dadaab, but little change in stunting has been shown in Kakuma, Ali-Addeh or Yemen. In Ethiopia very little nutrition data is available on stunting in the older camps (one time point only for most camps) which is likely to be due to unreliable documentation of age (use of manifests etc). Stunting is still very high in countries such as Djibouti.
GAM:
• In Asia, both Bangladesh and Nepal saw spike in GAM in the first year of the Anaemia Strategy (2008 in Nepal and 2009 in Bangladesh). In Bangladesh levels have continued to be ‘high / critical’ (10%+), whilst in Nepal has stabilised at a ‘medium level’ (5-9%). These high levels of GAM may be reflective of changes to food security or disease prevalence that may in turn have affected anaemia.
• The high prevalence of GAM experienced in the Horn of Africa region during the emergency of 2011 is also important context to these results. In the Dollo Ado region, BSFPs of CSB++ for 6-23 and Premix for 24-59 months may have contributed to considerable reductions in GAM in 6-59 months between 2011 and 2012.
Severity differentiation of anaemia One core objective of this piece was to evaluate the available evidence on the severities of anaemia, considering total <11g/dl vs. total<10g/dl, to understand the impact of the Anaemia Strategy both on total anaemia and more functional forms of anaemia. Key findings:
• The Anaemia Strategy appears to have reduced, in particular, the prevalence of severe
and moderate anaemia amongst children 6-59 months in these refugee settings. Mild

Anaemia Strategy Review 138 | 1 4 0
anaemia has remained relatively stable. This is not to say there is no effect on mild anaemia, as it is likely that those within the ‘severe’ and ‘moderate’ categories are moving into the ‘mild’ bracket, and some within the mild bracket are moving out to normal – hence mild is staying relatively stable.
o This has been suggested, to varying degrees in Yemen, Djibouti, Kenya, and Bangladesh.
o In Djibouti and Kenya, a reduction in moderate and severe anaemia accounts for the majority reduction in overall anaemia prevalence over the course of the strategy – mild anaemia remained relatively unchanged between 20-25%.
o In Bangladesh, when comparing between baseline and 2009 and 2012, we see that despite very similar levels of mild anaemia, total anaemia <11g/dl is now significantly reduced – due entirely to a significant reduction in moderate and severe anaemia. At baseline the composition of anaemia was mild 24%, moderate 23%, severe 2%, and in the first year (2009) the composition changed to mild 20%, moderate 9%, severe 1%.
o In Yemen, in Kharaz camp both moderate and severe anaemia dropped substantially between 2009 and 2010 whilst mild anaemia stayed the same (28%, 26%). In the villages no significant change was shown.
o No data is available for Algeria or Ethiopia to support this argument. In Ethiopia severity was not reported in the older camps.
• It is posited that countries with a higher proportion of severe and moderate anaemia at
baseline are likely to show greater effect than countries with a higher proportion of mild anaemia at baseline.
o The results from Kenya and Djibouti are particularly impressive which may be due in part to the original distribution of anaemia severity at the start of the strategy – that is, severe and moderate anaemia made up of a greater proportion of total anaemia.
o In Kakuma, for example, the proportion of moderate and severe anaemia in 2008 (nearly 8% severe, 50% moderate anaemia and 20% mild) was much higher compared to other settings such as Nepal in 2008 which started with more mild than moderate (0% severe, 19% moderate, 24% mild). If we are adhering to the finding above that severe and moderate anaemia are particularly addressed by anaemia control activities, this may help to explain why the results from Nepal, for example, are less impressive than those from the Horn region.
• Mild anaemia hovers at around 20-30% prevalence in several countries
o In Djibouti, Kakuma and Dadaab, prevalence of mild anaemia is consistent around 20-25%.
o In settings of overall higher anaemia, prevalence tends towards 20-30% (Dollo Ado, Yemen).
o Only at a very few points does any country drop below 18% mild (Nepal 2011, Kutupalong camp 2008, 2009, Kakuma 2008, 2012). Nb. Severity differentiation is not known for Ethiopian older camps.
o Bangladesh supports this to an extent; other than in 2010 when there was a sharp increase in mild anaemia, levels of mild anaemia are consistent around 20-27% across both camps (although always slightly higher in Nayapara than Kutupalong).

Anaemia Strategy Review 139 | 1 4 0
o This level of mild anaemia could represent a physiological baseline for these populations and may be unlikely to drop much lower. Furthermore, we might expect diminishing returns once the proportion of anaemia is composed moreover of mild anaemia. For example, in Bangladesh in 2012, the total anaemia (30%) is made up of 0% severe, 5% moderate, and 25% mild. With severity differentiation such as this, it will be interesting to see whether improvements begin to trail off.
Age categorisation: 6-23 / 24-59 months Another of the objectives of this piece of work was to evaluate the available evidence on anaemia prevalence (total <11g/dl and <10g/dl) and Mean haemoglobin in children aged 6-59 months, 6-23 months and 24-59 months. Key findings: Age categorisation and total anaemia <11g/dl
• The main finding, as expected, is that anaemia prevalence (total <11g/dl) is much higher
and mean haemoglobin much lower in 6-23 months than 24-59 months, in all countries. o This can be interpreted in various ways, however. On the one hand, this may reflect
the natural changes in haemoglobin composition and concentration during growth. On the other hand, it might also reflect the heightened vulnerability that younger children have to anaemia. Iron requirements are the highest between 6-12 months of life. Due to an overall increase in the volume of blood during this time, the concentration of Haemoglobin in the blood is naturally lower.
• Secondly, the 24-59 months age group drops below the 40% threshold into the ‘medium’ public health category in a number of countries, whereas the 6-23 months age group consistently remains above the threshold.
o In Kakuma, Dadaab (Dagahaley and Hagadera), Dollo Ado (Melkadida and Kobe) and Djibouti, the age group 24-59 months have dropped below or are touching the 40% threshold, whilst the 6-23 months group remain considerably above.
o In Nepal, 24-59 months started and remained below the threshold, whilst 6-23 months is always above the threshold.
o In Bangladesh, the 6-23 months group results tend to lie between 40-70%, whereas the 24-59 months group tends to lie below the 40% mark (with a couple of exceptions).
o Therefore, despite some impressive reductions in the 6-23 months age group (for example in Kakuma where prevalence drops from around 80% to 50%) anaemia is still classified as ‘high’. It seems a considerable task for this group to drop within a ‘medium’, let alone a ‘low’ public health problem.
• Thirdly, the analysis suggests, albeit hesitantly, that 24-59 months may be more
susceptible to intervention, showing the most impressive reductions in anaemia prevalence.
o In Djibouti, Dadaab (DAG and HAG) and Bangladesh, reductions in total anaemia in the 6-59 months age group are driven primarily by reductions in the 24-59 months group (although in Bangladesh reductions in the first year are equally significant in both age groups).

Anaemia Strategy Review 140 | 1 4 0
o In Dadaab, whilst the BSFP results for 6-23 months were non-significant overall, results for 24-59 months show a steep reducing trend – particularly between 2009 and 2011 in all three camps, when Nutributter® was introduced.
o In Kakuma, both age groups show similar trends – despite interestingly 6-23 months being the only group to receive a BSFP of Nutributter® / CSB++. This suggests that activities outside of the BSFP are supporting the older age group.
o Trends cannot be shown in either Ethiopia or Yemen due to lack of data. However, the results are suggestive of a more consistent effect in 24-59 months in Dollo Ado and Kharaz camp. In Nepal, no significant change is shown before 2011 in either group. No data is yet available for Algeria to address this question.
Table 51: Anaemia prevalence in 6-23 and 24-59 months in selected camps
Anaemia Prevalence <11g/dl (%)
Country Age group 2008 2009 2010 2011 2012
Bangladesh 6-23 58.1 36.8 63.6 42.4 56.0
24-59 43.2 24.5 43.7 33.3 21.0
Djibouti 6-23 78.6 N/S 59.6 55.6 N/S
24-59 61.1 N/S 35.0 30.3 N/S
Kakuma 6-23 77.9 87.1 80.3 57.3 49.2
24-59 70.8 67.8 66.4 36.5 25.5
Dadaab 6-23 74.6 75.7 72.1 62.8 72.0
24-59 70.9 74.4 58.8 40.3 45.0
• With regards to mean haemoglobin, there is no differential response by age group. o In Bangladesh and Kakuma, more impressive and significant increases in mean
haemoglobin are shown in 24-59 months. In Yemen, results are mixed depending on camp or villages, but the 24-59 months age group in Kharaz camp shows the most striking increase.
o In Nepal, only the 6-23 months age group shows a significant increase. Mean Hb data is lacking from Ethiopia, and no difference is seen between age group in Djibouti.
Key findings: Age categorisation and anaemia <10g/dl
• Prevalence of moderate / severe anaemia, particularly amongst 24-59 months children,
can reach to extremely low levels which suggests current targets are achievable. o Prevalence of anaemia <10g/dl in the 24-59 months group reaches 2.6% in
Bangladesh both camps in 2012, 4.0% in Nepal in 2011 and 10% in Kakuma in 2012. o In Dadaab, Dollo Ado and Yemen, anaemia <10g/dl reduces to less than 40% for 24-
59 months over the period of the Anaemia Strategy, but never below 10%.

Anaemia Strategy Review 141 | 1 4 0
o The results from Bangladesh are extremely interesting in this respect; whilst total anaemia <11g/dl fluctuates considerably, total anaemia <10g/dl reduces in both 6-23 months and 24-59 months and then begins to trail off as prevalence reaches around 10%. The two graphs tell very different stories, suggesting not only diminishing gains when moderate / severe anaemia is low, but also demonstrating the influence that fluctuations in mild anaemia can have over survey results.
Figure 81: Comparison of Anaemia <11g/dl and <10g/dl for age categories, Bangladesh
Total Anaemia in Non Pregnant Women Key findings:
• Overall, analysis of the impact of the Anaemia Strategy on non-pregnant women is encouraging, although data is more sparse than for children.
o It is important to consider how anaemia in non-pregnant women has shifted over the course of the Anaemia Strategy; as this is indicative not of any specific BSFP but due to population based improvements in health services, food security, micronutrient availability and so on.
o Significant reductions in Anaemia have been shown amongst non-pregnant women in Djibouti (2008/2011), Ethiopia Dollo Ado (2011/2012) and in all three Dadaab camps (2010/2011). In Djibouti, anaemia shifted from a ‘high’ to ‘medium’ public health concern. In Dollo Ado, encouragingly in all four camps (Boqolmayo, Melkadida, Hiloweyn and Kobe), anaemia not only dropped below the 40% threshold in one year

Anaemia Strategy Review 142 | 1 4 0
but reduced to between 20-30%, reflecting a much more stable nutrition situation. This is despite ongoing influx and services still in early stages of establishment.
o On the other hand, in Dadaab, despite significant reductions, prevalence in all three camps is still above 40% threshold. In Kakuma a spike in anaemia was reported before returning to levels akin to 2009.
o Data from Asia is lacking. In Bangladesh data was only collected between 2011 and 2012 – no change is shown in this time. In Nepal, data on Anaemia prevalence in non-pregnant women was collected only in 2007 and 2009. No significant change was shown between these years.
• Interestingly, in Ethiopia in the older camps, anaemia prevalence amongst non-pregnant women is remarkably low.
o Anaemia is <20% in nearly all camps (exception Fugnido), although no further reductions are shown were shown over the Anaemia Strategy period. This may be due to population based interventions and greater stability within camps.
• These significant reductions, the variety between ‘low’, ‘medium’, ‘high’ prevalence and crossing of thresholds suggests that targets for non-pregnant women may be more achievable.
o Comparatively, not a single nutrition survey over the course of the Anaemia Strategy, in any country, has reached a ‘low’ level in children 6-59 months – suggesting either that the current targets are too ambitious, or that anaemia in this vulnerable group, despite efforts, has not been adequately addressed.

Anaemia Strategy Review 143 | 1 4 0
CHAPTER 7: DISCUSSION AND CONCLUSIONS This chapter draws together the main conclusions that have emerged from the Anaemia Strategy review. Recommendations for the updated strategy in 2013 are available at the start of the review. The Anaemia Strategy document The Anaemia Strategy was an influential document that brought this condition, previously little discussed, to the centre-stage of nutrition programming in refugee settings. Anaemia now seems to have been mainstreamed in a way that might not have been possible without initial funding and strategy focus. Through raising the profile of anaemia, a spotlight has also been placed on micronutrient deficiencies.
The multi-sectoral approach of the strategy is considered to be correct and important, given the multi-dimensional causes of anaemia. No major changes are recommended to the concepts within the strategy document, but further efforts are needed to better meet the original objectives. Developing integration and consistency between the various UNHCR strategic plans may be one way to ensure original objectives are better met. Within the document, there is opportunity to better align actions and activities, to ensure greater clarity. Figure 82: Proposed positioning of the revised Anaemia Strategy in relation of other Strategic Plans*
*The Strategic Plans are, in turn, informed by the UNHCR Global Strategic Objectives
Prevention of anaemia The Anaemia Strategy has promoted a shift in emphasis towards prevention of Anaemia, through a number of activities such as blanket SFPs and small-scale agriculture projects. At a population level, however, the diversity of food has changed little. a) Increasing the diversity of food and reducing reliance

Anaemia Strategy Review 144 | 1 4 0
Small-scale agriculture activities including MSGs and backyard gardens were introduced in all camps over the course of the strategy, but their success was highly variable and dependent on a number of factors, as illustrated below. Small-scale agriculture projects not only help to diversify the diet but are empowering for refugees. However, these costly initiatives need careful consideration and planning, to determine their suitability to the setting and ensure sufficient support is in place. Table 52: Factors affecting success of small-scale agriculture projects in camps
Local / environmental / cultural Logistical / managerial
• Water availability (Horn region, esp. Ethiopia) • Lack of space (esp. Bangladesh) • Poor soil quality / suitability • Seeds not adapted to cultural tastes (Djibouti) • Unable to procure good quality, unexpired seeds
(Ethiopia) • Lack of agricultural knowledge or enthusiasm
amongst urban or Pastoralist communities (Somali primarily)
• Lack of knowledge sharing between refugees (Algeria)
• Lack of support and capacity, limited staff to manage (esp. Algeria)
• Lack of availability or resources for tools, seeds and soil (Algeria, Kakuma)
• Inconsistent or unreliable funding prohibited the necessary regular replenishment of the gardens
• Costly and labour intensive transport of materials to remote camps / block level (Dadaab)
• Lack of communication between IPs (Dadaab)
Unfortunately, animal husbandry seems to have been less successful than small-scale agriculture projects. Again, lack of veterinary support, feed, and shelter have all been implicated as limiting factors that could be better addressed through more intensive support. b) Increasing the micronutrient content of food
The proposal of 2008 was framed as a ‘transitional proposal’ until such a time that all micronutrients can be provided through a more diversified diet. Unfortunately, this has not been realised to any significant degree. Despite responsibilities outlined under the MoU for UNHCR to provide complementary foods, these do not seem to have regularly provided due to major challenges in delivery. In addition, despite fortified blended foods (CSB+) having been introduced in most of the general food rations in this review (exception Yemen), the micronutrient content of these food rations is often lacking iron, vitamin A and vitamin B12, amongst others. The inadequate availability of iron is described in the table below. This is likely to be contributing to long-term depletion of iron and micronutrient stores. Table 53: Iron requirements provided in the general ration - analysis by NutVal across countries
Bangladesh Nepal Algeria Yemen Djibouti Dadaab / Kenya
Iron requirements provided by ration (%)
60% 58% 63% 52% 65% 79%

Anaemia Strategy Review 145 | 1 4 0
Greater responsibility needs to be taken by WFP, with support from UNHCR, to ensure that these micronutrient requirements are met. Opportunities and options for fortification of the general ration staples grain needs to be explored and developed as part of a sustainable and cost-effective approach to controlling micronutrient malnutrition. The recent interest expressed by GAIN in being involved in initiatives in this area is encouraging.
Moving forward, a number of key informants requested that voucher programmes be trialled or introduced on a more permanent basis and these may be a valuable approach in certain settings. Livelihood activities have not been explored in any detail in this review, being more aligned to the UNHCR ‘Nutrition and Food Security Strategic Plan’. In some countries such as Bangladesh, livelihood activities are clearly difficult to introduce in camps due to political sensitivities, in others there may be greater opportunity.
c) Blanket SFP – special nutritional products Micronutrient powder Over the course of the strategy five countries (Bangladesh, Nepal, Kakuma, Algeria and Yemen) introduced MNP interventions. Tentative suggestions as to the value of MNP can start to be made, although clearly a number of factors are collectively influencing anaemia prevalence. The John Hopkins / KLMRI study from Kakuma showed MNP to be unsuccessful84, but due to a wide range of programmatic challenges that have largely been addressed through the Operational Guidance manual. Results from Nepal are mixed, showing no significant effect on anaemia in the first three years of the intervention, but a significant effect on stunting. Results from Bangladesh are problematic due to a period of product switch in the middle of the MNP intervention, but did show an encouraging reduction in the first year of the programme and since 2010, as well as a substantial and continued reduction in moderate and severe anaemia since 2008. No results are available yet from Algeria and Yemen. Lack of adherence is clearly a major obstacle to MNP programme delivery. Considerable investment is needed to deliver MNP programmes with the necessary IEC and monitoring. Although initial acceptability tests were encouraging, long term adherence is not demonstrated. Data from Nepal shows that changes in food taste and colour may occur when MNP is added to food and may discourage adherence. In addition, MNP does not align with certain cultural feeding practises. Therefore, although the efficacy of MNP has been demonstrated on moderate anaemia in children 6-24 months in published RCTs / meta-analysis85, 86, reliable evidence of the effectiveness of MNP in refugee contexts is still lacking. Lipid Nutrient Supplement Blanket SFPs using LNS (Nutributter®) have been introduced in Kenya and Djibouti with encouraging results for anaemia. The impact of LNS in Algeria has yet to be analysed. LNS has
84 Ndemwa P, Klotz C, Mwaniki D, Sun K, Muniu E, Andango P, Owigar J, Rah J, Kraemer K, Spiegel P, Bloem M, De Pee S, Semba R (2011) Relationship of the availability of micronutrient powder with iron status and hemoglobin among women and children in the Kakuma Refugee Camp, Kenya. Food and Nutrition Bulletin . Vol 32 (3) pp286-292 85 Zlotkin SH, Schauer C, Christofi des A, Sharieff W, Tondeur MC, et al. (2005) Micronutrient Sprinkles to control childhood anaemia. PLoS Med Vol 2(1): e1. doi:10.1371/journal.pmed.0020001 86 Dewey K, Yang Z, Boy E (2007) Systematic review and meta-analysis of home fortification of complementary foods. Matern Child Nutr . Vol 5 pp283–321

Anaemia Strategy Review 146 | 1 4 0
shown effectiveness in reducing anaemia and stunting in previous trials in Algeria with High Nutrient Density Spread87 ,88. For Nutributter® details see complementary report by S.Style, UCL / ENN. In terms of programme management, one aspect that requires further exploration is the usage of LNS. Consumption of LNS by individuals outside of the target audience has been little documented in any systematic way, but anecdotal accounts of this are numerous. The photograph below shows an example.
Figure 83: Older Child consuming Nutributter® sachet in refugee camp in Djibouti
Source: Ismail Arte Rage – Refugee camp in Djibouti
CSB++ The third blanket product intervention that has been implemented is CSB++ in the Dollo Ado camps of Ethiopia, Kakuma and Dadaab. Being a relatively new product, there is less effectiveness data for CSB++ than, for example, Nutributter®. In all countries, CSB++ seems to be contributing to the maintenance or further reduction of anaemia. The issue of sharing needs to be further investigated. Dependence and sustainability of special products The Operational Guidance initiative has been an important and necessary endeavour that showed leadership on the use of these products, where previously, knowledge and guidance was minimal. Dependency on these products is one issue that perhaps needs to be considered more closely. Unfortunately, it may be difficult to avoid dependency on special products in situations of poor food availability and where products are introduced that are well liked by children e.g. Nutributter®. Violent reactions to product switches such as have been shown in Bangladesh suggest that dependency can be quick to foster. Activities such as IEC need always to be put in place to ensure refugees are made aware of any changes to programmes, and to support those transitioning into and out of programmes. 87 Lopriore C, Guidoum Y, Briend A, and Branca F (2004) Spread fortified with vitamins and minerals induces catch-up growth and eradicates severe anemia in stunted refugee children aged 3–6 . Am J Clin Nutr. Vol 80(2) pp973– 81 88 Lopriore C and Branca F (1999) Strategies to fight anaemia and growth retardation in Saharawi Refugee Children. Istituto Nazionale di Ricerca per gli Alimenti e la Nutrizione

Anaemia Strategy Review 147 | 1 4 0
Public Health activities A core objective of the Anaemia Strategy was to control disease in camps through reinforcing Public Health activities. At HQ level, there is opportunity for greater involvement of the Public Health and WASH sectors in delivering these goals. Nevertheless, the Malaria Strategy implemented in parallel to the Anaemia Strategy may have helped to improve anaemia without being directly related to it. The joint Malaria and Anaemia survey in Yemen is a good example of an integrative approach, born out of the Anaemia Strategy, to develop understanding on the relationship between these two conditions. At country level, public health activities such as de-worming and malaria control activities seem to be well established in most camps in the review. Bangladesh has shown particular advancements in addressing intestinal worms, but de-worming is a major gap that needs to be addressed in Djibouti, Dadaab and Ethiopia, particularly Dollo Ado where IPs are new and fully functioning systems are not yet in place. With respect to malaria, Bangladesh and Nepal have initiated activities and show low prevalence in their camps. More up to date information is needed in Yemen, where LLIN coverage was extremely low in 2009. In hyper-endemic Kakuma it will be important to ensure planned activities are implemented, for example ensuring IRS takes place each year. In Djibouti and the Eritrean camps of Ethiopia, malaria control needs to be more up-scaled, although the gender demographic in the Eritrean camps may mean women have more opportunity to benefit from activities such as bed-net provision. Limitations are placed on the extent to which de-worming and malaria control improvements can be made in countries such as Yemen and Algeria where government bodies take responsibility for such activities.
Excellent advances have been made on tea drinking in Nepal further to BCC / IEC (62.2% of 24-59 months had consumed tea the previous 24 hours in 2007, reducing down to only 8.3% in 2010). Such initiatives should be adapted for Yemen, Dadaab and Djibouti where tea drinking amongst children remains high. Detection and management Although not the focus of this review, it seems that little information has been collated on the objectives of improving diagnosis, screening and management, particularly routine testing of pregnant women in ANC. Key informant accounts suggest routine testing is happening in camps such as Kakuma. The HemoCue™ can greatly facilitate this but has yet to reach full coverage. ANC screening and management, including iron supplementation, will be important to re-emphasise in the upcoming strategy. Monitoring and evaluation It is vital that monitoring and evaluation is re-addressed in the revised Anaemia Strategy. Throughout the period of the strategy, M&E for programmes was relatively poor or inaccessible. Recommendations within the OG may not be feasible in most refugee settings; clarification on fewer core monitoring aspects is advised. Although there are limitations with the nutrition survey data collated during the Anaemia Strategy period, surveys are already thought to be showing improvements in quality and consistency with the investment placed in SENS. A major gap in knowledge exists with respect to anaemia monitoring in pregnancy, which cannot be collated through

Anaemia Strategy Review 148 | 1 4 0
nutrition surveys. Strengthening measurement systems such as routine data collection in ANC will be important, and is recommended as a new focus for the strategy 2013.
Additional objectives Capacity within UNHCR and its partner organisations has been strengthened through Anaemia Strategy funding. In total 5 national consultants have been recruited, 51 individuals have been trained on SENS and 35 trained on the Operational Guidance for Use of Special Nutritional Products (OG). Various other HQ objectives have also been addressed in full or in part. The MoU was prioritised and has been finalised. Funding proposals were written and partnership opportunities advanced on an ad-hoc basis. Tracking of budget expenditure and costs could be significantly improved. At country level, funding mechanisms and timelines were raised in a minority of countries as a source of anxiety. Trend analysis The Anaemia Strategy has enabled significant improvements to be made with respect to anaemia prevalence and mean haemoglobin levels in refugee children and in non-pregnant women in the majority of the countries within this review. In particular, moderate and severe anaemia have been significantly reduced across several countries, which is an extremely welcome finding. Trend analysis of 6-23 months and 24-59 months clearly shows the differentiation between the groups in terms of their mean Haemoglobin levels and /or susceptibility to anaemia. This prompts the questions of how best to approach this data when conducting and analysing nutrition surveys that group these age categories together. Recommendations for addressing this are given in Chapter 2. The fact that no country, despite implementation of various Anaemia Strategy activities, has achieved a ‘low’ level of anaemia in children is disappointing, and poorly reflects some of the real achievements that have been made. One important consideration, however, is whether thresholds for a ‘low’ public health concern amongst this 6-59 months group require re-evaluation. This point deserves consideration, particularly given two key factors. Firstly, whilst severe and moderate anaemia seem able to reach very low levels (e.g. 5% as in Bangladesh), mild anaemia has remained at a consistent level throughout the strategy period at around 20-30% in most countries. It is possible that this represents a natural physiological level for this age group. Secondly, ‘anaemia’ in ages 6-23 months is consistently above the 40% threshold for a ‘severe’ public health problem in all countries – yet this is known to be at least in part due to natural fluctuations in haemoglobin concentration during this time. Whilst current targets for 6-59 months may be appropriate for ages 24-59 months, it is possible they are unrealistic, and indeed inappropriate for the younger age group – and therefore risk biasing results. No conclusions can be made on this issue as yet, but it is an important consideration that requires further investigation in other settings both within refugee and host communities.

Anaemia Strategy Review 149 | 1 4 0
APPENDIX
Summary of country interventions and activities relevant to the
anaemia strategy
Table 54: Overview of Nutritional Activities and Interventions per country between 2008 and 2012
Country FBF included in GFD food
ration
TSFP and TFP in place
BSFP MNP intervention
BSFP LNS intervention
BSFP CSB++
Other BSFP
Small-scale agriculture /
animal husbandry
Bangladesh Yes Yes Yes: 6-59m, 12-
17 yrs, PLW Yes: 6-35 for brief period
No No Yes
Nepal Yes Yes Yes: 6-59m No No No Yes
Algeria Yes Yes Yes: 36-59m,
PLW
Yes: 6-35m (and 36-59
before) No No Yes
Yemen No Problems for Kharaz
Yes: 6-59m No No Premix with WSB: 6-36m
Yes
Ethiopia Yes Yes No No Yes: Dollo Ado, 6-23
months
Yes: older camps
Premix / CSB+: 6-23
months
Yes: 3 camps
Kenya Yes Yes
Kakuma: Trial of MNP to
general population of
camp
Yes: Nutributter® 6-
23, 12-35
Dadaab: Yes: 6-59m
Kakuma: Tinned fish
6-24m Yes
Djibouti Yes YES @No Yes:
Nutributter® 6-36m
No No Yes
Table 55: Overview of Malarial and Intestinal Parasitic Activities per country
Country De-worming programmes in place Malaria activities in place
Bangladesh Yes: 6m+, school children, pregnant women Yes: Bed nets
Yes: Vector control
Nepal Yes: Bi-annually Yes: Including fogging before seasonal
outbreak
Algeria Partial due to Ministry of Health limitations No: But low transmission area
Yemen Sporadic, but low incidence Partial: Through Ministry of Health

Anaemia Strategy Review 150 | 1 4 0
Ethiopia Yes except for Dollo Ado Partial: Major activity in Mai-Aini and
Shimelba
Djibouti Yes: in 6-59 months but no information on
coverage and increasing incidence Yes: Bed nets
No: Vector control activities
Kenya: Dadaab
Yes: Bi-annually Yes: Indoor residual spraying (IRS), 2x per year
before rains, April and September
Kenya: Kakuma
Yes: Bi-annually Yes: IRS annually, draining of pools, bacticide application on pools of water. No IRS in 2012
Overview of special nutritional products
Table 56: Special products overview
Product Examples Nutritional content Description
Micronutrient powder (MNP) / sprinkles
MixMe™ Micronutrients only Individual sachet to be
added to food after cooking
Low quantity Lipid nutrient supplement
(LNS) Nutributter®
Energy (macronutrients) and micronutrients
Fortified peanut based paste in an individual
sachet
Medium quantity LNS Plumpy’doz™ Energy (macronutrients)
and micronutrients Fortified peanut based paste in weekly pots
Fortified blended food (FBF) and FBF+
Famix, Corn Soy Blend (CSB), CSB+, SuperCereal89
Energy (macronutrients) and micronutrients
For general population as well as vulnerable groups; Improved versions with
new micronutrient formulations
FBF++ CSB++, SuperCereal + Energy (macronutrients)
and micronutrients
FBF with milk powder and lipids for young
children
89 SuperCereal is the name used to describe what was previously known as CSB+. As such, SuperCereal ++ describes CSB+. The products have exactly the same specifications
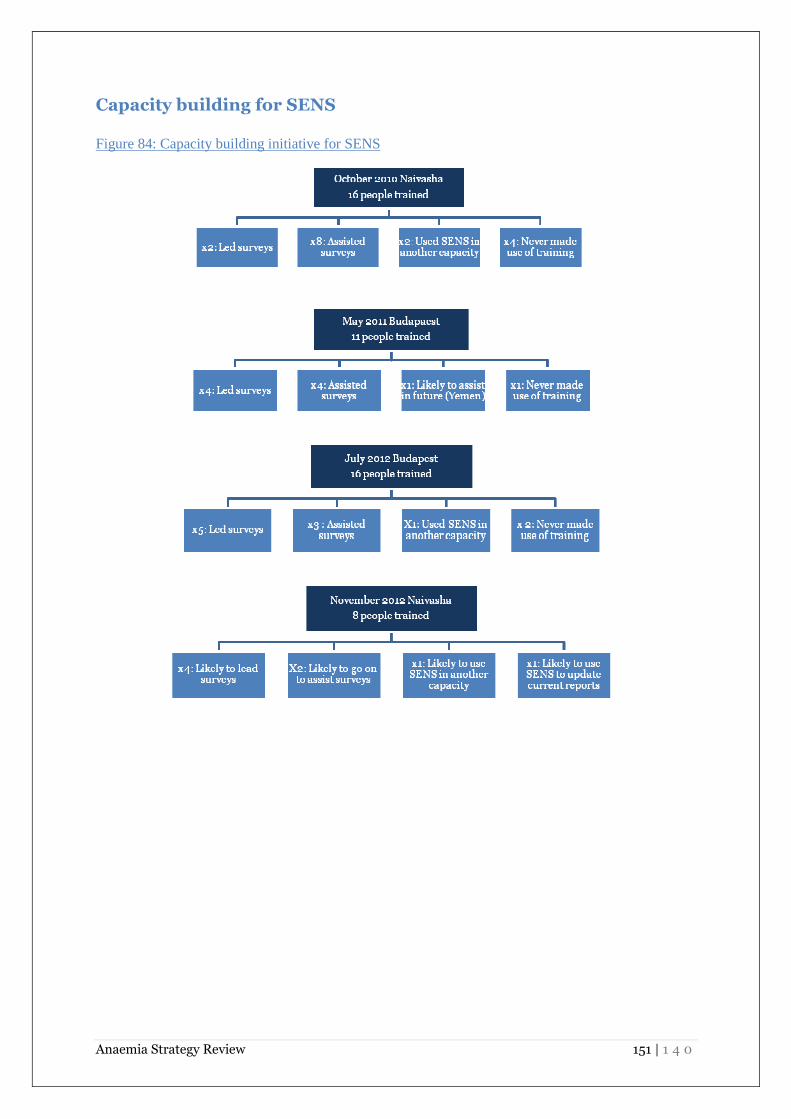
Anaemia Strategy Review 151 | 1 4 0
Capacity building for SENS
Figure 84: Capacity building initiative for SENS