Embed Size (px)
Citation preview

Total Maximum Daily Loads of Trash for the Anacostia River
Watershed, Montgomery and Prince George’s Counties, Maryland and the District of Columbia
FINAL
DEPARTMENT OF THE ENVIRONMENT
1800 Washington Boulevard, Suite 540 Baltimore, MD 21230-1718
and
District of Columbia Department of the Environment -
Natural Resources Administration
Submitted to:
U.S. Environmental Protection Agency, Region 3 Water Protection Division
1650 Arch Street Philadelphia, PA 19103-2029
August 2010
EPA Submittal Date: September 8, 2010 EPA Approval Date: September 21, 2010


August 2010 Final Anacostia River Watershed Trash TMDLs
iii
Acknowledgements This document is an inter-jurisdictional TMDL submitted by Maryland and the District of Columbia. It addresses trash impairments in the Anacostia River. The document was prepared by Tetra Tech, Inc., in cooperation with the Anacostia River Watershed Trash TMDL Work Group that includes representatives from the following organizations:
Alice Ferguson Foundation Anacostia Riverkeeper Anacostia Watershed Society District of Columbia Department of the Environment Maryland Department of the Environment Metropolitan Washington Council of Governments Montgomery County Department of Environmental Protection Natural Resources Defense Council Prince Georges County Department of Environmental Resources U.S. Environmental Protection Agency
The technical support of Tetra Tech, Inc. staff members Aileen Molloy and Teresa Rafi, who drafted the report, is gratefully acknowledged. Completion of this study depended on generous informational and data support from various groups. Special acknowledgment is made to the following:
Monir Chowdhury, District of Columbia Department of the Environment
Rich Eskin, Maryland Department of the Environment
Anna Kasko, Maryland Department of the Environment
Greg Voigt, U.S. Environmental Protection Agency Region 3
Dr. Mow Soung Cheng, Prince George’s County
James Collier, Anacostia Watershed Society
James Connolly, Anacostia Watershed Society
Meo Curtis, Montgomery County Department of Environmental Protection
Phong Trieu, Metropolitan Washington Council of Governments

Final Anacostia River Watershed Trash TMDLs August 2010
iv
Contents 1. Introduction and Background ..................................................................................................... 1
1.1. Watershed Description ................................................................................................................ 1 1.1.1. Location ..................................................................................................................................1 1.1.2. Population ...............................................................................................................................2 1.1.3. Topography.............................................................................................................................2 1.1.4. Land Use.................................................................................................................................2 1.1.5. Climate....................................................................................................................................2 1.1.6. Geology and Soils...................................................................................................................2 1.1.7. Hydrology ...............................................................................................................................5
1.2. Previous and Existing Studies ..................................................................................................... 5 1.3. Impaired Waterbodies ................................................................................................................. 8 1.4. Water Quality Criteria................................................................................................................. 8
1.4.1. District of Columbia Standards and Designated Uses ............................................................8 1.4.2. Maryland Standards and Designated Uses............................................................................10
1.5. TMDL Target ............................................................................................................................ 11 2. Data Inventory and Analysis .................................................................................................... 12
2.1. Data Inventory........................................................................................................................... 12 2.1.1. Hydrology .............................................................................................................................12 2.1.2. Weather.................................................................................................................................12 2.1.3. Land Use Data ......................................................................................................................12
2.2. Data Analysis ............................................................................................................................ 13 2.2.1. District of Columbia Stormwater Outfall Monitoring ..........................................................13 2.2.2. Montgomery and Prince George’s County Stormwater Outfall Monitoring ........................16 2.2.3. District of Columbia In-Stream Monitoring .........................................................................20 2.2.4. Montgomery and Prince George’s County In-Stream Monitoring .......................................24
3. Source Assessment ................................................................................................................... 27 3.1. Point Sources............................................................................................................................. 27 3.2. Nonpoint Sources ...................................................................................................................... 28
4. Baseline Load Methodology..................................................................................................... 29 4.1. Development of Loading Rates and Baseline Loads................................................................. 29
4.1.1. District of Columbia Point Source Loading Rate .................................................................29 4.1.2. District of Columbia CSO Loading Rate ..............................................................................30 4.1.3. District of Columbia Nonpoint Source Loading Rate...........................................................31 4.1.4. Montgomery and Prince George’s Counties Point Source Loading Rates ...........................32 4.1.5. Montgomery and Prince George’s County Nonpoint Source Loading Rates .......................36
5. Total Maximum Daily Load ..................................................................................................... 39 5.1. TMDL Endpoints ...................................................................................................................... 39 5.2. Detailed Source Allocations...................................................................................................... 39
5.2.1. Load Allocations...................................................................................................................39 5.2.2. Wasteload Allocations ..........................................................................................................40 5.2.3. Margin of Safety ...................................................................................................................44
5.3. Anacostia Watershed Trash TMDL Summary.......................................................................... 44 5.4. Critical Conditions and Seasonal Variations............................................................................. 46
6. Reasonable Assurance for TMDL Implementation .................................................................. 47 6.1. Anacostia Watershed Trash Reduction Strategy ....................................................................... 47
6.1.1. Efforts underway in Montgomery County, Maryland ..........................................................48 6.1.2. Efforts underway in Prince George’s County.......................................................................48
6.2. Potomac River Watershed Trash Treaty ................................................................................... 49 6.3. District of Columbia Anacostia Watershed Trash Reduction Plan ........................................... 49
6.3.1. Efforts Underway in the District of Columbia......................................................................49 6.3.2. Subwatershed Action Plans ..................................................................................................50

August 2010 Final Anacostia River Watershed Trash TMDLs
v
6.4. Permit Compliance.................................................................................................................... 50 6.4.1. Prince George’s County MS4 NPDES Permit......................................................................50 6.4.2. Montgomery County MS4 NPDES Permit...........................................................................51 6.4.3. District of Columbia MS4 NPDES Permit ...........................................................................52 6.4.4. District of Columbia Combined Sewer System (CSS) NPDES Permit ................................52 6.4.5. District of Columbia Long Term Control Plan .....................................................................54
6.5. Summary of Potential BMPs that Could be Implemented to Achieve the TMDL Target of 100 Percent Removal of the Baseline Trash Load.................................................................... 54
7. Public Participation................................................................................................................... 56 8. References ................................................................................................................................ 57 Tables Table 1. District of Columbia designated uses ........................................................................................9 Table 2. Segment-specific designated uses in the District’s portion of the watershed............................9 Table 3. Maryland designated uses........................................................................................................10 Table 4. Segment-specific designated uses in the Maryland portion of Anacostia watershed ..............10 Table 5. Ounces of trash/acre at District stormwater outfall drainages.................................................15 Table 6. Ounces of trash/acre at Maryland stormwater outfall drainages .............................................16 Table 7. Categories of trash and debris used during in-stream monitoring in the District ....................20 Table 8. District of Columbia nonpoint source average annual trash counts (number of items)...........22 Table 9. Summary of Maryland average annual trash counts per sampling site ...................................26 Table 10. NPDES permits in the Anacostia River watershed................................................................27 Table 11. Rainfall amounts for each trash collection period, totaled by sampling date ........................29 Table 12. Point source baseline loading rates for the District MS4 ......................................................30 Table 13. Nonpoint source trash baseline loading rates for the Anacostia River mainstem, Kingman
Lake, and tributaries within the District ........................................................................................31 Table 14. Rainfall amounts for each trash collection period totaled by sampling date .........................33 Table 15. Summary of rainfall used to calculate the total rainfall for the June 22, 2009, sampling event
.......................................................................................................................................................33 Table 16 Loading rates for the trash traps and trash nets ......................................................................34 Table 17. Sample site drainage area land use distribution (percentage)................................................34 Table 18. Montgomery County land use baseline loading rates and total annual baseline load ...........35 Table 19. Prince George’s County land use baseline loading rates and total annual load ....................36 Table 20. Trash types considered part of the nonpoint source base load ..............................................36 Table 21. County-wide annual trash counts, weights, and total county load by trash type...................38 Table 22. Summary of Annual and Daily Load allocations ..................................................................40 Table 23. Summary of Annual and Daily Waste Load Allocations ......................................................42 Table 24. Daily trash TMDLs for Montgomery County portion of the Anacostia watershed...............44 Table 25. Annual trash TMDLs for Montgomery County portion of the Anacostia watershed............44 Table 26. Daily trash TMDLs for Prince George’s County portion of the Anacostia watershed..........45 Table 27. Annual trash TMDLs for Prince George’s County portion of the Anacostia watershed.......45 Table 29. Annual trash TMDL for the District’s upper portion of the Anacostia watershed ................45 Table 30. Daily trash TMDL for the District’s lower portion of the Anacostia watershed...................45 Table 31. Annual trash TMDL for the District’s lower portion of the Anacostia watershed ................46 Figures Figure 1. Location of the Anacostia River watershed. ............................................................................3 Figure 2. Subwatersheds in the Anacostia River watershed....................................................................4 Figure 3. Storm drain sampling site locations in the District. ...............................................................14 Figure 4. Locations of the storm drain sampling sites in Maryland. .....................................................18 Figure 5. Detailed location of the smaller storm drain sampling sites in Maryland..............................19

Final Anacostia River Watershed Trash TMDLs August 2010
vi
Figure 6. Location of the stream sampling sites used to establish the nonpoint source loading rates in the District. ....................................................................................................................................21
Figure 7. Locations of the stream sampling sites in Montgomery and Prince George’s Counties. .......25

August 2010 Final Anacostia River Watershed Trash TMDLs
vii
Acronyms and Abbreviations AWRP Anacostia Watershed Restoration Partnership BARC Beltsville Agricultural Research Center BMP best management practice
BOD biochemical oxygen demand
CFR Code of Federal Regulations COMAR Code of Maryland Regulations
CSO combined sewer overflow
CSS combined sewer system
CWA Clean Water Act DC District of Columbia
DC-WASA District of Columbia Water and Sewer Authority
DDOE District (of Columbia) Department of the Environment
DNR Maryland Department of Natural Resources
DPW (District of Columbia) Department of Public Works
DPWT (Montgomery County) Department of Public Works and Transportation
EPA U.S. Environmental Protection Agency
LA load allocation lbs/day pounds per day lbs/yr pounds per year LTCP long-term control plan
MCDEP Montgomery County Department of Environmental Protection MD Maryland
MDE Maryland Department of the Environment
M-NCPPC Maryland–National Capital Park and Planning Commission MOS margin of safety MS4 municipal separate storm sewer system
MWCOG Metropolitan Washington Council of Governments NHD National Hydrography Dataset NPDES National Pollutant Discharge Elimination System
NPS National Park Service
PCBs polychlorinated biphenyls STATSGO State Soil Geographic Database SWMP stormwater management plan
TMDL total maximum daily load TSS total suspended solids USDA U.S. Department of Agriculture WLA wasteload allocation

Final Anacostia River Watershed Trash TMDLs August 2010
viii
Executive Summary Section 303(d) of the Clean Water Act and the U.S. Environmental Protection Agency’s (EPA’s) Water Quality Planning and Management Regulations (codified at Title 40 of the Code of Federal Regulations [CFR] Part 130) require states to develop Total Maximum Daily Loads (TMDLs) for impaired waterbodies. A TMDL establishes the amount of a pollutant that a waterbody can assimilate without exceeding its water quality standard for that pollutant. TMDLs provide the scientific basis for a state to establish water quality-based controls to reduce pollution from both point and nonpoint sources to restore and maintain the quality of the state’s water resources (USEPA 1991). A TMDL for a given pollutant and waterbody is composed of the sum of individual wasteload allocations (WLAs) for point sources and load allocations (LAs) for nonpoint sources and natural background conditions. In addition, the TMDL must include an implicit or explicit margin of safety (MOS) to account for any uncertainty in the relationship between pollutant loads and the quality of the receiving waterbody. The TMDL components are illustrated using the following equation:
TMDL = WLAs + LAs + MOS In the District of Columbia (the District), the Anacostia River and its tributaries have been variously designated as Class A, B, C, D and E waters (District of Columbia Municipal Regulations 21.11.1101.1). According to the District’s 2006 and 2008 Water Quality Assessment (305(b) and 303(d)) Integrated Reports, the Upper Anacostia River (DCANA00E) and Lower Anacostia River (DCANA00E) are impaired by trash (District of Columbia, Department of Health 2006 and District of Columbia, Department of the Environment 2008). The District divides the portion of the Anacostia River watershed within its boundaries into two segments. The Lower Anacostia is the portion of the river extending from the mouth of the river to the John Philip Sousa Bridge and Pennsylvania Avenue. The Upper Anacostia is the portion from the bridge to the Maryland border. The upper and lower segments of the Anacostia were listed on DC’s 1998 Section 303(d) List as impaired by biochemical oxygen demand (BOD), bacteria, organics, metals, total suspended solids (TSS), and oil and grease. DC developed these TMDLs between 2002 and 2008 to address all these impairments in its portion of the Anacostia. In Maryland, both the tidal (MD-ANATF) and non-tidal (MD-02140205) sections of the Anacostia River are listed on Maryland’s 2008 Integrated Report as impaired by trash and debris. The Maryland Department of the Environment (MDE) has also identified the non-tidal Anacostia on the State's Integrated Report as impaired by the following (listing years in parentheses): nutrients (1996); sediments (1996); fecal bacteria (2002); impacts to biological communities— non-tidal waters (2002); toxics: polychlorinated biphenyls (PCBs) and heptachlor epoxide—non-tidal waters (2002); and PCBs in fish tissue in tidal waters (2006). Fecal bacteria TMDLs for MD tidal and non-tidal areas of the Anacostia were submitted in 2006 and subsequently approved by EPA. MD’s sediment and tidal PCBs listings were submitted in 2007 and subsequently approved by EPA. Inter-jurisdictional TMDLs addressing sediment/TSS and nutrients/BOD within both Maryland and District portions of the watershed were established in 2007 and 2008, respectively. The Anacostia River is an interstate watershed; most of the non-tidal tributaries lie within Maryland, and most of the tidal waters are within the District. This trash TMDL was developed through a cooperative agreement between EPA Region 3, the District’s Department of the Environment (DDOE) and the Maryland Department of the Environment (MDE). Upon approval by EPA, this document establishes TMDLs for trash in the tidal and non-tidal portions of the Anacostia River watershed in both Maryland and the District that will allow for the attainment of their respective designated uses.

August 2010 Final Anacostia River Watershed Trash TMDLs
ix
No numerical water quality criteria exist for trash. The TMDL target is equal to 100 percent removal or capture of the baseline load calculated as an average (because of high seasonal and annual variability) of the measured or estimated removal rate from point and nonpoint sources. The baseline load is defined as the annual trash load calculated from monitoring data obtained through storm drain and CSO monitoring and in-stream sampling. The baseline load represents a typical annual load. The TMDL target is calculated to satisfy the narrative water quality standards for trash in Maryland and the District. In-stream monitoring for trash was used to establish the nonpoint source baseline load, and stormwater outfall monitoring was used to establish the point source baseline load. Tables E1–E8 below summarize the baseline trash loads in the Anacostia River watershed. Compliance with these TMDLs will require the removal of 100 percent of the daily baseline trash load. These TMDLs were developed to meet the narrative District and Maryland water quality standards in their respective waters of the Anacostia River. It is important to note that, unlike most TMDLs, which are expressed in terms of the loads of a pollutant that may be added to a waterbody, these trash TMDLs are expressed in the negative, i.e., in terms of quantities of trash that must be removed or prevented from entering the waterbody. See Section 1.5. Table E1. Daily trash TMDLs for Montgomery County portion of the Anacostia watershed
WLA (lbs/day removed)
LA (lbs/day removed)
MOS (5%)
TMDL (lbs/day
removed) Montgomery County Phase I MS4 626.5
Montgomery County Phase II Municipal MS4 - Takoma Park
14.1
Montgomery County State Highway Administration 15.8
Montgomery County Federal Facilities 4.5
Montgomery County Other Point Sources 5.6
Total WLA 666.5
180.7 42.4 889.5
Note: lbs = pounds; MS4 = municipal separate storm sewer system
Table E2. Annual trash TMDLs for Montgomery County portion of the Anacostia watershed
WLA (lbs/yr removed)
LA (lbs/yr removed)
MOS (5%)
TMDL (lbs/yr removed)
Montgomery County Phase I MS4 228,683
Montgomery County Phase II Municipal MS4 - Takoma Park
5,129
Montgomery County State Highway Administration 5,756
Montgomery County Federal Facilities 1,657
Montgomery County Other Point Sources 2,031 Total WLA 243,256
65,945 15,460 324,660
Table E3. Daily trash TMDLs for Prince George’s County portion of the Anacostia watershed
WLA (lbs/day removed)
LA (lbs/day
removed) MOS (5%)
TMDL (lbs/day
removed)
Prince George’s County Phase I MS4 Non-tidal 436.4
Prince George’s County Phase I MS4 Tidal 31.1
Prince George’s County Phase II Municipal MS4s 311.2
Prince George’s County Federal Facilities 16.1
Prince George’s County State Highway Administration 36.9
Prince George’s County Other Point Sources 28.8 Total WLA 860.5
953.3 90.7 1904.4

Final Anacostia River Watershed Trash TMDLs August 2010
x
Table E4. Annual trash TMDLs for Prince George’s County portion of the Anacostia watershed
WLA (lbs/yr removed)
LA (lbs/yr
removed) MOS (5%)
TMDL (lbs/yr
removed)
Prince George’s County Phase I MS4 Non-tidal 159,293
Prince George’s County Phase I MS4 Tidal 11,335
Prince George’s County Phase II Municipal MS4s 113,578
Prince George’s County Federal Facilities 5,890
Prince George’s County State Highway Administration 13,461
Prince George’s County Other Point Sources 10,498 Total WLA 314,055
347,958 33,101 695,114
Table E5. Daily trash TMDLs for District of Columbia upper portion of the Anacostia watershed
WLA (lbs/day removed)
LA (lbs/day
removed) MOS (5%)
TMDL (lbs/day
removed) DC Upper Anacostia MS4 218.8
DC Upper Anacostia CSO 171.0
DC Upper Anacostia Other Point Sources 21.6 Total WLA 411.4
50.3 23.1 484.7
Note: CSO = combined sewer overflow
Table E6. Annual trash TMDLs for District of Columbia upper portion of the Anacostia watershed
WLA (lbs/yr removed)
LA (lbs/yr removed)
MOS (5%)
TMDL (lbs/yr removed)
DC Upper Anacostia MS4 79,874
DC Upper Anacostia CSO 62,401
DC Upper Anacostia Other Point Sources 7,879 Total WLA 150,154
18,343 8,425 176,922
Table E7. Daily trash TMDLs for District of Columbia lower portion of the Anacostia watershed
WLA (lbs/day removed)
LA (lbs/day
removed) MOS (5%)
TMDL (lbs/day
removed) DC Lower Anacostia MS4 63.9
DC Lower Anacostia CSO 85.4
DC Lower Anacostia Other Point Sources 17.7 Total WLA 167.0
4.7 8.6 180.3
Table E8. Annual trash TMDLs for District of Columbia lower portion of the Anacostia watershed
WLA (lbs/yr removed)
LA (lbs/yr removed)
MOS (5%)
TMDL (lbs/yr removed)
DC Lower Anacostia MS4 23,314
DC Lower Anacostia CSO 31,185
DC Lower Anacostia Other Point Sources 6,457 Total WLA 60,955
1,705 3,133 65,794
In the Anacostia Watershed, the critical conditions for trash are high flow events because these events represent conditions during which trash is most easily transported to and through streams and the sewer system. These critical conditions are accounted for in this TMDL because data were collected over four seasons and included monitoring after rain events that led to high flow conditions. Monitoring activities were conducted after a range of rainfall conditions, including several storms events with totals over 0.5

August 2010 Final Anacostia River Watershed Trash TMDLs
xi
inches of rain, at least one storm with over 3 inches of rain during the event, and several storms with maximum intensities between 3 and 4 inches per hour. The annual rainfall for 2008 (46.49 inches) and 2009 (46.90 inches) was well above the long-term average annual rainfall of 39.35 inches (National Weather Service 2010). Further, the season rainfall averages were within about an inch of the long-term seasonal average, except for the spring of 2009 when 14.24 inches of rain fell, well above the long-term spring average of 9.00 inches (National Weather Service 2010). Data collection over the four seasons also accounted for possible localized seasonal variation in trash loading due to the large number of sites at which data were collected. The 50-year average annual rainfall was used to account for long-term conditions in the watershed. Clean Water Act section 303(d) requires that a TMDL incorporate an MOS to account for any uncertainty or lack of knowledge concerning the relationship between pollutant loading and water quality. The MOS can be implicit (e.g., incorporated into the TMDL analysis through conservative assumptions) or explicit (e.g., expressed in the TMDL as a portion of the loadings) or a combination of both. The Anacostia Trash TMDL employs both an explicit and implicit MOS. An explicit MOS of 5 percent was incorporated into the Anacostia Trash TMDL. Since the TMDL requires 100 percent removal of the baseline load, the MOS was incorporated into LAs and WLAs as an additional 5 percent of the baseline load that must be removed. Additionally, conservative assumptions were incorporated into the allocations. The WLAs are conservative estimates of actual loads because they were calculated under the assumption that all land in the watershed (including non-point source lands not regulated under NPDES stormwater permits) contributes to the point source trash load. The LAs are conservative estimates of actual loads because the entire stream length of all tributaries and the mainstem of the Anacostia were used in the calculation of the nonpoint source loads. The Clean Water Act and EPA regulations require reasonable assurance that TMDL WLAs and LAs will be implemented. WLAs are assigned to municipal separate storm sewer systems (MS4s), combined sewer overflows (CSOs), and other regulated land areas. The WLAs address trash items that can typically travel through sewer systems, while the LA is assigned to larger trash and debris that are attributed to activities such as dumping. The reduction goals established by these TMDLs will be reached through National Pollutant Discharge Elimination System permits and the District’s Long-Term Control Plan (LTCP) for CSOs to achieve WLAs, and other source controls to achieve LAs. In the case of the Anacostia Trash TMDLs, there is reasonable assurance that the goals of these TMDLs can be met with proper watershed planning, implementing pollution-reduction best management practices (BMPs), as well as political and financial mechanisms. The TMDLs can be achieved through a comprehensive, adaptive approach that addresses the following:
Appropriate storm drain capture technologies
Illicit dumping
Regulatory and voluntary approaches to trash removal and prevention


August 2010 Final Anacostia River Watershed Trash TMDLs
1
1. INTRODUCTION AND BACKGROUND Section 303(d) of the Clean Water Act and the U.S. Environmental Protection Agency’s (EPA’s) Water Quality Planning and Management Regulations (codified at Title 40 of the Code of Federal Regulations [CFR] Part 130) require states to develop Total Maximum Daily Loads (TMDLs) for impaired waterbodies. A TMDL establishes the amount of a pollutant that a waterbody can assimilate without exceeding its water quality standard for that pollutant. TMDLs provide the scientific basis for a state to establish water quality-based controls to reduce pollution from both point and nonpoint sources to restore and maintain the quality of the state’s water resources (USEPA 1991). The development of TMDLs requires an assessment of the waterbody’s assimilative capacity, critical conditions, and other considerations. A TMDL for a given pollutant and waterbody is composed of the sum of individual wasteload allocations (WLAs) for point sources and load allocations (LAs) for nonpoint sources and natural background conditions. In addition, the TMDL must include a margin of safety (MOS) to account for any uncertainty in the relationship between pollutant loads and the quality of the receiving waterbody. The TMDL components are illustrated using the following equation:
TMDL = WLAs + LAs + MOS Maryland and the District of Columbia have included the Anacostia River and its tributaries on their section 303(d) lists since 2006 as water quality impaired due to trash and debris. Trash is defined by the Anacostia River Watershed Trash TMDL Work Group as all improperly discarded waste material, including, but not limited to, convenience food, beverage, and other product packages or containers constructed of steel, aluminum, glass, paper, plastic, and other natural and synthetic materials thrown or deposited on the land or water. This definition is consistent with the definition established by the Metropolitan Washington Council of Governments (MWCOG). 1.1. Watershed Description
The Anacostia River watershed was originally inhabited more than 4,000 years ago, as native peoples lived off the natural resources of the wetlands and floodplains. The watershed was historically forested and full of wildlife. The river itself supported abundant fish populations. Beginning in the 1700s, towns along the river served as major seaports for the colonies, and the population grew. Agriculture was prominent in the watershed. From the 1700s through the Industrial Revolution, the area was increasingly deforested to make way for farms and to provide fuel and building materials. Without the forests to hold them in place, soils eroded into the river and tributaries, eventually making once deep, navigable waterways shallow and unusable for shipping. Since the late-1800s, agriculture has been replaced by urbanization. As the area industrialized, many of the tributaries were channelized, and portions of the wetlands were dredged (DNR 2002). Water quality in the river has degraded over time because of point and nonpoint sources of pollution, including CSO and industrial discharges. The mainstem of the Anacostia River has been impaired by oil and grease, fecal coliform, sedimentation and silt, low dissolved oxygen, nutrients, polychlorinated biphenyls (PCBs) and heptachlor epoxide. Despite heavy industrialization and development along the river, Maryland has classified the Anacostia River, just before it crosses into Washington, DC, as a Wild and Scenic River. Further downstream in Washington, the Anacostia River runs through the National Park Service’s (NPS’s) Kenilworth Park and Aquatic Gardens. Although most of the river and its tributaries run through highly developed, urbanized land, some of the floodplain and wetlands remain intact within Kenilworth Park.
1.1.1. Location
The Anacostia River—with its headwaters in Montgomery and Prince George’s Counties, Maryland—drains, more than 170 square miles. The watershed terminates at the confluence with the Potomac River in the District of Columbia. Approximately 80 percent of the watershed is in Maryland and 20 percent in the

Final Anacostia River Watershed Trash TMDLs August 2010
2
District. The main subwatersheds include the Northwest Branch, Paint Branch, Little Paint Branch, Indian Creek, Upper and Lower Beaverdam creeks, the Northeast Branch, Still Creek, Brier Ditch, Fort Dupont, Pope Branch, Watts Branch, Hickey Run and Sligo Creek. The upper tributaries are non-tidal freshwater, while the mainstem of the Anacostia River is tidally influenced. Figure 1 shows the location of the Anacostia Watershed and Figure 2 identifies the boundaries of the subwatersheds.
1.1.2. Population
The watershed’s population is more than 800,000 in the District of Columbia and Maryland.
1.1.3. Topography
The upper portions of the watershed are in the Piedmont Plateau which is characterized by gently rolling hills. The remainder of the watershed is in the Coastal Plain, which is somewhat flatter, but can also contain gently rolling hills. Elevations in the watershed range from sea level to about 400 feet above sea level.
1.1.4. Land Use
The Anacostia River watershed is highly urbanized. According to the Anacostia Watershed Restoration Partnership (AWRP), established by MWCOG, about 45 percent of the watershed is residential, the largest land use in the watershed. Undeveloped land covers just under 30 percent of the watershed. That undeveloped land is primarily forests and parks. Commercial and institutional land uses compose more than 15 percent of the watershed. Agriculture land use makes up 4.5 percent of the watershed. Industrial land use makes up less than 4 percent of the watershed. Water and wetlands cover an additional 1 percent. According to the Anacostia River Watershed Implementation Plan (District of Columbia Department of Health 2005), the overall imperviousness of the watershed is 22.5 percent, although that is variable among subwatersheds. The Upper Beaverdam Creek subwatershed has the lowest level of imperviousness at 11 percent, largely because of the presence of the U.S. Department of Agriculture, Beltsville Agricultural Research Center (BARC), which occupies most of the subwatershed (AWRP 2009). The highest levels of imperviousness are in the Hickey Run (37 percent) and the Lower Beaverdam Creek subwatersheds (39 percent) (AWRP 2009). Land use in Hickey Run is 30 percent industrial and 29 percent residential, while Lower Beaverdam Creek is 44 percent residential and 17 percent industrial (AWRP 2009). Some areas of the tidal mainstem of the Anacostia in the District, such as the Northwest Bank, have significantly higher levels of imperviousness (48 percent) (District of Columbia Department of Health 2005).
1.1.5. Climate
The Anacostia River Watershed is in a temperate climate. According to the National Weather Service Forecast Office, the mean annual temperature is 57.5 degrees Fahrenheit (°F), with a January mean minimum temperature of 27.3 °F and a July mean maximum of 88.3 °F. Annual mean rainfall is 39.35 inches at Ronald Reagan National Airport. No strong seasonal variation in precipitation exists. On average, winter is the driest with 8.89 inches, and summer is the wettest with 10.23 inches (National Weather Service 2010).
1.1.6. Geology and Soils
The watershed is within two physiographic provinces, the Piedmont and the Coastal Plain, whose division runs approximately along the line dividing Montgomery and Prince George’s Counties. The upper northwestern portion of the watershed is in the Piedmont Plateau province, characterized by steep stream valleys and well-drained loamy soils underlain by metamorphic rock. The Piedmont portion of the watershed ranges in elevation from 200 to 400 feet above sea level, and streambeds tend to be rocky, with relatively steep gradients. The remainder of the basin is within the Coastal Plain province, a wedge-shaped mass of primarily unconsolidated sediments covered by sandy soils. The Coastal Plain portion of the watershed,

August 2010 Final Anacostia River Watershed Trash TMDLs
3
Figure 1. Location of the Anacostia River watershed.

Final Anacostia River Watershed Trash TMDLs August 2010
4
Figure 2. Subwatersheds in the Anacostia River watershed.
August 2010 Final Anacostia River Watershed Trash TMDLs
5
ranging from 0 to 200 feet above sea level, is characterized by lower relief and is drained by slowly meandering streams with shallow channels and gentle slopes. The Northwest Branch tributary is predominantly in the Manor-Glenelg-Chester soil series. Soils in this series are fine-loamy, mixed, mesic Typic Hapludults and are very deep and well drained (Maryland Soil Conservation Service 1995). The Northeast Branch is mostly in the Sunnyside-Christiana-Muirkirk soil series. The Sunnyside soils are mostly red, deep, and well-drained. The Christiana-Muirkirk are also red and deep soils but are less permeable than the Sunnyside soils (Maryland Soil Conservation Service 1967). The portion of the watershed below the Northwest Branch and Northeast Branch drainage areas is mainly in the Sunnyside-Christiana-Muirkirk soil series and the Beltsville-Croom-Sasafras soil series (STATSGO). The soils are gently sloping to steep and dominantly gravelly (Maryland Soil Conservation Service 1967). Soils in the District are generally moderately well-drained to well-drained sandy or silty loams. Frequently, the soils are classified as urban land or urban land complexes. Udorthents (fill material and mixed soils) are also prevalent throughout the District (USDA NRCS 2006).
1.1.7. Hydrology
In the District’s portion of the Anacostia River watershed, covering 9,250 acres, there are 216 municipal separate storm sewer system (MS4) outfalls. The outfalls drain directly from streets to streams and the river. In the District’s portion of the watershed, covering a drainage area of 7,040 acres, there are 17 CSO outfalls. Water from the CSOs can discharge directly to the river during rain storms. The remaining 2,400 acres in the District’s portion of the watershed drain directly to the Anacostia River and tributaries. In Maryland, 976 MS4 outfalls are in Montgomery County’s portion of the watershed, draining approximately 38,600 acres, and 2,033 MS4 outfalls are in the Prince George’s County portion of the watershed, draining more than 44,000 acres. The remaining 9,500 acres in the Maryland portion of the watershed drain directly to the Anacostia River and tributaries. 1.2. Previous and Existing Studies
Anacostia River Stream Corridor Survey, Maryland Department of Natural Resources (2005) The Maryland Department of Natural Resources (DNR) conducted a Stream Corridor Assessment survey of Indian Creek, Lower Beaverdam and the Upper Anacostia (mainstem) subwatersheds in 2003–2004. The purpose was to rapidly assess the observable environmental problems along the stream systems and riparian areas, make a preliminary determination of the severity and correctability of problems, prioritize restoration efforts, and compare stream segments. Trash dumping was identified as significant environmental issue. Trash dumping sites were defined as places where large amounts of trash are inside the stream corridor, either from deliberate dumping or as a place where trash naturally tends to accumulate. DNR found 18 dumping sites throughout the three Anacostia subwatersheds. Seven of the sites were determined to be of moderate severity, three sites were of low severity, and eight sites were determined to be minor dumping sites. Of the 18 sites, five contained residential waste, four contained mixed wastes, two sites contained floatables, and two contained industrial waste. One site each was found containing yard waste, construction materials, tires with floatables, cars, and casket liners. The amount of trash at each site ranged from one truckload (residential, car, floatables) to 15 truckloads (casket liners). The construction materials and industrial dumping sites also had between 10 and 12 truckloads of materials each, indicating a sizable amount of waste. DNR assigned the industrial sites correctability ratings of four and five, indicating the cleanup would require heavy equipment, significant amounts of funding, a variety of permits and would take weeks or months to complete.

Final Anacostia River Watershed Trash TMDLs August 2010
6
District of Columbia Anacostia Watershed Trash Reduction Plan, Anacostia Watershed Society, 2008 Trash monitoring was conducted in the District’s portion of the watershed, along the mainstem and all tributaries of the Anacostia River, as well as Kingman Lake. Standardized weights were established for all commonly found items. Quarterly sampling began in August 2007 and concluded in June 2008. In some but not all instances, trash counts were assumed to be artificially low because only visible trash was counted. Trash below the top layer (in some cases trash was more than 2 feet deep) did not get counted under this survey method. Five transects were monitored along the mainstem of the Anacostia River. Although monitoring stations have differing trash-trapping efficiencies—based on the slope and composition of the shoreline (i.e., mud flat, seawall, riprap)—on average, the Anacostia River has 58 pieces of trash per 100 feet of river length, excluding trash that is underwater. Trash-trapping efficiency is a function of the shoreline composition. The transect above New York Avenue had the highest average trash accumulation. The shoreline is a wide mud flat. The station with the least amount of trash was that just below New York Avenue. The shoreline is a seawall with nothing to trap the trash. Sampling of the river bottom indicated 1.6 plastic bags are there for every 100 square feet of exposed river bottom. Data indicate that the trash composition in the mainstem is approximately 25 percent food wrappers, 25 percent bottles and cans, more than 20 percent plastic bags, about 10 percent Styrofoam containers and pieces, and the remaining 20 percent are composed of paper, debris, and other items. Four transects were established at Kingman Lake by major outfalls along the shoreline and at the downstream entrance near the Northeast Boundary CSO. The average count of trash per 100 feet was 36.7 items. The predominant type of trash within Kingman Lake is bottles and cans. This is attributed to activities in RFK stadium parking lot, on the basis of the high number of beer cans and beer bottles caught in the underbrush next to the transect. Although not reflected in the overall count, a significant amount of debris is items associated with tailgating parties, such as grills and folding chairs. Kingman Lake receives trash from tidal action in the Anacostia River, from storm sewers, the Northeast Boundary CSO, and deposition by the users of the shoreline. Overall, tributary streams were dominated by plastic bags, which accounted for 47 percent of the trash count. Food wrappers accounted for an additional 25 percent of trash. Bottles and cans composed 15 percent and Styrofoam an additional 6 percent. Paper products were not an issue. In total more than 14,000 plastic bags were counted during the spring survey (May and June 2008). That is double the number of plastic bags from the summer count (August and September 2007). Food wrappers, bottles, cans, and cups all decreased during the fall (November and December 2007). That can be explained by changes in precipitation to transport trash, the lower numbers of people outside in cold weather, which reduces the littering rate, or by the high number of fallen leaves, which block visibility of the trash. Ft. Chaplin, Ft. Stanton, Watts Branch, and Nash Run, all located in the eastern tidal drainage of the Anacostia River, were heavily affected by trash. Pope Branch, also in the eastern tidal drainage, was affected to a lesser extent, and the remaining tributaries had trash counts of 20 pieces per 100 feet or less. Nash Run was the most severely affected by trash, with an annual average trash count of 140 pieces per 100 feet and up to 260 pieces per 100 feet during one summer count. After an Earth Day cleanup, trash was reduced by more than half. Trash in Nash Run was just over 30 percent plastic bags, 30 percent food wrappers, and 20 percent bottles and cans. Watts Branch is the largest tributary to the Anacostia in the District. Of the 14 segments in Watts Branch, 7 had average trash counts of 120 pieces or higher per 100 feet. Segments with the least amount of trash still had averages of more than 60 items per 100 feet. Winter and spring consistently had the highest amounts of trash across all segments of Watts Branch. Plastic bags accounted for more than 50 percent of the trash in Watts Branch. Two dumping locations were identified along the Maryland segment of Watts Branch. Debris dumped in those locations is carried downstream to the remaining segments in the District. Although bottles and cans make up only about 10 percent of the trash count in Watts Branch, it was noted that the majority of the those containers were actually plastic water, juice, and soft drink bottles, which

August 2010 Final Anacostia River Watershed Trash TMDLs
7
combined to be about two-thirds of all bottle and cans, with beer cans contributing an additional 25 percent. The number of plastic bags counted in Watts Branch doubled from summer to spring, although the proportion of plastic bags stayed relatively constant. Watts Branch contains one plastic bag for every 1.2 feet of stream. In addition to the trash, Ft. Stanton transects contained debris consisting of decades-old tires and construction lumber. The source of the lumber was not identifiable. Broken glass on the stream bottom was counted in the Anacostia River tributaries. All streams in the District have a designated use Class B, secondary contact recreation, which means that the streams should be suitable for wading. Broken glass impairs that use. Watts Branch had the most broken glass with as much as five pieces per square foot in the upper segments. Sampling revealed a relatively low proportion of paper items in the streams. The lack of paper products was investigated. The sanitary engineering jar test was performed, where a paper bag and a receipt were placed in a jar of water and observed over the course of two hours. After 30 minutes, the paper was weakened to the point of breakage, if taken from the water. After an hour, the jar was shaken and the paper broke down into 2-inch pieces. After another hour, the jar was again shaken and the paper broke down even further. From the test, it appears that paper bags in the gutter do not remain intact as they wash down the curb, fall into the catch basin, and travel through the sewer system to the stream. Transect surveys of trash in areas of different land uses were conducted quarterly. Land uses include parks, recreational fields, trails, commercial streets, residential streets, light industrial streets, parking lots, institutional, transportation, and bridges. In contrast to the stream surveys, paper products were the primary trash in the streets, accounting for more than 35 percent, followed by food wrappers at 20 percent, and bottles and cans at just under 15 percent. The annual average trash levels per 1,000 square feet by use category are residential = 9.1, institutional = 11.8, commercial = 10.2, and light industrial = 22.8. Outdoor recreational areas had high levels of bottles and cans (more than 35 percent) and food wrappers (25 percent). Trash composition at two high schools was overwhelmingly food wrappers, at 70 percent. All other categories of trash accounted for less than 10 percent each. Two bus stops were surveyed for trash. Both bus stops are part of the Metro Adopt a Stop program, and on two occasions someone was observed sweeping the bus stop and putting the sweepings in the trash can at the stop. Of the trash found at the bus stop, paper products such as cigarette packaging and napkins were the most prevalent at more than 40 percent. Food wrappers also accounted for approximately 20 percent of the trash. Three bridges were sampled. Benning Road Bridge had significantly more trash, with counts generally more than 15 items per 1000 square feet. The 11th Street Bridge was relatively trash-free. Trash associated with eating and drinking made up similar percentages of bridge trash. Overall, land-based trash, as opposed to trash within the river, was highest in the summer and decreased over time. That seems to correlate with the pattern seen in the streams where trash increased over time. Land-based trash was equal parts food wrappers and paper at just over 25 percent each. Bottles and cans also made up an additional 20 percent. Land-based beer bottles were found in equal ratio to the number of beer cans, in contrast to the 1:7 ratio in the streams. The bottles appear to be broken up in the sewer system and account for the large quantities of broken glass in the streams. Windshield surveys for each stream in an MS4 drainage basin were conducted quarterly. The surveys consisted of driving down the same streets, rather than establishing transects, and counting the pieces of trash on one side of the block. On average about 30 pieces of trash were found per block for one side, and residential streets had lower counts than commercial streets. Vehicles parked on the street significantly affect

Final Anacostia River Watershed Trash TMDLs August 2010
8
the ability to count trash because the cars block the surveyor’s view. Because of differing patterns of parking on the weekdays versus the weekends, windshield surveys must be performed during the same part of the week to be a consistent tool to assess trash accumulation patterns. After an analysis of the trash counts collected in-stream versus the trash per acre determined by the street surveys, no quantitative predictive value is apparent for street trash levels; however, the street trash levels can serve as a good indicator of trash levels in the associated stream. 1.3. Impaired Waterbodies
According to the District of Columbia 2006 and 2008 Water Quality Assessment [305(b) and 303(d)] Integrated Reports, the Upper Anacostia River (DCANA00E) and Lower Anacostia River (DCANA00E) are impaired by trash (District of Columbia, Department of Health 2006 and District of Columbia, Department of the Environment 2008). The District divides the portion of the Anacostia River watershed in its boundaries into two segments. The Lower Anacostia is the portion of the river extending from the mouth of the river to the John Philip Sousa Bridge and Pennsylvania Avenue. The Upper Anacostia is the portion from the bridge to the Maryland border. The upper and lower segments of the Anacostia were listed on DC’s 1998 Section 303(d) List as impaired by biochemical oxygen demand (BOD), bacteria, organics, metals, total suspended solids (TSS), and oil and grease. DC developed TMDLs in 2002 and 2003 to address all these impairments in its portion of the Anacostia. In Maryland, both the tidal (MD-ANATF) and non-tidal (MD-02140205) sections of the Anacostia River are listed on Maryland’s 2008 Integrated Report as impaired by trash and debris. The Maryland Department of the Environment (MDE) has also identified the non-tidal Anacostia on the State's Integrated Report as impaired by the following (listing years in parentheses): nutrients (1996); sediments (1996); fecal bacteria (2002); impacts to biological communities— non-tidal waters (2002); toxics: polychlorinated biphenyls (PCBs) and heptachlor epoxide—non-tidal waters (2002); and PCBs in fish tissue in tidal waters (2006). Fecal bacteria TMDLs for MD tidal and non-tidal areas of the Anacostia were submitted in 2006 and subsequently approved by EPA. MD’s sediment and tidal PCBs listings were submitted in 2007 and subsequently approved by EPA. Inter-jurisdictional TMDLs addressing sediment/TSS and nutrients/BOD within both Maryland and District portions of the watershed were established in 2007 and 2008, respectively. 1.4. Water Quality Criteria
Water quality standards designate the uses to be protected (e.g., water supply, recreation, aquatic life) and the criteria for their protection (e.g., how much of a pollutant can be present in a waterbody without impairing its designated uses). TMDLs are developed to meet applicable water quality standards, which may be expressed as numeric water quality criteria or narrative criteria for the support of designated uses. The TMDL target identifies the numeric goals or endpoints for the TMDL that are designed to achieve applicable water quality standards. The TMDL target may be equivalent to a numeric water quality standard where one exists, or it may be calculated to achieve compliance with a narrative standard. This section reviews the applicable water quality standards and identifies an appropriate TMDL target for calculation of the trash TMDL for the Anacostia River.
1.4.1. District of Columbia Standards and Designated Uses
The District has defined the following designated uses, which are set forth in District of Columbia Municipal Regulations 21.11.1101.1. They are summarized in Table 1. Table 2 identifies the segment-specific designated beneficial uses for the Anacostia River and tributaries.

August 2010 Final Anacostia River Watershed Trash TMDLs
9
Table 1. District of Columbia designated uses Class of water Description
A Primary contact recreation
B Secondary contact recreation and aesthetic enjoyment
C Protection and propagation of fish, shellfish and wildlife
D Protection of human health related to consumption of fish and shellfish
E Navigation
Table 2. Segment-specific designated uses in the District’s portion of the watershed Water Designated use
Mainstem Anacostia River A,B,C,D,E
Anacostia River Tributaries, except A,B,C,D
Hickey Run B,C,D
Watts Branch B,C,D
Title 21, Section 1104 of the District of Columbia Municipal Regulations establishes water quality standards for the waters of the District of Columbia. The narrative criteria applicable to this TMDL are
The surface waters of the District shall be free from substances in amounts or combinations that do any one of the following: (a) Settle to form objectionable deposits; (b) Float as debris, scum, oil, or other matter to create a nuisance; (c) Produce objectionable odor, color, taste, or turbidity; (d) Cause injury to, are toxic to, or produce adverse physiological or behavioral changes in humans, plants, or animals; (e) Produce undesirable or nuisance aquatic life or result in the dominance of nuisance species; or (f) Impair the biological community that naturally occurs in the waters or depends upon the waters for its survival and propagation. Additional narrative standards specific to each class of waters and relevant to this TMDL include: Class A waters shall be free of discharges of untreated sewage, litter and unmarked submerged
or partially submerged man-made structures that would constitute a hazard to the users of Class A waters.
The aesthetic qualities of Class B waters shall be maintained. Construction, placement or
mooring of facilities not primarily and directly water oriented is prohibited in, on, or over Class B waters unless:
(a) The facility is for the general public benefit and service, and (b) Land based alternatives are not available.
Class C streams shall be maintained to support aquatic life and shall not be placed in pipes. Class E waters shall be free of unmarked submerged or partially submerged man-made objects
that pose a hazard to users of these waters. The District’s Water Quality Standards also include an antidegradation policy (Title 21, Section 1102), which requires existing in-stream water uses and the level of water quality necessary to protect the existing uses to be maintained and protected. If the water quality of the surface waters of the District exceeds the water quality criteria necessary to sustain the existing uses, those waters must be maintained at that quality. The water quality will not be allowed to degrade unless the District finds—after full satisfaction of the intergovernmental coordination and public participation of the District’s continuing planning process as required in 40 CFR Part 130—that allowing lower water quality is necessary to accommodate important
Final Anacostia River Watershed Trash TMDLs August 2010
10
economic or social development in the area in which the waters are located. In allowing the degradation to lower water quality, the District must ensure water quality adequate to protect existing uses fully.
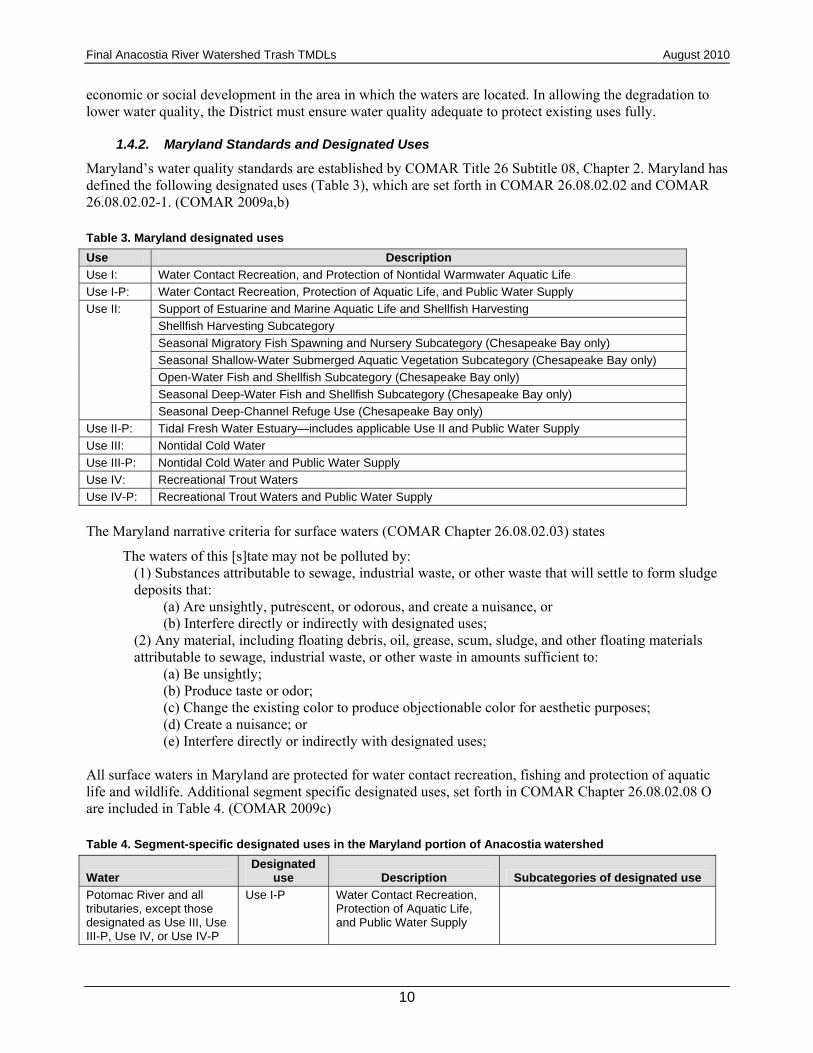
1.4.2. Maryland Standards and Designated Uses
Maryland’s water quality standards are established by COMAR Title 26 Subtitle 08, Chapter 2. Maryland has defined the following designated uses (Table 3), which are set forth in COMAR 26.08.02.02 and COMAR 26.08.02.02-1. (COMAR 2009a,b) Table 3. Maryland designated uses
Use Description
Use I: Water Contact Recreation, and Protection of Nontidal Warmwater Aquatic Life
Use I-P: Water Contact Recreation, Protection of Aquatic Life, and Public Water Supply
Support of Estuarine and Marine Aquatic Life and Shellfish Harvesting
Shellfish Harvesting Subcategory
Seasonal Migratory Fish Spawning and Nursery Subcategory (Chesapeake Bay only)
Seasonal Shallow-Water Submerged Aquatic Vegetation Subcategory (Chesapeake Bay only)
Open-Water Fish and Shellfish Subcategory (Chesapeake Bay only)
Seasonal Deep-Water Fish and Shellfish Subcategory (Chesapeake Bay only)
Use II:
Seasonal Deep-Channel Refuge Use (Chesapeake Bay only)
Use II-P: Tidal Fresh Water Estuary—includes applicable Use II and Public Water Supply
Use III: Nontidal Cold Water
Use III-P: Nontidal Cold Water and Public Water Supply
Use IV: Recreational Trout Waters
Use IV-P: Recreational Trout Waters and Public Water Supply
The Maryland narrative criteria for surface waters (COMAR Chapter 26.08.02.03) states
The waters of this [s]tate may not be polluted by: (1) Substances attributable to sewage, industrial waste, or other waste that will settle to form sludge deposits that:
(a) Are unsightly, putrescent, or odorous, and create a nuisance, or (b) Interfere directly or indirectly with designated uses;
(2) Any material, including floating debris, oil, grease, scum, sludge, and other floating materials attributable to sewage, industrial waste, or other waste in amounts sufficient to:
(a) Be unsightly; (b) Produce taste or odor; (c) Change the existing color to produce objectionable color for aesthetic purposes; (d) Create a nuisance; or (e) Interfere directly or indirectly with designated uses;
All surface waters in Maryland are protected for water contact recreation, fishing and protection of aquatic life and wildlife. Additional segment specific designated uses, set forth in COMAR Chapter 26.08.02.08 O are included in Table 4. (COMAR 2009c) Table 4. Segment-specific designated uses in the Maryland portion of Anacostia watershed
Water Designated
use Description Subcategories of designated use
Potomac River and all tributaries, except those designated as Use III, Use III-P, Use IV, or Use IV-P
Use I-P Water Contact Recreation, Protection of Aquatic Life, and Public Water Supply

August 2010 Final Anacostia River Watershed Trash TMDLs
11
Water Designated
use Description Subcategories of designated use
Anacostia River Tidal Fresh (1) DC/MD State Line-eastern side of Rt. 50 bridge (2) 100 feet below Bladensburg Road bridge (3) DC/MD State Line-western shore
Use II Support of Estuarine and Marine Aquatic Life and Shellfish Harvesting
Migratory Spawning and Nursery Use: February 1 to May 31, inclusive Shallow Water Submerged Aquatic Vegetation Use: April 1 to October 30, inclusive Application Depth: 0.5 meters NGZ present Open Water Fish and Shellfish Use: January 1 to December 31, inclusive
Paint Branch and tributaries
Use III Nontidal Coldwater
Northwest Branch and all tributaries
Use IV Recreational Trout Waters
Maryland’s water quality standards also include an antidegradation policy (Chapter 26.08.02.04), which requires that waters of the State be protected and maintained for existing uses and the basic uses of water contact recreation, fishing, protection of aquatic life and wildlife, and agricultural and industrial water supply as identified in Use I. Certain waters of this State possess an existing quality that is better than the water quality standards established for them. The quality of these waters will be maintained unless the state finds that a change in quality is justifiable as a result of necessary economic or social development; and the change will not diminish uses made of, or presently existing, in these waters. The Beaverdam Creek watershed contains Tier II high quality waters subject to the antidegradation policy. 1.5. TMDL Target
The TMDL target is a quantitative value used to measure whether the applicable water quality standard is being attained. For the Anacostia River, the TMDL target is 100 percent removal or capture of the baseline load calculated as an average (because of high seasonal and annual variability) of the measured or estimated removal rate. The baseline load is defined as the annual trash load calculated from monitoring data obtained through storm drain and CSO monitoring and in-stream sampling. The baseline load represents a typical annual load. The numeric target is derived from the narrative water quality criteria and includes both an explicit and an implicit MOS. As presented in Section 1.4, the narrative water quality criteria in both jurisdictions describe the level of trash in subjective terms such as objectionable, nuisance, and unsightly. EPA’s Quality Criteria for Water 1986 (known as the Gold Book) (USEPA 1986) states with respect to aesthetic uses that such “concepts may vary within the minds of individuals encountering the waterway,” i.e., a narrative was constructed because an objective, quantifiable threshold cannot be developed. Accordingly, the TMDL is expressed as the quantity of trash that must be captured or removed for the waterbody to achieve the narrative criteria, rather than as the amount of trash that can be added to the waterbody without being objectionable, unsightly or constituting a nuisance. A TMDL target equal to 100 percent removal of the baseline load is not the same as zero (0) trash in the waterway, but it should result in compliance with the narrative standard, as determined by the agencies responsible for interpreting the standard. This target provides an objective and measurable basis for compliance, consistent with stormwater and other discharge permits. While there might be a quantity of trash that could be discharged to the Anacostia River before being deemed by the general public as objectionable, it is not necessary to calculate that quantity for purposes of this TMDL. Whatever that level might be, the District and Maryland have concluded that removal of 100 percent of the baseline load would achieve the applicable narrative water quality criteria. Removal of 100 percent of the baseline load also would be sufficient to avoid interference with designated uses.

Final Anacostia River Watershed Trash TMDLs August 2010
12
2. DATA INVENTORY AND ANALYSIS TMDL development requires a complete review of existing data to establish existing conditions in the study area. This section describes the data from numerous sources that were used to characterize the watersheds and water quality conditions, identify pollutant sources, and support the calculation of trash TMDLs for the Anacostia River watershed. 2.1. Data Inventory
2.1.1. Hydrology
Geospatial data were derived from the hydrography centerline shapefile created by the District’s Office of the Chief Technology Officer (District of Columbia OCTO 2005) and were used to establish the stream length of the Anacostia mainstem and tributaries in the District. The stream lengths in Montgomery and Prince George’s Counties were determined using the stream and waterbody geospatial data provided by MWCOG (MWCOG 2009) and the National Hydrography Dataset (NHD) from U.S. Geological Survey (1999).
2.1.2. Weather
According to the National Weather Service, the long-term (30 years) mean annual precipitation at Ronald Reagan Washington National Airport, just south of the District, is 39.35 inches. A strong seasonal variation in precipitation does not exist. On average, winter is the driest with 8.89 inches, and summer is the wettest with 10.23 inches (National Weather Service 2010). To calculate the point source loading rates, described in Sections 4.1.1 and 4.1.4, the annual mean rainfall for the most recent 50-year period available was used. In the District’s portion of the watershed, annual rainfall was based on the mean annual rainfall at Reagan National Airport over a 50-year period from 1959 to 2008 (39.13 inches/year). In the Maryland portion of the watershed, annual rainfall was based on the mean annual rainfall at the BARC station over a 50-year period from 1953 to 2002 (41.13 inches/year). Both data sets were derived from the U.S. Department of Commerce, National Climatic Data Center (2007) Summary of the Day data sets. The data for Reagan National Airport was supplemented with average monthly precipitation data from the National Weather Service (2003-2008). The most current information available for each jurisdiction was utilized.
2.1.3. Land Use Data
Maryland Department of the Environment (MDE) provided the 2002 Land Use/Land Cover for Maryland, developed by the Maryland Department of Planning (2003). The District Department of Environment provided the land use coverage data for the District, developed by the District’s Office of Planning (2005). The land use data were used to determine the total point source load from each land use, on the basis of the pounds per acre land use loading rates, discussed in Sections 4.1.1 and 4.1.4. The Montgomery County portion of the watershed is predominantly residential with 58 percent of the watershed being in low-, medium-, or high-density residential use. Forest and parkland compose an additional 25 percent of the watershed. Commercial, industrial and institutional lands make up roughly 12 percent of the watershed. The remainder of the Montgomery County portion of the watershed is undeveloped or agricultural. The Prince George’s County portion of the watershed is less dominated by residential land use, which makes up only 36 percent of the land coverage. About 33 percent of the watershed is in agricultural or parkland uses. That is largely from the presence of the BARC station in the Beaverdam Creek subwatershed and Greenbelt Park in the Northeast Branch subwatershed. Commercial, industrial and institutional land is about 23 percent of the watershed. Agriculture is just over 6 percent of the Prince George’s County portion of the watershed.

August 2010 Final Anacostia River Watershed Trash TMDLs
13
The upper and lower portions of the District of Columbia portion of the Anacostia Watershed have different land use distributions. The Upper Anacostia watershed is 39 percent residential and 21 percent parks and open space. The remaining 40 percent is roughly equally divided between commercial, industrial, institutional, roads, and federal and local land. The Lower Anacostia watershed is 26 percent residential; 21 percent parks and open space; 19 percent federal facilities; 13 percent commercial, industrial, and institutional facilities; 12 percent major roads; and 8 percent public facilities. 2.2. Data Analysis
Consistent monitoring methodologies were used in Maryland and the District. Data were collected for the development of this TMDL by two different methods—stormwater outfall trash collection and monitoring and in-stream trash counts in both Maryland and the District.
2.2.1. District of Columbia Stormwater Outfall Monitoring
The District’s Department of the Environment, in conjunction with the Anacostia Watershed Society, conducted a trash monitoring survey to determine the amount and types of trash discharged through the MS4. Point source loading rates were established on the basis of the land use in the associated drainage areas. Ten storm sewer drainage areas were selected for monitoring, each representing the drainage from a specific land use (Figure 3). Data from the land-use-specific storm drains were used to develop trash loading rates for each type of land use. The land uses selected for monitoring are based on those used by the District’s Office of Planning. Similar land uses were combined into broader categories. The land uses surrounding the sites monitored for the TMDL were (1) low-density residential, (2) low- to medium-density residential, (3) medium-density residential, (4) high-density residential, (5) commercial/industrial, (6) mixed uses, (7) parks and open space, (8) institutional/federal public/local public/quasi-public, (9) transportation communication, utilities, roads/alleys, medians, and (10) public parking area. The mixed land use drainage area (site 6) contained commercial, industrial and low-density residential land. The data from this site were used to extrapolate the industrial land use loading rate. The industrial loading rate was calculated on the basis of the total amount of trash observed, the known loading rates for commercial and low-density residential land, and the proportion of each type of land use in that drainage area. The remaining portion of trash was attributed to the industrial land use. The types of storm drains/outfalls vary by land use. While half are storm drain outfalls discharging directly to the Anacostia River, some are different. The medium-density residential area storm outlet leads to a fenced-in stormwater retention pond. The high-density residential monitoring site is a catch basin with a small grate to prevent large objects and debris from entering the storm drain. The parks and open space monitoring site is a catch basin in the grass. The transportation/utilities/roads land use drains to a stormwater pond. The parking lot monitoring sites are three catch basins in the paved parking lot. Trash traps were installed at each of the 10 outfalls. The netting on the traps was one inch in diameter. Subsequent to rainfall events of a sufficient magnitude and intensity to transport trash, the trash traps were emptied of their contents, and all items were identified, counted and weighed. Monitoring determined that a storm event of at least 0.25 inch was sufficient to mobilize trash through the storm sewer system. The weather station at Eckington Place, NE was used as the rainfall data station of record. Monitoring was conducted between March and August 2009. It was determined that the large amount of organic debris moving through the storm sewer system during the fall and winter would overwhelm the trash traps; therefore, monitoring was not conducted during those seasons. Table 5 provides a summary of the monitored drainage areas, the land uses they represent and the associated trash weights normalized to ounces per acre.

Final Anacostia River Watershed Trash TMDLs August 2010
14
Figure 3. Storm drain sampling site locations in the District.

August 2010 Final Anacostia River Watershed Trash TMDLs
15
Table 5. Ounces of trash/acre at District stormwater outfall drainages
Monitoring site Langdon
RFK Stadium
Lot 5
New York Avenue At
South Dakota Avenue Meade Street
Nannie Helen Burroughs at
Minnesota Avenue, NE
Benning Road
River Terrace/ Anacostia
Avenue
Ridge/Burns Subdivision
North Marbury
Plaza
Smithsonian Anacostia
Community Museum
Representative land use
Parks and
open space
Public parking
Transport/ utilities,
etc. Low-density residential Mixed use
Commercial/ industrial
Low-medium-density
residential
Medium-density
residential
High-density
residential
Institutional/ federal
public/local public
Monitoring Date
March 29 ND ND ND 0.00 0.00 0.00 0.00 8.82 2.76 0.00
April 22 0.00 ND 3.95 0.00 0.00 0.00 0.00 10.25 1.38 7.09
May 4 0.00 3.22 13.83 0.37 3.89 4.07 0.48 10.46 1.38 3.86
May 8 0.00 5.06 ND 1.63 0.00 13.48 4.23 16.41 2.76 22.54
May 18 0.00 ND ND 0.59 ND 5.42 1.03 7.38 2.76 ND
May 18 ND ND 3.95 ND 1.74 ND ND ND ND 27.05
May 26 1.80 3.68 ND 7.70 5.77 8.14 1.75 12.10 22.12 15.78
May 29 0.00 ND 10.54 1.85 17.18 8.90 1.21 ND ND ND
June 1 ND 4.60 ND ND ND ND ND 19.28 4.84 14.81
July 23 0.00 12.42 42.16 ND 12.61 ND 4.83 29.94 ND ND
August 2 0.15 1.84 16.47 1.19 13.55 ND 2.29 7.38 1.38 16.75
August 17 ND ND 17.13 ND 8.05 ND ND ND ND ND
August 18 ND ND ND 1.33 5.50 6.53 ND ND ND ND
August 22 ND 0.92 ND ND ND 8.22 ND ND ND ND
Final Anacostia River Watershed Trash TMDLs August 2010
16
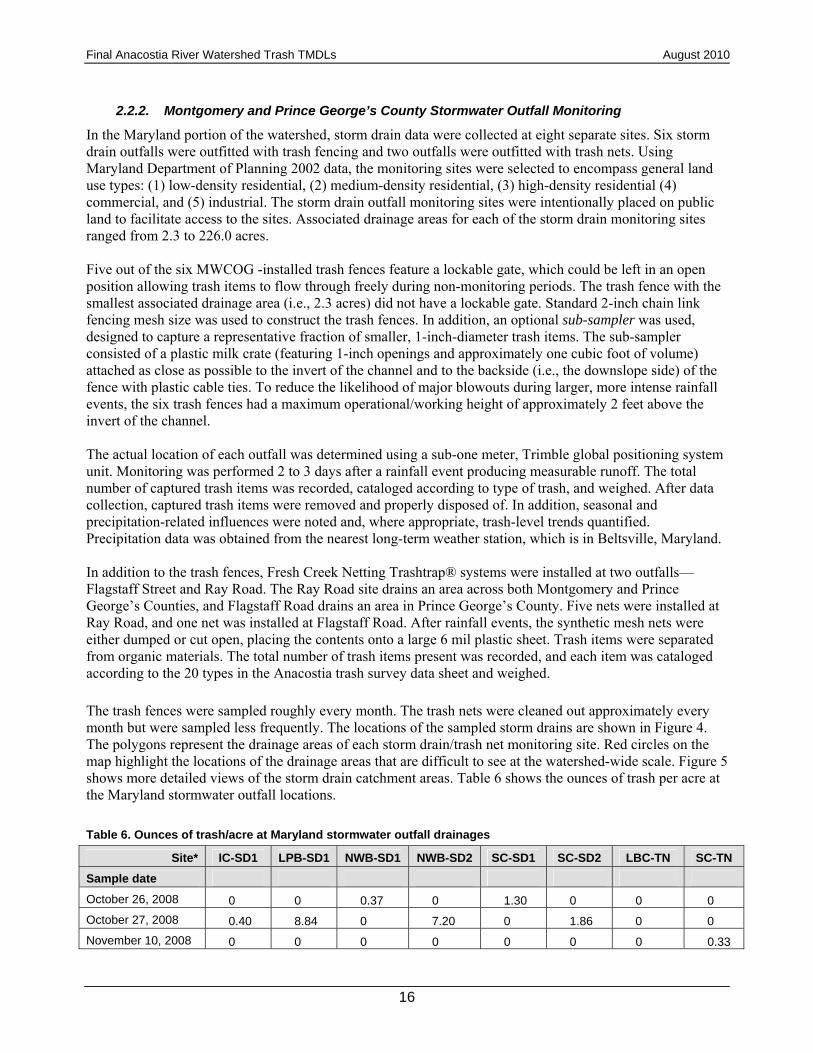
2.2.2. Montgomery and Prince George’s County Stormwater Outfall Monitoring
In the Maryland portion of the watershed, storm drain data were collected at eight separate sites. Six storm drain outfalls were outfitted with trash fencing and two outfalls were outfitted with trash nets. Using Maryland Department of Planning 2002 data, the monitoring sites were selected to encompass general land use types: (1) low-density residential, (2) medium-density residential, (3) high-density residential (4) commercial, and (5) industrial. The storm drain outfall monitoring sites were intentionally placed on public land to facilitate access to the sites. Associated drainage areas for each of the storm drain monitoring sites ranged from 2.3 to 226.0 acres. Five out of the six MWCOG -installed trash fences feature a lockable gate, which could be left in an open position allowing trash items to flow through freely during non-monitoring periods. The trash fence with the smallest associated drainage area (i.e., 2.3 acres) did not have a lockable gate. Standard 2-inch chain link fencing mesh size was used to construct the trash fences. In addition, an optional sub-sampler was used, designed to capture a representative fraction of smaller, 1-inch-diameter trash items. The sub-sampler consisted of a plastic milk crate (featuring 1-inch openings and approximately one cubic foot of volume) attached as close as possible to the invert of the channel and to the backside (i.e., the downslope side) of the fence with plastic cable ties. To reduce the likelihood of major blowouts during larger, more intense rainfall events, the six trash fences had a maximum operational/working height of approximately 2 feet above the invert of the channel. The actual location of each outfall was determined using a sub-one meter, Trimble global positioning system unit. Monitoring was performed 2 to 3 days after a rainfall event producing measurable runoff. The total number of captured trash items was recorded, cataloged according to type of trash, and weighed. After data collection, captured trash items were removed and properly disposed of. In addition, seasonal and precipitation-related influences were noted and, where appropriate, trash-level trends quantified. Precipitation data was obtained from the nearest long-term weather station, which is in Beltsville, Maryland. In addition to the trash fences, Fresh Creek Netting Trashtrap® systems were installed at two outfalls—Flagstaff Street and Ray Road. The Ray Road site drains an area across both Montgomery and Prince George’s Counties, and Flagstaff Road drains an area in Prince George’s County. Five nets were installed at Ray Road, and one net was installed at Flagstaff Road. After rainfall events, the synthetic mesh nets were either dumped or cut open, placing the contents onto a large 6 mil plastic sheet. Trash items were separated from organic materials. The total number of trash items present was recorded, and each item was cataloged according to the 20 types in the Anacostia trash survey data sheet and weighed.
The trash fences were sampled roughly every month. The trash nets were cleaned out approximately every month but were sampled less frequently. The locations of the sampled storm drains are shown in Figure 4. The polygons represent the drainage areas of each storm drain/trash net monitoring site. Red circles on the map highlight the locations of the drainage areas that are difficult to see at the watershed-wide scale. Figure 5 shows more detailed views of the storm drain catchment areas. Table 6 shows the ounces of trash per acre at the Maryland stormwater outfall locations.
Table 6. Ounces of trash/acre at Maryland stormwater outfall drainages
Site* IC-SD1 LPB-SD1 NWB-SD1 NWB-SD2 SC-SD1 SC-SD2 LBC-TN SC-TN
Sample date
October 26, 2008 0 0 0.37 0 1.30 0 0 0
October 27, 2008 0.40 8.84 0 7.20 0 1.86 0 0
November 10, 2008 0 0 0 0 0 0 0 0.33

August 2010 Final Anacostia River Watershed Trash TMDLs
17
Site* IC-SD1 LPB-SD1 NWB-SD1 NWB-SD2 SC-SD1 SC-SD2 LBC-TN SC-TN
Sample date
December 11, 2008 0.29 0 0 0 0 0.21 0 0
December 15, 2008 0 2.45 0.04 1.74 1.52 0 0 0
January 30, 2009 0.19 0.69 0 0.46 0.93 0.34 0 0
March 9, 2009 0.10 0.02 0 0.02 0.33 0.29 0 0
March 31, 2009 1.67 7.15 3.65 0.91 0.02 3.93 0 0
April 21, 2009 1.39 11.72 0 1.36 0.23 3.27 0 1.53
May 5, 2009 0.27 2.23 0 0.47 0.89 1.25 0 0
May 13, 2009 0 0 0 0 0 0 7.64 0.49
May 20, 2008 0 0 0 0 0 0 0 0.35
June 1, 2009 0 0 0 0 0 0 5.66 0
June 22, 2009 1.53 31.91 1.34 4.90 0.18 0.65 0 0
July 27, 2009 0.37 17.15 0.01 3.40 0.45 0.60 0 0
July 29, 2009 0 0 0 0 0 0 12.79 0 * Key to abbreviated site names: IC-SD1 – Indian Creek Storm Drain Trash Fence LPB-SD1 – Little Paint Branch Storm Drain Trash Fence NWB-SD1 – Northwester Branch Storm Drain 1 Trash Fence NWB-SD2 – Northwest Branch Storm Drain 2 Trash Fence SC-SD1 – Sligo Creek Storm Drain 1 Trash Fence SC-SD2 – Sligo Creek Storm Drain 2 Trash Fence LBC-TN – Lower Beaverdam Creek Storm Drain Trash Net SC-TN – Sligo Creek Storm Drain Trash Net

Final Anacostia River Watershed Trash TMDLs August 2010
18
Note: Red circles and triangles illustrate the location of monitored storm drains.
Figure 4. Locations of the storm drain sampling sites in Maryland.
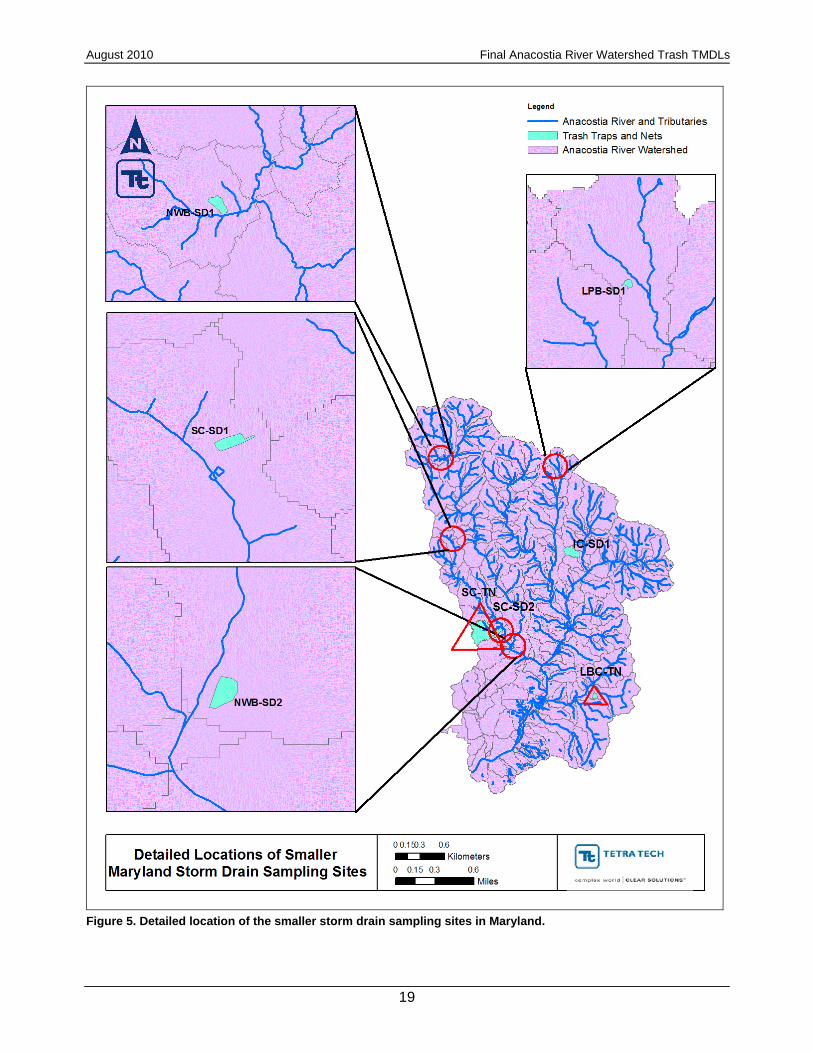
August 2010 Final Anacostia River Watershed Trash TMDLs
19
Figure 5. Detailed location of the smaller storm drain sampling sites in Maryland.

Final Anacostia River Watershed Trash TMDLs August 2010
20
2.2.3. District of Columbia In-Stream Monitoring
As described in Section 1.2, the District’s Department of the Environment worked with the Anacostia Watershed Society to conduct quarterly in-stream trash monitoring activities. Staff selected transects along the mainstem of the Anacostia River and four transects along the shoreline of Kingman Lake to monitor. All nine of the main perennial tributaries were monitored; however, tidal portions of the tributaries were not monitored. The nine tributaries are Watts Branch, Fort Stanton, Nash Run, Pope Branch, Fort Dupont, Fort Chaplin, Fort Davis-1, Fort Davis-2, and Texas Avenue. Monitoring was conducted quarterly and consisted of recording the amount and types of trash and debris observed in each stream channel. Monitoring data were collected once a season between August 2007 and June 2008. Transects were established approximately every 500–1,000 feet along the tributaries, using fixed landmarks as endpoints when possible. When landmarks were not available, flag tape marked the transect endpoints. Only visible items were counted. Buried items were not assessed, and the counts of large quantities of uniform trash items were estimated. The survey extended from the channel to bankfull depth. When streams were braided, only the channel with the majority of the flow during the monitoring event was counted. As the trash was counted, it was categorized into one of 44 categories of trash and debris (Table 7). Figure 6 shows the location of the sampling sites. Table 8 provides a summary of the annual nonpoint source debris counts for the stream sampling locations. The annual counts were derived by taking the average count from all four seasonal sampling events. Table 7. Categories of trash and debris used during in-stream monitoring in the District
Trash
Plastic Bags Liquor Bottles Beer Cans Soft Drink Bottles
Soft Drink Cans Water Bottles Sport Drink Bottles Juices Cans
Juice Bottles Styrofoam Cups Plastic Cups Paper Cups
Food Wrappers Take-out Packaging Cigarette materials Napkins
Beverage Containers Toiletries Drugs CDs
Toys, Balls Misc. Recreation Newspaper, Books Advertisements, Signs
Home Food Packaging Cups, Lids, Straws Styrofoam Plates Styrofoam Packaging
Styrofoam chunks, large Styrofoam chunks, small Misc. Jugs, Cartons Other Metal, Foil
Clothing Other Fabric Auto Products
Debris
Vehicle Debris, Large Vehicle Debris, Small Construction Material, Large
Construction Material, Small
Appliances, Bikes, Carts Carpet Misc. Large Debris Misc Plastic

August 2010 Final Anacostia River Watershed Trash TMDLs
21
Figure 6. Location of the stream sampling sites used to establish the nonpoint source loading rates in the District.
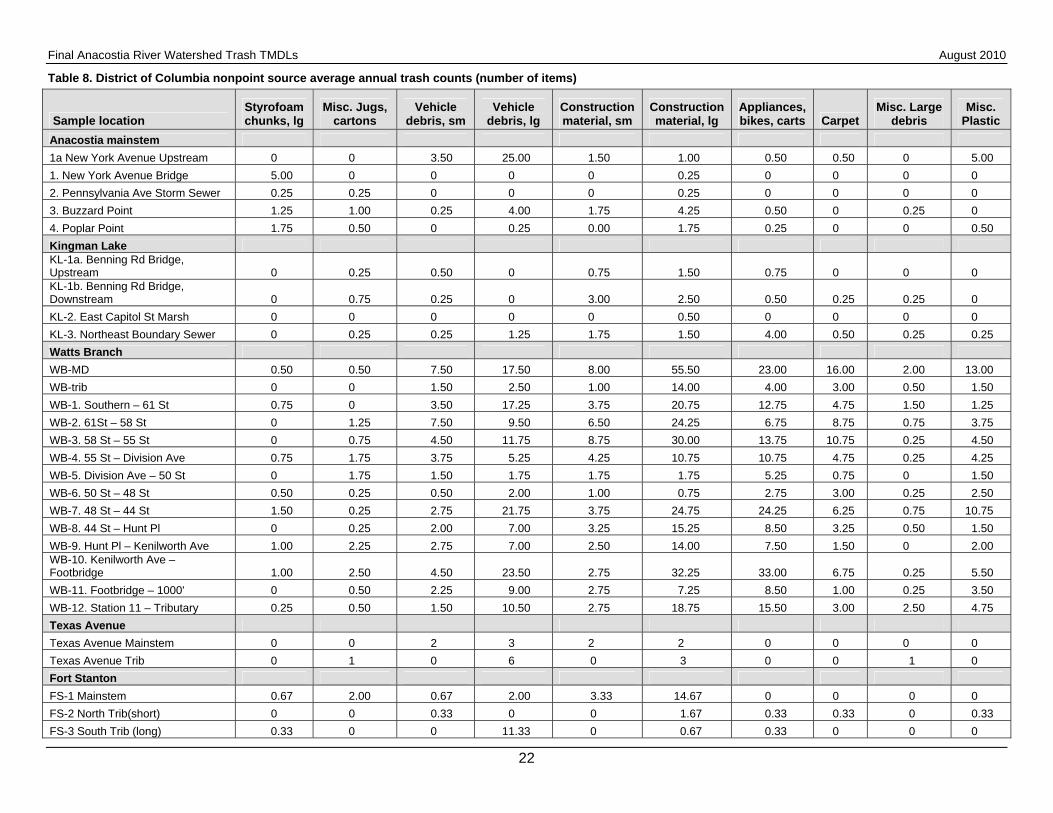
Final Anacostia River Watershed Trash TMDLs August 2010
22
Table 8. District of Columbia nonpoint source average annual trash counts (number of items)
Sample location Styrofoam chunks, lg
Misc. Jugs, cartons
Vehicle debris, sm
Vehicle debris, lg
Construction material, sm
Construction material, lg
Appliances, bikes, carts Carpet
Misc. Large debris
Misc. Plastic
Anacostia mainstem
1a New York Avenue Upstream 0 0 3.50 25.00 1.50 1.00 0.50 0.50 0 5.00
1. New York Avenue Bridge 5.00 0 0 0 0 0.25 0 0 0 0
2. Pennsylvania Ave Storm Sewer 0.25 0.25 0 0 0 0.25 0 0 0 0
3. Buzzard Point 1.25 1.00 0.25 4.00 1.75 4.25 0.50 0 0.25 0
4. Poplar Point 1.75 0.50 0 0.25 0.00 1.75 0.25 0 0 0.50
Kingman Lake KL-1a. Benning Rd Bridge, Upstream 0 0.25 0.50 0 0.75 1.50 0.75 0 0 0 KL-1b. Benning Rd Bridge, Downstream 0 0.75 0.25 0 3.00 2.50 0.50 0.25 0.25 0
KL-2. East Capitol St Marsh 0 0 0 0 0 0.50 0 0 0 0
KL-3. Northeast Boundary Sewer 0 0.25 0.25 1.25 1.75 1.50 4.00 0.50 0.25 0.25
Watts Branch
WB-MD 0.50 0.50 7.50 17.50 8.00 55.50 23.00 16.00 2.00 13.00
WB-trib 0 0 1.50 2.50 1.00 14.00 4.00 3.00 0.50 1.50
WB-1. Southern – 61 St 0.75 0 3.50 17.25 3.75 20.75 12.75 4.75 1.50 1.25
WB-2. 61St – 58 St 0 1.25 7.50 9.50 6.50 24.25 6.75 8.75 0.75 3.75
WB-3. 58 St – 55 St 0 0.75 4.50 11.75 8.75 30.00 13.75 10.75 0.25 4.50
WB-4. 55 St – Division Ave 0.75 1.75 3.75 5.25 4.25 10.75 10.75 4.75 0.25 4.25
WB-5. Division Ave – 50 St 0 1.75 1.50 1.75 1.75 1.75 5.25 0.75 0 1.50
WB-6. 50 St – 48 St 0.50 0.25 0.50 2.00 1.00 0.75 2.75 3.00 0.25 2.50
WB-7. 48 St – 44 St 1.50 0.25 2.75 21.75 3.75 24.75 24.25 6.25 0.75 10.75
WB-8. 44 St – Hunt Pl 0 0.25 2.00 7.00 3.25 15.25 8.50 3.25 0.50 1.50
WB-9. Hunt Pl – Kenilworth Ave 1.00 2.25 2.75 7.00 2.50 14.00 7.50 1.50 0 2.00 WB-10. Kenilworth Ave – Footbridge 1.00 2.50 4.50 23.50 2.75 32.25 33.00 6.75 0.25 5.50
WB-11. Footbridge – 1000' 0 0.50 2.25 9.00 2.75 7.25 8.50 1.00 0.25 3.50
WB-12. Station 11 – Tributary 0.25 0.50 1.50 10.50 2.75 18.75 15.50 3.00 2.50 4.75
Texas Avenue
Texas Avenue Mainstem 0 0 2 3 2 2 0 0 0 0
Texas Avenue Trib 0 1 0 6 0 3 0 0 1 0
Fort Stanton
FS-1 Mainstem 0.67 2.00 0.67 2.00 3.33 14.67 0 0 0 0
FS-2 North Trib(short) 0 0 0.33 0 0 1.67 0.33 0.33 0 0.33
FS-3 South Trib (long) 0.33 0 0 11.33 0 0.67 0.33 0 0 0

August 2010 Final Anacostia River Watershed Trash TMDLs
23
Sample location Styrofoam chunks, lg
Misc. Jugs, cartons
Vehicle debris, sm
Vehicle debris, lg
Construction material, sm
Construction material, lg
Appliances, bikes, carts Carpet
Misc. Large debris
Misc. Plastic
Nash Run
NR-1. I-295 – Pipe 0 0 0.75 2.00 0.75 7.25 6.50 0.25 0.25 0
NR-2. Pipe – Anacostia Ave 0 0 1.75 4.25 1.50 11.75 11.50 2.50 0 0.25
Popes Branch
PB-1. 35 St – Branch Ave 0.75 0.25 1.25 8.25 2.00 12.00 5.00 0 2.00 5.00
PB-2. Branch Ave – Minnesota Ave 0 0.75 0.75 3.25 1.00 1.75 3.25 0.25 1.50 2.00 PB-3. Minnesota Ave – Fairlawn Ave 0 0.25 1.00 1.50 0 1.00 1.50 0 0.50 1.25
Fort Dupont
FDp-2. Footbridge – 0 1.75 1.75 7.25 0.75 1.25 1.00 0 0.50 1.25 FDp-3. Segment 3 – Tributary Junction 0 0 0.25 2.75 0.75 0 1.50 0 0 1.25 FDp-3a. Trib Junction – ~Ft Davis Dr 0 0 0 2.00 0 1.00 0.50 0 0 0.25
FDp-4. Trib Junction – ~Ft Davis Dr 0 0.25 1.00 1.00 0 0 0 0 0 0.25
FDp-5. Ft Davis Dr – meadow 0.25 1.00 0.50 5.75 0.50 4.00 1.25 0 0 0.25
FDp-5a. Lower Tributary 0 0 0 0 0 0 0 0 0 0
FDp-6. Meadow – Path 0 0.25 0 0.50 0 1.50 0.50 0 0.25 0
FDp-7. Path – Minnesota Ave 0 0 0.25 0 0 2.50 0.25 0 1.00 0.25
FDp-8. Minnesota Ave – Railroad 0 0.50 0.75 5.75 2.25 4.00 2.25 0.25 0.75 0.75
Fort Chapin
FC-1. Headwater 0.5 0 2.25 10.75 2 7.75 11.25 0.75 3 0.25
FC-2. Segment 1 – C St 0.25 0.5 1 4.25 1 1.75 5 0.5 1.25 2.25
Fort Davis
Ft. Davis-1 0.5 0.25 0.25 1.5 0.5 0.75 1.5 0 0.25 0
Ft. Davis-2 0 0 3 19.5 0.25 0 2 0 0.5 1

Final Anacostia River Watershed Trash TMDLs August 2010
24
2.2.4. Montgomery and Prince George’s County In-Stream Monitoring
A total of 30 stream sampling sites are in Montgomery and Prince George’s Counties (15 in each). Each site was chosen by random selection from the existing Montgomery/Prince George’s County Index of Biotic Integrity Anacostia watershed station network. Transects of 500 feet were established along each of the 30 stream segments, using global positioning system and flagging to document the start and end points of each transect. Figure 7 shows the locations of the stream sampling sites. To provide a consistent methodology, trash was counted in an upstream to downstream direction from the bottom of the channel to bank-full height along each transect. All trash items were counted and recorded by type. Trash in the floodplain or overbank areas was not counted. The monitoring boundaries were the stream bottom to the bankfull channel line, as determined by a relatively consistent and discernable trash/debris line. Trash and debris items were counted and categorized. Large quantities of uniform items were estimated. Sampling was conducted between June 2008 and April 2009. Table 9 summarizes the annual trash counts for each trash type by sampling site, on the basis of the average count across the four sampling events. Station identifiers beginning with numbers are in Prince George’s County, and station identifiers beginning with letters are in Montgomery County.

August 2010 Final Anacostia River Watershed Trash TMDLs
25
Figure 7. Locations of the stream sampling sites in Montgomery and Prince George’s Counties.

Final Anacostia River Watershed Trash TMDLs August 2010
26
Table 9. Summary of Maryland average annual trash counts per sampling site
Station number
Cloth/ clothing/ carpeting
Oil quarts
Oil filters Antifreeze
Body large > 1'
Body small < 1' Batteries Tires Bricks Concrete Lumber
Misc. Const. Appliance
Wooden pallets Metal
Shop carts Sports Misc.
05-001 6.75 0 0 0 0 0.25 0 0.75 2.0 8.75 0 2.25 0.25 0 6.75 0 0.75 5.75
05-004 5.5 0 0 0 0.25 0.25 0 0.25 2.5 2.0 1.75 3.0 0 0 6.0 0 7.25 3.75
07-008B 1.25 0 0 0 0 0.5 0 0.75 0 0 0.5 2.25 0 0 1.0 0 1.0 4.0
07-033 3.5 0 0 0 0 1.25 0 3.25 2.75 1.0 0.75 2.0 0 0 4.0 0 0.25 5.5
07-038 12.25 1.5 0.5 1.0 6.25 12.0 0 26.75 0.5 0 12.25 16.75 0 0 7.75 0 3.25 28.0
09-006 17.5 0 0.25 0 0 1.0 0 0.5 1.25 3.75 8.25 1.25 0.5 0 11.25 1.5 1.25 11.0
14-001 38.5 0.25 0 0.25 0.25 2.5 0 0 19.75 7.5 0.75 2.75 1.25 0 14.0 0 4.25 13.0
14-002A 18.0 0 0.75 0 1.5 5.0 0 0 134.0 67.5 2.0 6.25 1.0 0 32.25 0.5 3.75 26.25
15-006 11.0 0.25 0 0 0.25 0.25 0 0.5 0.75 3.25 0 1.0 0 0 1.75 0 0.5 6.0
19-003 108.0 1.0 0.25 0.25 28.25 45.25 0.5 35.25 133.25 63.0 2.75 16.5 2.5 0 198.5 0 1.25 93.5
19-020A 6.5 0 0 0.25 0.25 0.75 0 2.5 9.0 4.25 2.5 4.75 0 0 10.0 0 3.5 15.5
19-040A 18.75 1.75 0 0 0.75 6.25 0 4.75 2.25 14.5 2.75 4.5 0.75 0 13.5 0 1.25 16.5
20-004 7.25 0 0 0 0.25 4.0 0 2.5 1.5 0.5 0.5 2.25 0 0 9.25 0 5.0 9.5
22-003 22.5 0.75 0 0 6.25 6.0 0 30.25 11.0 7.0 18.75 8.0 0.5 0.75 31.0 4.75 9.25 32.25
22-004 0 0 0 0 0 0.5 0 0 0.75 0 0 0.25 0 0 4.75 0 0 3.0
LPLP109 4.25 0 0 0 0 0 0 1.75 3.25 1.5 0 1.75 0 0 1.0 0 2.25 2.25
LPLP202 2.0 0.5 0 0 0 0 0 1.0 0 0.25 1.0 0.5 0 0 0.75 0 0.75 3.5
LPLP205 3.25 0 0 0 0 0 0 0.5 0.5 0.25 0 3.5 0 0 2.75 0 1.0 2.0
LPLP301A 0.75 0 0 0 1 0 0 1.0 1.5 1.25 1.75 1.0 0 0 1.0 0 2.75 2.0
NWBF301 10.5 0 0 0 0 0.75 0 0.75 30.75 27.5 3.5 11.25 0.25 0 39.25 0 0.5 10.25
NWBP205 4.75 0 1.0 0 0 0.25 0 1.0 0.5 0 4.0 0.5 0 0 2.25 0 5.25 5.75
NWNW206A 0 0 0 0 0 0 0 0 7.5 0 0 0.5 0 0 3.25 0 0 1.75
NWNW402 1.25 0 0.25 0 0 0 0 0 0.5 13.0 2.5 1.5 0 0 0 0 5.0 3.25
NWNW407D 5.0 0 0 0 0 0.25 0 2.0 1.25 0 2.0 1.75 0 0 3.75 0 2.75 5.5
PBHB210 5.5 0 0 0 0 1.75 0 1.75 1.5 0.5 3.5 2.5 0 0 3.75 0 9.25 6.25
PBPB308 2.25 0.25 0 0 0 0 0 0 0.5 0.25 0.5 1.5 0 0 1.25 0 0.5 2.25
SCLB101 2.0 0 0 0 0 0 0 0 6.5 24.75 0 0.5 0 0 2.5 0 0.75 2.5
SCSC204 1.5 0 0.25 0 0 0.5 0 0 5.25 4.25 2.5 0.5 0 0 0.75 0 0 5.0
SCSC301 1.0 0 0 0 0 0.5 0 0 0.75 3.0 0.25 0.25 0 0 1.5 0 1.75 2.0
SCSC314 5.75 0.25 0 0 0 2.0 0 0 17.75 33.25 0.5 1.5 0 0 6.75 0 2.75 6.0
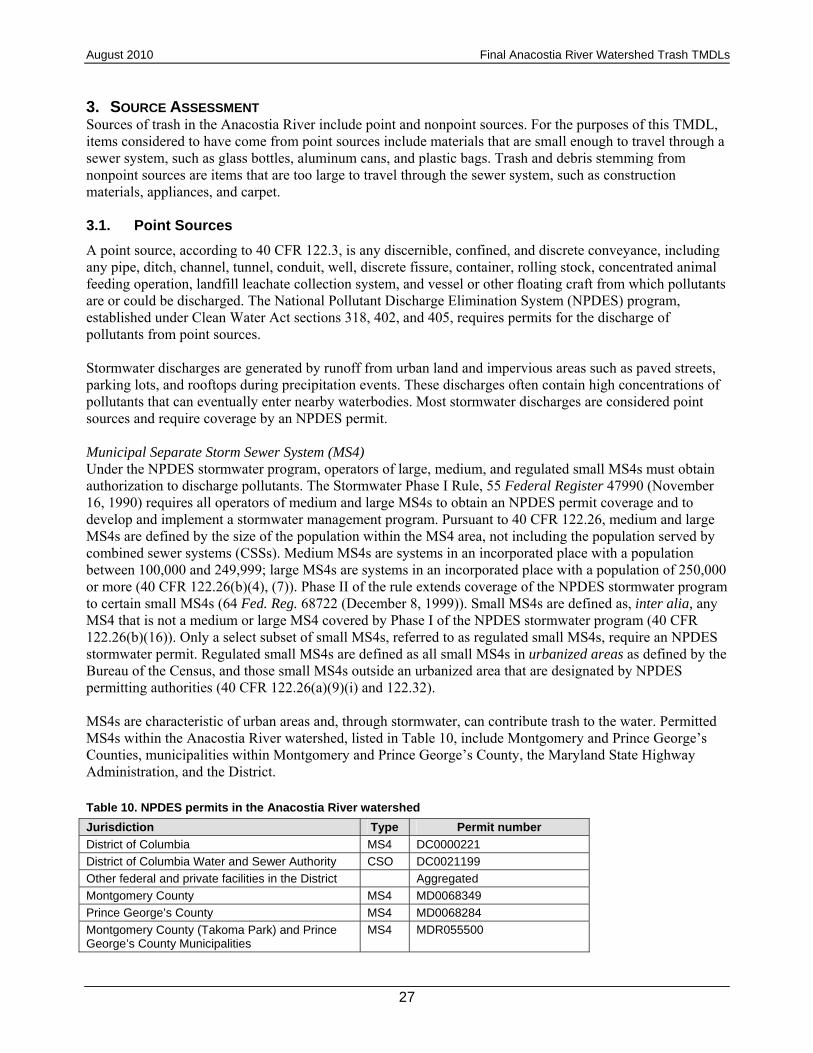
August 2010 Final Anacostia River Watershed Trash TMDLs
27
3. SOURCE ASSESSMENT Sources of trash in the Anacostia River include point and nonpoint sources. For the purposes of this TMDL, items considered to have come from point sources include materials that are small enough to travel through a sewer system, such as glass bottles, aluminum cans, and plastic bags. Trash and debris stemming from nonpoint sources are items that are too large to travel through the sewer system, such as construction materials, appliances, and carpet. 3.1. Point Sources
A point source, according to 40 CFR 122.3, is any discernible, confined, and discrete conveyance, including any pipe, ditch, channel, tunnel, conduit, well, discrete fissure, container, rolling stock, concentrated animal feeding operation, landfill leachate collection system, and vessel or other floating craft from which pollutants are or could be discharged. The National Pollutant Discharge Elimination System (NPDES) program, established under Clean Water Act sections 318, 402, and 405, requires permits for the discharge of pollutants from point sources. Stormwater discharges are generated by runoff from urban land and impervious areas such as paved streets, parking lots, and rooftops during precipitation events. These discharges often contain high concentrations of pollutants that can eventually enter nearby waterbodies. Most stormwater discharges are considered point sources and require coverage by an NPDES permit. Municipal Separate Storm Sewer System (MS4) Under the NPDES stormwater program, operators of large, medium, and regulated small MS4s must obtain authorization to discharge pollutants. The Stormwater Phase I Rule, 55 Federal Register 47990 (November 16, 1990) requires all operators of medium and large MS4s to obtain an NPDES permit coverage and to develop and implement a stormwater management program. Pursuant to 40 CFR 122.26, medium and large MS4s are defined by the size of the population within the MS4 area, not including the population served by combined sewer systems (CSSs). Medium MS4s are systems in an incorporated place with a population between 100,000 and 249,999; large MS4s are systems in an incorporated place with a population of 250,000 or more (40 CFR 122.26(b)(4), (7)). Phase II of the rule extends coverage of the NPDES stormwater program to certain small MS4s (64 Fed. Reg. 68722 (December 8, 1999)). Small MS4s are defined as, inter alia, any MS4 that is not a medium or large MS4 covered by Phase I of the NPDES stormwater program (40 CFR 122.26(b)(16)). Only a select subset of small MS4s, referred to as regulated small MS4s, require an NPDES stormwater permit. Regulated small MS4s are defined as all small MS4s in urbanized areas as defined by the Bureau of the Census, and those small MS4s outside an urbanized area that are designated by NPDES permitting authorities (40 CFR 122.26(a)(9)(i) and 122.32). MS4s are characteristic of urban areas and, through stormwater, can contribute trash to the water. Permitted MS4s within the Anacostia River watershed, listed in Table 10, include Montgomery and Prince George’s Counties, municipalities within Montgomery and Prince George’s County, the Maryland State Highway Administration, and the District. Table 10. NPDES permits in the Anacostia River watershed
Jurisdiction Type Permit number
District of Columbia MS4 DC0000221
District of Columbia Water and Sewer Authority CSO DC0021199
Other federal and private facilities in the District Aggregated
Montgomery County MS4 MD0068349
Prince George’s County MS4 MD0068284
Montgomery County (Takoma Park) and Prince George’s County Municipalities
MS4 MDR055500

Final Anacostia River Watershed Trash TMDLs August 2010
28
Jurisdiction Type Permit number
Maryland State Highway Administration MS4 MD0068276
Federal facilities in Maryland MS4 MDR055501 (General Permit)
Other state and private facilities in Maryland Aggregated
Combined Sewer System (CSS) Under the NPDES program, a permit is also required for CSS facilities. CSSs collect stormwater runoff, domestic sewage, and industrial wastewater in the same pipe. Under dry conditions or periods with little precipitation, all wastewater is transported to the sewage treatment plant for treatment and subsequent discharge to a waterbody. During heavy precipitation events, the volume of wastewater can exceed the capacity of the conveyance system or treatment plant. Excess wastewater is diverted without treatment through an overflow system directly to rivers and streams. The CSOs transport stormwater, untreated domestic sewage, industrial wastewater, pollutants, and debris into the receiving waterbody. CSOs can contribute trash to the Anacostia River. The CSS in the District is regulated by an NPDES permit Other Facilities Other facilities in Maryland and the District maintain stormwater outfalls that drain to the Anacostia watershed. Those facilities are addressed in aggregate and include areas largely composed of industrial facilities and state-owned lands in Maryland and parkland and federally-owned lands in the District. 3.2. Nonpoint Sources
Nonpoint sources of pollutants are diffuse, non-permitted sources. For the purposes of this Anacostia River TMDL, nonpoint sources of trash are defined by trash size. Trash that is too large to be transported through the MS4 or CSO storm drain system is considered to have come from a nonpoint source, even though a particular discharge fitting this description might constitute a discharge from a point source under the Clean Water Act. Accidental or intentional dumping of materials, such as construction materials, vehicles, appliances and bricks, constitute nonpoint sources of trash. Additionally, but to a lesser extent, direct disposal or windblown dispersal of smaller trash items along the river and tributaries are part of the point source load because such items could not be distinguished from items traveling through the sewer system and are also presumed to be either a small part of the total trash load, or would eventually have been washed down a storm drain.

August 2010 Final Anacostia River Watershed Trash TMDLs
29
4. BASELINE LOAD METHODOLOGY 4.1. Development of Loading Rates and Baseline Loads
Monitoring data described in Section 2.2 were used to establish the baseline point source and nonpoint source loads. To differentiate between the point source and nonpoint source loads, items that are generally considered too large to move through the storm drain system are considered part of the baseline nonpoint source load, and items that would generally be able to move through the storm drain system are considered part of the baseline point source load. The baseline loads do not include natural debris, such as sticks, leaves, and seed pods.
4.1.1. District of Columbia Point Source Loading Rate
Point source baseline loading rates were established on the basis of the land use in the drainage areas of the associated storm drain outfall. Given the known acreage and land use within the drainage areas for each monitoring site, trash loading rates for the MS4 system and areas that directly drain to the Anacostia mainstem were calculated. (The loading rates for the CSOs were calculated differently and are described in a following section.) First, the data were normalized to trash loading pounds per acre per year. This was done by determining the amount of rainfall during each of the trash-collection periods and dividing the pounds per acre from each sampling location by the rainfall amount for the corresponding sampling event. Table 11 shows the rainfall amounts for each sampling event. Once the pounds of trash per acre per inch of rain was established for each sampling event at each monitoring location, the average trash pounds per acre per inch for each monitoring site was calculated using sampling events from March through August 2009. To obtain an annual loading rate, the unit loading rate was multiplied by the average annual rainfall. Annual rainfall was based on the mean annual rainfall at Washington Reagan National Airport over a 50-year period from 1959 to 2008 (39.13 inches/year). Each monitoring location represents specific land uses, so the loading rates established at the monitoring locations represent unique point source loading rates for each land use. The point source loading rates for each land use are summarized in Table 12. Table 12 also summarizes the calculation of the total annual point source trash load on the basis of the land uses within the Upper and Lower Anacostia portions of the District’s MS4 drainage areas. Table 11. Rainfall amounts for each trash collection period, totaled by sampling date
Sampling date Rainfall amount
(inches)
March 29, 2009 1.1
April 22, 2009 1.59
May 4, 2009 1.2
May 8, 2009 1.76
May 18, 2009 0.79
May 18, 2009 0.34
May 26, 2009 2.22
May 29, 2009 0.94
June 1, 2009 1.18
July 23, 2009 3.19
August 2, 2009 0.63
August 17, 2009 0.42
August 18, 2009 0.37
August 22, 2009 0.57

Final Anacostia River Watershed Trash TMDLs August 2010
30
Table 12. Point source baseline loading rates for the District MS4
Aggregated land use category Acres Unit loading rate
(lbs/acre) Annual load (lbs/yr)
Upper Anacostia 79,874.1
Low-Density Residential 1,697.57 4.52 7,667.8
Low-Medium-Density Residential 1,267.54 3.96 5,023.2
Medium-Density Residential 657.71 13.84 9,101.7
High-Density Residential 19.31 7.93 153.1
Commercial 431.04 22.08 9,519.1
Industrial 259.86 18.90 4,911.0
Institutional 585.69 25.45 14,905.8 Major Roads, Transport, Communication, Utilities 624.51 31.12 19,433.5 Public Facilities (Local Public, Quasi Public, Institutional) 304.92 25.45 7,760.2
Federal Facilities 67.84 12.78 867.2
Parking 12.22 6.84 83.6
Parks and Open Spaces 1,401.13 0.32 447.8
Lower Anacostia 23,313.8
Low-Density Residential 204.38 4.52 923.2
Low-Medium-Density Residential 158.16 3.96 626.8
Medium-Density Residential 263.00 13.84 3,639.5
High-Density Residential 46.05 7.93 365.0
Commercial 155.67 22.08 3,437.9
Industrial 33.00 18.90 623.6
Institutional 69.41 25.45 1,766.4 Major Roads, Transport, Communication, Utilities 81.09 31.12 2,523.5 Public Facilities (Local Public, Quasi Public, Institutional) 243.73 25.45 6,202.9
Federal Facilities 240.17 12.78 3,070.3
Parking 0.00 6.84 0.0 Parks and Open Spaces (parks and open spaces + undetermined) 421.81 0.32 135.0
4.1.2. District of Columbia CSO Loading Rate
The loading rate for the CSO system was derived from monitoring data from a trash trap system attached to a CSO outfall. This data was from a previously completed study not done in conjunction with this TMDL. The report DC-WASA Combined Sewer Overflow Anacostia River Trash Reduction Demonstration Project: Fresh Creek Netting TrashTrapTM System (MWCOG, Department of Environmental Programs 2001) outlines the system installation, trash collection, and monitoring undertaken over a 9-month period from August 2000 to April 2001. The Fresh Creek Netting Trash Trap was installed at CSO 018, approximately 1,000 feet below the Pennsylvania Avenue Bridge, along the Anacostia River. The system was a floating, end-of-pipe trash trap with two nets in a floating frame with a heavy-duty PVC coated polyester fabric floating boom/skirt that directs the effluent into the nets. The system was designed to rise and fall with the tides. A second, outer floating boom was added to capture fugitive floatables that were not captured in the nets. The system was designed to capture only floatable materials. Contractors changed the nets 10 times over the course of the monitoring period. After removing the nets, they were drained for 5 minutes and weighed. Fugitive floatables were also collected and weighed during net

August 2010 Final Anacostia River Watershed Trash TMDLs
31
changes. The contents of the nets were separated into general trash categories, and the floatables in each category were weighed separately. Rainfall events during the monitoring period were recorded to establish the flow volume. The weight of captured trash was normalized to pounds per million-gallons. On the basis of a reassessment of the data from this study by MWCOG (Phong Trieu, Metropolitan Washington Council of Governments, personal communication to Monir Chowdhury, District of Columbia Department of the Environment, December 14, 2009), the trash and organic debris waste loading rate is 730 pounds per million gallons of overflow. It was determined that organic debris composed 90 percent of the material collected; therefore, the actual CSO trash loading rate is 73 pounds per million gallons of overflows.
4.1.3. District of Columbia Nonpoint Source Loading Rate
In-stream monitoring data, described in Section 2.2.3, was used to develop the nonpoint source baseline loading rate. Items cataloged as debris were considered to be a part of the nonpoint source baseline load. Additionally, other items initially cataloged as trash but subsequently determined to be likely too large to fit through the sewer system were included in nonpoint source load. The other items of large trash include large Styrofoam chunks and miscellaneous jugs and cartons. The other smaller items of trash that could fit through the sewer system were considered part of the point source load. Using the trash-monitoring data, items considered to be a part of the nonpoint source load from each stream segment were tallied for each season and then averaged across the year to establish the annual loading rate for each stream. Standardized weights were applied to the different categories of debris on the basis of the trash weights established in the Anacostia Watershed Trash Reduction Plan (Anacostia Watershed Society 2008) to obtain an annual loading weight for each sample segment. Trash loading rates were standardized to pounds per 1,000 stream feet, and the rate was applied to the entire length of each stream to derive the total baseline load for each tributary, Kingman Lake, and the Anacostia River mainstem. Stream lengths were determined using the 2005 Hydrography Centerline data set from the District of Columbia Office of the Chief Technology Officer (District of Columbia OCTO 2005). Streams that were not directly sampled were assigned an annual loading rate that was developed by calculating the mean loading rate from all tributaries to the Anacostia River, which is 129 lbs/1,000 ft/yr. The total annual loading of debris from the tributaries, Kingman Lake, and the Anacostia River mainstem is the annual baseline load. Table 13 summarizes the loading rate and total baseline load for each tributary. Table 13. Nonpoint source trash baseline loading rates for the Anacostia River mainstem, Kingman Lake, and tributaries within the District
Stream/tributary
Nonpoint source loading rate
(pounds/1,000 ft/yr) Length of stream
(ft) Annual load
(lbs/yr)
Upper Anacostia 136,388.082 18,342.64 Anacostia 52.822 28,189.578 1,489.04
Chillum Rd Tributary 129.099 1,011.715 130.61
Dueling Creek 129.099 3,841.284 495.91
Fort Chaplin 181.861 2,256.633 410.39
Fort Davis 62.813 3,849.893 241.82
Fort Dupont 39.938 20,093.580 802.51
Hickey Run 129.099 10,667.310 1,377.14
Hickey Run - Spring Branch Trib 129.099 287.903 37.17
Kingman Lake 61.768 4,975.383 307.32
Lower Beaverdam Creek 129.099 2,075.084 267.89
Nash Run 297.463 6,933.608 2,062.49

Final Anacostia River Watershed Trash TMDLs August 2010
32
Stream/tributary
Nonpoint source loading rate
(pounds/1,000 ft/yr) Length of stream
(ft) Annual load
(lbs/yr) Piney Run 129.099 335.547 43.32
Pope Branch 59.118 7,624.264 450.73
TRC7 129.099 185.720 23.98
TRC9 NW Branch 129.099 7,725.288 997.33 TRC12 NW Bank (Kenilworth Aquatic Gardens)
129.099 6,099.294 787.42
TRC13 NW Bank (Kenilworth Aquatic Gardens)
129.099 2,447.228 315.94
TRC14 NW Bank 129.099 4,483.606 578.83
TRC15 NW Bank 129.099 3,246.076 419.07
Watts Branch Creek 354.141 20,059.080 7,103.74
Lower Anacostia 26,737.560 1,705.25
Anacostia 52.822 12,780.184 675.08
Stickfoot Tributary 129.099 3,200.876 413.23
TRC2 129.099 972.217 125.51
TRC3 (Fort Stanton) 46.392 6,362.566 295.17
TRC5 (Texas Avenue) 57.356 3,421.717 196.26
Total Length (ft) 163,125.600
Total Debris 20,047.89
4.1.4. Montgomery and Prince George’s Counties Point Source Loading Rates
The process used in Maryland followed the same process used in the District to determine the point source trash baseline loading rates. An alternative method of developing point source loading rates using a regression model was explored. Ultimately, the stormwater outfall monitoring method was chosen for consistency with the District methodology and the ability to estimate loadings on a land use basis. To determine the point source baseline loading rates for land uses in Maryland, the weights of the trash collected from the storm drain outfall trash traps (fences) and trash nets were used. The total number of captured trash items was recorded, cataloged according to type of trash, and weighed. Organic matter collected in the trash traps and nets was not counted as part of the trash load. The trash weights for each sampling event were normalized to pounds of trash per acre on the basis of the size of the contributing drainage area for each sampling location. Each sampling event was then normalized to pounds/acre/inch of rain. This was done by determining the amount of rainfall during each of the trash-collection periods and dividing the pounds/acre by the rainfall amount. Table 14 lists the total rainfall amounts for each sampling event. For each of the sample dates, all rainfall was summed from the date when the trash trap (fence) was closed, until the trash fence was opened again, using data from the National Climatic Data Center. Rainfall amounts were derived from the15-minute interval USDA BARC #7 monitoring station data set, except for the monitoring event on May 5, 2009. Because rainfall data did not produce a continuous record during the relevant trash-collection period for the May 5th sampling event, rainfall amounts from the Reagan National Airport monitoring station were substituted. In some cases, there are separate rainfall amounts for the trash traps and the trash nets. That is because the trash traps and trash nets were on different operating schedules. While the data might have been collected on the same day, the trash traps and nets were in service for different periods leading up to the collection. Table 15 provides an example of how total rainfall was calculated for the June 22, 2009 sampling event, using the trash trap that was closed to collect trash starting on June 15, 2009, and reopened after collecting the trash on June 22, 2009. Only periods when rainfall was recorded are listed.

August 2010 Final Anacostia River Watershed Trash TMDLs
33
Table 14. Rainfall amounts for each trash collection period totaled by sampling date
Date Rainfall (inches)
October 26, 2008 0.64
October 27, 2008 0.64
December 10, 2008 2.16
December 15, 2008 2.16
January 30, 2009 0.80
March 9, 2009 0.28
March 31, 2009 1.33
April 21, 2009 2.11
April 21, 2009 (trash nets) 2.19
May 5, 2009 1.68
May 13, 2009 (trash net Ray Road) 1.67
May 13, 2009 (trash net Flagstaff Street) 1.54
May 20, 2009 (trash nets) 0.41
June 1, 2009 (trash nets) 3.69
June 22, 2009 1.61
July 27, 2009 0.88
July 29, 2009 (trash nets) 2.06
Table 15. Summary of rainfall used to calculate the total rainfall for the June 22, 2009, sampling event
Date and time Rainfall (inches) Date and time
Rainfall (inches)
6/17/2009 12:15 0.01 6/18/2009 6:00 0.05
6/17/2009 22:15 0.01 6/18/2009 6:15 0.13
6/17/2009 22:30 0.01 6/18/2009 6:30 0.15
6/18/2009 0:00 0.05 6/18/2009 6:45 0.01
6/18/2009 0:30 0.01 6/18/2009 7:00 0.01
6/18/2009 0:45 0.01 6/18/2009 7:15 0.01
6/18/2009 1:15 0.03 6/18/2009 12:45 0.11
6/18/2009 1:30 0.02 6/18/2009 13:00 0.08
6/18/2009 1:45 0.01 6/20/2009 8:00 0.02
6/18/2009 2:00 0.02 6/20/2009 8:15 0.02
6/18/2009 2:30 0.01 6/20/2009 8:30 0.08
6/18/2009 3:00 0.01 6/20/2009 8:45 0.01
6/18/2009 4:00 0.01 6/20/2009 10:30 0.01
6/18/2009 4:15 0.02 6/20/2009 10:45 0.22
6/18/2009 4:30 0.01 6/20/2009 11:00 0.02
6/18/2009 4:45 0.04 6/20/2009 11:15 0.01
6/18/2009 5:00 0.05 6/20/2009 13:30 0.01
6/18/2009 5:15 0.1 6/20/2009 13:45 0.06
6/18/2009 5:30 0.13 6/21/2009 7:15 0.01
6/18/2009 5:45 0.03 Total rainfall 1.61

Final Anacostia River Watershed Trash TMDLs August 2010
34
The trash point source loading rates (pounds/acre/inch) for each sampling event at each site were averaged across the year to obtain a single waste loading rate for each sample site. The unit loading rates were converted to annual loading rates by multiplying by the 50-year (1953–2002) average annual rainfall at the BARC station (41.13 inches/year). Table 16 summarizes the average annual loading rate for each site and the size of the associated drainage area. A complete rainfall data set was not available for the November sampling event of trash net location SC-TN. As a result, the November trash collection data were excluded from the calculation of the loading rate at SC-TN. Table 16 Loading rates for the trash traps and trash nets
Sampling location Sample type Acres
Average loading rate
(lbs/ac/yr)
NWB-SD1 Trash trap 6.86 1.195 SC-SD1 Trash trap 4.22 1.816 LPB-SD1 Trash trap 2.34 19.263 IC-SD1 Trash trap 226.02 1.374 SC-SD2 Trash trap 64.90 3.081 NWB-SD2 Trash trap 3.08 6.063 LBC-TN (Flagstaff Street) Trash net 40.76 8.346 SC-TN (Ray Road) Trash net 439.25 1.578
To determine the land use waste loading rates, the land use breakdown for the drainage areas of the storm drain outfall sampling sites were used. The land use percentages for each sampling location are shown in Table 17. Table 17. Sample site drainage area land use distribution (percentage)
Sampling site Low-density residential
Medium-density
residential High-density residential
Commercial, industrial, and
institutional Open land Forest
NWB-SD1 98% 0% 0% 0% 0% 2% SC-SD1 0% 0% 2% 80% 14% 4% LPB-SD1 0% 100% 0% 0% 0% 0% SC-TN 0% 14% 18% 13% 2% 3% IC-SD1 0% 32% 2% 61% 1% 4% SC-SD2 0% 72% 4% 18% 0% 6% NWB-SD2 0% 0% 76% 0% 24% 0% LBC-TN 0% 15% 85% 0% 1% 0%
Open Land, Forest, and Agriculture Because there was insufficient acreage in the sample drainage areas, open land, forests, agricultural lands were all assumed to have the same waste loading rate as the District’s Parks and Open Space land use, which is 0.32 lb/ac/yr. Low-Density Residential Because 98 percent of site NWB-SD1 was low-density residential land use, that site was used to derive the low-density residential waste loading rate in Maryland: 1.195 lb/ac/yr. Medium-Density Residential Site LPB-SD1 was 100 percent medium-density residential land use, so the waste loading rate at site LPB-SD1 was assumed to be representative of the waste loading rate for medium-density residential land: 19.263 lb/ac/yr.

August 2010 Final Anacostia River Watershed Trash TMDLs
35
High-Density Residential The high-density residential land use waste loading rate was calculated by using site NWB-SD2, which had 76 percent high-density residential land use and 24 percent parkland. The waste loading rate for parkland is assumed to be 0.32 lb/ac/yr, so the waste loading rate for the remaining 76 percent of the land was algebraically back-calculated from the known loading rate of NWB-SD2, using the following formula:
6.063 lb/ac/yr = 0.76x + 0.24(0.32 lb/ac/yr) → x = 7.88 lb/ac/yr Commercial, Industrial, and Institutional Commercial, industrial, and institutional land uses were aggregated because they are considered to have the same waste loading rate. On the basis of the similarity between the commercial, industrial, and institutional waste loading rates established in the District, it is reasonable to assume the waste loading rates for these same land uses in Maryland would also be similar to each other. The commercial/industrial/institutional land use waste loading rate was determined by back-calculating from the waste loading rate at site SC-SD1, which is composed of 80 percent commercial, industrial, and institutional land and 20 percent open land and forest. Note that 2 percent of the drainage area at this site is categorized as high-density land use; however, after an examination of available geospatial data, it appears that that was an error in the delineation of the drainage area boundary and that no high-density uses exist in the drainage area of the site. Extractive, Transportation, and Bare Ground Extractive, transportation, and bare ground land uses were not represented in the monitoring site drainage areas. The commercial/institutional/industrial waste loading rate was applied to extractive, transportation, and bare ground lands because those land uses tend to be found in conjunction with each other in this watershed. Water and Wetlands Following the protocol from the District’s land use waste loading rate calculations, water and wetlands were assumed to have a loading rate of zero. Table 18 and Table 19 summarize the baseline loading rates for each land use and the total annual load for each land use in Montgomery and Prince George’s Counties. The resulting total annual point source baseline load is 243,255 pounds for Montgomery County and 314,053 pounds for Prince George’s County. Table 18. Montgomery County land use baseline loading rates and total annual baseline load
Land use Aggregated land use
category Acres Loading rate
(lbs/ac/yr) Annual baseline
load (lbs/yr)
Low-density residential Low-density residential
10,033.58 1.19 11,939.96
Medium-density residential
Medium-density residential
10,471.60 19.26 201,683.01
High-density residential High-density residential
1,996.87 7.88 15,735.34
Commercial Commercial 1,130.82 2.22 2,510.42
Industrial Industrial 786.50 2.22 1,746.03
Institutional Institutional 2,518.92 2.22 5,592.00
Extractive Other developed 45.04 2.22 99.99
Open urban land Parkland 2,928.63 0.32 937.16
Cropland, Pasture, Orchards/ vineyards/horticulture,
Agricultural 1,498.74 0.32 479.60

Final Anacostia River Watershed Trash TMDLs August 2010
36
Land use Aggregated land use
category Acres Loading rate
(lbs/ac/yr) Annual baseline
load (lbs/yr) Feeding operations
Deciduous forest, Evergreen forest, Mixed forest, Brush
Forest 6,947.39 0.32 2,223.17
Water Water 46.07 0.00 0.00
Bare ground Barren 138.92 2.22 308.40
Total 38,543.1 ----- 243,256
Table 19. Prince George’s County land use baseline loading rates and total annual load
Land use Aggregated land use
category Acres Loading rate
(lbs/ac/yr)
Annual baseline waste loading
rate (lbs/yr)
Low-density residential Low-density residential
967.14 1.19 1,150.90
Medium-density residential
Medium-density residential
11,816.92 19.26 227,593.90
High-density residential High-density residential
6,366.64 7.88 50,169.12
Commercial Commercial 3,118.35 2.22 6,922.74
Industrial Industrial 3,399.92 2.22 7,547.82
Institutional Institutional 4,773.42 2.22 10,596.99
Extractive Other developed 1,147.91 2.22 2,548.36
Open urban land Parkland 2,785.88 0.32 891.48
Cropland, pasture, row and garden crops, agricultural buildings
Agricultural 3,459.18 0.32 1,106.94
Deciduous forest, evergreen forest, mixed forest, brush
Forest 15,028.98 0.32 4,809.27
Water Water 273.90 0.00 0.00
Wetlands Wetlands 47.17 0.00 0.00
Bare ground Barren 146.99 2.22 326.32
Transportation Transport 175.30 2.22 389.17
Total 53,507.7 ----- 314,055
4.1.5. Montgomery and Prince George’s County Nonpoint Source Loading Rates
Maryland’s nonpoint source baseline loading rate was established using data collected from quarterly stream surveys. In establishing the nonpoint source baseline loading rate, only items that are generally considered too large to move through the sewer system were counted. That distinction is consistent with the methodology for determining the baseline nonpoint source load in the District. Table 20 summarizes the trash types considered part of the nonpoint source load. Table 20. Trash types considered part of the nonpoint source base load
Trash type
Quart size oil containers Tires Wooden pallets
Oil filters Bricks Metal
Antifreeze containers Concrete Shopping carts

August 2010 Final Anacostia River Watershed Trash TMDLs
37
Trash type
Large auto body parts Lumber Sporting goods
Small auto body parts Miscellaneous construction materials Cloth/clothing/carpeting
Batteries Appliances Miscellaneous items
Items such as water bottles, cans, soda bottles, food packaging, toiletries, plastic bags, and glass bottles were excluded from the calculation of the nonpoint source load because they are small enough to move through the sewer system and are therefore associated with the baseline point source wasteload. To calculate the baseline nonpoint source load, the count per type of material was averaged across all sampling events (n = 4) at each site to obtain a single average count per year for each type of trash for each sampling site. To establish separate loading rates for each county, trash counts for each material were then averaged across all sites in Montgomery County and across all sites in Prince George’s County. That resulted in two distinct annual loading rate counts per 500 feet (the length of each sampling segment) in the two Counties. Once unique loading rates for each type of trash in each county were established, the values were extrapolated to all stream miles within each county to get the county-wide trash count loading rate. On the basis of the MWCOG Anacostia Streams and Waterbodies 2005 DEM (2009) data set, the total stream length of the Anacostia River and tributaries in Montgomery County is 677,766 feet and 882,226 feet in Prince George’s County. To convert from a trash count to a trash weight, each trash type was assigned a standardized weight using the trash weights established in the Anacostia Watershed Trash Reduction Plan (Anacostia Watershed Society 2008). The standardized trash weights were multiplied by the county-wide counts, resulting in county-wide trash loading rates in pounds. Table 21 summarizes the annual loading rates per 500 feet of stream, the estimated total trash count for each county’s portion of the watershed, and the estimated total annual trash load by trash type for each county. The final baseline nonpoint source load is 65,945.2 pounds per year for Montgomery County and 347,958.3 pounds per year for Prince George’s County.

Final Anacostia River Watershed Trash TMDLs August 2010
38
Table 21. County-wide annual trash counts, weights, and total county load by trash type
Cloth/ clothing/ carpeting
Oil quarts
Oil filters
Anti-freeze
Body large > 1'
Body small < 1' Batteries Tires Bricks Concrete Lumber
Misc. const. Appliance
Wooden pallets Metal
Shop carts Sports Misc.
Montgomery County Average Count Per 500 Feet
3.32 0.07 0.10 0.00 0.07 0.40 0.00 0.65 5.20 7.32 1.47 1.93 0.02 0.00 4.70 0.00 2.35 4.02
Prince George’s County Average Count Per 500 Feet
18.48 0.37 0.12 0.12 2.95 5.72 0.03 7.20 21.42 12.20 3.57 4.92 0.45 0.05 23.45 0.45 2.833 18.23
Montgomery County Item Count for All Stream Feet
4,495.85 90.37 135.55 0.00 90.37 542.21 0.00 881.10 7,048.77 9,917.97 1,988.11 2,620.70 22.59 0.00 6,370.10 0.00 3,185.50 5,444.72
Prince George’s County Item Count for All Stream Feet
32,612.96 646.97 205.85 205.85 5,205.13 10,086.79 58.82 12,704.06 37,788.69 21,526.32 6,293.21 8,675.22 794.00 88.22 41,376.41 794.00 4,999.28 32,171.85
Standard Estimated Weights (lbs)
0.63 0.19 1.56 1.56 5.00 1.56 5.00 5.00 2.25 2.25 2.25 2.25 10.00 4.00 0.03 10.00 0.88 1.00
Montgomery County Total Item Weight for Entire County
2,809.90 16.94 211.80 0.00 451.84 847.21 0.00 4,405.48 15,859.72 22,315.44 4,473.26 5,896.56 225.92 0.00 199.09 0.00 2,787.31 5,444.72
Prince George’s County Total Item Weight for Entire County
20,383.10 121.31 321.65 321.64 26,025.67 15,760.60 294.08 63,520.28 85,024.54 48,434.21 14,159.73 19,519.25 7,940.04 352.89 1,293.01 7,940.04 4,374.37 32,171.85
Montgomery County total baseline nonpoint source load (lbs/yr) 65,945.2
Prince George’s County total baseline nonpoint source load (lbs/yr) 347,958.3

August 2010 Final Anacostia River Watershed Trash TMDLs
39
5. TOTAL MAXIMUM DAILY LOAD A TMDL is the total amount of pollutant that can be assimilated by the receiving waterbody while still achieving water quality standards or goals. It is composed of the sum of individual WLAs for point sources and LAs for nonpoint sources and natural background levels. In addition, the TMDL must include an MOS, implicitly or explicitly, to account for any uncertainty in the relationship between pollutant loads and the quality of the receiving waterbody. Conceptually, this definition is represented by the following equation:
TMDL = WLAs + LAs + MOS In TMDL development, allowable loadings from each pollutant source are summed to a cumulative TMDL threshold, thus providing a quantitative basis for establishing water quality-based controls. TMDLs can be expressed as a mass loading over time (e.g., grams of pollutant per day) or as a concentration in accordance with 40 CFR 130.2(l). The District and State of Maryland reserve the right to revise these allocations, with approval from EPA, if the revised allocations are consistent with the achievement of water quality standards. 5.1. TMDL Endpoints
TMDL endpoints represent the water quality targets used to quantify TMDLs and their individual components. In this TMDL, the endpoint is equal to 100 percent removal of the baseline load, calculated as an average (because of high seasonal and annual variability) of the measured or estimated removal rate. The baseline load is defined as the annual trash load calculated from monitoring data obtained through storm drain and CSO monitoring and in-stream sampling. The baseline load represents a typical annual load. The numeric target is derived from the narrative water quality criteria and includes both an explicit and an implicit MOS. As presented in Section 1.4, the narrative water quality criteria in both jurisdictions describe the level of trash in subjective terms such as objectionable, nuisance, and unsightly. EPA’s Quality Criteria for Water 1986 (known as the Gold Book) (USEPA 1986) states with respect to aesthetic uses that such “concepts may vary within the minds of individuals encountering the waterway,” i.e., a narrative was constructed in the first place because an objective, quantifiable threshold cannot be developed. Accordingly, the TMDL is expressed as the quantity of trash that must be captured or removed for the waterbody to achieve the narrative criteria, rather than as the amount of trash that can be added to the waterbody without being objectionable, unsightly or constituting a nuisance. A TMDL target equal to 100 percent removal of the baseline load is not the same as zero (0) trash in the waterway, but it should result in compliance with the narrative standard, as determined by the agencies responsible for interpreting the standard. This target provides an objective and measurable basis for compliance, consistent with stormwater and other discharge permits. No water quality standards exist that are zero, even for extremely toxic substances. While there might be a quantity of trash that could be discharged to the Anacostia River before being deemed by the general public as objectionable, and the like, it is not necessary to calculate that quantity for purposes of this TMDL. Whatever that level might be, the District and Maryland have concluded that removal of 100 percent of the baseline load would achieve the applicable narrative water quality criteria. Removal of 100 percent of the baseline load also would be sufficient to avoid interference with designated uses. 5.2. Detailed Source Allocations
5.2.1. Load Allocations
The LA is the portion of the TMDL that is allocated to nonpoint sources and background levels. The target LA for trash in the Anacostia River is 100 percent removal of the baseline load calculated as an average. As described in Section 1.5, the District and Maryland interpret that endpoint as sufficient to achieve applicable narrative water quality criteria. The TMDL is expressed in terms of quantity removed, rather than quantity added to the waterbody. The load to be removed is summarized in Table 22.

Final Anacostia River Watershed Trash TMDLs August 2010
40
Table 22. Summary of Annual and Daily Load allocations
Jurisdiction
Annual Baseline Nonpoint Source Load
(lbs/yr)
MOS (5%) Annual LA to be removed
(lbs/yr)
Daily LA to be removed (lbs/day)
Montgomery County 65,945 3,297 69,242 189.7
Prince George’s County 347,958 17,398 365,356 1,001.0
District of Columbia Upper Anacostia
18,343 917 19,260 52.8
District of Columbia Lower Anacostia
1,705 85 1,790 4.9
5.2.2. Wasteload Allocations
Federal regulations (40 CFR 130.7) require TMDLs to include individual WLAs for each point source. WLAs were developed for the District’s CSO and MS4 systems, the Montgomery and Prince George’s Counties’ Phase I MS4 systems, the Montgomery and Prince George’s Counties’ Phase II Municipality MS4 systems, the Maryland State Highway Administration, federal facilities, and other smaller point sources. A complete list of NPDES permitted facilities in Maryland appears in Appendix A. Municipal Separate Storm Sewer System (MS4)
EPA’s stormwater permitting regulations require municipalities to obtain permit coverage for all stormwater discharges from urban MS4s. A November 22, 2002, EPA memorandum from Robert Wayland and James Hanlon, Water Division Directors, clarifies existing regulatory requirements for MS4s connected with TMDLs (USEPA 2002). The key points are as follows:
NPDES-regulated MS4 discharges must be included in the WLA component of the TMDL and may not be addressed by the LA component of TMDL.
The stormwater allotment can be a gross allotment and does not need to be apportioned to specific outfalls. Available data and information are frequently not detailed enough to determine WLAs for NPDES-regulated stormwater discharges on an outfall-specific basis. In such a situation, WLAs can be expressed in the TMDL as either a single number for all NPDES-regulated stormwater discharges.
Industrial stormwater permits need to reflect technology-based and water quality-based requirements.
On the basis of that memorandum, MS4s are treated as point sources for the TMDL, and the trash loading generated within the boundary of an MS4 area was assigned a WLA. That can be further broken down by individual NPDES permittees on the basis of the land use distribution within each permit coverage area. Table 23 summarizes the individual baseline wasteloads to be removed for MS4 NPDES permittees in Maryland and the District. Combined Sewer Overflows (CSOs)
On the basis of the District of Columbia Combined Sewer System Long Term Control Plan (2002), the estimated CSO overflow volume in an average year is 1.282 billion gallons. It is assumed that the current condition of the combined sewer system represents the Scenario with Phase I controls and pump station rehabilitation. The annual average overflow volume in the Upper Anacostia CSO drainage area is 854.81 million gallons, and in the Lower Anacostia CSO drainage area, it is 427.19 million gallons. Given the known trash loading rate (73 pounds per million gallons of overflow) and the average overflow volumes, the estimated baseline trash load from the District CSO system is 93,586 pounds per year. For the CSS, the annual load is the LTCP average year. This is the average of the loads for the years 1988, 1989 and 1990. Table 23 provides a summary of the baseline wasteload to be removed or captured from discharges from the CSS.

August 2010 Final Anacostia River Watershed Trash TMDLs
41
Other Point Sources
Other point sources include areas of Montgomery and Prince George’s Counties that are not covered under the municipal, county, state highway, or federal MS4 NPDES permits and areas of the District that are not covered under the District MS4 or CSO NPDES permits. These include industrial permitted facilities and other private or state-owned properties. ). The other point source baseline loads were established using the land-use-based trash loading rates from Maryland and the District stormwater outfall monitoring and the land use distribution within each drainage area. The point source baseline wasteloads to be removed are summarized in Table 23.

Final Anacostia River Watershed Trash TMDLs August 2010
42
Table 23. Summary of Annual and Daily Waste Load Allocations
Permittee Subbasin
NPDES permit
number
Baseline WLA to be removed (lbs/yr)
MOS (5%)
WLA to be removed (lbs/yr)
Total WLA to be
removed (lbs/yr)
Total daily WLA to be removed (lbs/day)
Little Paint Branch 29,122 1,456 30,578 83.8 Paint Branch 72,259 3,613 75,872 207.9 Northwest Branch 120,865 6,043 126,908 347.7
Montgomery County Phase I MS4
Sligo Creek
MD0068349
6,437 322 6,759
240,117
18.5 Sligo Creek 1,236 62 1,298 3.6 Montgomery
County Phase II MS4 - Takoma Park
Lower Northwest Branch
MDR055500 3,893 195 4,088
5,386 11.2
Maryland State Highway Administration – Montgomery County
MD0068276 5,756 288 6,044 16.6
Federal permits – Montgomery County
MDR055501 (General Permit)
1,657 83 1,740 4.8
Other NPDES permits – Montgomery County
Aggregated 2,031 102 2,133 5.8
Beaverdam Creek 6,004 300 6,304 17.3 Lower Beaverdam Creek
23,437 1,172 24,609 67.4
Cabin Branch 14,301 715 15,016 41.1 Indian Creek 17,866 893 18,759 51.4 Little Paint Branch 25,560 1,278 26,838 73.5 Northwest Branch 35,376 1,769 37,145 101.8 Northeast Branch 31,190 1,560 32,750 89.7 Paint Branch 1,080 54 1,134 3.1
Prince George’s County MS4 – Non-tidal
Watts Branch
MD0068284
4,479 224 4,703
167,258
12.9 Prince George’s County MS4 – Tidal
MD0068284 11,335 567 11,902 32.6
Beaverdam Creek 1,932 97 2,029 5.6 Lower Beaverdam Creek
15,401 770 16,171 44.3
Cabin Branch 3,060 153 3,213 8.8 Indian Creek 105 5 110 0.3 Little Paint Branch 2,882 144 3,026 8.3 Northwest Branch 4,886 244 5,130 14.1 Northeast Branch 56,982 2,849 59,831 163.9 Watts Branch 4,035 202 4,237 11.6
Prince George’s County Phase II MS4 - Aggregated
Tidal
MDR055500
24,295 1,215 25,510
119,257
69.9 Maryland State Highway Administration – Prince George’s County
MD0068276 13,461 673 14,134 38.7
Federal permits – Prince George’s County
MDR055501 (General Permit)
5,890 295 6,185 16.9
Other NPDES permits – Prince George’s County
Aggregated 10,498 525 11,023 30.2
Total MD Point Source Load
585,179 1,603.2

August 2010 Final Anacostia River Watershed Trash TMDLs
43
Permittee Subbasin
NPDES permit
number
Baseline WLA to be removed (lbs/yr)
MOS (5%)
WLA to be removed (lbs/yr)
Total WLA to be
removed (lbs/yr)
Total daily WLA to be removed (lbs/day)
District of Columbia MS4
Upper Anacostia 79,874 3,994 83,868 108,347 229.8
Lower Anacostia
DC0000221
23,314 1,166 24,480 67.1 District of Columbia CSO
Upper Anacostia 62,401 3,120 65,521 98,265 179.5
Lower Anacostia
DC0021199
31,185 1,559 32,744 89.7 District of Columbia – Other
Upper Anacostia 7,879 394 8,273 15,053 22.7
Lower Anacostia 6,457 323 6,780 18.6 District of Columbia total point source load
221,665
607.3
Note: A complete list of NPDES permitted facilities in Maryland appears in Appendix A.

Final Anacostia River Watershed Trash TMDLs August 2010
44
5.2.3. Margin of Safety
Clean Water Act section 303(d) requires that a TMDL incorporate an MOS to account for any uncertainty or lack of knowledge concerning the relationship between pollutant loading and water quality. The MOS can be implicit (e.g., incorporated into the TMDL analysis through conservative assumptions) or explicit (e.g., expressed in the TMDL as a portion of the loadings) or a combination of both. The Anacostia Trash TMDL employs both an explicit and implicit MOS. An explicit MOS of 5 percent was incorporated into the Anacostia Trash TMDL. Since the TMDL requires 100 percent removal of the baseline load, the MOS was incorporated into LAs and WLAs as an additional 5 percent of the baseline load that must be removed. Additionally, conservative assumptions were incorporated into the allocations. The WLAs are conservative estimates of actual loads because they were calculated under the assumption that all land in the watershed (including non-point source lands not regulated under NPDES stormwater permits) contributes to the point source trash load. The LAs are conservative estimates of actual loads because the entire stream length of all tributaries and the mainstem of the Anacostia were used in the calculation of the nonpoint source loads. 5.3. Anacostia Watershed Trash TMDL Summary
Table 24 through Table 31 describe the TMDLs for each segment of the watershed. The TMDLs are expressed in terms of the quantity of trash that must be removed, rather than the quantity that may be added to the waterbody. TMDLs must be expressed in terms of a daily load. For this TMDL the calculated annual quantity of trash that must be remove was divided by 365 days to obtain the daily load. Compliance with these TMDLs will require the removal of 100 percent of the daily baseline trash load calculated as an average. Table 24. Daily trash TMDLs for Montgomery County portion of the Anacostia watershed
WLA (lbs/day removed)
LA (lbs/day removed)
MOS (5%)
TMDL (lbs/day
removed) Montgomery County Phase I MS4 626.5
Montgomery County Phase II Municipal MS4 - Takoma Park
14.1
Montgomery County State Highway Administration 15.8
Montgomery County Federal Facilities 4.5
Montgomery County Other Point Sources 5.6
Total WLA 666.5
180.7 42.4 889.5
Note: lbs = pounds; MS4 = municipal separate storm sewer system
Table 25. Annual trash TMDLs for Montgomery County portion of the Anacostia watershed
WLA (lbs/yr removed)
LA (lbs/yr removed)
MOS (5%)
TMDL (lbs/yr removed)
Montgomery County Phase I MS4 228,683
Montgomery County Phase II Municipal MS4 - Takoma Park
5,129
Montgomery County State Highway Administration 5,756
Montgomery County Federal Facilities 1,657
Montgomery County Other Point Sources 2,031 Total WLA 243,256
65,945 15,460 324,660

August 2010 Final Anacostia River Watershed Trash TMDLs
45
Table 26. Daily trash TMDLs for Prince George’s County portion of the Anacostia watershed
WLA (lbs/day removed)
LA (lbs/day
removed) MOS (5%)
TMDL (lbs/day
removed)
Prince George’s County Phase I MS4 Non-tidal 436.4
Prince George’s County Phase I MS4 Tidal 31.1
Prince George’s County Phase II Municipal MS4s 311.2
Prince George’s County Federal Facilities 16.1
Prince George’s County State Highway Administration 36.9
Prince George’s County Other Point Sources 28.8 Total WLA 860.5
953.3 90.7 1904.4
Table 27. Annual trash TMDLs for Prince George’s County portion of the Anacostia watershed
WLA (lbs/yr removed)
LA (lbs/yr
removed) MOS (5%)
TMDL (lbs/yr
removed)
Prince George’s County Phase I MS4 Non-tidal 159,293
Prince George’s County Phase I MS4 Tidal 11,335
Prince George’s County Phase II Municipal MS4s 113,578
Prince George’s County Federal Facilities 5,890
Prince George’s County State Highway Administration 13,461
Prince George’s County Other Point Sources 10,498 Total WLA 314,055
347,958 33,101 695,114
Table 28. Daily trash TMDL for the District’s upper portion of the Anacostia watershed
WLA (lbs/day removed)
LA (lbs/day
removed) MOS (5%)
TMDL (lbs/day
removed) DC Upper Anacostia MS4 218.8
DC Upper Anacostia CSO 171.0
DC Upper Anacostia Other Point Sources 21.6 Total WLA 411.4
50.3 23.1 484.7
Table 29. Annual trash TMDL for the District’s upper portion of the Anacostia watershed
WLA (lbs/yr removed)
LA (lbs/yr removed)
MOS (5%)
TMDL (lbs/yr removed)
DC Upper Anacostia MS4 79,874
DC Upper Anacostia CSO 62,401
DC Upper Anacostia Other Point Sources 7,879 Total WLA 150,154
18,343 8,425 176,922
Table 30. Daily trash TMDL for the District’s lower portion of the Anacostia watershed
WLA (lbs/day removed)
LA (lbs/day
removed) MOS (5%)
TMDL (lbs/day
removed) DC Lower Anacostia MS4 63.9
DC Lower Anacostia CSO 85.4
DC Lower Anacostia Other Point Sources 17.7 Total WLA 167.0
4.7 8.6 180.3

Final Anacostia River Watershed Trash TMDLs August 2010
46
Table 31. Annual trash TMDL for the District’s lower portion of the Anacostia watershed
WLA (lbs/yr removed)
LA (lbs/yr removed)
MOS (5%)
TMDL (lbs/yr removed)
DC Lower Anacostia MS4 23,314
DC Lower Anacostia CSO 31,185
DC Lower Anacostia Other Point Sources 6,457 Total WLA 60,955
1,705 3,133 65,794
5.4. Critical Conditions and Seasonal Variations
According to EPA’s regulation 40 CFR 130.7 (c)(1), TMDLs are required to take into account critical conditions for stream flow, loading, and water quality parameters. The intent of this requirement is to ensure that water quality is protected during times when it is most vulnerable.
Critical conditions are important because they describe the factors that combine to cause a violation of water quality standards and will help in identifying the actions that may have to be undertaken to meet water quality standards (USEPA 1999). Critical conditions are a combination of environmental factors (e.g., flow, temperature, etc.), which have an acceptably low frequency of occurrence. In specifying critical conditions in the waterbody, an attempt is made to use a reasonable “worst-case” scenario condition. For example, stream analysis often uses a low flow (7Q10) design condition because the ability of the waterbody to assimilate pollutants without exhibiting adverse impacts is at a minimum. In the Anacostia Watershed, the critical conditions for trash are high flow events because these events represent conditions during which trash is most easily transported to and through streams and the sewer system. These critical conditions are accounted for in this TMDL because data were collected over four seasons and included monitoring after rain events that led to high flow conditions. Monitoring activities were conducted after a range of rainfall conditions, including several storms events with totals over 0.5 inches of rain, at least one storm with over 3 inches of rain during the event, and several storms with maximum intensities between 3 and 4 inches per hour. The annual rainfall for 2008 (46.49 inches) and 2009 (46.90 inches) was well above the long-term average annual rainfall of 39.35 inches (National Weather Service 2010). Further, the season rainfall averages were within about an inch of the long-term seasonal average, except for the spring of 2009 when 14.24 inches of rain fell, well above the long-term spring average of 9.00 inches (National Weather Service 2010). Data collection over the four seasons also accounted for possible localized seasonal variation in trash loading due to the large number of sites at which data were collected. The 50-year average annual rainfall was used to account for long-term conditions in the watershed. For the CSS, the critical condition is addressed through the hydrological variability of the three years (1988, 1989 and 1990) used to develop the LTCP.

August 2010 Final Anacostia River Watershed Trash TMDLs
47
6. REASONABLE ASSURANCE FOR TMDL IMPLEMENTATION When a TMDL is developed for waters impaired by point sources only, the issuance of an NPDES permit(s) provides the reasonable assurance that the WLAs in the TMDL will be achieved. That is because 40 CFR 122.44(d)(1)(vii)(B) requires that effluent limits in permits be consistent with “the assumptions and requirements of any available [WLA]” in an approved TMDL. When a TMDL is developed for waters impaired by both point and nonpoint sources, and the WLA is based on an assumption that nonpoint source load reductions will occur, the TMDL should provide reasonable assurances that nonpoint source control measures will achieve expected load reductions. TMDLs represent an attempt to quantify the pollutant load that can be present in a waterbody and still ensure attainment and maintenance of water quality standards. The Anacostia River Trash TMDLs identify baseline loads, representative of typical annual trash loads to the watershed, and call for 100 percent removal of the baseline loads, calculated as an average of the measured or estimated removal or capture rate. The reduction goal is distributed between both point and nonpoint sources of trash. WLAs are assigned to MS4, CSO, and otherwise regulated land uses and address trash items that can typically travel through a sewer system. The LA is assigned to larger trash and debris that are attributed to activities such as dumping. The reduction goals established by these TMDLs will be reached through NPDES permits and the District’s Long-Term Control Plan (LTCP) for CSOs to achieve WLAs, and other source controls to achieve LAs. In the case of the Anacostia Trash TMDLs, there is reasonable assurance that the goals of these TMDLs can be met with proper watershed planning, implementing pollution-reduction BMPs, and using strong political and financial mechanisms. The TMDLs can be achieved through a comprehensive, adaptive approach that addresses the following:
Appropriate storm drain capture technologies
Illicit dumping
Regulatory and voluntary approaches to trash removal and prevention
The following sections provide additional detail related to programs, policies and regulatory mechanisms available to ensure implementation of this TMDL.
6.1. Anacostia Watershed Trash Reduction Strategy
Cleanup efforts for the watershed began in the late 1980s with the signing of the Anacostia Watershed Agreement in 1987 by the District of Columbia; Montgomery and Prince George’s Counties, Maryland; and the state of Maryland. The Anacostia Watershed Trash Reduction Strategy prepared by the MWCOG’s Anacostia Watershed Restoration Partnership (2007), outlines the extent of the trash problem in the Anacostia River, as well as the policy statements and strategies for implementing the six high-priority trash-reduction objectives. The six objectives, and some of the associated strategies, are
Significantly increase funding for trash reduction programs o Seek congressional funding to implement the Anacostia Watershed Trash Reduction
Strategy o Use BMPs and best available technologies throughout the watershed to the maximum extent
practicable o Encourage new and redevelopment projects to incorporate trash-reduction-related measures
Create and enhance regional partnerships and coordination among businesses, environmental groups, individual citizens, and government at all levels and in all jurisdictions
Final Anacostia River Watershed Trash TMDLs August 2010
48
o Each jurisdiction and the Anacostia Watershed Restoration Committee will work with stakeholder groups to prioritize needs and provide technical assistance and training
Improve people’s awareness, knowledge, and behavior relating to littering and illegal dumping o Enhance and expand environmental education programs in schools and parks o Increase public awareness and publicize good behavior o Create incentives to change littering and illegal dumping behaviors
Promote the greater introduction and use of effective trash-reduction technologies and approaches o Coordinate the evaluation of technologies and trash-reduction approaches and the
dissemination of information through the Anacostia Watershed Restoration Committee, Alice Ferguson Foundation, and others
o Publicize information, pilot projects, and proven technologies o Facilitate share programs where smaller jurisdictions can share the purchase and operating
costs of large, efficient street sweepers Improve enactment and enforcement of laws to reduce trash
o Determine feasibility of instituting payments for returned glass and plastic bottles o Investigate the costs and benefits of expanding Business Improvement Districts and Central
Business Districts litter-reduction efforts into other areas o Provide better surveillance of known dumping hot spots through the use of real-time video
monitoring o Establish new Friends of groups in the watershed o Urge the adoption of trash-related community service as an alternative to environmental
crime-related fines Increase trash monitoring-related data collection, generation, and dissemination efforts
o Provide adequate funding for long-term stream and land-based trash surveys o Monitor trash catching devices to measure effectiveness o Record tonnage of trash collected through various programs and projects
6.1.1. Efforts underway in Montgomery County, Maryland
The following activities and programs were identified in the Anacostia Trash Reduction Strategy (MWCOG 2007).
The Montgomery County Department of Public Works and Transportation (DPWT) runs the Adopt-a-Road Program, which focuses on public awareness and involvement in trash management. There are 205 participants who adopted road segments and agree to six major road cleanups per year.
M-NCPPC provides anti-litter and anti-dumping enforcement and support volunteer cleanups. In 2005, 71 cleanups occurred.
Montgomery County Department of Environmental Protection (MCDEP) received $500,000 to conduct a pilot project in the White Oak subwatershed to implement and monitor BMPs to control trash.
MCDEP provides support for illegal dumping enforcement, outreach, and research and monitoring. MCDEP and the Montgomery County DPWT conduct street sweeping covering about 2,200 curb
miles and occurring once a year. The Urban Business Partnership conducts street sweeping three times a week and covers about 55
curb miles. M-NCPPC operates volunteer cleanups and include about 5,700 volunteer hours. DPWT conducts recycling enforcement and has about 400 enforcement actions a year. MCDEP and the Park Police monitor illegal dumping and combined enforce 300–400 actions a year.
6.1.2. Efforts underway in Prince George’s County
The following activities and programs were identified in the Anacostia Trash Reduction Strategy (MWCOG 2007).

August 2010 Final Anacostia River Watershed Trash TMDLs
49
The county runs the Livable Communities Initiative Blight Control Program, which helps communities in crisis to remove litter and debris. Collections in the spring and fall yielded 17.04 tons of trash, collected by more than 1,400 volunteers.
The county held 7 cleanups from October 2004 to October 2005, including the large Earth Day event, and collected 59,550 pounds of trash and 277 tires.
The county stenciled 76 storm drains in 2005 to educate the public on the connection to the waterways.
The county operates numerous recycling programs including ReMix, which encourages magazine recycling, e Cycling, which encourages recycling of electronics and hazardous wastes, and Go Recycle, a regional radio campaign to encourage recycling.
The county stenciled storm drains in older communities to bring awareness to the storm drain drainage to the Chesapeake Bay
6.2. Potomac River Watershed Trash Treaty
In March 2005, the Alice Ferguson Foundation brought attention to the trash-related problems in the Potomac River and its tributaries through the Potomac River Watershed Trash Treaty, creating a forum for recognition of the problem, as well as a commitment to work towards solutions. The Trash Treaty had six founding signers, and has since gained a total of 140 signers with representatives from town, county, state and federal governments within the Potomac Watershed, including the Anacostia River. The Trash Treaty commits the signers to achieving a “Trash Free Potomac” by supporting and implementing regional strategies aimed at reducing trash and increasing recycling; increasing education and awareness of the trash issue throughout the Potomac Watershed; and reconvening annually to discuss and evaluate measures and actions addressing trash reduction. The Alice Ferguson Foundation also convenes an Annual Potomac Watershed Trash Summit at which Trash Treaty signers and other stakeholders are able to collaborate on strategies for eliminating trash, as well as develop year-round problem-solving partnerships. The Trash Treaty and the Trash Summit demonstrate the commitment of political leaders and stakeholders to this issue and a willingness to collaborate on implementation of effective trash elimination strategies.
6.3. District of Columbia Anacostia Watershed Trash Reduction Plan
The Anacostia Watershed Trash Reduction Plan (Anacostia Watershed Society 2008) includes a 5-year implementation strategy and schedule to make significant and measurable progress in achieving a trash-free Anacostia River. The plan addresses only the District portion of the watershed. Legislative solutions are recommended for reducing plastic bags and Styrofoam through bans and increased bottle and can recycling through a return deposit program. Recommendations are made for enhancing the MS4 permit, expanded street sweeping, litter laws enforcement, expanding erosion control and stormwater regulations to require that BMPs include trash and litter control, and expanded public outreach. Individual trash-reduction plans are outlined for Kingman Lake and the major subbasins in the watershed.
6.3.1. Efforts Underway in the District of Columbia
Direct Trash and Debris Collection: The District’s Department of Public Works (DPW) sweeps approximately 4,000 lane miles of city
streets every month, with a focus on the Anacostia MS4 drainage area. The Anacostia River Floatable Debris Removal Program, operated by the District’s Water
and Sewer Authority (DC–WASA) in cooperation with the U.S Army Corps of Engineers, removes about 400 tons of trash per year from the Anacostia River (DC WASA 2009). Skimmer boats collect floatable debris from the Anacostia Mainstem.
DC-WASA conducts catch basin cleaning and sweeping to remove debris and trash. The MS4 permit requires annual cleanout for all storm sewer catch basins.

Final Anacostia River Watershed Trash TMDLs August 2010
50
DC-WASA continues to maintain the Fresh Creek netting system at CSO outfall #18. MWCOG estimates the system to be 83 percent efficient at capturing trash.
The NPS and the District’s Department of Parks and Recreation employ summer workers to pick up trash from the mowed areas of the parks.
Regulatory Violation Inspections DPW uses three inspectors per ward to enforce dumping, litter, and trash laws. Inspection areas are
covered monthly. The District’s Department of Consumer and Regulatory Affairs conducts housing inspections, which
includes requirements for cleanliness of street and sidewalk areas; proper trash receptacles; grounds free of junk, trash, and litter; and walkways clear of obstructions and trash. Roughly 10 percent of the violations and enforcement actions involved trash or weeds.
Other District departments responsible for enforcing trash and litter regulations include the Department of Transportation, Department of Health, and DDOE.
Clean City Initiative The District’s Clean City Initiative is an effort by the District to maintain the cleanliness of the city. Programs in the Office of the Clean City include Adopt-A-Block and the Citywide Cleanliness Assessment. Anacostia River Clean-Up & Protection Act The Anacostia River Clean-Up and Protection Act was signed by the District’s mayor on July 7, 2009. A plastic bag ban created under the law will take effect on January 1, 2010. Customers will be charged 5 cents for every disposable paper or plastic bag. The proceeds go to the Anacostia River Clean-Up and Protection Fund, which will pay for the distribution of reusable bags, public environmental education, and Anacostia River cleanup projects.
6.3.2. Subwatershed Action Plans
As part of the Anacostia Watershed Restoration Plan, the U.S. Army Corps of Engineers, along with its partners, MWCOG, the District, Montgomery and Prince George’s Counties, DNR, MDE, and M-NCPPC, has prepared Draft Final Subwatershed Action Plans (USACE 2009) for all 14 of the primary subwatersheds and the tidal river reach in the Anacostia River watershed. Each of the reports addresses the problems facing the watershed, inventories potential restoration projects, and recommends specific actions at target problem areas. Trash reduction is one of the selected strategies to improve the watersheds. Recommendations from trash removal include the use of Fresh Creek Trash Netting Systems, end-of-pipe trash catching systems, storm drain trash grates, and increased street sweeping programs. 6.4. Permit Compliance
The MS4 NPDES permits for Prince George’s County, Montgomery County, the District, and the District of Columbia CSO LTCP all require compliance with applicable TMDLs.
6.4.1. Prince George’s County MS4 NPDES Permit
The Prince George’s County NPDES Municipal Separate Storm Sewer System Discharge Permit (Permit MD0068284) expired on October 13, 2009, and as of the date of this TMDL had been administratively extended pending reissuance. Part III.J of the most recent Prince George’s County MS4 permit states
Stormwater BMPs and programs implemented as a result of this permit must be consistent with available WLAs [see 40 CFR 122.44(d)(1)(vii)(B)] developed under a TMDL. MDE has determined that owners of storm drain systems that implement the requirements of this permit will be controlling stormwater pollution to the maximum extent practicable. Therefore, satisfying the conditions of this permit will meet WLA’s specified in TMDL’s

August 2010 Final Anacostia River Watershed Trash TMDLs
51
developed for impaired water bodies. If assessment of the stormwater management program indicates TMDL WLAs are not being met, additional or alternative stormwater controls must be implemented to achieve WLAs.
6.4.2. Montgomery County MS4 NPDES Permit
The Montgomery County, Maryland NPDES Municipal Separate Storm Sewer System Discharge Permit (Permit MD0068349) is valid through March 20, 2014. Part III.J of the MS4 permits states
1. Section 402(p)(3)(B)(iii) of the Clean Water Act (CWA) states that municipal storm sewer system permits must require stormwater controls to reduce the discharge of pollutants to the Maximum Extent Practicable(MEP). By regulation at 40 CFR 122.44, EPA further requires that BMPs and programs implemented pursuant to this permit must be consistent with applicable WLAs developed under EPA approved TMDLs. The overall goals of Maryland's NPDES municipal stormwater permit program are to control stormwater pollutant discharges by implementing the BMPs and programs required by this permit, show progress toward meeting WLAs developed under EPA approved TMDLs, and contribute to the attainment of water quality standards according to the CWA.
In order to accomplish these goals, this permit requires in Part III. J. 2. below, that the County develop TMDL implementation plans that include estimates of pollutant loading reductions (benchmarks) to be achieved by specific deadlines and describe those actions necessary to meet the storm drain system's share of WLAs in EPA approved TMDLs. These implementation plans may be in addition or complementary to the watershed assessments required in PART III. F. above and include ongoing watershed restoration efforts required in this permit, as appropriate. Implementation plan benchmarks shall be based on data available to and generated by the County and used as interim goals for guiding adaptive management activities. All EPA approved TMDL’s that establish WLA’s applicable to the County’s storm drain system are incorporated by reference into this permit.
2. Within one year of the effective date of this permit or the approval of an applicable TMDL by EPA,
whichever is later, the County shall submit to MDE for review and approval a TMDL implementation plan for each EPA approved TMDLs for a watershed or portion of a watershed covered by this permit. The implementation plans shall include:
a) The actions and deadlines by which those actions must be taken to meet the required pollutant load reduction benchmarks and WLAs within the specified time frame;
b) A description of how ongoing watershed restoration efforts will be modified to address any applicable WLAs;
c) A schedule and cost estimate to implement the complete watershed restoration efforts necessary to meet established WLA benchmarks;
d) A description of a plan that will be used when benchmarks are not met and projected funding is inadequate;
e) A public participation component that includes: i. Notice in a local newspaper and the County's web site outlining how the public may obtain
information and provide comments to the County regarding implementation plans; ii. Procedures for providing the plan to interested parties upon request;
iii. A minimum 30 day comment period; and iv. A summary in the next annual report of how the County addressed or will address any
material public comments received.

Final Anacostia River Watershed Trash TMDLs August 2010
52
6.4.3. District of Columbia MS4 NPDES Permit
The District of Columbia NPDES Municipal Separate Storm Sewer System Discharge Permit (Permit DC000021) expired on August 18, 2009, and as of the date of this TMDL had been administratively extended pending reissuance. Amendments were made to the 2004 permit on March 14, 2006. Part IX B of the amended District of Columbia MS4 permit states
In addition to the duty to comply with the narrative effluent limits in Part I of this Permit, the permittee shall demonstrate compliance as described in this Part and in Part IV (Monitoring and Reporting Requirements). In accordance with the schedule identified in Part III.A. (Compliance Schedule) and Table 1 and below, Permittee shall further submit implementation plans to reduce discharges consistent with any applicable EPA-approved WLA component of any established TMDL.
The [Implementation] Plan shall consist of documenting all previous and on-going efforts at achieving the specific pollutant reductions identified in the TMDL WLA and further demonstrating additional controls sufficient to achieve those reductions through an established performance based benchmark. This benchmark shall be applied against annual projected performance standards for purposes of completing the final implementation plan when determining measurable progress to achieve adequate reduction. EPA reserves the right after a review and approval of each Plan to modify this permit for purposes of requiring additional numeric and/or narrative effluent controls on the discharge of pollutants from the MS4. EPA shall make the results of any such determination(s) in writing available to the Permittee and other interested persons including, but not limited to members of the District of Columbia MS4 Task Force. Upon approval by EPA, the TMDL implementation plan(s) shall be incorporated into the upgraded Stormwater Management Plan (SWMP) in accordance with the compliance schedule in Part III.A (Table I) and Part III.E (SWMP Upgrade) of this Permit.
The TMDL Implementation Plans shall consist of documenting all previous and on-going efforts at achieving the specific pollutant reductions identified in the TMDL WLA and further demonstrating additional controls sufficient to achieve those reductions through an established performance based benchmark. This benchmark shall be applied against annual projected performance standards for purposes of achievement of adequate reductions.
6.4.4. District of Columbia Combined Sewer System (CSS) NPDES Permit
The District of Columbia NPDES Combined Sewer System Discharge Permit (Permit DC0021199), effective February 25, 2003, was revised on June 4, 2007, expired on February 28, 2008, and as of the date of this permit had been administratively extended pending reissuance. Specifically addressing the issue of trash and debris, Part III, Section B-1.f, Technology-Based CSS Requirements—Nine Minimum Controls Program, includes the control of solid and floatable materials in CSOs by requiring the following measures:
(i) Screen pumped overflows at the Main and O Street Pumping Stations. (ii) Screen flow into the Northeast Boundary Swirl Facility. (iii) Operate and maintain end of pipe solid and floatable BMP demonstration controls until
termination of the demonstrations at locations as follows: End of pipe netting system at CSO Outfall 018. Bar rack at CSO Outfall 041 at Structure Number 62. Bar rack at CSO Outfall 040 at Structure 61. Inspect BMP demonstration controls at least once per month. Clean BMPs following wet weather events on a schedule that maintains capture functions.
(iv) Clean 85 percent of the 8200 catch basins in the combined sewer area at least annually. Inspect catch basins in CSO areas tributary to the Anacostia River at least 2 times per year and clean more frequently as identified by inspections. The Anacostia River CSO areas inspection schedule is an interim schedule until permanent solids and floatable control

August 2010 Final Anacostia River Watershed Trash TMDLs
53
facilities are placed in operation as part of the Long Term Control Plan. As permanent facilities are placed in operation, in each combined sewer area, the permittee may petition EPA to reduce the cleaning frequency to once per year in that area.
(v) Operate the Anacostia River Floatable Debris Removal Program. This program comprises pick up of debris by skimmer and support boats on a regular weekly schedule, weather and river conditions permitting.
(vi) Work on a regular and ongoing basis with the District’s DPW and the NPS to maximize litter control in the CSS, targeting neighborhoods that contribute disproportionate amounts of trash to the CSS. Document these efforts in quarterly CSO reports.
(vii) Implement an ongoing, appropriate bi-lingual (English and Spanish) public education program aimed at reducing litter in the CSO sewershed, including public service announcements, public school presentations and stenciling programs.
(viii) Hold at least four (4) public education workshop programs each year, two of which shall be held in the Anacostia River CSO areas, (e.g., at schools or to community groups) to inform the public on ways and means for the public to assist in reducing the amount of solid and floatable materials in CSOs. The workshop programs comprise a series of presentations four times per year. The need to continue these workshop programs and the schedule will be re-evaluated every 2 years and the permittee may petition EPA to reduce the number of workshops for the following two year cycle.
Part III, Section B-1.g of the Technology-Based CSS Requirements—Nine Minimum Controls Program addresses required pollution prevention measures including
(i) Conduct regular public education programs to advise citizens of proper disposal of substances (e.g., household wastes, plastics, paper products, oils, leaves and the use of fertilizer).
(ii) Conduct tours of the Blue Plains Wastewater Treatment Plant to educate public on aspects of CSO control that can be enhanced with public assistance.
(iii) Use the pretreatment program to encourage industrial waste reduction through recycling and improved housekeeping.
(iv) Notify responsible agencies to enforce regulations that prohibit entrance into the CSS of any substance that may impair or damage the function and performance of collection and treatment systems.
(v) Coordinate where feasible and practicable DC-WASA’s pollution prevention programs with those of D.C. government agencies such as the following partial list of pollutant prevention programs conducted by District of Columbia government agencies:
A. Department of Public Works Programs 1) Curbside recycling 2) Leaf pickup 3) Public trash receptacles 4) Household hazardous waste collection 5) Residential bulk refuse collection and self-service disposal 6) Campaign against rats 7) Support of community cleanup programs (“Helping Hand”) 8) Enforcement of illegal dumping operations 9) Street cleaning and sweeping 10. Public education for DPW Solid Waste
Education and Enforcement Program (SWEEP) B. Department of the Environment Programs
1. Public education and assistance 2. Enforcement of stormwater and erosion/sedimentation control regulations

Final Anacostia River Watershed Trash TMDLs August 2010
54
Part III, Section C-A, LTCP requires that the permittee, “implement and effectively operate and maintain the CSO controls identified in the LTCP.” Part A-4 requires that “solids and floatables capture shall be provided for all overflows prior to discharge to receiving waters.”
6.4.5. District of Columbia Long Term Control Plan
The DC-WASA Combined Sewer System Long-Term Control Plan took effect July 2002. Section 13.3.4 (Solids and Floatables Control) of the LTCP states
Implementation of the recommended control plan will virtually eliminate solids and floatables from combined sewer system discharges because the majority of CSOs will be captured and treated. For storms which are beyond the capacity of the proposed control system, the first flush of CSO which contains the vast majority of solids and floatables will be captured and treated. Overflows from the proposed control system will typically occur near the end of extreme storm events after most of the solids and floatables have been washed from the streets and captured by the control facilities. In addition, the following control measures will be implemented:
DC-WASA will incorporate floatables control for overflows which exceed the capacity of the recommended control plan into the design of new CSO diversion structures/facilities which will be constructed as part of the recommended plan, where practical. One method that might be used is a combination baffle/bar rack arrangement in new CSO regulators. This method has been used successfully in Richmond, Virginia and Boston, Massachusetts. As was discovered in those communities, there may be some outfalls where incorporation of floatables control into new facilities is not practical due to hydraulics, site constraints or other factors. This will be evaluated on a case by case basis during the design phase.
DC-WASA will continue to operate the Anacostia River Floatable Debris Removal Program, which consists of skimmer boats that remove solids and floatables from the Anacostia and Potomac Rivers. Note that this program removes materials from the rivers from all sources, not just from CSOs.
The stormwater pumps at the Main and O Street Pumping Stations incorporate trash racks on the influent side of the pumps that remove floatables before discharge to the Anacostia River.
After implementation of the recommended plan, a large amount of trash may still be present due to sources other than CSO. Control of these other sources in a watershed-based approach is recommended.
6.5. Summary of Potential BMPs that Could be Implemented to Achieve the TMDL Target
of 100 Percent Removal of the Baseline Trash Load
Structural BMPs Catch basin inserts End of pipe nets Floating trash traps/trash booms Vortex separation systems
Nonstructural BMPs
Enforce existing regulations and ordinances that prohibit trash, litter, and debris Post signage indicating the penalties for littering and dumping violations Implement new regulations banning, controlling, or taxing certain materials known to significantly
affect trash loading Implement return deposit fee for glass and plastic containers

August 2010 Final Anacostia River Watershed Trash TMDLs
55
Increase prevalence of trash receptacles and increase trash collection frequency to keep receptacles from overflowing
Continue street sweeping Establish more partnerships with business districts to improve litter removal efforts Recycling Programs Implement a reporting system for persons who observe illegal dumping or disposal of trash Stencil catch basins, indicating that storm drains lead to the Anacostia River Perform surveillance in known illegal dumping areas Implement trash-related community service as an alternative to environmental crime-related fines Conduct public education and outreach

Final Anacostia River Watershed Trash TMDLs August 2010
56
7. PUBLIC PARTICIPATION EPA policy is that full and meaningful public participation must occur in the TMDL development process. Each state must provide for public participation consistent with its own continuing planning process and public participation requirements. The public comment period for this TMDL began on April 19, 2010, and ended on May 18, 2010. Public notices were published in the Montgomery County Examiner, the Prince George’s County Examiner and the District of Columbia Register. EPA issued a press release announcing the public comment period on April 23, 2010. A public meeting was held at 1:00 PM on May 6, 2010. Copies of the draft TMDL were made available at three public libraries within the watershed and through the District of Columbia Register and MDE websites. DDOE also emailed the draft TMDL to all stakeholders on the relevant distribution list.
August 2010 Final Anacostia River Watershed Trash TMDLs
57
8. REFERENCES
AWRP (Anacostia Watershed Restoration Partnership). 2009. Subwatersheds Information <http://www.anacostia.net/subwatershed.html>. Accessed December 10, 2009.
Anacostia Watershed Society. 2008. Anacostia Watershed Trash Reduction Plan. Prepared for the District of
Columbia Department of the Environment. Anacostia Watershed Society, Washington, DC. COMAR (Code of Maryland Regulations). 2009a. 26.08.02.02 B.. http://www.dsd.state.md.us/comar/getfile.aspx?file=26.08.02.02.htm (Accessed December, 2009). COMAR (Code of Maryland Regulations). 2009b. 26.08.02.02-1 http://www.dsd.state.md.us/comar/getfile.aspx?file=26.08.02.02-1.htm (Accessed December, 2009). COMAR. 2009c. 26.08.02.08 O(1,2,3,5). http://www.dsd.state.md.us/comar/getfile.aspx?file=26.08.02.08.htm (Accessed December, 2009). DC-WASA (District of Columbia Water and Sewer Authority) 2009. Briefing to the Anacostia Steering
Committee Synergy: Addressing Combined Sewer Overflows and Nitrogen. District of Columbia Water and Sewer Authority,Washington, DC.
District of Columbia, Department of Health, Environmental Health Administration, Watershed Protection
Division. 2005. Anacostia River Watershed Implementation Plan. Supplement to the 1999 Anacostia River Watershed Restoration Action Strategy. District of Columbia, Department of Health, Environmental Health Administration, Washington, DC.
District of Columbia, Department of Health, Bureau of Environmental Quality. 2006. District of Columbia
Water Quality Assessment, 2006 Integrated Report to the U.S. Environmental Protection Agency and U.S. Congress Pursuant to Sections 305(b) and 303(d) Clean Water Act (P.L. 97-117). District of Columbia, Department of Health, Bureau of Environmental Quality, Washington, DC.
District of Columbia, Department of the Environment. 2008. District of Columbia Water Quality Assessment,
2008 Integrated Report to the Environmental Protection Agency and U.S. Congress Pursuant to Sections 305(b) and 303(d) Clean Water Act (P.L. 97-117). District of Columbia, Department of the Environment, Washington, DC.
District of Columbia, OCTO (Office of the Chief Technology Officer). 2005. Hydrography Centerline
(small_tribs.shp). District of Columbia, Office of the Chief Technology Officer, Washington, DC. District of Columbia, Office of Planning. 2005. Existing Land Use (existinglanduse.shp). District of
Columbia, Office of Planning, Washington, DC. District of Columbia, Water and Sewer Authority. 2002. Combined Sewer System Long Term Control Plan.
District of Columbia, Water and Sewer Authority, Washington, DC. District of Columbia Municipal Regulations Title 21, Chapter 11. Water Quality Standards.
<http://ddoe.dc.gov/ddoe/frames.asp?doc=/ddoe/lib/ddoe/wqd/WaterFinalRules06.pdf>. Accessed December 10, 2009.

Final Anacostia River Watershed Trash TMDLs August 2010
58
MDE (Maryland Department of the Environment) and District of Columbia Department of the Environment, Natural Resources Administration. 2007. Total Maximum Daily Loads of Sediment/Total Suspended Solids for the Anacostia River Basin, Montgomery and Prince George’s Counties, Maryland and The District of Columbia. Maryland Department of the Environment, Baltimore, MD, and District of Columbia Department of the Environment, Natural Resources Administration, Washington, DC.
MDE. 2008. The 2008 Integrated Report of Surface Water Quality in Maryland. Baltimore, MD: Maryland Department of the Environment. Also available at: http://www.mde.state.md.us/Programs/WaterPrograms/TMDL/Maryland%20303%20dlist/2008_Final_303d_list.asp. Maryland Department of Natural Resources. 2002. Anacostia River of Recovery
<http://www.dnr.state.md.us/forests/anacostia/history.html>. Updated February 6, 2002. Accessed September 14, 2009.
Maryland Department of Natural Resources, Watershed Services. 2005. Anacostia River Stream Corridor
Survey. Maryland Department of Natural Resources, Annapolis, MD. Maryland Department of Planning. 2003. 2002 Land Use/Land Cover for Maryland shapefile. Maryland
Department of Planning, Baltimore, MD. Maryland Soil Conservation Service, Montgomery County, Maryland, 1995. Maryland Soil Conservation
Service, Annapolis, MD. Maryland Soil Conservation Service, Prince George’s County, Maryland, 1967. Maryland Soil Conservation
Service, Annapolis, MD. Maryland Water Quality Standards, Code of Maryland Title 26 Subtitle 08, Chapter 2.
<http://www.dsd.state.md.us/comar/SubtitleSearch.aspx?search=26.08.02.*>. Accessed December 10, 2009.
MWCOG (Metropolitan Washington Council of Governments) Anacostia Watershed Partnership. 2007.
Anacostia Watershed Trash Reduction Strategy. Metropolitan Washington Council of Governments, Washington, DC.
MWCOG (Metropolitan Washington Council of Governments). 2009. Anacostia Watershed digital file
(Anacostia_streams_&_wtrbodies_2005_DEM). Metropolitan Washington Council of Governments, Washington, DC.
MWCOG (Metropolitan Washington Council of Governments), Department of Environmental Programs.
2001. DC-WASA Combined Sewer Overflow Anacostia River Trash Reduction Demonstration Project: Fresh Creek Netting Trash TrapTM System. Prepared for CSO Control Program, District of Columbia Water and Sewer Authority, Washington, DC.
National Weather Service Forecast Office. 2010. Reagan National Average Monthly Precipitation (since
1871) <http://www.erh.noaa.gov/lwx/climate/dca/dcaprecip.txt>. Accessed April 8, 2010. USACE (U.S. Army Corps of Engineers). 2009. Draft Final Subwatershed Action Plans for Sligo Creek,
Northwest Branch, Paint Branch, Little Paint Branch, Indian Creek, Upper Beaverdam Creek, Still Creek, Northeast Branch, Lower Beaverdam Creek, Watts Branch, Fort Dupont Tributary, Pope Branch, Hickey Run and Tidal River. U.S. Army Corps of Engineers, Baltimore District, Baltimore, MD.

August 2010 Final Anacostia River Watershed Trash TMDLs
59
USDA NRCS (U.S. Department of Agriculture, Natural Resources Conservation Service). 2006. Soil Survey Geographic (SSURGO) Database for District of Columbia. U.S. Department of Agriculture, Natural Resources Conservation Service, Annapolis, MD.
U.S. Department of Commerce, National Climatic Data Center. 2007. Summary of the Day Dataset.
Washington Reagan National Airport (1959-2002) and Beltsville BARC station (1953-2002). U.S. Department of Commerce, National Climatic Data Center, Asheville, NC.
USEPA (U.S. Environmental Protection Agency). 1986. Quality Criteria for Water 1986. EPA 440/5-86-001.
U.S. Environmental Protection Agency, Office of Water, Washington DC. USEPA (United States Environmental Protection Agency). 1991. Guidance for Water Quality-based
Decisions: The TMDL Process. EPA 440/-4-91-001. U.S. Environmental Protection Agency, Office of Water, Washington, DC.
USEPA (United States Environmental Protection Agency). 1999, August 9. USEPA Memorandum from
Robert H. Wayland III, Director, Office of Wetlands, Oceans and Watersheds to the Regional Management Division Directors. EPA Actions to Support High Quality TMDLs. U.S. Environmental Protection Agency, Office of Wetlands, Oceans and Watersheds, Washington, DC.
USEPA (U.S. Environmental Protection Agency). 2002, November 22. USEPA Memorandum from Robert
H. Wayland III, Director, Office of Wetlands, Oceans and Watersheds and James A. Hanlon, Director, Office of Wastewater Management to USEPA Water Division Directors. Establishing Total Maximum Daily Load (TMDL) Wasteload Allocations (WLAs) for Storm Water Source and NPDES Permit Requirements Based on Those WLAs. U.S. Environmental Protection Agency, Office of Wetlands, Oceans and Watersheds and Office of Wastewater Management, Washington, DC.
U.S. Geological Survey. National Hydrography Dataset (NHD) – Medium Resolution. 1999. U.S. Geological
Survey, Reston, VA, and U.S. Environmental Protection Agency, Washington, DC.

Final Anacostia River Watershed Trash TMDLs August 2010
60
APPENDIX A

August 2010 Final Anacostia River Watershed Trash TMDLs
61
Summary of NPDES Permits in Maryland
MDE Permit Number
NPDES Permit Number Facility Name County Permit Type
03DP3249 TROTTERS GLEN GOLF COURSE Montgomery WMA1 - Industrial
03DP3215 FDA - CENTER FOR VETERINARY MEDICINE Prince George's WMA1 - Industrial
02DP0219 MD0001953 LAUREL SAND & GRAVEL, INC. Prince George's WMA1 - Industrial
02DP3403 MD0068900 THE WASHINGTON POST Prince George's WMA1 - Industrial
04DP3156 MD0067482 NASA - GODDARD SPACE FLIGHT CENTER Prince George's WMA1 - Industrial
04DP2904 MD0065871 NATIONAL ARCHIVES & RECORDS ADMINISTRATION Prince George's WMA1 - Industrial
07DP3577 MD0069795 AGGREGATE INDUSTRIES - BLADENSBURG READY-MIX CONCRETE & HOT MIX ASPHALT FACILITY Prince George's WMA1 - Industrial
08DP3602 MD0069965 AGGREGRATE INDUSTRIES - ODELL ROAD READY-MIX CONCRETE Prince George's WMA1 - Industrial
08DP3614 MD0070084 THE GARDENS ICE HOUSE Prince George's WMA1 - Industrial
05DP2725 MD0064521 WMATA - LANDOVER BUS DIVISION Prince George's WMA1 - Industrial
01DP2618 MD0063801 UNIVERSITY OF MARYLAND - COLLEGE PARK Prince George's WMA1 - Industrial
97DP2525 MD0020842 USDA EAST-SIDE WWTP Prince George's WMA2 - Municipal
05DP2787 MD0020851 USDA WEST-SIDE WWTP Prince George's WMA2 - Municipal
00MM9863 MDG499863 PERCONTEE, INC. - MCCENEY TRACT Montgomery WMA5SW - Industrial
Stormwater
00MM9849 LAFARGE - LANDOVER BLACKTOP PLANT Prince George's WMA5SW - Industrial
Stormwater
00MM9867 MDG499867 CHANEY ENTERPRISES - SEAT PLEASANT Prince George's WMA5SW - Industrial
Stormwater
00MM2865 MDG492865 A.H. SMITH - BRANCHVILLE Prince George's WMA5SW - Industrial
Stormwater
00MM9769 MDG499769 ROCKVILLE FUEL & FEED COMPANY - PLANT 4 Prince George's WMA5SW - Industrial
Stormwater
00MM9755A MDG499755 AGGREGRATE INDUSTRIES - LAUREL READY-MIX CONCRETE Prince George's
WMA5SW - Industrial Stormwater
00MM2331A MUIRKIRK PIT Prince George's WMA5SW - Industrial
Stormwater
02SW0341 M-NCPPC - OLNEY MANOR PARK MAINTENANCE YARD Montgomery WMA5SW - Industrial
Stormwater
02SW0343 M-NCPPC - WHEATON REGIONAL PARK Montgomery WMA5SW - Industrial
Stormwater
02SW0389 M-NCPPC - BROOKSIDE GARDENS MAINTENANCE YARD Montgomery WMA5SW - Industrial

Final Anacostia River Watershed Trash TMDLs August 2010
62
MDE Permit Number
NPDES Permit Number Facility Name County Permit Type
Stormwater
02SW0338 M-NCPPC - MARTIN LUTHER KING, JR. PARK Montgomery WMA5SW - Industrial
Stormwater
02SW0344 M-NCPPC - LAYHILL/BONIFANT RUBBLE FILL Montgomery WMA5SW - Industrial
Stormwater
02SW0267 MONTGOMERY COUNTY - COLESVILLE DEPOT Montgomery WMA5SW - Industrial
Stormwater
02SW0289 MONTGOMERY COLLEGE - TAKOMA PARK Montgomery WMA5SW - Industrial
Stormwater
02SW1234 COCA-COLA BOTTLING CO. - SILVER SPRING Montgomery WMA5SW - Industrial
Stormwater
02SW1241 WMATA - GLENMONT METRORAIL YARD Montgomery WMA5SW - Industrial
Stormwater
02SW1320 SHA - FAIRLAND SHOP Montgomery WMA5SW - Industrial
Stormwater
02SW0522 MONTGOMERY COUNTY PUBLIC SCHOOLS - RANDOLPH Montgomery WMA5SW - Industrial
Stormwater
02SW1258 MONTGOMERY COUNTY SCHOOLS - WEST FARM DEPOT Montgomery WMA5SW - Industrial
Stormwater
02SW1931 PEPSI BOTTLING GROUP Montgomery WMA5SW - Industrial
Stormwater
02SW1299 JIFFY JOHN COMPANY, INC. Prince George's WMA5SW - Industrial
Stormwater
02SW0481 SMITHFIELD PACKING COMPANY - LANDOVER Prince George's WMA5SW - Industrial
Stormwater
02SW1083 GOLD LINE, INC. Prince George's WMA5SW - Industrial
Stormwater
02SW1721 BELTSVILLE AUTO RECYCLERS, INC. Prince George's WMA5SW - Industrial
Stormwater
02SW1158 PETER PAN BUS LINES Prince George's WMA5SW - Industrial
Stormwater
02SW0316 EATON CORPORATION - FLUID CONVEYANCE DIVISION Prince George's WMA5SW - Industrial
Stormwater
02SW0772 AGGREGATE INDUSTRIES- BLADENSBURG AGGREGRATE TERMINAL Prince George's
WMA5SW - Industrial Stormwater
02SW1662 BARDON, INC. - LAUREL VEHICLE MAINTENANCE SHOP Prince George's WMA5SW - Industrial
Stormwater
02SW1277 NAZCON READY MIX PLANT - MARYLAND AVENUE Prince George's WMA5SW - Industrial

August 2010 Final Anacostia River Watershed Trash TMDLs
63
MDE Permit Number
NPDES Permit Number Facility Name County Permit Type
Stormwater
02SW1276 NAZARIO CONSTRUCTION COMPANY, INC. Prince George's WMA5SW - Industrial
Stormwater
02SW0328 WMATA - NEW CARROLLTON METRORAIL YARD Prince George's WMA5SW - Industrial
Stormwater
02SW1093 BFI - PRINCE GEORGE'S COUNTY Prince George's WMA5SW - Industrial
Stormwater
02SW1659 BAXTER HEALTHCARE CORPORATION - BLDG. 1 Prince George's WMA5SW - Industrial
Stormwater
02SW1661 BAXTER MARYLAND VACCINES - BLDG 5 Prince George's WMA5SW - Industrial
Stormwater
02SW1660 BAXTER MARYLAND VACCINES - BLDG. 2 Prince George's WMA5SW - Industrial
Stormwater
02SW0740 UNITED PARCEL SERVICE - LANDOVER #1 Prince George's WMA5SW - Industrial
Stormwater
02SW0858 UNITED PARCEL SERVICE - LANDOVER #2 Prince George's WMA5SW - Industrial
Stormwater
02SW1052 FEDERAL EXPRESS - BELTSVILLE Prince George's WMA5SW - Industrial
Stormwater
02SW0874 SECURITY STORAGE CO. OF WASHINGTON - HYATTSVILLE Prince George's WMA5SW - Industrial
Stormwater
02SW0871 SECURITY STORAGE CO. OF WASHINGTON - LANDOVER Prince George's WMA5SW - Industrial
Stormwater
02SW0621 LAUREL SAND & GRAVEL, INC. Prince George's WMA5SW - Industrial
Stormwater
02SW1222 PR. GEO. COUNTY DEPT. OF PUBLIC WORKS - GLENN DALE Prince George's WMA5SW - Industrial
Stormwater
02SW0584 WASHINGTON WOODWORKING COMPANY, LLC Prince George's WMA5SW - Industrial
Stormwater
02SW0007 STONE INDUSTRIAL PRECISION PRODUCTS Prince George's WMA5SW - Industrial
Stormwater
02SW1077 INTERSTATE BRANDS CORP. - BELTSVILLE Prince George's WMA5SW - Industrial
Stormwater
02SW1076 INTERSTATE BRANDS CORP. - BEAVER HEIGHTS Prince George's WMA5SW - Industrial
Stormwater
02SW0008 AIRGAS EAST, INC. - HYATTSVILLE Prince George's WMA5SW - Industrial
Stormwater
02SW1429 KENILWORTH PROCESSING CENTER Prince George's WMA5SW - Industrial

Final Anacostia River Watershed Trash TMDLs August 2010
64
MDE Permit Number
NPDES Permit Number Facility Name County Permit Type
Stormwater
02SW0466 SHERWIN-WILLIAMS COMPANY - BELTSVILLE Prince George's WMA5SW - Industrial
Stormwater
02SW1464 BELTWAY USED AUTO PARTS Prince George's WMA5SW - Industrial
Stormwater
02SW1694 PITT OHIO EXPRESS - TEMPLE HILLS Prince George's WMA5SW - Industrial
Stormwater
02SW1741 ATLANTIC TRANSPORTATION EQUIPMENT, LTD Prince George's WMA5SW - Industrial
Stormwater
02SW1725 AGGREGATE & DIRT SOLUTIONS, LLC. Prince George's WMA5SW - Industrial
Stormwater
02SW1136 ALLSTAR USED AUTO PARTS, INC. Prince George's WMA5SW - Industrial
Stormwater
02SW0149 SHERIFF RD PROCESSING & TRANSFER STATION Prince George's WMA5SW - Industrial
Stormwater
02SW1065 UPS GROUND FREIGHT - LANDOVER Prince George's WMA5SW - Industrial
Stormwater
02SW1724 EAST-WEST MOTORS, INC. Prince George's WMA5SW - Industrial
Stormwater
02SW1736 WSSC - ANACOSTIA GARAGE Prince George's WMA5SW - Industrial
Stormwater
02SW1735 WSSC - ANACOSTIA EQUIPMENT SHOP Prince George's WMA5SW - Industrial
Stormwater
02SW0197 CHEVERLY DEPARTMENT OF PUBLIC WORKS Prince George's WMA5SW - Industrial
Stormwater
02SW1679 J & M AUTO, INC. Prince George's WMA5SW - Industrial
Stormwater
02SW1357 METRO RE-UZ-IT COMPANY, INC. Prince George's WMA5SW - Industrial
Stormwater
02SW1242 WMATA - GREENBELT METRORAIL YARD Prince George's WMA5SW - Industrial
Stormwater
02SW1365 WORLD RECYCLING COMPANY Prince George's WMA5SW - Industrial
Stormwater
02SW1745 D.C. MATERIALS Prince George's WMA5SW - Industrial
Stormwater
02SW1326 SHA - METRO SHOP Prince George's WMA5SW - Industrial
Stormwater
02SW0648 PRINCE GEORGE'S SCRAP, INC. Prince George's WMA5SW - Industrial

August 2010 Final Anacostia River Watershed Trash TMDLs
65
MDE Permit Number
NPDES Permit Number Facility Name County Permit Type
Stormwater
02SW0654 JOSEPH SMITH & SONS Prince George's WMA5SW - Industrial
Stormwater
02SW1754 THE RECYCLING CENTER Prince George's WMA5SW - Industrial
Stormwater
02SW1366 GINDER MOTOR COMPANY, INC. Prince George's WMA5SW - Industrial
Stormwater
02SW1763 STRITTMATTER LAND, LLC Prince George's WMA5SW - Industrial
Stormwater
02SW1380 GRIFFITH ENERGY SERVICES - CHEVERLY Prince George's WMA5SW - Industrial
Stormwater
02SW1621 EARL CENTER LUMBER COMPANY Prince George's WMA5SW - Industrial
Stormwater
02SW1779 ATMAN CORPORATION Prince George's WMA5SW - Industrial
Stormwater
02SW1103 UNITED STATES POSTAL SERVICE - RIVERDALE VMF Prince George's WMA5SW - Industrial
Stormwater
02SW1393 TRY IT AGAIN, INC. Prince George's WMA5SW - Industrial
Stormwater
02SW1829 HALLE ENTERPRISES, INC. Prince George's WMA5SW - Industrial
Stormwater
02SW1856 BATES TRUCKING COMPANY Prince George's WMA5SW - Industrial
Stormwater
02SW1860 TURBO HAUL, INC. Prince George's WMA5SW - Industrial
Stormwater
02SW1864 ROLLING FRITO-LAY SALES - BELTSVILLE DC Prince George's WMA5SW - Industrial
Stormwater
02SW1897 PEPSI BOTTLING GROUP, LLC Prince George's WMA5SW - Industrial
Stormwater
02SW1926 MD0003425 ROCKWOOD PIGMENTS, N.A., INC. Prince George's WMA5SW - Industrial
Stormwater
02SW1936 YELLOW TRANSPORTATION, INC. - LANDOVER Prince George's WMA5SW - Industrial
Stormwater
02SW2002 RODGERS BROTHERS SERVICE, INC. Prince George's WMA5SW - Industrial
Stormwater
02SW2022 MARVA-MAID LANDOVER, LLC Prince George's WMA5SW - Industrial
Stormwater
02SW2066 HD SUPPLY CONSTRUCTION SUPPLY, LTD. - HYATTSVILLE Prince George's WMA5SW - Industrial

Final Anacostia River Watershed Trash TMDLs August 2010
66
MDE Permit Number
NPDES Permit Number Facility Name County Permit Type
Stormwater
06DP3320 MD0068349 MONTGOMERY COUNTY MS4 Montgomery WMA6 - Phase I MS4
04DP3314 MD0068284 PRINCE GEORGE'S MS4 Prince George's WMA6 - Phase I MS4
04DP3313 MD0068276 STATE HIGHWAY ADMINISTRATION MS4 Statewide WMA6 - Phase I MS4 03-IM-5500-
031 MDR055500 CITY OF GLENARDEN MS4 Prince George's WMA6G - Phase II Municipality MS4
03-IM-5500-032 MDR055500 CITY OF GREENBELT MS4 Prince George's
WMA6G - Phase II Municipality MS4
03-IM-5500-033 MDR055500 CITY OF HYATTSVILLE MS4 Prince George's
WMA6G - Phase II Municipality MS4
03-IM-5500-035 MDR055500 CITY OF NEW CARROLTON MS4 Prince George's
WMA6G - Phase II Municipality MS4
03-IM-5500--036 MDR055500 CITY OF SEAT PLEASANT MS4 Prince George's
WMA6G - Phase II Municipality MS4
03-IM-5500-037 MDR055500 TOWN OF BLADENSBURG MS4 Prince George's
WMA6G - Phase II Municipality MS4
03-IM-5500-038 MDR055500 TOWN OF CHEVERLY MS4 Prince George's
WMA6G - Phase II Municipality MS4
03-IM-5500-039 MDR055500 TOWN OF COLMAR MANOR MS4 Prince George's
WMA6G - Phase II Municipality MS4
03-IM-5500-040 MDR055500 TOWN OF COTTAGE CITY MS4 Prince George's
WMA6G - Phase II Municipality MS4
03-IM-5500-041 MDR055500 TOWN OF LANDOVER HILLS MS4 Prince George's
WMA6G - Phase II Municipality MS4
03-IM-5500-043 MDR055500 TOWN OF UNIVERSITY PARK MS4 Prince George's
WMA6G - Phase II Municipality MS4
03-IM-5500-028 MDR055500 CITY OF TAKOMA PARK MS4 Montgomery
WMA6G - Phase II Municipality MS4
03-IM-5500-002 MDR055500 TOWN OF BRENTWOOD MS4 Prince George's
WMA6G - Phase II Municipality MS4
03-IM-5500-004 MDR055500 TOWN OF RIVERDALE PARK MS4 Prince George's
WMA6G - Phase II Municipality MS4
03-IM-5500-005 MDR055500 TOWN OF BERWYN HEIGHTS MS4 Prince George's
WMA6G - Phase II Municipality MS4
03-IM-5500-006 MDR055500 TOWN OF CAPITOL HEIGHTS MS4 Prince George's
WMA6G - Phase II Municipality MS4
03-IM-5500-030 MDR055500 CITY OF COLLEGE PARK MS4 Prince George's
WMA6G - Phase II Municipality MS4

August 2010 Final Anacostia River Watershed Trash TMDLs
67