Embed Size (px)
Citation preview

An updated lifecycle assessment study for disposable and reusable nappies
Science Report – SC010018/SR2
SCHO0808BOIR-E-P

ii Science Report – An updated lifecycle assessment study for disposable and reusable nappies
The Environment Agency is the leading public body protecting and improving the environment in England and Wales.
It’s our job to make sure that air, land and water are looked after by everyone in today’s society, so that tomorrow’s generations inherit a cleaner, healthier world.
Our work includes tackling flooding and pollution incidents, reducing industry’s impacts on the environment, cleaning up rivers, coastal waters and contaminated land, and improving wildlife habitats.
This work was delivered by the Environment Agency's science programme and jointly funded by the EA, Defra and WRAP.
Published by: Environment Agency, Rio House, Waterside Drive, Aztec West, Almondsbury, Bristol, BS32 4UD Tel: 01454 624400 Fax: 01454 624409 www.environment-agency.gov.uk ISBN: 978-1-84432-927-4 © Environment Agency – October 2008 All rights reserved. This document may be reproduced with prior permission of the Environment Agency. The views and statements expressed in this report are those of the author alone. The views or statements expressed in this publication do not necessarily represent the views of the Environment Agency and the Environment Agency cannot accept any responsibility for such views or statements. This report is printed on Cyclus Print, a 100% recycled stock, which is 100% post consumer waste and is totally chlorine free. Water used is treated and in most cases returned to source in better condition than removed. Further copies of this report are available from: The Environment Agency’s National Customer Contact Centre by emailing: [email protected] or by telephoning 08708 506506.
Author(s): Simon Aumônier Michael Collins Peter Garrett Dissemination Status: Released to all regions Publicly available Keywords: nappies, reusable, disposable, life cycle assessment, LCA, cloth, environmental, impacts Research Contractor: Environmental Resources Management Eaton House, Wallbrook Court North Hinksey Lane Oxford OX2 0QS Environment Agency’s Project Manager: Terry Coleman, Science Department Science Project Number: SC010018 Product Code: SCHO0808BOIR-E-P

Science Report – An updated lifecycle assessment study for disposable and reusable nappies iii
Science at the Environment Agency Science underpins the work of the Environment Agency. It provides an up-to-date understanding of the world about us and helps us to develop monitoring tools and techniques to manage our environment as efficiently and effectively as possible.
The work of the Environment Agency’s Science Department is a key ingredient in the partnership between research, policy and operations that enables the Environment Agency to protect and restore our environment.
The science programme focuses on five main areas of activity:
• Setting the agenda, by identifying where strategic science can inform our evidence-based policies, advisory and regulatory roles;
• Funding science, by supporting programmes, projects and people in response to long-term strategic needs, medium-term policy priorities and shorter-term operational requirements;
• Managing science, by ensuring that our programmes and projects are fit for purpose and executed according to international scientific standards;
• Carrying out science, by undertaking research – either by contracting it out to research organisations and consultancies or by doing it ourselves;
• Delivering information, advice, tools and techniques, by making appropriate products available to our policy and operations staff.
Steve Killeen
Head of Science

iv Science Report – An updated lifecycle assessment study for disposable and reusable nappies
Contents Science at the Environment Agency iii
Contents iv
1 Introduction and scope 1 1.1 Number of changes 2 1.2 Product systems and system boundaries 3 1.3 The disposable nappy system 3 1.4 Home laundered reusable nappy systems – shaped and prefold 6 1.5 Inclusions/exclusions 9 1.6 Key assumptions and limitations 10 1.7 Data requirements 10 1.8 Inventory analysis and impact assessment 11
2 Inventory data for disposable nappies 12 2.1 Disposable nappy number, weight and manufacture 12 2.2 Waste management 12
3 Inventory data for reusable nappies 14 3.1 Shaped nappy number, weight and manufacture 14 3.2 Wraps 14 3.3 Washing data 14
4 Results 21 4.1 Disposable nappies 21 4.2 Shaped nappies 25
5 Conclusions 31
References 32

Science Report – An updated lifecycle assessment study for disposable and reusable nappies 1
1 Introduction and scope This study builds on a previous study for the Environment Agency, entitled Life Cycle Assessment of Disposable and Reusable Nappies in the UK, ISBN: 1-84-432427-3, and is considered an addendum to the previous study.
Environmental Resources Management Limited (ERM) was asked by the Department for Environment, Food and Rural Affairs (Defra), the Environment Agency and the Waste and Resources Action Programme (WRAP) to update the previous life cycle assessment (LCA) study by assessing the changes in the environmental profile of disposable and reusable nappies that have resulted from developments in the manufacture and use of disposable and reusable nappies systems in the UK since 2002/03. Factors addressed in the study included: further weight reduction of disposable nappies, the inclusion of shaped nappies, the changed energy efficiency and different usage of washing machines and driers, and changes to waste disposal options, including the use of reusable nappies for a second child. For this study, ERM aimed to obtain:
• Updated energy generation data.
• Updated energy consumption data for washing machines and tumble driers.
• Updated manufacturing data for disposable nappies.
• Updated waste management data for disposable nappies.
• New manufacturing data for shaped nappies.
• New manufacturing data for prefold nappies (not obtained, so were excluded from the study).
The goal of the study was split into the following objectives.
• To update the previous study with changes in the marketplace between 2002/03 and 2005/06, to include an assessment of the effects of a range of behavioural assumptions on the life cycle environmental impacts of the reusable nappy types, and to compare these with each other and with modern disposable nappies.
• To compile a detailed life cycle inventory of the environmental burdens
associated with the production, use and disposal of shaped and prefold reusable(1) nappies and disposable nappies.
• To use the life cycle inventory data to compare the environmental impacts arising
from reusable and disposable nappies under a variety of scenarios.
The study aimed to assess the scale, and to explain the significance, of the environmental impact of nappies, through simplification of parameters and clearly defined scenarios. These included consideration of how actions that can be, and have been, undertaken by manufacturers and users of nappies affect their environmental profiles.

2 Science Report – An updated lifecycle assessment study for disposable and reusable nappies
The project was governed by a board comprising Defra, WRAP and the Environment Agency. The board agreed that ERM would consider up to 10 scenarios:, four for disposable nappies, and six for reusable nappies. The board also specified the scenarios to be assessed. The scope of the study is consistent with the previous study, with the exception of the updated data above and the aim of the study to reflect potential impacts in 2006. The Environment Agency surveys of both disposable and reusable nappy use for the previous study (Environment Agency, 2004) determined that the average child is out of nappies at two years and two months (for both type of nappy) and that after two and a half years, 95 per cent of all children are out of nappies. The functional unit used here is the same as that used in the previous study (Environment Agency, 2005) and is defined as “the use of nappies during the first two and a half years of a child’s life”. This results in a specific quantity of disposable and reusable nappies used over two and a half years. Although children may still use training pants, and/or overnight nappies, the use of these types of products is outside the scope of this study.
Table 1.1 Children wearing nappies by child age (all types of nappy)
Age of child Children wearing nappies (%)
Children not wearing nappies (%)
up to 6 months 100.0% 0.0% 6 to 12 months 95.7% 4.3% 12 to 18 months 82.8% 17.2% 18 to 24 months 45.6% 54.4% 24 to 30 months 17.6% 82.4% 30 to 36 months 4.8% 95.2% 36 to 42 months 1.8% 98.2% 42 to 48 months 0.4% 99.6% 48 to 54 months 0.1% 99.9% 54 to 60 months 0.1% 99.9% 60 to 66 months 0.1% 99.9% Source: Environment Agency surveys (Environment Agency, 2004) Note: The surveys showed that there is no difference in age out of nappies between children using reusable or disposable nappies. The figures in the table are for disposable nappies, for which there were more results, but were applied to all children.
1.1 Number of changes The UK sales figure for disposable nappies in 2001-2002 provided an average daily use figure of 4.16 nappies a day, based on a market penetration of 96.4 per cent (Environment Agency, 2004). The Environment Agency surveys of nappy use found that for disposable nappies the average number of changes per day decreased from an average of seven at birth to an average of five at two and a half years. When those children no longer in nappies at any age are included, the number of changes averaged over all children from birth to two and a half years was between 4.05 and 4.4 per day. The Environment Agency concluded that a daily number of changes of 4.16 suggested by the sales figures was supported by the surveys. An overall average

Science Report – An updated lifecycle assessment study for disposable and reusable nappies 3
figure of 4.16 nappies per day has therefore been used in the assessment of the disposable nappy system. For reusable nappies, the Environment Agency surveys found that the average number of changes per day for children still in nappies decreased from eight at birth to an average of six at two and a half years. For children still in reusable nappies the average number used over two and a half years was 6.1 per day (Environment Agency, 2004). When those children no longer in nappies at any age up to two and a half years are included, the number of changes averaged over all children from birth to two and a half years was between 4.3 and 4.7. Therefore, the average of 6.1 changes used in the assessment of reusables for a child still in nappies is equivalent to an overall average (including children no longer in nappies) of between 4.3 and 4.7nappies per day.
1.2 Product systems and system boundaries The nappy systems assessed included all life cycle stages. All energy and materials used were traced back to the extraction of resources. Emissions from each life cycle stage were quantified. Waste management and waste water treatment processes and their environmental releases were included(2).
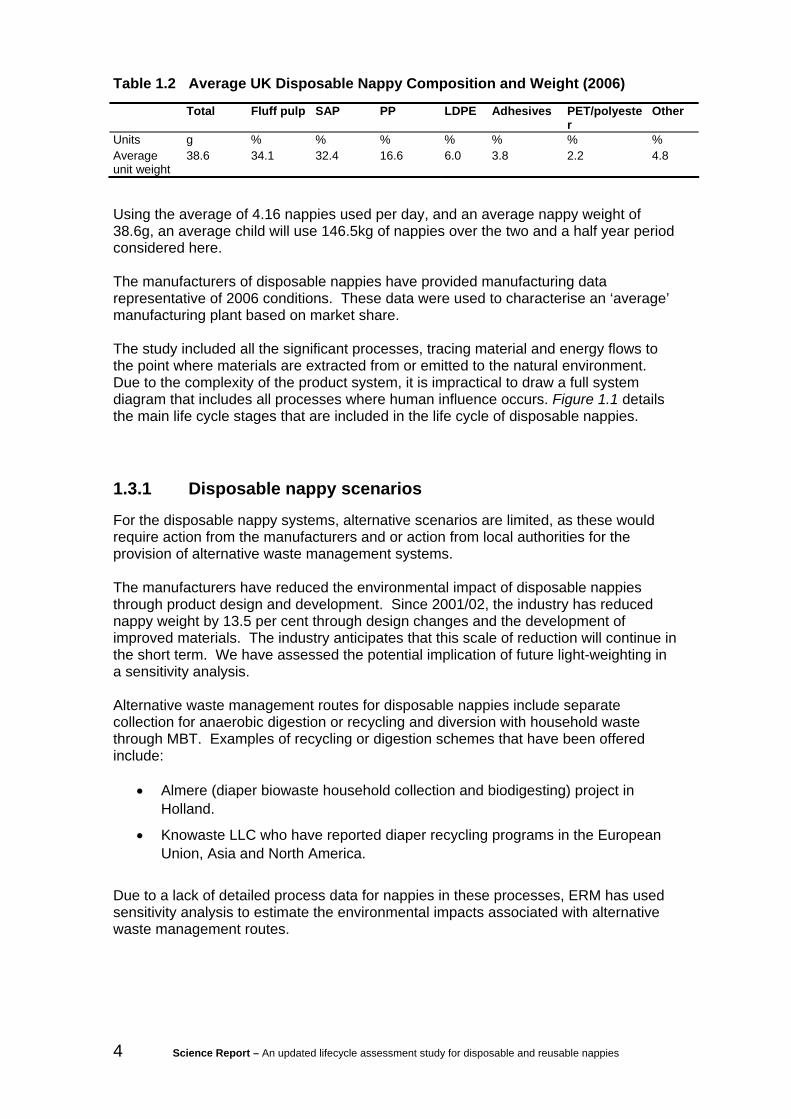
1.3 The disposable nappy system Disposable nappies typically consist of a plastic outer layer with integral fastenings and a core of absorbent materials with a protective top layer. The nappy core is composed of fluff pulp (cellulose fibre) and a water-absorbent polymer (SAP), sodium polyacrylate. The function of the core is to absorb liquid excreta. The top layer is made up of a ‘non-woven’ polymer-based material with a textile structure. From the top layer, the fluids flow through a pulp-based tissue layer down to the core. Leakage is prevented by a plastic bottom layer and by elastic barriers. The nappy is prevented from falling off by rubber waist elastics and is fastened around the child’s waist by Velcro-like materials. The different materials in the nappies are glued together with polymer-based adhesives. The packaging consists of polyethylene plastic bags and corrugated board boxes. The nappies are distributed from the manufacturers either directly to retailers, or via distribution centres maintained by the manufacturers. The retailers are grocery chains, independent grocers or chemists. Customers pick up their nappies at the retailer and transport them home for use. Used nappies containing excreta are discarded along with other municipal waste, and will later be consigned either to landfill, mechanical-biological treatment (MBT) or to incineration. The most popular disposable nappies in the UK are very similar in terms of composition, weight and use. ERM combined the composition and weight of nappies sold in the UK in a particular year and calculated the ‘average nappy’. This average nappy takes account the fact that the size of the nappies used over the baby’s first two and a half years will change depending on the baby’s age and size. Most of the disposable nappies sold in the UK are also manufactured in the UK, although several raw materials are acquired from other European countries or from North America. These considerations have been included in the study. Table 1.2 presents the average composition of a UK disposable nappy for 2006.
4 Science Report – An updated lifecycle assessment study for disposable and reusable nappies
Table 1.2 Average UK Disposable Nappy Composition and Weight (2006)
Total Fluff pulp SAP PP LDPE Adhesives PET/polyester
Other
Units g % % % % % % % Average unit weight
38.6 34.1 32.4 16.6 6.0 3.8 2.2 4.8
Using the average of 4.16 nappies used per day, and an average nappy weight of 38.6g, an average child will use 146.5kg of nappies over the two and a half year period considered here. The manufacturers of disposable nappies have provided manufacturing data representative of 2006 conditions. These data were used to characterise an ‘average’ manufacturing plant based on market share. The study included all the significant processes, tracing material and energy flows to the point where materials are extracted from or emitted to the natural environment. Due to the complexity of the product system, it is impractical to draw a full system diagram that includes all processes where human influence occurs. Figure 1.1 details the main life cycle stages that are included in the life cycle of disposable nappies.
1.3.1 Disposable nappy scenarios
For the disposable nappy systems, alternative scenarios are limited, as these would require action from the manufacturers and or action from local authorities for the provision of alternative waste management systems. The manufacturers have reduced the environmental impact of disposable nappies through product design and development. Since 2001/02, the industry has reduced nappy weight by 13.5 per cent through design changes and the development of improved materials. The industry anticipates that this scale of reduction will continue in the short term. We have assessed the potential implication of future light-weighting in a sensitivity analysis. Alternative waste management routes for disposable nappies include separate collection for anaerobic digestion or recycling and diversion with household waste through MBT. Examples of recycling or digestion schemes that have been offered include:
• Almere (diaper biowaste household collection and biodigesting) project in Holland.
• Knowaste LLC who have reported diaper recycling programs in the European Union, Asia and North America.
Due to a lack of detailed process data for nappies in these processes, ERM has used sensitivity analysis to estimate the environmental impacts associated with alternative waste management routes.

Science Report – An updated lifecycle assessment study for disposable and reusable nappies 5
Figure 1.1 System Boundary for the Disposable Nappy System
T
Packaging Production
Disposable Nappy Production
Electricity Generation
LandfillWaste Recycling
TRetail
Use
Waste Recycling
T
LandfillIncineration
Environment: Resources
Environment: Air, Land and Water
ENERGY
SUPPLY
SYSTEMS
OTHER
PRODUCT
SYSTEMS
Timber production
Pulp Production & Bleaching
Production of Feedstock Polymers
SAP Production
Production of Plastic
Components
Acrylic Acid Production
NaOHProduction
T
T
T TT
T T
T
T
T
T
T
Packaging Production
Disposable Nappy Production
Electricity Generation
LandfillWaste Recycling
TRetail
Use
Waste Recycling
T
LandfillIncineration
Environment: Resources
Environment: Air, Land and Water
ENERGY
SUPPLY
SYSTEMS
OTHER
PRODUCT
SYSTEMS
Timber production
Pulp Production & Bleaching
Production of Feedstock Polymers
SAP Production
Production of Plastic
Components
Acrylic Acid Production
NaOHProduction
T
T
T TT
T T
T
T
T
T
Note: The main transport steps between processes and life cycle stages have been included in the assessment. Waste management activities associated with production and the supply chain have also been included in the assessment.

6 Science Report – An updated lifecycle assessment study for disposable and reusable nappies
1.4 Home laundered reusable nappy systems – shaped and prefold
In the previous study, terry and prefold nappies were assessed, as these were the most popular in 2002/03. However, subsequent market analysis by WRAP (pers. comm. Julian Parfitt, WRAP) indicates that shaped and prefold nappies now have the greatest market share. This study was only able to consider home laundered shaped nappies, because no updated manufacturing data on prefolds was made available by the industry. There are several types of reusable cotton nappies. Nearly all are fitted and fastened with poppers and or Velcro straps instead of pins. The different nappy systems can be divided into the following categories:
• All-in-ones - shaped, fitted nappies with Velcro or popper fastenings, which include a waterproof cover. No folding or pinning is required.
• Shaped nappies - similar to all-in-ones, but wraps or pants have to be
purchased separately to provide the waterproof cover. These do not require folding. They are fastened by Velcro or poppers.
• Prefolds - require folding and a separate waterproof wrap/pant, with fasteners
used in some cases. All-in-ones and shaped nappies are generally considered easier to use than flat/prefold nappies, as no folding is required. Shaped nappies either have Velcro or popper fastenings, or rely solely on the wrap/pant to hold them in place. Prefold nappies are made from woven cotton and consist of a large rectangle of fabric that has been folded and stitched into three panels, the centre panel being thicker than the two outer panels. Prefolds are considered to be easier to dry than all-in-ones and shaped nappies. Wraps/pants are used to hold up nappies and to prevent leakage. They are made from different materials and combinations of materials, such as, nylon, polyester, cotton, wool, PVC, EVA, hemp and polyurethanes. Wraps/pants are not considered as durable in use as nappies , and hence may need to be replaced. For any given size, the frequency of replacement is dependent on the care they receive. Following manufacturers’ care guidance is essential for maximising the lifetime of the wrap/pant. Some wraps/pants are adjustable and are designed for use from birth to potty; others are replaced when necessary to fit a growing baby. Generally, three different sizes will be needed over the two and a half year period. In combination with the nappies and wraps/pants, parents can use liners and booster pads to improve performance and ease of cleaning. Liners are used to provide a drier layer between the baby and the absorbent nappy and to assist in containment of faecal matter for ease of cleaning. Liners come in reusable or disposable forms. Materials used include: paper; polypropylene; fleece; and silk. It is sometimes necessary to boost the performance of a nappy by using booster pads. These pads have not been included in the assessment.

Science Report – An updated lifecycle assessment study for disposable and reusable nappies 7
The major retail routes for reusables appear to be through high street shops, mail order and via the Internet. Figure 1.2 details the main life cycle stages that have been included in the life cycle of home laundered shaped (sized) nappies. All key material, energy and waste streams are traced to the point at which environmental flows cross the system boundary. Reusable nappies are sold in birth to potty packs and ERM used samples of these packs, together with data provided by suppliers, to specify reusable nappy consumption. Table 1.3 details the contents of a shaped nappy birth to potty pack. Manufacturers of each type of reusable nappy were contacted for manufacturing data through the Nappy Alliance.
Figure 1.2 System Boundary For Home Laundered Reusable Nappy System
Detergent Manufacture
Consumer Use
Retail and Distribution
Packaging Waste Disposal
Nappy Construction
Sewage Treatment
Cotton Cultivation and
HarvestingCotton Ginning Cotton
Spinning
Fabric Production and Wet Processing
Wrap and Liner Manufacture
Other Nappy Construction
Materials
Packaging Production
Water Treatment and
Supply
Fertiliser and Pesticide
Production
Environment: Resources
Environment: Air, Land and Water
ENERGY
SUPPLY
SYSTEMS
OTHER
PRODUCT
SYSTEMS
T
T
T T
T
T
T
T
Note: The main transport steps between processes and life cycle stages have been included in the assessment. Waste disposal activities associated with production and the supply chain have also been included in the assessment.

8 Science Report – An updated lifecycle assessment study for disposable and reusable nappies
Table 1.3 Shaped Birth to Potty Pack
Weight per item
(grams) No of items Material Total
(grams)Nappy size 1 132 15 95.5% cotton 4.5% Velcro 1980Nappy size 2 164 15 96.7% cotton 3.7% Velcro 2460Packaging size 1 42 1 LDPE (15 nappies/bag) 42Packaging size 2 38 1 LDPE (15 nappies/bag) 38
Wraps size S 54 4 Same composition assumed as for size L, see below 216
Packaging wrap size S 8 1 LDPE (4 wraps per package) 8
Wraps size M 58 4 Same composition assumed as for size L, see below 232
Packaging wraps size M 8 1 LDPE (4 wraps per package) 8
Wraps size L 58 4
Analysed per wrap: 6g Velcro; 4g lining (unidentified plastic material); 30g unidentified plastic laminated fabric material; 18g cotton 232
Packaging wraps size L 8 1 LDPE (4 wraps per package) 8
Liners 138 20 Paper; 14g/10 liners = 100 liners per roll 2760
Packaging liners 42 1 LDPE (20 rolls/bag) 42Total 68 8026
1.4.1 Home laundered scenarios to be assessed
ERM has approached this study in a different way from the previous study, which used the results of a survey commissioned by the Environment Agency. For the baseline scenario, ERM assumed that nappies are used on one child only, dry-pailed (not soaked in sanitising solution) and washed in a washing machine with an average energy efficiency rating for appliances owned in 2006 (Market Transformation Programme, 2007). ERM also used average use of tumble driers and washer-driers from the same source. ERM assumed that three-quarters of nappies are line dried outside and the remainder are tumble-dried. Nappies were assumed to be washed with wraps at 60°C, the minimum temperature recommended by the Department of Health. It was assumed each wrap is used twice between washes. ERM developed scenarios, agreed by the Project Board, to demonstrate the environmental benefits of separate user choices, such as: reduced temperature washing; using more energy efficient appliances; and high/low utilisation of tumble driers. With the exception of the baseline and reuse on a second child, the scenarios are considered to be extremes rather than general practice. For example, it is not possible for everyone to line dry outside, and it is not practicable for anyone to line dry all the time, nor is it likely that many people will always tumble dry. The objective of showing the effect of these scenarios separately is to indicate the environmental impacts of different actions, so that people understand how the choices they make can affect the environment. The scenarios are presented in Table 1.4.

Science Report – An updated lifecycle assessment study for disposable and reusable nappies 9
In addition to these scenarios, the study has considered, through a sensitivity analysis, the scale of the benefit that can be achieved by combining some of these choices, specifically, reuse on a second child, high load efficiency, and 100 per cent line drying. The study has also used a sensitivity analysis to consider the scale of environmental harm that can be done through a high energy consumption scenario, of 100 per cent tumble drying and washing at a high temperature.
Table 1.4 Cloth Nappy Behaviour Scenarios to be Assessed
Dry pailing Pre-wash Nappy wash temperature
Tumble drying
Load Energy efficiency
Wrap washing with nappies
Wrap washing at 40° with other clothes
Scenario 1 baseline
Yes Yes 60°C MTP average Calculated MTP average Yes No
High efficiency Yes Yes 60°C MTP average Calculated A+ rated Yes No High load efficiency2:
Yes Yes 60°C MTP average 3 day wash MTP average Yes No
High temperature
Yes Yes 90°C MTP average Calculated MTP average No Yes
100% tumble Drying
Yes Yes 60°C 100% Calculated MTP average Yes No
100% line Drying
Yes Yes 60°C No Calculated MTP average Yes No
100% use on second child
Yes Yes 60°C MTP average Calculated MTP average Yes No
Notes: 1) Unlike the previous study where 9.5 per cent of users were estimated to iron nappies, ERM has assumed there is no ironing in this assessment. 2) For the high load efficiency scenarios, ERM has assumed a 33 per cent increase in the number of nappies and wraps owned and washing every three days compared with every two days for the other scenarios.
1.5 Inclusions/exclusions As in the previous study, and in line with accepted LCA practice, ERM has excluded capital equipment and workforce burdens from considerations of both the reusable and disposable nappy systems.
1.5.1 Excreta
Excreta is considered within the system boundaries when comparing disposable and reusable nappy systems. The main reason for this is that nappies and excreta will undergo a different type of waste treatment in each case, due to the different characteristics of the systems. For disposable nappies, ERM believes that it is reasonable to assume that all excreta will be disposed together with the nappies. Consequently, excreta will follow the household waste stream from the nappy waste bin in the home to landfill, MBT and incineration facilities in the UK. For users of home laundered reusable nappies, a proportion of the excreta will be flushed down the toilet, together with soiled disposable liners, before the nappies are washed. This effluent will enter the sewerage system. The remaining excreta will also enter the sewerage system through the washing machine outflow. Sewage treatment has been modelled on the basis of typical sewage treatment processes in the UK.

10 Science Report – An updated lifecycle assessment study for disposable and reusable nappies
1.6 Key assumptions and limitations Changes to the assumptions in the previous study have been recorded and are presented in this report.
1.7 Data requirements In addition to collecting data describing the manufacture of the nappy types assessed, the following are identified as key elements for which new inventory data were required:
• UK electricity generation (2005/06) by type (e.g. coal, gas, nuclear, hydro, wind etc.).
• Washing machine performance. • Tumble drier performance. • Waste management.
1.7.1 Disposable nappy systems
The manufacturers of disposable nappies supplied data describing both the average composition and weight of a disposable nappy in 2006, and the average manufacture of disposable nappies. Material life cycle inventories associated with the manufacture of disposables were the same as those provided previously by the European Disposables and Nonwovens Associations (EDANA). The Waste and Resources Assessment Tool for the Environment (WRATE) software and supporting literature was used to model the disposal of disposable nappies, replacing the WISARD software previously used.
1.7.2 Home laundered reusable nappy systems
The type of nappies to be assessed and the use scenarios considered were agreed with the Project Board. ERM purchased a birth to potty pack of both nappy types (shaped and prefold). These were used, along with manufacturing data, to specify a typical composition and weight of each nappy type and their associated wraps. To assist ERM in defining the manufacturing process for the reusable nappy system, a survey of nappy manufacturers was undertaken. ERM provided questionnaires to manufacturers, WRAP and reusable nappy industry representatives. ERM sourced data from the Market Transformation Programme UK for UK washing machine and tumble drier performance. The data collection for reusable nappies for this study has been limited to:
• Manufacturing data for nappies, wraps and liners. • Updated energy and water consumption data for washing machines and tumble
driers.
Science Report – An updated lifecycle assessment study for disposable and reusable nappies 11
ERM amended the behavioural data that the Environment Agency collected from the surveys commissioned for the previous study to reflect the scenarios as described. All other data used to model the scenarios described above was extracted from the previous study.
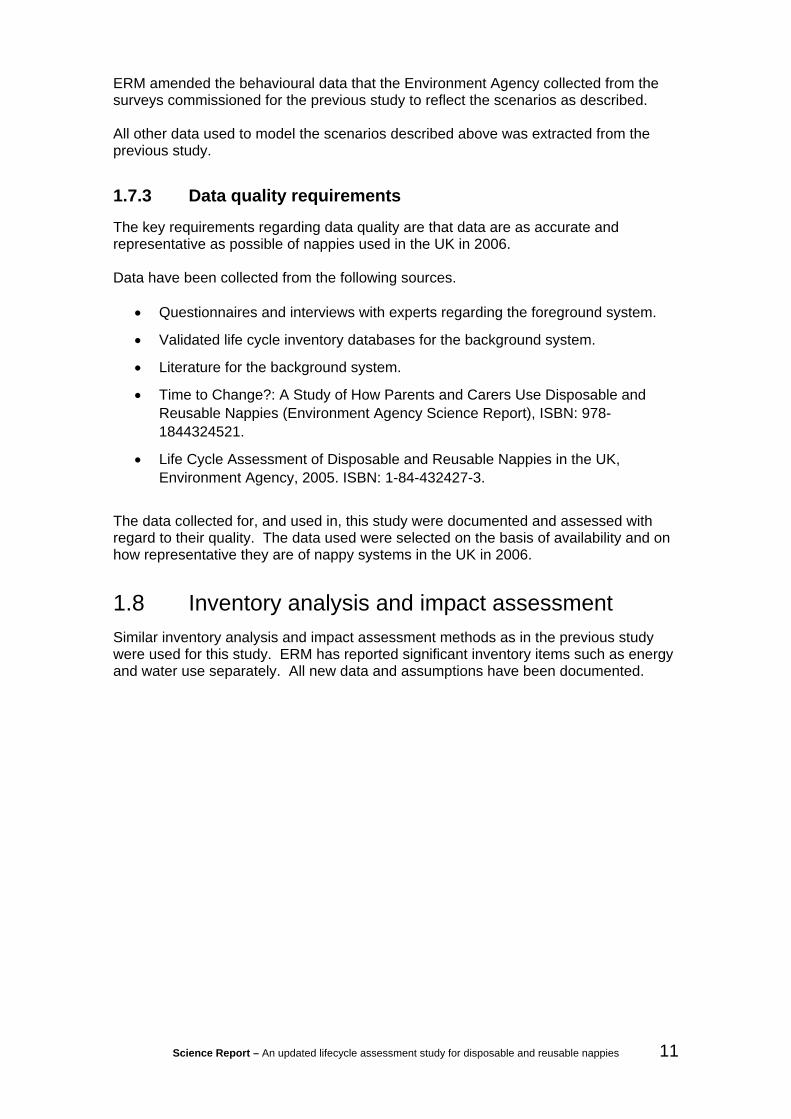
1.7.3 Data quality requirements
The key requirements regarding data quality are that data are as accurate and representative as possible of nappies used in the UK in 2006. Data have been collected from the following sources.
• Questionnaires and interviews with experts regarding the foreground system.
• Validated life cycle inventory databases for the background system.
• Literature for the background system.
• Time to Change?: A Study of How Parents and Carers Use Disposable and Reusable Nappies (Environment Agency Science Report), ISBN: 978-1844324521.
• Life Cycle Assessment of Disposable and Reusable Nappies in the UK, Environment Agency, 2005. ISBN: 1-84-432427-3.
The data collected for, and used in, this study were documented and assessed with regard to their quality. The data used were selected on the basis of availability and on how representative they are of nappy systems in the UK in 2006.
1.8 Inventory analysis and impact assessment Similar inventory analysis and impact assessment methods as in the previous study were used for this study. ERM has reported significant inventory items such as energy and water use separately. All new data and assumptions have been documented.

12 Science Report – An updated lifecycle assessment study for disposable and reusable nappies
2 Inventory data for disposable nappies
2.1 Disposable nappy number, weight and manufacture
Updated manufacturing, nappy composition and nappy weight data were obtained from members of the Absorbent Hygiene Products Manufacturers Association (AHPMA). The number of nappies used over the average two and a half year period that a child is in nappies was taken from the previous study as 3,796.
Table 2.1 Average UK Disposable Nappy Composition and Weight (2006)
Total Fluff pulp SAP PP LDPE Adhesives PET/polyester Other Units g % % % % % % % Average unit weight
38.6 34.1 32.4 16.6 6.0 3.8 2.2 4.8
2.2 Waste management Based on data from Defra on waste management routes in 2005/06, ERM assumed 86 per cent landfill and 14 per cent energy from waste for residual waste management.
2.2.1 Excreta
In the previous study, it was assumed that 365kg of excreta was disposed with nappies as municipal solid waste over two and a half years. A small survey and analysis of bins by WRAP estimated the weight of excreta as 727kg. ERM modelled the WRAP estimate in a sensitivity analysis. The composition of excreta was assumed to be the same, 18 per cent faeces and 82 per cent urine.
2.2.2 Modelling of waste management
Regarding landfill and energy from waste, the recent peer-reviewed software tool, WRATE, was used to model waste management activities. The research and documentation associated with WRATE suggests gas generation is complete within 100 years, and leachate release to groundwater approaches levels of contaminant detection within 20,000 years. WRATE attributes these total emissions of gas and leachate to the material as soon as it is landfilled. WRATE takes into account all the stages in the management and processing of waste, from the point where it is discarded to the controlled disposal or recovery of the waste. The tool also takes into account operational inputs and outputs of the waste management facilities according to the municipal solid waste fractions handled. It also calculates avoided burdens due to materials and energy displacement.

Science Report – An updated lifecycle assessment study for disposable and reusable nappies 13
The upstream limit of the system is the production of municipal solid waste. The model does not account for the energy and material costs of producing the products that make up the waste. The model covers municipal solid waste, which is comprised of household collected waste and the main civic amenity/bring system wastes. The tool takes account of waste collection and processing stages and their associated sub stages. To model the 100 per cent anaerobic digestion sensitivity scenario, the MBT - Hydro-Mechanical Separation and Anaerobic Digestion (with energy recovery) technology model in WRATE was manipulated by ERM to accept and to process disposable nappies.
Table 2.2 Disposable Nappy Composition
Scenario Urine Faeces Plastics Pulp Miscellaneous kg kg kg kg kg Original 299 66 84 50 13 WRAP Estimate* 596 131 84 50 13 *The same urine to faeces split is assumed

14 Science Report – An updated lifecycle assessment study for disposable and reusable nappies
3 Inventory data for reusable nappies
3.1 Shaped nappy number, weight and manufacture Based on two complete sets of manufacturing data for shaped nappies, and the specifications of further popular shaped nappies, an average weight of 139.3g per nappy has been assumed. The nappies are 100 per cent cotton. ERM has assumed, based on the birth to potty pack and guidance from other suppliers, that a minimum of thirty nappies are required over the two and a half year period that a child is in nappies.
3.2 Wraps Based on the birth to potty pack for shaped nappies, and two other wrap types, ERM calculated a wrap weight of 47.6g, and a minimum of 12 wraps required for the two and a half year period. Only one complete set of manufacturing data for wraps was obtained, and this has been used in the assessment. The composition of these wraps was 21 per cent cotton, 39 per cent polyester and 40 per cent polyurethane.
3.3 Washing data ERM used data representative of domestic washing and drying in the UK for 2005 and 2006 . These data were sourced primarily from Defra’s Market Transformation Programme, from the online ‘What if? Tool’. The tool forecasts data from 1999 to 2020 for electricity and water consumption by washing machines (WMs), washer/driers (WDs) and tumble driers (TDs). Based on these data, ERM calculated domestic washing and drying performance in the UK for: • UK stock average performance for:
o Water use. o Electricity use.
• UK ‘most efficient’ performance for:
o Water use. o Electricity use.
3.3.1 Summary of washing and drying performance
Table 3.1 shows the electricity and water use figures for washing used by ERM in the study. These figures were calculated from the more detailed data shown in Section 3.2.2. The stock average figures represent the market average performance for washing machines and washer/driers, based on electricity and water consumption by energy label class. The figures in Table 3.2 exclude electricity and water consumption used in a pre-wash cycle. ERM estimated an average pre-wash cycle, based on an

Science Report – An updated lifecycle assessment study for disposable and reusable nappies 15
Öko-Institut (2005) LCA study of washing machines in Germany. No data were available describing temperature or frequency of pre-washing in the UK. ERM assumed that a pre-wash is run as a cold wash and consumes a minimum quantity of electricity and water, as shown in Table 3.2. It was assumed that a pre-wash is used before every washing cycle for nappies.
Table 3.1 Summary of UK Washing Performance
Washing temperature
Electricity use: stock average
Water use: stock average
Electricity use: A+ rated washing
machine
Water use: A+ rated washing
machine oC kWh per load litres per load kWh per load litres per load 40 0.74 70 0.60 46 60 1.04 70 1.00 46 90 1.85 70 1.66 46
Table 3.2 Pre-Washing Performance
Washing temperature Electricity use: average
Water use: average
oC kWh per load litres per load 20 0.25 35
Source: (Öko-Institut, 2005) Note: Data provided in the Öko-Institut report provides an estimate for minimum electricity and water consumption per load. ERM assumed this to be equivalent to a pre-rinse cycle.
Table 3.3 shows the electricity and water use figures for driers. These figures were calculated from the more detailed data shown in Section 3.3.3. The stock average figures represent the market average performance for washer/driers and tumble driers based on electricity and water consumption by energy label class.
Table 3.3 Summary of UK Drying Performance
Electricity use: stock average
Water use: stock average
Electricity use: A-rated tumble drier
Electricity use: stock average
A-rated drier kWh per load litres per load kWh per load kWh per load
2.99 19 1.71 1.88
3.3.2 UK washing data and assumptions
The data used to calculate UK washing performance (a combination of washing machines and washer driers) are presented below, including data for the following:
• Washer stocks. • Washer energy consumption. • Washer water consumption. • Washer load size.
16 Science Report – An updated lifecycle assessment study for disposable and reusable nappies
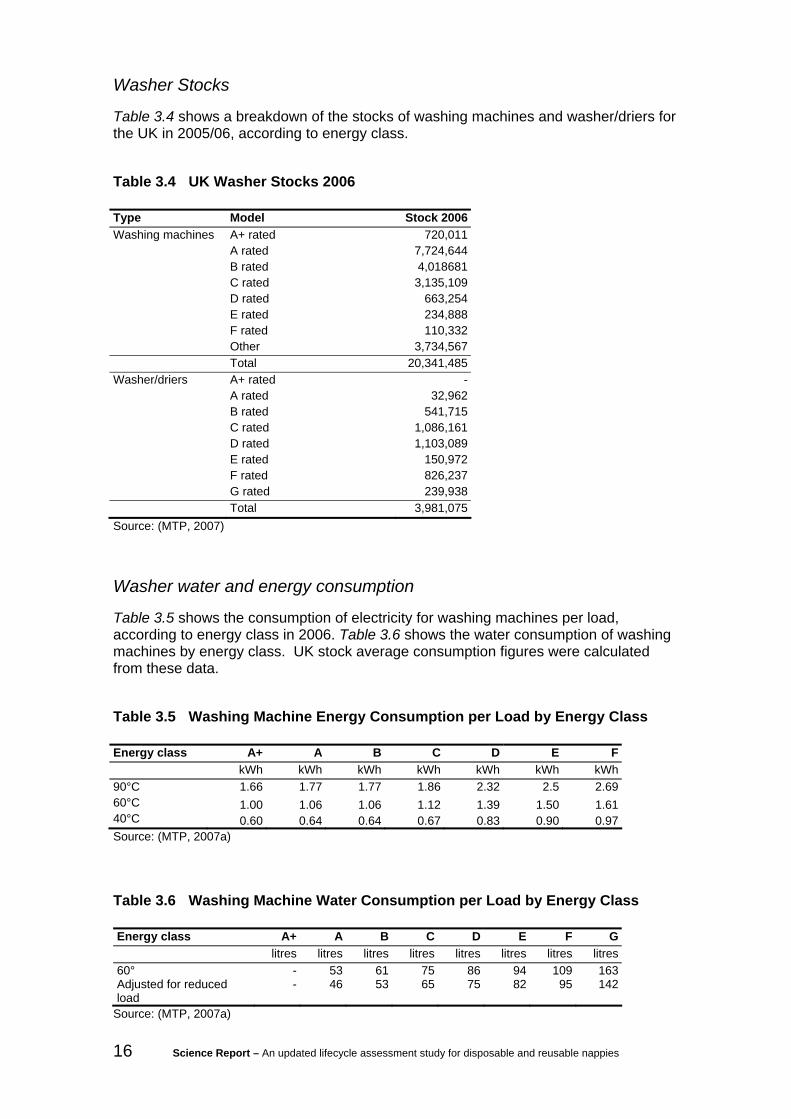
Washer Stocks
Table 3.4 shows a breakdown of the stocks of washing machines and washer/driers for the UK in 2005/06, according to energy class.
Table 3.4 UK Washer Stocks 2006
Type Model Stock 2006Washing machines A+ rated 720,011 A rated 7,724,644 B rated 4,018681 C rated 3,135,109 D rated 663,254 E rated 234,888 F rated 110,332 Other 3,734,567 Total 20,341,485Washer/driers A+ rated - A rated 32,962 B rated 541,715 C rated 1,086,161 D rated 1,103,089 E rated 150,972 F rated 826,237 G rated 239,938 Total 3,981,075Source: (MTP, 2007)
Washer water and energy consumption
Table 3.5 shows the consumption of electricity for washing machines per load, according to energy class in 2006. Table 3.6 shows the water consumption of washing machines by energy class. UK stock average consumption figures were calculated from these data.
Table 3.5 Washing Machine Energy Consumption per Load by Energy Class
Energy class A+ A B C D E F kWh kWh kWh kWh kWh kWh kWh 90°C 1.66 1.77 1.77 1.86 2.32 2.5 2.69 60°C 1.00 1.06 1.06 1.12 1.39 1.50 1.61 40°C 0.60 0.64 0.64 0.67 0.83 0.90 0.97 Source: (MTP, 2007a)
Table 3.6 Washing Machine Water Consumption per Load by Energy Class
Energy class A+ A B C D E F G litres litres litres litres litres litres litres litres 60° - 53 61 75 86 94 109 163 Adjusted for reduced load
- 46 53 65 75 82 95 142
Source: (MTP, 2007a)

Science Report – An updated lifecycle assessment study for disposable and reusable nappies 17
According to testing conducted by MTP, a typical consumer wash is usually less than a full load, using 13 per cent less water. Table 3.6 accounts for this reduced water use, which has been assumed to be typical behaviour in the UK.
Washer/driers Table 3.7 and Table 3.8 show the consumption of electricity and water for washer driers per load according to energy class in 2005/06. Data were not available for washing energy consumption. ERM assumed that an average washer/drier has the same electricity consumption per load as a B-rated washing machine. Additionally, water consumption data only cover energy ratings B to D. When calculating stock average water consumption we have only considered these energy ratings. Other ratings were excluded. This assumption covers approximately 70 per cent of washer/driers on the market.
Table 3.7 Washer/Drier Energy Consumption for Washing per Load by Energy Class
Stock average kWh 90°C 1.77 60°C 1.06 40°C 0.64 Note: ERM assumed that an average washer/drier has the same electricity consumption per load as a B-rated washing machine.
Table 3.8 Washer/Drier Water Consumption for Washing per Load by Energy Class
Energy class A+ A B C D E F G litres litres litres litres litres litres litres litres 60° - - 51 61 61 - - -
Source: (MTP, 2007a)
Washing load
In terms of washing load, according to MTP (2007a), the UK average washing machine capacity is 5.6kg. Table 3.9 shows the washing machine load capacity data available from MTP. Data were only available for class A+ and class C. For the study we have assumed an average load of 2.8kg.
Table 3.9 Washing Machine Load Capacity by Energy Class
Energy class A+ A B C D E F G kg kg kg kg kg kg kg kg Washing capacity 5.86 - - 4.86 - - - -
Source: (MTP, 2007a)

18 Science Report – An updated lifecycle assessment study for disposable and reusable nappies
3.3.3 UK drying data and assumptions
The data used to calculate drying performance are presented below, including data for the following.
• Drier stocks. • Drier energy consumption. • Drier water consumption. • Drier load. • Frequency of drying.
Drier stocks
Table 3.10 shows a breakdown of the stock of driers for the UK in 2005/06, according to energy class. Table 3.11 shows a breakdown of the stock of washer/driers. The Office for National Statistics (ONS) publishes data relating to tumble drier household ownership in the UK. From 1994 to 2002/03, tumble drier ownership by household increased from 50 per cent to 56 per cent (ONS, 2003). The ONS also publishes data relating to ownership by household type, which suggests that tumble drier ownership is more common in households with children. In households with two or more children, ownership ranges between 61 and 76 per cent.
Table 3.10 Tumble Drier Ownership Amongst Households with Children
Composition of Households with children Percentage of households with a tumble drier One adult, one child 46 One adult, two or more children 61 One man and one woman, one child 73 One man and one woman, two or more children 76 All other households with children 62 Source: Office for National Statistics, xxxx.

Science Report – An updated lifecycle assessment study for disposable and reusable nappies 19
Table 3.11 UK Drier Stocks 2006
Source: (MTP, 2007)
Drier water and energy consumption
Table 3.12 and Table 3.13 show the consumption of electricity per load for tumble driers and washer/driers, according to energy class, in 2006. Table 3.1 shows the water consumption of washer/driers for the drying cycle. Washer/driers consume water to aid the condensing process when drying. UK stock average consumption figures were calculated from these data.
Table 3.12 Tumble Drier Energy Consumption per Load by Energy Class
Energy Class A B C D E F G kWh kWh kWh kWh kWh kWh kWh Vented 1.71 1.98 2.24 2.51 2.78 3.05 3.35 Condenser 1.84 2.14 2.45 2.75 3.05 3.35 3.69 Source: (MTP, 2007a)
Type Model Stock 2006Condenser A+ rated - A rated B rated - C rated 2,202,156 D rated 543,447 E rated - F rated - Other - Total 2,745,605Vented A+ rated - A rated 58,763 B rated - C rated 2,295,130 D rated 2,912,330 E rated 654,654 F rated - Other - Total 5,920,878Vented compact A+ rated - A rated - B rated - C rated - D rated 236,685 E rated - F rated 337,092 Other 136,841 Total 710,618 Grand Total 9,377,101

20 Science Report – An updated lifecycle assessment study for disposable and reusable nappies
Table 3.13 Washer/Drier Energy Consumption for Drying per Load by Energy Class Energy class A+ A B C D E F G kWh kWh kWh kWh kWh kWh kWh kWh Drying - 2.18 2.92 3.52 4.12 4.72 5.32 5.88
Source: (MTP, 2007a)
Table 3.14 Washer/Drier Water Consumption for Drying per Load by Energy Class
Energy class A+ A B C D E F G litres litres litres litres litres litres litres litres Drying - - 29 65 79 - - -
Source: (MTP, 2007a)
Drier load
Based on data from MTP (2007b), ERM estimated the stock average drier capacity to be 3.5kg. This data reference was used to determine the average energy consumption for drying 1kg of nappies.
Frequency of drying
The total number of washing machines in the UK is 20,341,486, and there are 3,981,074 washer/driers. MTP estimates the total number of washing cycles per machine per year to be 274. There are 9,377,098 tumble driers in the UK. The total number of drying cycles per machine per year is estimated to be 148 for tumble driers and 97 for washer/driers. Based on these data, ERM estimated that, on average, 26.6 per cent of all washing cycles are followed by a drying cycle.
The use of tumble driers is dictated by ownership, convenience and the availability of other drying methods. Other drying methods include radiators, line drying indoors and line drying out of doors. Indoor drying consumes energy for part of the year as a result of an increased demand on central heating systems that are generally thermostatically controlled, whilst outdoor drying uses solar energy (wind and temperature). Outdoor line drying relies on climatic conditions. In the UK, precipitation is expected on between 150 and 200 days each year (Met Office, 2007).

Science Report – An updated lifecycle assessment study for disposable and reusable nappies 21
4 Results The results presented reflect the assumptions made and the scenarios assessed, and should be read in this context.
4.1 Disposable nappies Table 4.2 summarises a selection of the life cycle inventory flows for the manufacture and use of disposable nappies for the baseline scenarios examined in the sensitivity analysis. These results compare the baseline with the 10 per cent lightweighting sensitivity scenario. This weight reduction is a predicted change, but one that cannot be achieved immediately. The results should be considered in this context. For all inventory flows, the results directly relate to the reduction in manufacturing material inputs, where a 10 per cent reduction in weight gives a comparable reduction in the inventory flow. Table 4.3 and Table 4.4 show the whole life impact profile for the disposable nappy baseline and scenarios considered in the sensitivity analysis. As with the inventory results, all impact category indicators decrease for the 10 per cent lightweighting sensitivity scenario, compared to the baseline. The main driver for the impacts is the production of materials used to construct the disposable nappies. Should manufacturers continue to reduce nappy weight, there will be a beneficial reduction in impacts across all categories, ranging from five per cent to nine per cent. In terms of global warming potential, the 10 per cent lightweighting sensitivity scenario shows an eight per cent reduction in impact. The sensitivity analysis scenarios considering additional excreta from the WRAP excreta estimate sensitivity scenario results in a three per cent increase in the global warming impact category. The greatest influence this scenario has is on the water pollution impact categories. The anaerobic digestion sensitivity analysis scenario shows that diversion of disposable nappies away from current residual waste management routes can benefit greenhouse gas profiles through digestion and energy recovery from the biogas produced. If we consider that the potential global warming impact for the baseline scenario is 550kg carbon dioxide equivalents per child over the two and a half year period, this equates to an estimated total global warming potential of approximately 0.4Mt carbon dioxide equivalents per year. This assumes that all children wear disposables (based on 1.7 million children in nappies at any one time). This estimate can be considered in the context of total greenhouse gas emissions for UK of approximately 700Mt of carbon dioxide equivalents. Between 2001/02 and 2006, the disposable nappy industry has reduced the manufacturing energy requirements and achieved an 13.5 per cent weight reduction in the average disposable nappy. This has reduced the global warming impact resulting from nappy use by around 12 per cent. Life cycle impacts from a system can be compared to other impacts to help understand their scale and significance. This step is referred to as normalisation. Finding the most relevant comparison is difficult, because nappy use occurs once at the beginning of a

22 Science Report – An updated lifecycle assessment study for disposable and reusable nappies
lifetime and over approximately two and a half years. If the data were available, the impacts of a child using nappies in its first two and a half years could be compared with the total impacts of a child up to two and a half years or with an individual’s lifetime impacts. Table 4.1 compares the impacts for an average child over the two and a half years with the average annual impact profile of a European person. The use of disposable nappies by an average child over two and a half years is equivalent to between 0.1 and 12 per cent of the emissions from one average person in one year.
Table 4.1 Normalised Baseline Results (Europe 1995 (EU15 plus Norway and Switzerland))
Impact category Unit Disposable nappy baseline* Abiotic depletion person year equivalents 0.115Acidification person year equivalents 0.047Eutrophication person year equivalents 0.012Fresh water aquatic ecotoxicity person year equivalents 0.001Global warming potential person year equivalents 0.044Human toxicity person year equivalents 0.003Photochemical oxidation person year equivalents 0.009 * The results compare two and a half years of nappy use with one year of emissions from an average European person.

Science Report – An updated lifecycle assessment study for disposable and reusable nappies 23
Table 4.2 Inventory Analysis for Baseline Disposable and Lightweighting Sensitivity Scenario (Manufacture and Use Excluding Disposal)
Inventory Flow Coal (hard) Oil Natural gas Carbon dioxide (fossil)
Methane SOx NOx N2O Total water*
Water (direct)
kg kg m3 kg kg kg kg kg m3 m3 0 – baseline 43 107 86 474 1.1 1.8 2.2 0.02 141 0.048 Sensitivity 00 - 10% Lightweighting 39 98 77 436 1.0 1.6 2.0 0.02 130 0.043 *Includes hydro power requirements and power station cooling
Table 4.3 Impact for Disposable Nappy Baseline and Sensitivity Scenarios (Whole Life – Includes Disposal)
Impact category Abiotic depletion Acidification Eutrophication Fresh water aquatic
ecotoxicity
Global warming potential
Human toxicity
Photochemical oxidation
kg Sb eq kg SO2 eq kg PO43- eq kg 1,4-DB eq kg CO2 eq kg 1,4-DB eq kg C2H4
0 – baseline 4.5 3.4 0.40 1.9 550 58 0.20 Sensitivity 00 - 10% lightweighting 4.1 3.1 0.37 1.9 509 56 0.19 000 – with WRAP excreta estimate 4.4 3.4 0.46 2.5 570 61 0.21 0000 – with 100% anaerobic digestion 4.4 3.3 0.39 2.8 512 68 0.20 Note: The human and aquatic toxicity impact methods should be treated with caution due to the limitations associated with the methods.

24 Science Report – An updated lifecycle assessment study for disposable and reusable nappies
Table 4.4 Impact for Disposable Nappy Baseline and Sensitivity Scenarios (Whole Life – Includes Disposal)
Impact category Abiotic depletion Acidification Eutrophication Fresh water aquatic
ecotoxicity
Global warming potential
Human toxicity
Photochemical oxidation
kg Sb eq kg SO2 eq kg PO43- eq kg 1,4-DB eq kg CO2 eq Kg 1,4-DB eq Kg C2H4
0 – baseline 4.5 3.4 0.40 1.9 550 58 0.20 Sensitivity 00 - 10% lightweighting -9% -9% -7% -5% -8% -5% -5% 000 – with WRAP excreta estimate -1% 2% 14% 26% 3% 4% 3% 0000 – with 100% anaerobic digestion -1% -2% -2% 46% -7% 16% -1% Note: The human and aquatic toxicity impact methods should be treated with caution due to the limitations associated with the methods.

Science Report – An updated lifecycle assessment study for disposable and reusable nappies 25
4.2 Shaped nappies Table 4.5 and Table 4.6 summarise a selection of the life cycle inventory environmental consumptions and flows for the manufacture and use of shaped nappies for each scenario.
Table 4.5 Electricity and Water Consumption
Electricity consumption Water consumption Washing Drying Washing Flushing Drying kWh kWh l l l 1 Baseline 402.1 141.0 36 126 12 853 1576 2 High energy
efficiency 389.7 80.6 27 869 12 853 1576
3 High load efficiency 268.1 141.0 25 216 12 853 1576 4 High temperature 686.6 141.0 36 126 12 853 1576 5 100% tumble drying 402.1 529.9 36 126 12 853 5923 6 100% line drying 402.1 0.0 36 126 12 853 0 7 100% use on second
child 402.1 141.0 36 126 12 853 1576
8 Reuse, high load efficiency and 100% line-drying
268.1 0.0 25 216 12 853 0
These results indicate that the high temperature and 100 per cent tumble drying scenarios, overall, have the largest inventory flows. This is due primarily to increased electricity consumption for washing or drying in consumer use. The extreme sensitivity scenario (100 per cent reuse, high load efficiency and 100 per cent line drying) generates the lowest profile in terms of inventory flows. With the exception of the baseline, which reflects what could be expected of the population as a whole, the scenarios reflect the differences that could be achieved by an individual’s actions. Some, such as 100 per cent line drying outside, are unlikely or even impossible. Table 4.7 and Table 4.8 show the whole life impact profile for each of the shaped nappy scenarios. A similar pattern to the inventory results is followed. The main driver for these impacts is the electricity consumption in washing and drying the nappies. The high temperature and 100 per cent tumble drying scenarios show the least beneficial environmental profile across the impact category indicators, compared to the baseline. The global warming potential increases by 31 per cent for the high temperature scenario and by 43 per cent for 100 per cent tumble drying scenario. The most beneficial scenarios, in terms of reduced global warming potential, relate to the full load and 100 per cent line drying scenarios, which show a decrease in global warming potential of 16 per cent. If an A+ rated washing machine and an A-rated drier are used, as shown by the high efficiency scenario, then the global warming potential is reduced by 9 per cent, compared to the baseline.

26 Science Report – An updated lifecycle assessment study for disposable and reusable nappies
If we consider the global warming impact potential for the baseline scenario, 570kg carbon dioxide equivalents per child over two and a half years, this would equate to an estimated total global warming potential of approximately 0.4Mt CO2 equivalents per year (based on 1.7 million children in nappies at any one time, and 228kg carbon dioxide equivalents per child per year). The impact profile calculated is similar to that calculated in the previous nappies study (559kg) (Environment Agency, 2005). However, care should be taken when comparing the numbers, as it has not been possible to determine average use across the population, and there are significant differences in the nappy systems assessed and the assumptions made in this study. This estimate can be considered in the context of total annual greenhouse gas emissions for the UK of approximately 700Mt of carbon dixide equivalents per year, or 12 tonnes of carbon dioxide equivalents per person per year, or 30 tonnes of carbon dioxide equivalents per person over two and a half years. Based on the scenarios assessed, individual users of shaped nappies have the potential to improve the impact profile of nappy use per child by some 200kg over the two and a half years. Similarly, if users wash at 90°C,, and/or tumble dry every load, the impact could increase by between 175kg and 425kg of additional carbon dioxide equivalents. The water use related to shaped nappies over the two and a half year period amounts to 41 m3 of irrigation water for cotton growing, 53 m3 of direct water demand and a total water requirement (that is, including water used indirectly as a result of using shaped nappies, for example due to electricity generation) of 1,221 m3.. If all children in nappies were to use shaped nappies, this would equate to approximately 40 million m3 of direct water demand per year. Putting this in the context of total water usage, in 1997/98 3.2 billion m3 of water was used by households through the public water supply network (ONS, 2004). If all children therefore used reusable nappies, it would add one per cent to direct household water consumption.

Science Report – An updated lifecycle assessment study for disposable and reusable nappies 27
Table 4.6 Inventory Analysis for Each Shaped Nappy Scenario (Manufacture and Use Excluding Disposal)
Inventory Flow Coal (hard)
Oil Natural gas Carbon dioxide (fossil)
Methane SOx NOx N2O Total water*
Water (direct)
Water cotton
irrigation Scenario kg kg m3 kg kg kg kg kg m3 m3 m 1 – Baseline 156 28 76 515 1.7 1.1 1.0 0.03 1221 53 41 2 - High efficiency 139 27 69 469 1.6 1.1 1.0 0.03 1136 42 41 3 - High load efficiency 127 25 65 431 1.4 1.0 0.9 0.03 1277 40 55 4 - High temperature 216 29 100 678 2.1 1.3 1.2 0.04 1482 51 41 5 - 100% tumble dry 239 30 109 740 2.4 1.3 1.2 0.04 1588 55 41 6 - 100% Line dry 126 27 64 432 1.4 1.1 0.9 0.03 1082 49 41 7 - 100% re-use on 2nd child 148 26 70 484 1.6 1.0 0.9 0.03 913 51 21 Combined sensitivity 8 – Combined (re-use, load, line dry)-environmentally aware scenario 87 22 45 308 1.0 0.8 0.7 0.02 735 38 27 9 – Combined (high temp,100% tumble dry) – high energy scenario 299 31 133 904 2.8 1.4 1.4 0.05 1854 55 41 *Includes hydro power requirements and power station cooling

28 Science Report – An updated lifecycle assessment study for disposable and reusable nappies
Table 4.7 Impact Profile for Each Shaped Nappy Scenario (Whole Life – Includes Disposal)
Impact category Abiotic depletion Acidification Eutrophication Fresh water aquatic ecotoxicity
Global warming potential
Human toxicity Photochemical oxidation
kg Sb eq kg SO2 eq kg PO43- eq kg 1,4-DB eq kg CO2 eq kg 1,4-DB eq kg C2H4
1 – Baseline 4.2 1.9 0.3 4.3 568.9 73.3 0.1 2 - High efficiency 3.8 1.9 0.3 4.0 519.7 68.4 0.1 3 - High load efficiency 3.5 1.7 0.3 3.5 475.4 62.1 0.1 4 - High temperature 5.5 2.1 0.4 5.6 745.7 90.8 0.1 5 - 100% tumble dry 6.0 2.2 0.4 6.1 815.1 97.5 0.1 6 - 100% Line dry 3.5 1.8 0.3 3.6 478.3 64.4 0.1 7 - 100% re-use on 2nd child 3.9 1.7 0.3 4.1 535.4 70.3 0.1 Combined sensitivity 8 – Combined (re-use, load, line dry) 2.5 1.3 0.2 2.6 342.3 49.5 0.1 9 – Combined (high temp,100% tumble dry) 7.3 2.4 0.4 7.5 992.8 115.0 0.1 Note: The human and aquatic toxicity impact methods should be treated with caution due to the limitations associated with the methods.

Science Report – An updated lifecycle assessment study for disposable and reusable nappies 29
Table 4.8 Impact Change (%) for Each Shaped Nappy Scenario Compared with Baseline
Impact category Abiotic depletion Acidification Eutrophication Fresh water aquatic ecotoxicity
Global warming potential
Human toxicity
Photochemical oxidation
kg Sb eq kg SO2 eq kg PO43- eq kg 1,4-DB eq kg CO2 eq kg 1,4-DB eq kg C2H4
1 – Baseline 4.2 1.9 0.3 4.3 568.9 73.3 0.12 - High efficiency -9% -3% -2% -8% -9% -7% -3%3 - High load efficiency -16% -11% -13% -19% -16% -15% -9%4 - High temperature 31% 11% 7% 31% 31% 24% 10%5 - 100% tumble dry 43% 16% 14% 42% 43% 33% 15%6 - 100% Line dry -16% -6% -5% -16% -16% -12% -5%7 - 100% re-use on 2nd child -6% -10% -9% -5% -6% -4% -6%Combined sensitivity 8 – Combined (re-use, load, line dry) -40% -30% -30% -41% -40% -33% -23%9 – Combined (high temp,100% tumble dry) 74% 27% 21% 73% 75% 57% 25% Note: bold and italic indicates where impacts have increased compared to baseline. Note: The human and aquatic toxicity impact methods should be treated with caution due to the limitations associated with the methods.

30 Science Report – An updated lifecycle assessment study for disposable and reusable nappies
Life cycle impacts from a system can be compared to other impacts to help understand their scale and significance - referred to as normalisation. Table 4.9 normalises the impacts by comparing the impacts for an average child over the two and a half years with the average annual impact profile of a European person. The baseline use of shaped nappies by an average child over two and a half years is equivalent to between 0.1 and 11 per cent of the emissions from one average person in one year. As discussed above, if the data were available, comparing these impacts with the total impacts of a child up to two and a half years or with an individual’s lifetime impacts could be more relevant.
Table 4.9 Normalised Baseline Results (Europe 1995 (EU15 plus Norway and Switzerland))
Impact category Unit Shaped nappy baseline
Abiotic depletion person year equivalents 0.108Acidification person year equivalents 0.027Eutrophication person year equivalents 0.010Fresh water aquatic ecotoxicity person year equivalents 0.003Global warming potential person year equivalents 0.045Human toxicity person year equivalents 0.004Photochemical oxidation person year equivalents 0.005 * The results compare two and a half years of nappy use with one year of emissions from an average European person.

Science Report – An updated lifecycle assessment study for disposable and reusable nappies 31
5 Conclusions The study has estimated, using a 2006 reference point, the environmental impacts of a child using disposable nappies for the first two and a half years of its life and a child using shaped cloth nappies for the same period. The study demonstrates the environmental effects of:
• Disposable nappy design and manufacturing. • Disposable nappy disposal choices. • Laundry choices for shaped nappy use.
The average 2006 disposable nappy would result in a global warming impact of approximately 550kg of carbon dioxide equivalents used over the two and a half years a child is typically in nappies. The global warming impact from disposable nappies use has decreased since the previous study due to manufacturing changes and a 13.5 per cent reduction in the weight of nappies. The report highlights that the manufacture of disposable nappies has greater environmental impact in the UK than their waste management by landfill. For reusable nappies, the baseline scenario based on average washer and drier use produced a global warming impact of approximately 570kg of carbon dioxide equivalents. However, the study showed that the impacts for reusable nappies are highly dependent on the way they are laundered. Washing the nappies in fuller loads or line-drying them outdoors all the time (ignoring UK climatic conditions for the purposes of illustration) was found to reduce this figure by 16 per cent. Combining three of the beneficial scenarios (washing nappies in a fuller load, outdoor line drying all of the time, and reusing nappies on a second child) would lower the global warming impact by 40 per cent from the baseline scenario, or some 200kg of carbon dioxide equivalents over the two and a half years, equal to driving a car approximately 1,000 km. In contrast, the study indicated that if a consumer tumble-dried all their reusable nappies, it would produce a global warming impact 43 per cent higher than the baseline scenario. Similarly, washing nappies at 90°C instead of at 60°C would increase global warming impact by 31 per cent over the baseline. Combining these two energy intensive scenarios would increase the global warming impact by 75 per cent over the baseline scenario, or some 420kg of carbon dioxide equivalent over the two and a half years. The environmental impacts of using shaped reusable nappies can be higher or lower than using disposables, depending on how they are laundered. The report shows that, in contrast to the use of disposable nappies, it is consumers’ behaviour after purchase that determines most of the impacts from reusable nappies. Cloth nappy users can reduce their environmental impacts by:
• Line drying outside whenever possible. • Tumble drying as little as possible. • When replacing appliances, choosing more energy efficient appliances (A+
rated machines are preferred). • Not washing above 60°C. • Washing fuller loads. • Reusing nappies on other children.

32 Science Report – An updated lifecycle assessment study for disposable and reusable nappies
References Environment Agency, 2005, Life Cycle Assessment of Disposable and Reusable Nappies in the UK. Environment Agency, 2004, Time to change? An Environment Agency study of parental habits in the use of disposable and reusable nappies. Environment Agency. Office for National Statistics ,2003 Percentage of Households with Durable Goods by Income Group and Household Composition 2001-02: Expenditure and Food Survey (Revised September 2003). Office for National Statistics, 2004, Environmental Accounts Autumn 2004 MTP, (2007). What-if Tool. Market Transformation Programme. Defra, United Kingdom. www document (accessed August 2007) http://whatif.mtprog.com/Level3/SelectScenario.aspx MTP, 2007a. BNW05: Assumptions underlying the energy projections for domestic washing machines - Version 3.1. Market Transformation Programme. Defra, United Kingdom. MTP, 2007b. BNW06: Assumptions underlying the energy projections for domestic tumble driers - Version 3.1. Market Transformation Programme. Defra, United Kingdom. Öko-Institut, 2005. Eco-Efficiency Analysis of Washing machines. Life Cycle Assessment and determination of optimal life span. November 2005. Öko-Institut e.V. Germany. Met Office Hadley Centre for Climate Change, 2007, Daily England and Wales precipitation data 1931 to date. www data (accessed September 2007) http://hadobs.metoffice.com/hadukp/data/daily/HadEWP_daily_qc.txt

We are The Environment Agency. It's our job to look after your environment and make it a better place – for you, and for future generations.
Your environment is the air you breathe, the water you drink and the ground you walk on. Working with business, Government and society as a whole, we are making your environment cleaner and healthier.
The Environment Agency. Out there, making your environment a better place.
Published by: Environment Agency Rio House Waterside Drive, Aztec West Almondsbury, Bristol BS32 4UD Tel: 0870 8506506 Email: [email protected] www.environment-agency.gov.uk © Environment Agency All rights reserved. This document may be reproduced with prior permission of the Environment Agency.


![4800Index [ ] · Web viewAs additional information is collected and refined through the lifecycle, the cost estimates, schedules, and business objectives will be progressively updated](https://img.dokumen.tips/doc/110x75/5aaf59be7f8b9a25088d640c/4800index-viewas-additional-information-is-collected-and-refined-through-the.jpg)