Embed Size (px)
Citation preview

An SMT-Selection Metric to Improve MultithreadedApplications’ Performance
Justin R. Funston, Kaoutar El Maghraoui, Joefon Jann, Pratap Pattnaik, Alexandra Fedorova*
IBM T.J Watson Research Center Simon Fraser University*
Abstract—Simultaneous multithreading (SMT) increases CPUutilization and application performance in many circumstances,but it can be detrimental when performance is limited by appli-cation scalability or when there is significant contention for CPUresources. This paper describes an SMT-selection metric thatpredicts the change in application performance when the SMTlevel and number of application threads are varied. This metricis obtained online through hardware performance counters withlittle overhead, and allows the application or operating systemto dynamically choose the best SMT level.
We have validated the SMT-selection metric using a variety ofbenchmarks that capture various application characteristics ontwo different processor architectures. Our results show that theSMT-selection metric is capable of predicting the best SMT levelfor a given workload in 90% of the cases. The paper also showsthat such a metric can be used with a scheduler or applicationoptimizer to help guide its optimization decisions.
I. INTRODUCTION
The VLSI technologies of the past few years, while givingsignificant increases in transistor density, have not been ableto deliver corresponding increases in transistor performance.One of the architectural techniques used in improving theoverall performance of a wide range of applications has beenSimultaneous Multithreading (SMT) [1]. It is designed toimprove CPU utilization by exploiting both instruction-levelparallelism and thread-level parallelism. The first extensiveuse of SMT in a commercial processor design was for Alpha21464 (EV8), which was slated for 2004, but did not make itto the market. Intel’s first SMT-capable processor (marketedas Hyper-Threading) was the Foster-based Xeon in 2002,and in 2008 Intel reintroduced SMT with the Nehalem-basedCore i7. IBM designed a fairly sophisticated SMT processor,POWER5 [2], by enabling dynamically managed levels ofpriority for hardware threads. The POWER5 processors wereavailable in May 2004. Since then, IBM has developed the nexttwo generations of POWER processors with further sophisti-cations in resource allocations. In SMT, the processor handlesa number of instruction streams (typically small number) fromdifferent threads in the same cycle. The execution context, likethe program counter, is duplicated for each hardware thread,while most CPU resources, such as the execution units, thebranch prediction resources, the instruction fetch and decodeunits and the cache, are shared competitively among hardwarethreads. In general the processor utilization increases becausethere are more instructions available to fill execution units
and because instructions from other hardware threads canbe executed while another instruction is stalled on a cachemiss. Since the threads share some of the key resources, it isperformance efficient to schedule threads with anti correlatedresource requirements. From the software perspective, theresource allocation to a thread becomes the focal point forSMT specific performance improvement, and is the topic ofthis research.
Several studies have shown that SMT does not alwaysimprove the performance of applications [3], [4], [5]. Theperformance gains from SMT vary depending on a numberof factors: The scalability of the workload, the CPU resourcesused by the workload, the instruction mix of the workload, thecache footprint of the workload, the degree of sharing amongthe software threads, etc. Fig. 1 shows the performance ofthree benchmarks with and without SMT (4-way SMT) on the8-core POWER7 microprocessor. We first run the applicationwith eight threads at SMT1. Then we quadruple the numberof threads and enable SMT4. Note that for Equake, SMT4degraded the performance of the application, while it improvedthe performance of EP. MG’s performance was oblivious towhatever SMT level was used.
These data motivate the following question: Given a multi-threaded application, will it benefit from additional hardwarecontexts available via SMT, as we increase the number ofthreads? Addressing this question is the focus of our work.
Equake MG EP0
0.5
1
1.5
2
2.5
3
SMT1SMT4
Applications
Perf
orm
ance
Nor
mal
ized
to S
MT1
Fig. 1: Comparison of performance with SMT1 vs. SMT4 for3 applications on an 8-core POWER7 system. Each applicationis run alone in a separate experiment. The application uses 8threads under SMT1 and 32 threads under SMT4.

0 10 20 30 40 50 60 70 800
0.5
1
1.5
2
2.5
3
L1 misses/1000 instructions
SM
T4/S
MT1
Spe
edup
1 2 3 4 5 6 7 8 9 10 110
0.5
1
1.5
2
2.5
3
CPI
SM
T4/S
MT1
Spe
edup
0 2 4 6 8 10 120
0.5
1
1.5
2
2.5
3
Branch Mispredictions/1000 instructions
SM
T4/S
MT1
Spe
edup
0 10 20 30 40 50 60 700
0.5
1
1.5
2
2.5
3
% of VSU Instructions
SM
T4/S
MT1
Spe
edup
Fig. 2: Speedup on SMT4/SMT1 plotted against cache misses, CPI, branch-mispredictions, and fraction-of-floating-point/vectorinstructions for 27 benchmarks on the POWER7 processor. Eight threads are used under SMT1 (on eight cores), 32 threadsare used under SMT4.
In general, workloads that benefit from SMT contain threadsthat under-utilize certain processor resources as well as threadsare able to make use of those resources. Reasons why such”symbiotic” situations occur include:
1) A large number of cache misses: For a non-SMT proces-sor, when an instruction miss occurs, no more instruc-tions are issued to the pipeline until more instructionshave been brought to the instruction cache. A similarsituation happens in the case of a data cache miss, thestream of instructions ceases execution until the missingdata is brought to the cache. Such situations could resultin delays ranging from tens to hundreds of cycles. SMTenables one or more other hardware threads to executetheir instruction streams when such delays occur; hence,maximizing the use of the processor pipeline.
2) Long chains of instruction dependencies: Inter-instruction dependencies limit the instruction-levelparallelism of applications. Based on the layout of themultiple pipeline stages, compilers attempt to generateindependent instructions that can be executed in parallel.When dependencies exist, the next instruction ceasesexecution until it can receive the results of the previousinstruction. So if the workload exhibits very long chainsof instruction dependencies, SMT could help to fill thegaps by allowing other independent instruction streamsfrom other threads to execute in the otherwise idleexecution units.
3) A large number of branch mis-predictions: When thebranch history table and the branch target buffer are notlarge enough to service a large number of branch mis-predictions, the execution units remain idle. This is againanother opportunity for SMT to allow other hardwarethreads to use the execution units while the branch mis-prediction is being resolved.
The workloads in these examples are expected to benefitfrom SMT, because one or more threads leave resources idle,but other threads have sufficient diversity in the instruction mixto put these resources to use. At the same time, if a workloadconsists of threads that are individually well optimized for asuper-scalar processor (e.g., they do not leave resources idle),this workload is not expected to benefit from SMT, becausethere are no resource gaps to fill.
While SMT allows executing multiple streams of instruc-
tions in the same cycle, it also introduces more resourcecontention among the hardware threads that are co-scheduledon the same core. If any of the shared resources becomes abottleneck, all threads contending for the resource will suffer,and SMT will not be beneficial. Properties of workloads thatcreate contention for resources include:
1) A homogeneous instruction mix: If one or few types ofinstruction are more common than others, the workloadmay create contention for the functional unit responsiblefor this type of instruction. For example, workloads thatare floating-point intensive are likely to gain little fromsimultaneous multithreading.
2) Intensive use of the memory system: Irrespective ofinstruction mix, a workload stressing the memory sys-tem (e.g., because of poor cache locality) may causememory-related stalls to become even longer and morefrequent on an SMT processor due to increased con-tention for the memory bandwidth. As a result, processorresource utilization could decrease instead of increasing.
In summary, we intuitively understand that workloads thatbenefit from SMT would have threads that under-use re-sources, which other threads are able to use, while at thesame time not creating contention for these resources. Atthe same time, being able to predict what is the right SMTlevel to use for a given workload is not a trivial task. Thisrequires a thorough knowledge of both the internals of theworkloads and the internals of the hardware they run on.The complexity of predicting the right SMT level becomemore paramount as the number of supported SMT levelsincreases. For instance, IBM’s POWER7 processor [6] has 4-way SMT multithreading and exposes to applications threedifferent levels: SMT disabled or SMT1 level, 2-way SMT orSMT2 level, and 4-way SMT or SMT4 level. Although thistechnology provides more flexibility, it also introduces morecomplexity since the user needs to decide what is the rightSMT level for their running application.
In an attempt to see if it is possible to predict performanceimprovements from SMT by just looking at applications’characteristics, we plotted the speedup obtained at SMT4 vs.SMT1 against four main application metrics on a POWER7machine: L1 cache misses, branch mispredictions, cycles perinstruction (CPI), and fraction of floating point operations.The experiment was conducted using 27 representative mul-

tithreaded benchmarks on a POWER7 system (more detailsabout the benchmarks used will be presented in subsequentsections). Fig. 2, shows that there is no correlation betweenany of the four metrics and the SMT speedup. Note here, thatevery dot in the figures corresponds to a given benchmark.
One option for SMT tuning is to compare applicationperformance with and without SMT in an offline analysis andthen use the configuration that results in better performance inthe field. However, this method is not effective if the hardwareused in the field is not the same as that used for original testing,and if the application behavior significantly changes dependingon the input. Another option is to vary the SMT level onlineand observe changes in the instructions-per-cycle (IPC), butthis method has limited applicability, because not all systemsallow changing the SMT level online. Furthermore, IPC is notalways an accurate indicator of application performance (e.g.,in case of spin-lock contention).
We propose an SMT-selection metric (SMTsm) that doesnot require any changes to applications or operating systemsand incurs low overhead. The metric is measured online whileapplications are being run. Our metric-based approach relieson hardware performance counters and measures the tendencyof a workload to run better or worse in more hardwarecontexts. SMTsm can be easily integrated in any user-levelscheduler or even kernel schedulers to provide insights andintelligent decision about the right SMT level to be usedby a workload. SMTsm can be measured periodically andhence allows adaptively choosing the optimal SMT level fora workload as it goes through different phases. We also showhow this metric can be used in a scheduler or a user-leveloptimizer to help guide scheduling decisions.
The rest of the paper is organized as follows: Section IIdescribes the SMT-selection metric and its rationale. SectionIII presents the experimental methodology adopted using twoprocessor architectures. Performance evaluation is presentedin Section IV. Section V describes ways the SMT-selectionmetric can be used. Related work is discussed in Section VIand finally, concluding remarks and future work are discussedin Section VII.
II. THE SMT-SELECTION METRIC
The rationale behind the SMT-selection metric is basedon how well the instructions of a workload can utilize thevarious pipelines of a processor during each cycle. An idealworkload for SMT would have a good mix of instructionsthat are capable of filling all available functional units at eachcycle. Figure 3 shows the pipeline of a generic processorcore. In each cycle, the processor fetches from the instructioncache a fixed number of instructions. These instructions arethen decoded and buffered. As resources become available,instructions can be dispatched/issued to the various execu-tion/functional units in an out-of-order manner. Issue portsare the pathways through which instructions are issued to thevarious functional units, which can operate independently. Ifthe instructions that are issued consist of a mix of load, store,branch, integer, and floating point instructions and there are
Fetch Logic
Decode Logic
Dispatch, Reorder Buffer & Issue Logic
Execution Unit
Load / Store
Load / Store
Data Cache
Data Translation
Branch
Instruction Cache
Execution Unit
Execution Unit
Issue Ports
Fig. 3: A generic processor execution engine.
little data dependencies between them, then all functional unitswill be able to be used concurrently, hence increasing theutilization of the processor.
We define the term ideal SMT instruction mix to mean a mixof instructions that is proportional to the number and types ofthe processor’s issue ports and functional units. With an idealmix, the processor is able to execute the maximum number ofinstructions supported. In order for SMT to increase utilizationthere needs to be instructions available from all the hardwarecontexts to use as many issue ports as possible. Consider amultithreaded application whose vast majority of instructionsare fixed point (integer) instructions. Running the applicationwith more hardware contexts will not help because the fixedpoint units were already occupied most of the time with onehardware context. On the other hand, if we have an applicationwith an ideal SMT instruction mix, then SMT should improveperformance since the processor will have more opportunitiesto fill all the execution units.
Since SMTsm must be able to predict whether an applica-tion benefits from additional SMT resources as we increasethe number of threads, it must also include some measure ofscalability within the application itself. After all, if there aresoftware-related scalability bottlenecks, the application willnot run better with increased number of threads irrespectiveof hardware. We observe that instruction mix, which is crucialfor predicting hardware resource utilization in SMTsm, is alsoa good indicator of the application’s scalability. An applicationthat spends significant time spinning on locks will have a largepercentage of branch instructions and a high deviation fromthe ideal SMT mix.
Equation 1 shows how to calculate the SMTsm metricfor the generic processor discussed above, where Pi denotesa unique issue port, N is the total number of issue ports,DispHeld is the fraction of cycles the dispatcher was helddue to lack of resources, TotalT ime is the wall-clock timeelapsed, and AvgThrdT ime is the average time spent byeach hardware thread. Smaller metric values indicate greaterpreference for a higher SMT. The metric consists of three

factors: i) the instruction mix’s deviation from an ideal SMTinstruction mix, ii) the fraction of cycles that the dispatcherwas held due to lack of resources, and iii) the ratio of the wall-clock time elapsed to the average CPU time elapsed per thread.fPi is the fraction of instructions that are issued to Pi. Forexample, to calculate fP1, the number of instructions issuedthrough port 1 is divided by the total number of instructions.
SMTsm = (
N−1∑u=0
(fPi − 1/N)2)1/2
∗DispHeld
∗ (TotalT ime/AvgThrdT ime)
(1)
The second factor of the SMT-selection metric is the fractionof cycles that the dispatcher was held due to lack of resources.The meaning of resources is architecture dependent and mayinclude many items but it should primarily refer to the issuequeues of the execution units. If the issue queues are filling upto the point where the dispatcher is held, then having additionalinstruction streams to dispatch from is not going to be useful.This factor is important to have in addition to the instructionmix because it indirectly captures the effect of instruction-level parallelism and cache misses. The number of cycles thedispatcher is held due to resources is easily obtained throughhardware performance counters in many modern processors.
The final factor of the metric is the ratio of the wall-clock time elapsed to the average CPU time elapsed perhardware thread. This measures scalability limitations man-ifested through sleeping or Amdahl’s law as opposed to busywaiting. This factor does not have a direct relationship withSMT preference, but scalability is an important factor toconsider since additional software threads are needed to usethe available SMT hardware contexts.
In the following subsections, we illustrate how SMTsmmetric is measured for two different processor architecture:IBM’s POWER7 and Intel’s Nehalem Core i7.
A. SMTsm on IBM’s POWER7 Processor
In a given cycle, the POWER7 [6] core can fetch up toeight instructions, decode and dispatch up to six instructions,and issue and execute up to eight instructions. The core has 12execution units: two fixed point units, two load/store units, fourdouble-precision floating-point pipelines, one vector unit, onebranch unit, one condition register (CR) unit, and one decimalfloating point pipeline. POWER7 processors support up to 4-way SMT. In other words, up to four hardware contexts canconcurrently use the core. If there is only a single softwarethread running on a core, the processor automatically runsthe core at SMT1 which gives the hardware thread access toresources that would be partitioned or disabled at higher SMTlevels. Similarly, if there are only two software threads on acore then the core runs at SMT2.
Fig. 4 shows that an issue port in POWER7 is tied toa type of instruction. For instance, a fixed point instructionalways uses a fixed point issue port. There are a total of eight
Instruction Fetch Unit (IFU)
Instruction Dispatch Unit
CR IssueQueue
Branch IssueQueue
Unified Queue 0(UQ 0)
Fixed Point (FP0)
Vector Scalar (VS0)Basic FP, VSX FP, VMX FP,VMX Complex,VMX Simple,64-Byte Store
Unified Queue 1(UQ 1)
Fixed Point (FP1)
Load/Store (LS1)
Vector Scalar (VS1)Basic FP, VSX FP, Decimal FP,Permute,64–byte Store,128–byte Store
CR Unit Branch Unit
Issue PortsLoad/Store (LS0)
Fig. 4: IBM’s POWER7 out-of-order execution engine.
issue ports: 1 port corresponds to a conditional register (CR)instruction, 1 port corresponds to a branch instruction, theremaining 6 issue ports are divided equally between the twounified issue queues, UQ0 and UQ1. Through each UQ, up toone load/store instruction, one fixed point instruction (FP) andone vector scalar (VS) instruction can be issued concurrently.It is important to note here, that the CR unit is a special unit. Itis tightly tied to the branch unit. It is also not heavily used ingeneral. This unit has been mainly designed to avoid sendingthe compare instructions through the FP unit to avoid tyingbranch prediction to the FP unit. Therefore, we consider in ourmetric both the CR and branch units as one execution unit. So,an ideal SMT instruction mix for the POWER7 architecturewould consist of 1/7 loads, 1/7 stores, 1/7 branches, 2/7 FPinstructions, and 2/7 VS instructions. The loads and storesare separated because they rely on separate resources likethe load and store buffers. To measure the second term ofthe equation (dispatcher held) in POWER7, the hardwareperformance event PM DISP CLB HELD RES can beused. The SMT-selection metric for the POWER7 processoris shown in Equation 2.
P7SMTsm = ((fL − 1/7)2 + (fS − 1/7)2
+ (fBR − 1/7)2
+ (fV S − 2/7)2 + (fFP − 2/7)2)1/2
∗DispHeld
∗ (TotalT ime/AvgThrdT ime)
(2)
B. SMTsm on Intel’s Nehalem Processor
On the Nehalem Core i7, the number of issue ports equalsthe maximum number of instructions that can be issued in acycle (see Fig. 5). In contrast to POWER7, each of the sixissue ports is used for a variety of unrelated instructions [7].The unified reservation station serves as a single schedulerfor all the execution units. It is responsible for assigninginstructions to the different execution units. The core can issueup to 6 instructions per cycle. Three of them are memoryoperations (load, store address and store data), and the other

Unified Reservation Stations (36 Entries)
Integer ALU &Shift
Integer ALU &LEA
Integer ALU &ShiftLoad Store
AddressStoreData
FP Multiply
Divide
SSE Integer ALUInteger Shuffles
FP Add
Complex Integer
SSE Integer Multiply
Branch
FP Shuffle
SSE Integer ALUInteger Shuffles
Port 1
Data Cache
Port 0
Port 2
Port 3
Port 4
Port 5
Fig. 5: Intel’s Nehalem out-of-order execution engine.
three are computational instructions (floating point, branch,and integer operations). Intel’s Nehalem core supports 2-waySMT.
Equation 3 shows the SMT-selection metric for Intel’sNehalem Core i7 processor. The term fPi refers to thefraction of instructions that have been issued through port i( i ∈ [0, 1, 2, 3, 4, 5]). Since the issue ports on Nehalem arenot related to a single type of instruction, we simply measurethe number of instructions issued to each port. All instructionsmap to a single issue port, except for integer ALU instructionswhich map to three ports, so the mix of instructions sent toeach issue port is sufficient for calculating the SMT-selectionmetric. Dispatch held can be obtained using RAT STALLSevent with the rob read port unit mask [8].
Ci7SMTsm = (
5∑i=0
(fPi − 1/6)2)1/2
∗DispHeld
∗ (TotalT ime/AvgThrdT ime)
(3)
III. EXPERIMENTAL METHODOLOGY
A. System Configuration
Experiments were conducted on an AIX/POWER7 systemand a Linux/Core i7 (Nehalem) system.
The AIX/POWER7 system uses AIX 6.1.5 and two 8-corePOWER7 chips. For the single-chip experiments, the bench-marks were restricted to run on one 8-core chip. The POWER7CPU is clocked at 3.8 GHz and the system has 64 GB ofRAM. The C, C++, and Fortran benchmarks were compiledwith IBM XL compiler 11.1.0.6 using these flags: -O3 -qstrict-qarch=auto -qsimd=auto -q64 and -qsmp=omp. The MPIprograms use the IBM Parallel Operating Environment version5.2.2.3. the Java benchmarks use the 64-bit IBM JVM version1.6.0. The SMT levels on POWER7 can be changed withoutrebooting the system by running the smtctl command withprivileged access.
The Linux/Core i7 system uses Linux kernel 2.6.34 with3GB of RAM and a four cores Intel Core i7 965 clocked at
3.2 GHz with two SMT threads per core. GCC 4.4.5 was usedto compile the benchmarks with the flags -O3 -march=nativeand -fopenmp where appropriate. Unlike POWER7, the SMTlevel can only be changed by rebooting and modifying aBIOS setting. In our experiments SMT2 is always enabledin the BIOS. Therefore to simulate SMT1 we only use onesoftware thread per core. This better represents typical usecases because SMTsm is designed to be used dynamically atrun-time.
B. Benchmarks
The experiments use a diverse set of benchmarks to capturethe variations in characteristics of various workloads. Thebenchmarks are drawn from the NAS Parallel Benchmarks(NPB) v3.3.1, the PARSEC Benchmark Suite v2.1, the SSCA2benchmark, the STREAM synthetic benchmark, the SPECOMP2001 benchmark suite v3.2 and two commercial bench-marks. Due to compatibility issues we were not able torun all of the benchmarks on the POWER7 system. Due totime constraints, we focused mostly on the POWER7 system,because it supports a higher SMT level than Nehalem; as aresult we did not run all of the benchmarks on Nehalem. Abrief description of the benchmarks used is outlined below.
• The NAS parallel benchmark Suite [9] is a set ofprograms that have been initially designed to evaluatethe performance of supercomputers. Both the MPI andOpenMP versions were used on AIX/POWER7 but onlythe OpenMP versions were used on Linux/Core i7.
• PARSEC benchmarks [10]: PARSEC stands for PrincetonApplication Repository for Shared-Memory Computers.It is a set of programs designed to evaluate the perfor-mance of Chip-Multiprocessors (CMPs). PARSEC bench-marks mimic multithreaded applications from differentfields such as recognition, mining, and large-scale com-mercial applications. PARSEC does not officially supportthe AIX operating system, so only a handful of thebenchmarks were able to be used on the AIX/POWER7system.
• SSCA2 benchmarks: SSCA, which stands for the Scal-able Synthetic Compact Applications, is a computationalgraph theory benchmark that uses OpenMP. It consists offour kernels with irregular access to a large, directed, andweighted multi-graph. This benchmark is characterizedby integer operations, a large memory footprint, andirregular memory access patterns.
• STREAM [11] is a synthetic benchmark designed tomeasure memory bandwidth and also uses OpenMP. Toobtain reasonable running times for our experiments, wehave increased the the default array size and number ofiterations to 4577.6 MB and 1000 respectively.
• SPEC OMP benchmark Suite [12] is adapted from theSPEC CPU2000 benchmarks. Its goal is to evaluate theperformance of openMP applications on shared memorymulti-processors. We have used the SPEC OMP experi-ments only on the AIX/POWER7 system.

• DayTrader [13] is a Websphere benchmark applicationthat emulates an online stock trading system. The ap-plication simulates typical trading operations such aslogin, viewing portfolios, looking up stock quotes, andbuying or selling stock shares. The benchmark consistsof a websphere front-end, a DB2 database, and a loadgenerator. The DayTrader client is a Linux Intel Xeonmachine running the JIBE (Websphere Studio WorkloadSimulator), which simulates a specifiable number ofconcurrent browser clients. We simulated 500 clientsfor stressing the DayTrader application running on theDayTrader server. This number of clients was sufficient tokeep the server continuously busy with waiting requeststo be processed.
• SPECjbb2005 is a Java server benchmark from the Stan-dard Performance Evaluation Corporation [14] based onthe TPC-C benchmark specifications. It simulates a 3-tiersystem in a JVM with emphasis on the middle tier.
• SPECjbb05-contention is a custom benchmark derivedfrom SPECjbb2005. The primary change introduced inSPECjbb05-contention is that all worker threads operateon a single warehouse instance instead of each workerthread operating on its own warehouse instance. Thisintroduces synchronization contention that is not presentin SPECjbb2005.
Table I summarizes the various benchmarks used in eachcategory. Note here that for the problem sizes presented, nativeand reference problem sizes are the largest available for theirrespective suites. For NAS benchmarks, D is a larger problemsize than C.
IV. EVALUATION
In all of the experiments conducted, the number of softwarethreads used is chosen to be the same as the number ofavailable hardware threads/contexts in the OS instance. Forexample, in the AIX instance on one 8-core POWER7 chip,32 software threads were used at SMT4, 16 software threadswere used at SMT2, and 8 software threads were used atSMT1. Similarly, on the Linux instance on the 4-core Corei7 machine, 8 software threads were used at SMT2, and 4software threads were used at SMT1.
A. SMTsm Evaluation for various Multithreaded Benchmarks
Fig. 6 shows the relationship between the SMT-selectionmetric measured at SMT4 and the speedup obtained on SMT4relative to SMT1 on the AIX/POWER7 system. We can seea clear correlation between the metric value and the speedup,and the correlation is strong enough to predict the optimumSMT level in most cases (In our experiments, the success ratewas 93%). If we set a threshold close to the value of 0.07 thenwe can be confident that any application with a metric greaterthan the threshold will perform better at SMT1 than SMT4.This is true for the majority of the benchmarks evaluated.Applications that fall to the left of the threshold are likelyto prefer SMT4, with only two of the evaluated benchmarks
0 0.025 0.05 0.075 0.1 0.125 0.15 0.175 0.2 0.225 0.250
0.5
1
1.5
2
2.5
3
Ammp
Applu
Apsi
Equake
Fma3d
Gafort
Mgrid
Swim
Wupwise
Blackscholes
BT
CG_MPI
Dedup
EP
EP_MPI
Fluidanimate
FT_MPI
IS
IS_MPI
LU_MPI
MG
MG_MPI SSCA2Stream
Streamcluster
SPECjbb
SPECjbb_contention
Daytrader
SMT-selection Metric @ SMT4
SM
T4
/SM
T1
Sp
ee
du
p
← Threshold Line
Fig. 6: SMT4/SMT1 speedup vs. metric evaluated @SMT4 –AIX instance on an 8-core POWER7 chip.
0%
10%
20%
30%
40%
50%
60%
70%
80%
90%
100%
black
shole
s
fluida
nimate
dedu
p
SSAC2
spec
jbb_c
onten
tion
idealP
7SMTmix
% Loads % Stores % Branches % FXU %VSU
1.82 1.35 0.86 0.78 0.25
SMT4/SMT1 Speedup
Fig. 7: Instruction mix of 5 benchmarks – AIX instance on an8-core POWER7 chip.
0 0.05 0.1 0.15 0.2 0.250
0.2
0.4
0.6
0.8
1
1.2
1.4
1.6
1.8
Ammp AppluApsi
Equake
Fma3dGafort
Mgrid
Swim
Wupwise
Blackscholes
BT
CG_MPI
Dedup
EP
EP_MPI
FT_MPI
ISIS_MPI
LU_MPI
MGMG_MPI
SSCA2
Stream
Streamcluster
SPECjbb
SPECjbb_contention
Daytrader
SMT-selection Metric @ SMT4
SM
T4/S
MT
2 S
peed
up
← Threshold Line
Fig. 8: SMT4/SMT2 speedup vs. metric evaluated @SMT4 –AIX instance on an 8-core POWER7 chip.

TABLE I: Benchmarks EvaluatedLabel Suite Problem Size DescriptionIS NAS D Integer Sort: Bucket sort for integersBT NAS C Block Tridiagonal: Solves nonlinear PDEs using the BT methodLU NAS C Lower-Upper: Solves nonlinear PDEs using the SSOR methodCG NAS C Conjugate Gradient: Estimates eigenvalues for sparse matricesFT NAS C Fast Fourier TransformMG NAS D MultiGrid: Approximate solution to a 3d discrete Poisson equationEP NAS D (OpenMP) Embarrassingly Parallel: Computes pseudo-random numbers
C (MPI)Blackscholes Parsec Native Computes option pricesBodytrack Parsec Native Simulates motion tracking of a personCanneal Parsec Native Cache-aware annealingDedup Parsec Native Data compression and deduplication. Heavy I/OFacesim Parsec Native Simulates human facial motionFerret Parsec Native Content similarity algorithmFluidanimate Parsec Native Fluid dynamics simulationFreqmine Parsec Native Frequent item set miningRaytrace Parsec Native RaytracingStreamcluster Parsec Native Online data clusteringSwaptions Parsec Native Pricing of financial swaptionsVips Parsec Native Image processingx264 Parsec Native Video encodingStream N/A 4578 MB x 1000 Streaming memory performance
iterationsSSCA2 N/A SCALE = 17 Graph analysis benchmark. Lock heavy
No. vertices = 217
SPECjbb SPECjbb No. warehouses = Server-side Java performance. It emulates a 3-tier system2005 No. hw. threads in a JVM with emphasis on the middle tier.
SPECjbb N/A No. warehouses = 1 Modified version of SPECjbb with only a single warehouse.contention Heavy lock contentionDaytrader N/A 500 clients Websphere trading platform simulation. Web front-end only.
Heavy network I/O.Ammp SPEC OMP2001 Reference Molecular dynamicsApplu SPEC OMP2001 Reference Fluid dynamicsApsi SPEC OMP2001 Reference Lake weather modelingEquake SPEC OMP2001 Reference Earthquake simulationFma3d SPEC OMP2001 Reference Finite element method PDE solverGafort SPEC OMP2001 Reference Genetic algorithmMgrid SPEC OMP2001 Reference Multigrid method differential equation solverSwim SPEC OMP2001 Reference Shallow water modelingWupwise SPEC OMP2001 Reference Quantum chromodynamics
0 0.05 0.1 0.15 0.2 0.25 0.30
0.2
0.4
0.6
0.8
1
1.2
1.4
1.6
1.8
2
Ammp
AppluApsi
Equake
Fma3d
Gafort
MgridSwim
Wupwise
Blackscholes
BTCG_MPI
Dedup
EP
EP_MPI
Fluidanimate
FT_MPI
IS
IS_MPI
LU_MPI
MG
MG_MPI
SSCA2Stream
Streamcluster
SPECjbb
SPECjbb_contention
Daytrader
SMT-selection Metric @ SMT2
SM
T2/S
MT
1 S
peed
up
Fig. 9: SMT2/SMT1 speedup vs. metric evaluated @SMT2 –AIX instance on an 8-core POWER7 chip.
having a metric less than the threshold and performing slightlyworse at SMT4.
In Fig. 7, we clearly see a correlation between the instruc-tion mix and the SMT4/SMT1 speedup. We have selectedrepresentative benchmarks from the set of benchmarks studied.As we move from the left of the figure to the right, the speedupgoing from SMT1 to SMT4 decreases from 1.82 to 0.25, whilethe instruction mix tends to be more and more dominated withone or fewer functional units or less diverse.
The metric versus SMT4/SMT2 speedup on AIX/POWER7is shown in Fig. 8. Once again a threshold of 0.07 providesgood separation. All of the benchmarks with a metric greaterthan the threshold prefer SMT2. Three benchmarks have ametric less than the threshold and a speedup less than 1 butgreater than 0.9. All of the remaining benchmarks have ametric below the threshold and a speedup greater than 1.
The experiment shown in Fig. 9 is the same as the previousexperiments except it uses the SMT2 over SMT1 speedup. Inthis case, the SMT-selection metric is not capable of alwaysmaking an accurate prediction. For metric values below 0.07 orabove 0.19, we can predict the optimum SMT level. However,

for metric values between 0.07 and 0.19, it is not possible topredict the application’s SMT preference.
0 0.02 0.04 0.06 0.08 0.1 0.12 0.14 0.160
0.2
0.4
0.6
0.8
1
1.2
1.4
1.6
1.8
blackscholes_pthreads
bodytrack
bodytrack_pthreads
BT CGdedup
EP
facesimferret
fluidanimate
freqmine
FTLU
raytrace
SP
streamcluster
swaptions
UA
vips
SSCA2
x264
SMT-selection Metric @ SMT2
SM
T2/S
MT
1 S
peed
up
← Threshold Line
Fig. 10: SMT2/SMT1 speedup vs. metric evaluated @SMT2– Linux instance on a quad-core Core i7 system.
Fig. 10 shows the SMT-selection metric compared tothe SMT2/SMT1 speedup on the Linux/Core i7 system. Inthis experiment, a stronger correlation than in any of theAIX/POWER7 experiments is observed. With only eight soft-ware threads running at SMT2, there is less synchronizationcontention so only a few of the benchmarks prefer SMT1over SMT2. In this case there is not much motivation forSMT optimization but the experiment does show that the SMT-selection metric can be adapted to other architectures.
In this experiment, we observe an outlier on the far right,which is Streamcluster from PARSEC. The outlying behaviorof Streamcluster is due to its unique characteristic: a largefraction of load instructions (40%). More specifically, themodel does not very well reflect the behaviour of streamclusteron Nehalem for the following reason: Since streamcluster hasan unusually high number of loads, according to our model,a single thread should tie up a particular pipeline resource(an issue port for loads, in this case). Therefore, addingmore threads will not help. However, because this applicationis memory-intensive on Nehalem (it has 8 L3 Misses perthousand retired instructions (MPKI)), the bottleneck for loadinstructions is the memory system instead of the the issue port.So, this creates a scenario where adding more SMT threadshelps: while some threads wait for memory others can continueusing pipeline resources.
On POWER7, the reason for Streamcluster being an outlierin the SMT2/SMT1 case is different, because the L3 miss rateis no longer high (POWER7 has a larger L3 cache). However,the reason still relates to Streamcluster having a high numberof loads and a low number of stores. On POWER7, loadsand stores rely on mostly the same pipeline resources (likethe issue port). Therefore, these resources do not become thebottleneck although we have many load instructions.
B. SMTsm Evaluation at a Lower-SMT level
0 0.05 0.1 0.15 0.2 0.25 0.3 0.35 0.4 0.450
0.5
1
1.5
2
2.5
3
Ammp
Applu
Apsi
Equake
Fma3d
Gafort
Mgrid
Swim
Wupwise
Blackscholes
BT
CG_MPI
Dedup
EP
EP_MPI
Fluidanimate
FT_MPI
IS
IS_MPI
LU_MPI
MGMG_MPI
SSCA2Stream Streamcluster
SPECjbb
SPECjbb_contention
SMT-selection Metric @ SMT1
SM
T4
/SM
T1
Sp
eed
up
Fig. 11: SMT4/SMT1 speedup vs. metric evaluated @SMT1– AIX instance on an 8-core POWER7 chip.
0 0.05 0.1 0.15 0.2 0.25 0.3 0.35 0.40
0.2
0.4
0.6
0.8
1
1.2
1.4
1.6
1.8
bodytrack
bodytrack_pthreads
BT
canneal
CGdedup
EP
facesim
fluidanimate
freqmine
FT
LUraytrace
SP
streamcluster
swaptions
UA
SMT-selection Metric @ SMT1
SM
T2/S
MT
1 S
peed
up
Fig. 12: SMT2/SMT1 speedup vs. metric evaluated @SMT1– Linux instance on a quad-core i7 system.
The previous subsection evaluated how well the SMTsm es-timated performance speedup is, when the SMTsm is measuredat the highest supported SMT level (SMT4). In this subsection,we evaluate the metric when the application is running at alower SMT level, and the metric is used to predict the speedupat a higher SMT level.
Figures 11 and 12 show the same experiments presented insubsection IV-A but with the SMTsm measured at the lowestsupported SMT level. The experiments did not show a goodcorrelation between the metric and the speedup. This is notsurprising, as the metric is not able to foresee scalabilitylimitations caused by more threads at a higher SMT level;the metric is only capable of detecting a slowdown when itis happening. At SMT1 we are not able to accurately capture

contention as it was the case at SMT4, so the metric breaksdown at SMT1. Therefore, it is important to use the metric atthe highest SMT-level available. Moreover, in all SMT-capableprocessors, the highest SMT-level is always used as the defaultsince many multi-threaded applications benefit from SMT.This motivates further the use of the metric at higher SMT-levels to predict whether going to a lower SMT-level benefitsthe running workload.
C. Metric Evaluation across Chips
0 0.05 0.1 0.15 0.2 0.25 0.3 0.35 0.4 0.45 0.50
0.5
1
1.5
2
2.5
3
EP
BT
MG
IS
DedupFluidanimate
Blacksholes
SSCA2Streamcluster
Stream
SPECjbb_contention
SPECjbb
CG_MPI
FT_MPI
EP_MPI
IS_MPI
Ammp
AppluApsi
Equake
Fma3d
Gafort
Mgrid
Swim
Wupwise
SMT-selection Metric @ SMT4
SM
T4
/SM
T1 S
peed
up
← Threshold Line
Fig. 13: SMT4/SMT1 speedup vs. metric evaluated @SMT4– AIX instance on two 8-core POWER7 chips.
0 0.05 0.1 0.15 0.2 0.25 0.3 0.35 0.4 0.45 0.50
0.2
0.4
0.6
0.8
1
1.2
1.4
1.6
1.8
EP
BT
MG
IS
Dedup
Fluidanimate
Blacksholes
SSCA2
Streamcluster
Stream
SPECjbb_contention
CG_MPI
EP_MPI
MG_MPI
Ammp
AppluApsi
Equake
Fma3d
Gafort
Mgrid
SwimWupwise
SMT-selection Metric @ SMT4
SM
T4/S
MT
2 S
peed
up
← Threshold Line
Fig. 14: SMT4/SMT2 speedup vs. metric evaluated @SMT4– AIX instance on two 8-core POWER7 chips.
Figures 13, 14, and 15 give the results for the SMTsmprediction experiments on an AIX instance running on a two-chip POWER7 system. For these experiments there are 16cores, which means 64 software threads are used at SMT4,32 threads are used at SMT2, and 16 threads are used at
0 0.05 0.1 0.15 0.2 0.25 0.3 0.350
0.2
0.4
0.6
0.8
1
1.2
1.4
1.6
1.8
2
Blackscholes
BTCG_MPI
Dedup
EP
EP_MPI
Fluidanimate
FT_MPI
IS
IS_MPI
LU_MPI
MGMG_MPI
SSCA2
Stream
Streamcluster
Ammp
Applu
Apsi
Equake
Fma3d
Gafort
Mgrid
Swim
Wupwise
SPECjbb_contention
SPECjbb
SMT-selection Metric @ SMT2
SM
T2/S
MT
1 S
peed
up
Fig. 15: SMT2/SMT1 speedup vs. metric evaluated @SMT1– AIX instance on two 8-core POWER7 chips.
SMT1. Using two chips introduces two new variables that themetric must compensate for to remain accurate. First, thereis a performance penalty for cross-chip communication, soapplications that are more sensitive to NUMA effects mayaffect the metric differently. Second, the number of runningsoftware threads is doubled at all SMT levels compared to thesingle chip case, so the effect of scalability is amplified.
For the SMT4/SMT1 case presented in Fig. 13, the resultsare similar to the SMT4/SMT1 experiment with only one chip.However, there are more benchmarks that are mis-predicted.We also notice, that applications that have a metric nearthe threshold are more likely to be mispredicted. Anotherdifference with the single chip experiment is that more appli-cations prefer SMT1 over SMT4. This is expected since withmore software threads, more contention for synchronizationresources will be introduced, and hence more scalabilitylimitations.
The SMT4/SMT2 results (Fig. 14) look better than theSMT4/SMT1 results, but there is still only a small differ-ence in metric values between SMT4-preferring applicationsand SMT1-preferring applications. Fig. 15 demonstrates thatSMT2/SMT1 prediction is ineffective, the same as in the singlechip case.
SMT preference prediction is important for large systemswith many cores because more applications will be hinderedby SMT as synchronization overhead and contention over CPUresources overtake the benefits of SMT. The results show thatthe SMT-selection metric is still useful at 16 cores, but morework needs to be done since the metric is less accurate at16 cores than at 8 cores. One possibility is that the scalabilitydetection aspect of the metric starts to break down with a largenumber of threads. This is supported by the fact that the metricworks better at SMT4/SMT2 prediction with 16 cores, sincethe change in the number of software threads is smaller thanwhen predicting SMT4/SMT1 speedup.
V. APPLYING THE SMT-SELECTION METRIC
The SMT-selection metric can be used by operating systemsto guide scheduling decisions. It can also be used by user-leveloptimizers or application tuners to dynamically adjust the SMTlevel of the underlying system to improve the performance ofrunning applications.
To use the SMT-selection metric, the formula must first beadapted to the target architecture. In section II, we presentedthe metric for the IBM POWER7 and Intel Nehalem archi-tectures. The metric can be ported to other architectures insimilar ways. The threshold for changing the SMT level needsto be determined for each new system. This can be achievedby running a representative set of workloads, recording theSMT speedups and the observed SMTsm metric values foreach workload, as we did in section IV. Once the (metric,speedup) values are gathered, the threshold can be obtainedautomatically using statistical techniques. We describe twomethods to obtain a good SMTsm threshold for deciding whena change in SMT level would benefit the performance of agiven application.
A. Using Gini Impurity
Gini impurity [15] is a measure of how well separated orclustered a set is. We look for a separator (potential threshold)that leads to the lowest overall Gini impurity as follows:
1) Re-label the (metric, speedup) tuples into the form(metric, i) with (i ∈ {0, 1}), setting i=0 if the speedupis less than 1, and i=1 if the speedup is greater than orequal to 1.
2) Divide the tuples into 2 sets {L=Left-set, R=Right-set}based on whether the metric value is to the left or to theright of the separator value.
3) Calculate the Gini impurity of the left-set (IL) and theright-set (IR) as shown in equations 4 and 5, where|L0| denotes the size of the left-set with i = 0 (i.e.,speedup < 1), |L1| denotes the size of the left-set withi = 1 (i.e., speedup ≥ 1), and |L| is the size of theentire left set (|L| = |L0| + |L1|). Similar notation isused with the right set.
IL = 1−[|L1||L|
]2−[|L0||L|
]2(4)
IR = 1−[|R1||R|
]2−[|R0||R|
]2(5)
4) Calculate the overall Gini impurity using equation 6.
Impurity =|L||L+R|
· IL +|R||L+R|
· IR (6)
An impurity of 0 indicates that the set is perfectly separated,i.e. all of the sample points to one side of the separator havea speedup greater than or equal to 1, and all of the remainingpoints are on the other side. A high impurity value means thatthe selected separator is not a good classifier, and vice versa.
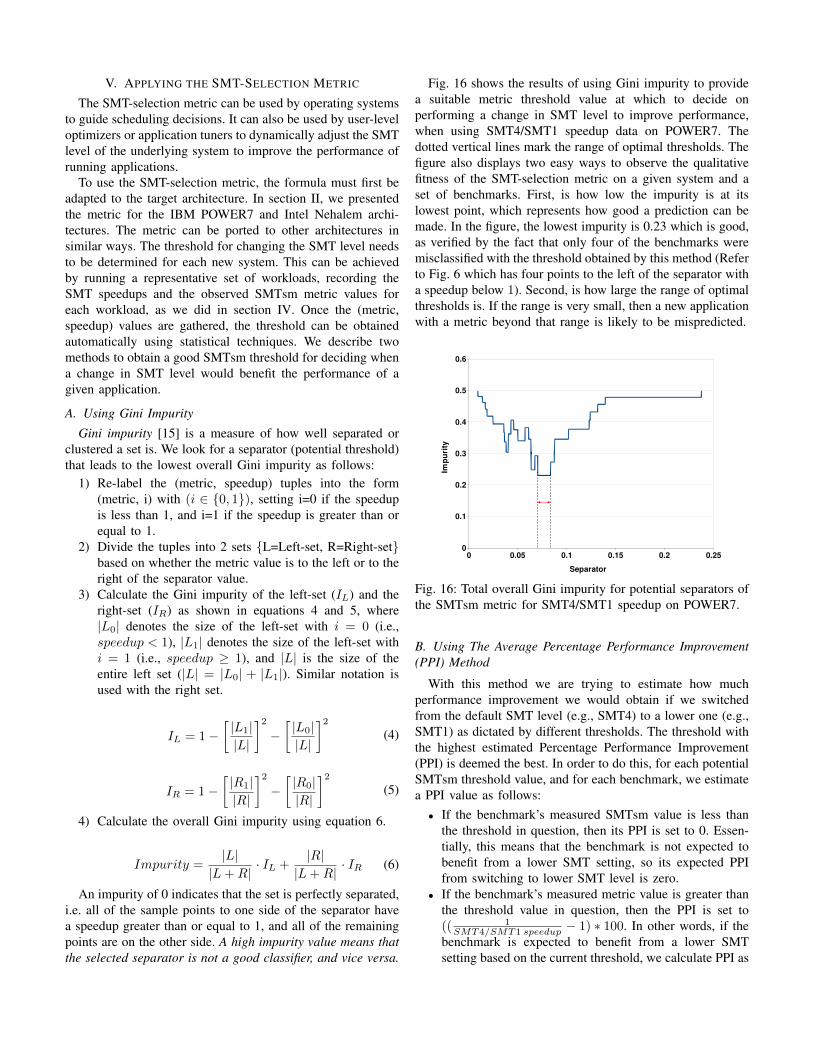
Fig. 16 shows the results of using Gini impurity to providea suitable metric threshold value at which to decide onperforming a change in SMT level to improve performance,when using SMT4/SMT1 speedup data on POWER7. Thedotted vertical lines mark the range of optimal thresholds. Thefigure also displays two easy ways to observe the qualitativefitness of the SMT-selection metric on a given system and aset of benchmarks. First, is how low the impurity is at itslowest point, which represents how good a prediction can bemade. In the figure, the lowest impurity is 0.23 which is good,as verified by the fact that only four of the benchmarks weremisclassified with the threshold obtained by this method (Referto Fig. 6 which has four points to the left of the separator witha speedup below 1). Second, is how large the range of optimalthresholds is. If the range is very small, then a new applicationwith a metric beyond that range is likely to be mispredicted.
0 0.05 0.1 0.15 0.2 0.250
0.1
0.2
0.3
0.4
0.5
0.6
Separator
Imp
uri
ty
Fig. 16: Total overall Gini impurity for potential separators ofthe SMTsm metric for SMT4/SMT1 speedup on POWER7.
B. Using The Average Percentage Performance Improvement(PPI) Method
With this method we are trying to estimate how muchperformance improvement we would obtain if we switchedfrom the default SMT level (e.g., SMT4) to a lower one (e.g.,SMT1) as dictated by different thresholds. The threshold withthe highest estimated Percentage Performance Improvement(PPI) is deemed the best. In order to do this, for each potentialSMTsm threshold value, and for each benchmark, we estimatea PPI value as follows:
• If the benchmark’s measured SMTsm value is less thanthe threshold in question, then its PPI is set to 0. Essen-tially, this means that the benchmark is not expected tobenefit from a lower SMT setting, so its expected PPIfrom switching to lower SMT level is zero.
• If the benchmark’s measured metric value is greater thanthe threshold value in question, then the PPI is set to(( 1
SMT4/SMT1 speedup − 1) ∗ 100. In other words, if thebenchmark is expected to benefit from a lower SMTsetting based on the current threshold, we calculate PPI as

the performance improvement at SMT1 relative to SMT4(expressed in percent).
Then, we take the average of the PPIs over the whole set ofbenchmarks as the Y-value to plot against that threshold value.This gives us the average expected performance improvementat each threshold level. Examining this data, we can choosethe best threshold – the one that gives us the highest PPI.
Fig. 17 shows an example of using this methodfor SMT4/SMT1 performance improvement prediction onPOWER7. The results are similar to those using Gini impurity,but this methods provides the following additional benefits:
1) It can be used to easily show how much performanceimprovement the SMTsm metric can provide. The Giniimpurity method only shows that the metric is working,but cannot show potential improvements.
2) It also gives a view of potential PPIs over a rangeof threshold values. Even though the range of optimalmetric thresholds is relatively small in both methods,we can see from Fig. 17 that there is actually a largerange of potential threshold values where we have anaverage PPI that is greater than 15%. This means that anew application whose metric value falls into this rangeis not likely to experience a severe negative effect fromusing this metric value as a threshold for deciding on achange in SMT level.
0 0.05 0.1 0.15 0.2 0.250
5
10
15
20
25
Threshold
Ave
rage
Impr
ovem
ent o
ver
Def
ault
(%)
Fig. 17: Average SMT4/SMT1 percentage performance im-provement of all the benchmarks vs. SMTsm values – AIXinstance on POWER7.
3) This method can also provide a better threshold thanthe Gini impurity method in some cases, because Giniimpurity does not consider the amount of speedup. Forexample, there could be a few benchmarks with speedupvalues just below one, and a benchmark with a verylarge speedup just to the right of them. In this case Giniimpurity would suggest putting the threshold to the leftof all the mentioned benchmarks so as to classify morebenchmarks correctly, whereas this method would sug-gest putting the threshold to the right, thereby preservingthe large speedup in return for minimal slow-downs in
the other benchmarks.
VI. RELATED WORK
SMT job schedulers and SMT performance characterizationcomprise the majority of related work. The SMT job sched-ulers are designed to find high performing (often referred toas symbiotic) co-schedules from a larger selection of runningapplications. They do not attempt to optimize the SMT levelitself like SMTsm. The SMT performance characterizationsdo investigate the effect of the SMT level but none ofthem propose a general metric or algorithm for optimizingit. Additionally, most of the previous work focus on single-threaded applications while our work studies multi-threadedapplications.
Mathis et al [4] evaluate and analyze the effect of SMT2on the POWER5 CPU with single-threaded applications. Tomeasure the SMT2 gain of an application, they simply run onecopy of the application per available hardware thread/contextwith and without SMT. The authors found that most of thetested applications have a moderate performance improvementwith SMT. They also found that applications with the smallestimprovement have more cache misses when using SMT. Thisresult is less applicable to multi-threaded applications becausethe total amount of work and data does not increase as thenumber of threads increases, like it does when you run morecopies of a single-threaded application and because threads ofa multi-threaded application may share data. Ruan et al [16]evaluate and analyze SMT effects on a network of servers butdo not attempt any optimization. They found that the overheadof using an SMP-capable kernel sometimes outweighs thebenefit of SMT. This is irrelevant today since all modern serverCPUs are at least dual-core. The authors also discovered thatSMT can sometimes hurt performance when there is more thanone CPU which supports our claim that the SMT level shouldbe optimized.
Snavely and Tullsen [17] describe a job scheduler for SMTsystems called SOS (Sample, Optimize, Symbios). The goalof SOS is to choose an effective co-schedule of applicationsfrom a pool of ready-to-run applications. SOS has a samplingphase where it tries many different co-schedules and measuresa performance predictor metric from hardware counters. Then,it has a symbiotic phase where it runs the co-schedules withthe best predicted performance. The authors evaluated severaldifferent predictors and found that a high IPC and a low L1data cache miss rate are both good predictors. They did try apredictor based on the instruction mix, but it only looked atinteger and floating point instructions and it did not take intoaccount the mix of execution units. Snavel et al [18] extendedSOS to support application priorities. Overall, SOS is effectivefor finding good co-schedules among many single-threadedapplications, but it is not designed to choose the best SMTlevel for a multi-threaded application.
Settle et al [19] designed a job scheduler similar to SOSin its goals. They use custom hardware performance countersto create a fine-grained view of the cache access patterns ofthe applications, from which they derive co-schedules with

an average of 7% improvement over the default scheduler.Eyerman and Eeckhout [20] propose an SMT job schedulerthat is meant to surmount the shortcomings of SOS. They usea probabilistic model to co-schedule applications without theneed for a sampling phase, and it can be configured to optimizefor throughput or turn-around time. The major downside oftheir approach is that it requires specialized CPU countersthat are not available on commercial hardware.
Tam et al [21] present a solution for scheduling threads onSMP-CMP-SMT systems. Their goal is to reduce remote cacheaccesses by scheduling threads together that access the samedata. The authors approach this problem by using hardwareperformance counters to monitor the addresses of memory thatcause remote cache accesses and then scheduling together (onthe same chip or on the same core) threads that access thesame memory. They achieve 5-7% performance improvementsfor a handful of applications, but their system is not meant todetermine the optimal SMT level.
VII. CONCLUSIONS AND FUTURE WORK
Simultaneous multithreading design has revolutionized theway modern processors perform computations today. It hasintroduced many benefits, notably increasing CPU utilization.However, automatically predicting when SMT fails to providethe expected increase in performance for many applications isstill not a well-understood area of research.
This paper examines a methodology for SMT-level selec-tion. At the heart of our methodology is the SMT-selectionmetric that is capable of predicting potential change in appli-cation performance when the SMT-level is changed. We haveshown that it is very difficult to predict SMT preference byjust relying on certain parameters like cache misses, branchmispredictions, number of floating point instructions, or CPI.
Our performance evaluation used a large number of multi-threaded standard benchmarks that represent a wide range ofapplications behavior. Our results have shown that the SMT-selection metric was able to predict the correct SMT speedupin 93% of the cases on the IBM POWER7 processor, and in86% of the cases on the Intel Nehalem processor. The metriccan easily be adapted to other architectures once we have agood understanding of the issue ports and functional units usedby the target architecture. We have also presented an algorithmbased on the Gini impurity that can be used to accuratelyobtain a range of SMT-selection metric thresholds that can beused by schedulers or application optimizers.
While we tried to capture most of the factors that couldimpact SMT performance for a general microprocessor, theSMTsm still does not address directly some issues likeinstruction-level dependencies and relative execution speedsof various instruction types. SMTsm attempts to approximatesuch effects indirectly through the dispatch-held factor. Study-ing such effects is the subject of our future investigations.More future work needs to be done to increase the accuracy ofprediction, to test the metric on other architectures, to improvethe scalability of the metric when applied to a much larger
number of cores, and finally, to use the metric in a user-levelscheduler.
ACKNOWLEDGMENT
We would like to thank Niteesh Dubey for his help andvaluable feedback on this work.
REFERENCES
[1] D. M. Tullsen, S. J. Eggers, and H. M. Levy, “Simultaneous multithread-ing: maximizing on-chip parallelism,” in 25 years of the internationalsymposia on Computer architecture (selected papers), ser. ISCA ’98,1998, pp. 533–544.
[2] R. Kalla, B. Sinharoy, and J. M. Tendler, “IBM POWER5 chip: a dual-core multithreaded processor,” IEEE Micro, vol. 24, no. 2, pp. 40–47,2004.
[3] W. Huang, J. Lin, Z. Zhang, and J. M. Chang, “Performance char-acterization of java applications on SMT processors,” in InternationalSymposium on Performance Analysis of Systems and Software, 2005, pp.102–111.
[4] H. M. Mathis, A. E. Mericas, J. D. McCalpin, R. J. Eickemeyer, andS. R. Kunkel, “Characterization of simultaneous multithreading (SMT)efficiency in POWER5,” IBM J. Res. Dev., vol. 49, pp. 555–564, July2005.
[5] S. K. Sadasivam and P. Kumar, “SPECfp2006 CPI stack and SMTbenefits analysis on POWER7 systems,” Paris, France, May 2011.
[6] R. Kalla, B. Sinharoy, W. J. Starke, and M. Floyd, “POWER7: IBM’snext-generation server processor,” IEEE Micro, vol. 30, pp. 7–15, 2010.
[7] M. E. Thomadakis, “The architecture of the Nehalem processor andNehalem-EP SMP platforms,” Texas A&M University, Tech. Rep., 2011.
[8] “Intel 64 and IA-32 architectures software developer’s manual,” 2011.[9] D. H. Bailey, E. Barszcz, J. T. Barton, D. S. Browning, R. L. Carter,
L. Dagum, R. A. Fatoohi, P. O. Frederickson, T. A. Lasinski, R. S.Schreiber, H. D. Simon, V. Venkatakrishnan, and S. K. Weeratunga,“The NAS parallel benchmarks-summary and preliminary results,” inProceedings of the 1991 ACM/IEEE conference on Supercomputing, ser.Supercomputing ’91, 1991, pp. 158–165.
[10] C. Bienia and K. Li, “PARSEC 2.0: A new benchmark suite forchip-multiprocessors,” in Proceedings of the 5th Annual Workshop onModeling, Benchmarking and Simulation, June 2009.
[11] J. D. McCalpin, “Memory bandwidth and machine balance in currenthigh performance computers,” IEEE TCCA Newsletter, December 1995.
[12] H. Saito, G. Gaertner, W. B. Jones, R. Eigenmann, H. Iwashita,R. Lieberman, G. M. v. Waveren, and B. Whitney, “Large systemperformance of SPEC OMP2001 benchmarks,” in Proceedings of the 4thInternational Symposium on High Performance Computing, ser. ISHPC’02, London, UK, UK, 2002, pp. 370–379.
[13] “Apache daytrader benchmark.” [Online]. Available:https://cwiki.apache.org/GMOxDOC20/daytrader.html
[14] “SPECjbb2005.” [Online]. Available: http://www.spec.org/jbb2005/[15] L. Rokach and O. Maimon, “Top-down induction of decision trees
classifiers - a survey,” IEEE Transactions, vol. 35, pp. 476–487, 2005.[16] Y. Ruan, V. S. Pai, E. Nahum, and J. M. Tracey, “Evaluating the impact
of simultaneous multithreading on network servers using real hardware,”SIGMETRICS Perform. Eval. Rev., vol. 33, pp. 315–326, June 2005.
[17] A. Snavely and D. M. Tullsen, “Symbiotic jobscheduling for a simulta-neous mutlithreading processor,” SIGPLAN Not., vol. 35, pp. 234–244,November 2000.
[18] A. Snavely, D. M. Tullsen, and G. Voelker, “Symbiotic jobschedulingwith priorities for a simultaneous multithreading processor,” SIGMET-RICS Perform. Eval. Rev., vol. 30, pp. 66–76, June 2002.
[19] A. Settle, J. Kihm, A. Janiszewski, and D. Connors, “Architecturalsupport for enhanced SMT job scheduling,” in Proceedings of the 13thInternational Conference on Parallel Architectures and CompilationTechniques, ser. PACT ’04, 2004, pp. 63–73.
[20] S. Eyerman and L. Eeckhout, “Probabilistic job symbiosis modeling forSMT processor scheduling,” SIGPLAN Not., vol. 45, pp. 91–102, March2010.
[21] D. Tam, R. Azimi, and M. Stumm, “Thread clustering: sharing-awarescheduling on SMP-CMP-SMT multiprocessors,” SIGOPS Oper. Syst.Rev., vol. 41, pp. 47–58, March 2007.