Embed Size (px)
Citation preview

An Overview of the Housing and Economic Crisis – and Why There Is More Pain to Come
T2 Accredited Fund, LPTilson Offshore Fund, Ltd.
T2 Qualified Fund, LP
February 1, 2010
The latest version of this presentation is regularly updated at www.valueinvestingcongress.com

T2 Partners Management L.P. Manages Hedge Funds and Mutual Funds
and is a Registered Investment Advisor
145 E. 57th Street, 10th FloorNew York, NY 10022
(212) [email protected] www.T2PartnersLLC.com
The collapse of the U.S. housing market, the world’s largest debt market, is the defining economic event of our lifetimes. This presentation explores what happened and why, where we are today, and what the future likely holds.
For More Details, See Our Book:More Mortgage Meltdown

Tilson Mutual Funds
The Tilson Mutual Funds (www.tilsonmutualfunds.com) follow a long-term-oriented, value-based investment strategy, seeking to identify stocks that are trading at a substantial discount to their intrinsic value. The Tilson Focus Fund (TILFX) seeks maximum capital appreciation, while the Tilson Dividend Fund (TILDX), while also seeking capital appreciation, seeks to generate current income from dividends and selling covered calls. An investor should consider the investment objectives, risks, and charges and expenses of the Funds before investing. The prospectus contains this and other information about the Funds. A copy of the prospectus is available at www.tilsonmutualfunds.com/tilsonprospectus.pdf or calling the fund directly at 888-484-5766. The prospectus should be read carefully before investing.
Investment in the Funds is subject to investment risks, including, without limitation, market risk, management style risk, sector focus risk, foreign securities risk, nondiversified fund risk, portfolio turnover risk, credit risk, interest rate risk, maturity risk, investment-grade securities risk, junk bonds or lower-rated securities risk, derivative instruments risk and real estate securities risk.
The Tilson Mutual Funds are distributed by Capital Investment Group, Inc., Member FINRA/SIPC, 17 Glenwood Ave, Raleigh, NC, 27603. There is no affiliation between the Tilson Mutual Funds, including its principals, and Capital Investment Group, Inc.

Attend the Next Value Investing Congress on May 4-5 in Pasadena, CA
Register at www.valueinvestingcongress.com
Confirmed speakers include:• Bruce Berkowitz, Fairholme Capital• John Burbank, Passport Capital• Eric Sprott, Sprott Asset Management• Mohnish Pabrai, Pabrai Investment Funds• Paul Sonkin, Hummingbird Value Funds• Thomas Russo, Gardner, Russo & Gardner• David Nierenberg, The D3 Family Funds• Lloyd Khaner, Khaner Capital• J. Carlo Cannell, Cannell Capital• Guy Spier, Aquamarine Fund• Patrick Degorce, Thélème Partners• Richard Vogel, Alatus SA• Amitabh Singhi, Surefin Investments• Whitney Tilson & Glenn Tongue, T2
Partners

Subscribe to Value Investor Insight and SuperInvestor Insight

What Happened?

9
For the Second Half of the 20th Century, Housing Was a Stable Investment
Sources: Robert J. Shiller, Irrational Exuberance, Princeton University Press 2000, Broadway Books 2001, 2nd edition, 2005, also Subprime Solution, 2008, as updated by the author at http://www.econ.yale.edu/~shiller/data.htm; Lawler Economic & Housing Consulting.
100
125
150
175
200
225
250
275
300
1950
1954
1958
1962
1966
1970
1974
1978
1982
1986
1990
1994
1998
Rea
l Hom
e Pr
ice
Inde
x (1
890=
100)
ShillerLawler
Trend Line

10
…And Then Housing Prices Exploded
Sources: Robert J. Shiller, Irrational Exuberance: Second Edition, as updated by the author; Lawler Economic & Housing Consulting.
100
125
150
175
200
225
250
275
300
1950
1954
1958
1962
1966
1970
1974
1978
1982
1986
1990
1994
1998
2002
2006
Rea
l Hom
e Pr
ice
Inde
x (1
890=
100)
ShillerLawler
Trend Line
HousingBubble

11
Prices Exploded Because the Borrowing Power of a Typical Home Purchaser More Than Tripled from 2000-2006
Source: Amherst Securities.
$0
$100,000
$200,000
$300,000
$400,000
Jan-95 Jan-96 Jan-97 Jan-98 Jan-99 Jan-00 Jan-01 Jan-02 Jan-03 Jan-04 Jan-05 Jan-06 Jan-07 Jan-08
Pre-Tax IncomeBorrowing Power
3.3x in January 2000
9.2x in January 2006
Factors contributing to the ability to borrow more and more were:
1. Lenders were willing to allow much higher debt-to-income ratios
2. Interest-only mortgages (vs. full amortizing)3. No money down4. Low- and no-documentation loans, which led
to widespread fraud5. Slowly rising income6. Falling interest rates

12
Americans Have Borrowed Heavily Against Their Homes Such That the Percentage of Equity Has Fallen Below 50% for the First TimeThere still appears to be substantial equity protecting the debt – but this is misleading. Given that 1/3 of homes have no mortgage (i.e., 100% equity), the remaining homes have only 16% equity. A further 10% decline in home prices would, on average, leave little equity cushion to support U.S. mortgage debt.
Source: Federal Reserve Flow of Fund Accounts of the United States.
$0
$2,000
$4,000
$6,000
$8,000
$10,000
$12,000
1945 1950 1955 1960 1965 1970 1975 1980 1985 1990 1995 2000 2005
Mor
tgag
e D
ebt (
Bn)
0%
10%
20%
30%
40%
50%
60%
70%
80%
90%
Equity as a %
of Hom
e Value
1945Mortgage Debt: $18.6 billionEquity: $97.5 billion
Q309Mortgage Debt: $10.3 trillionEquity: $7.9 trillion

13
Housing Became Unaffordable in Many Areas Using a Typical 30-Year Fixed-Rate Mortgage, Which Led Many Borrowers to Take Exotic Mortgages
Sources: NAHB/Wells Fargo Housing Opportunity Index, which measures percentage of households that could afford the average home with a standard mortgage.
0
10
20
30
40
50
60
70
80
Q1 199
6
Q1 199
7
Q1 199
8
Q1 199
9
Q1 200
0
Q1 200
1
Q1 200
2
Q3 200
4
Q3 200
5
Q3 200
6
Q3 200
7
Hou
sing
Opp
ortu
nity
Inde
x
Riverside, CALos Angeles, CASan Diego, CA

14
There Was a Dramatic Decline in Mortgage Lending Standards from 2001 through 2006
• In 2005, 29% of new mortgages were interest only — or less, in the case of Option ARMs — vs. 1% in 2001
• In 1989, the average down payment for first-time home buyers was 10%; by 2007, it was 2%
• The sale of new homes costing $750,000 or more quadrupled from 2002 to 2006. The construction of inexpensive homes costing $125,000 or less fell by two-thirds
7474
76
81
83
84
81
68
70
72
74
76
78
80
82
84
86
2001 2002 2003 2004 2005 2006 2007
Com
bine
d Lo
an to
Val
ue (%
)
1% 1%
3%
9%
14%
17%
8%
0%
2%
4%
6%
8%
10%
12%
14%
16%
18%
2001 2002 2003 2004 2005 2006 2007
Perc
ent o
f Orig
inat
ions
33%
39%
45%
49%
56%
63%65%
0%
10%
20%
30%
40%
50%
60%
70%
2001 2002 2003 2004 2005 2006 2007
Perc
ent o
f Orig
inat
ions
0% 0%
1%
4%
8%
11%
5%
0%
2%
4%
6%
8%
10%
12%
2001 2002 2003 2004 2005 2006 2007
Perc
ent o
f Orig
inat
ions
Combined Loan to Value 100% Financing
Limited Documentation 100% Financing & Limited Doc
Sources: Amherst Securities, LoanPerformance; USA Today (www.usatoday.com/money/economy/housing/2008-12-12-homeprices_N.htm).

Why Did It Happen?

16
Among the Many Causes of The Great Housing Bubble, Two Stand Out
1. The lenders making crazy loans didn’t care if the homeowner ended up defaulting for two reasons:
– They didn’t hold the loan, but instead sold it to someone else. It was eventually bought by a Wall Street firm, which packaged it with thousands of other mortgages in a Residential Mortgage-Backed Security (RMBS), which was then sliced into numerous tranches that were sold to investors around the world. This entire process was extraordinarily profitable for all involved, especially the Wall Street firms and the rating agencies;
– Or, if they did plan to hold the loan, they assumed home prices would keep rising, such that homeowners could either refinance before loans reset or, if the homeowner defaulted, the losses (i.e., severity) would be minimal.
2. The entire system – real estate agents, appraisers, mortgage lenders, banks, Wall St. firms and rating agencies – became corrupted by the vast amounts of quick money to be made
There were many other reasons, of course – a bubble of this magnitude requires what Charlie Munger calls “lollapalooza effects”
– Regulators and politicians were blinded by free market ideology and/or the dream that all Americans should own their homes, causing them to fall asleep at the switch, not want to take the punch bowl away and/or get bought off by the industries they were supposed to be overseeing
– Debt became increasingly available and acceptable in our culture– Millions of Americans became greedy speculators and/or took on too much debt– Greenspan kept interest rates too low for too long– Institutional investors stretched for yield, didn’t ask many questions and took on too
much leverage– In general, everyone was suffering from irrational exuberance, driven by the money
being made

When Home Price Appreciation Slows, Loss Severity Skyrockets
Sources: LoanPerformance; OFHEO; Deutsche Bank; “Who's Holding the Bag?”, Pershing Square presentation, 5/23/07.
The assumption of perpetually rapidly rising home prices led lenders to give virtually anyone a loan because even if they defaulted, the home could simply be resold with little or no loss.
17
18
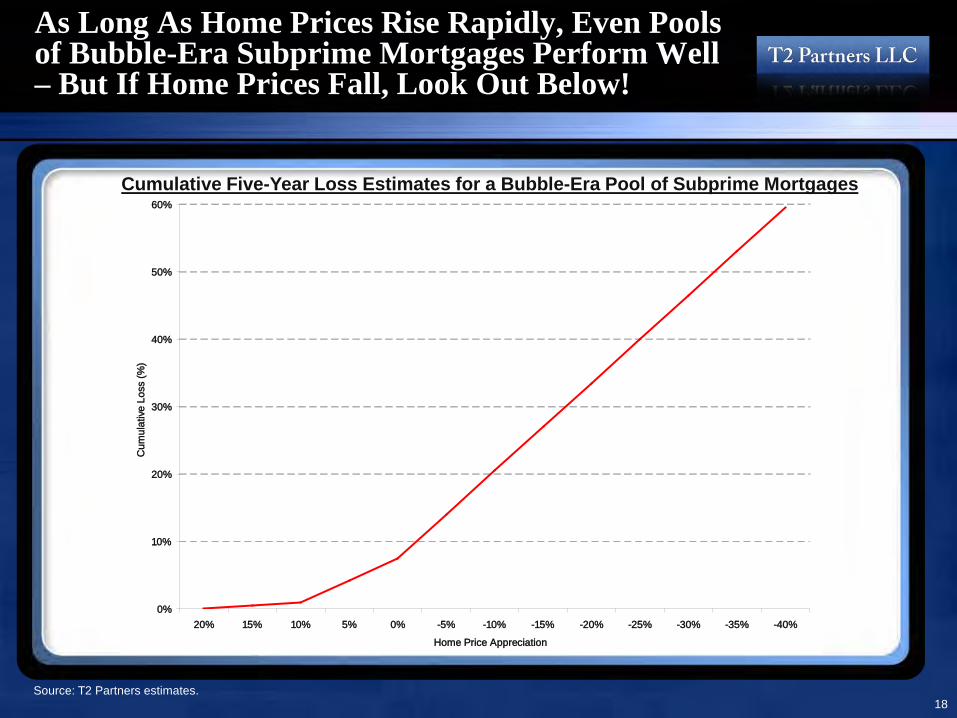
As Long As Home Prices Rise Rapidly, Even Pools of Bubble-Era Subprime Mortgages Perform Well – But If Home Prices Fall, Look Out Below!
Source: T2 Partners estimates.
0%
10%
20%
30%
40%
50%
60%
20% 15% 10% 5% 0% -5% -10% -15% -20% -25% -30% -35% -40%Home Price Appreciation
Cum
ulat
ive L
oss
(%)
Cumulative Five-Year Loss Estimates for a Bubble-Era Pool of Subprime Mortgages
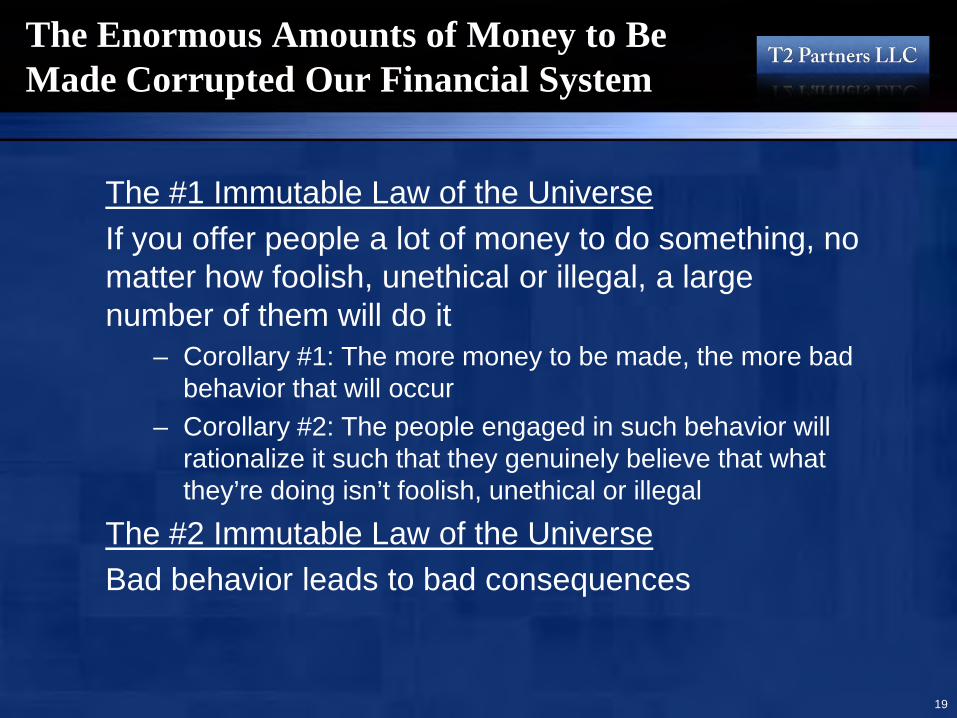
The Enormous Amounts of Money to Be Made Corrupted Our Financial System
The #1 Immutable Law of the UniverseIf you offer people a lot of money to do something, no matter how foolish, unethical or illegal, a large number of them will do it
– Corollary #1: The more money to be made, the more bad behavior that will occur
– Corollary #2: The people engaged in such behavior will rationalize it such that they genuinely believe that what they’re doing isn’t foolish, unethical or illegal
The #2 Immutable Law of the UniverseBad behavior leads to bad consequences
19

20
Deregulation of the Financial Sector Led to a Surge of Compensation, Leverage and Profits
Source: Ariell Reshef, University of Virginia; Thomas Philippon, NYU; Wall St. Journal, 5/14/09.
Ratio of Financial Services Wages to Nonfarm Private-Sector Wages, 1910-2006

21Sources: Federal Reserve, BEA, as of Q2 2007, GMO presentation.
Low Debt Era Rising Debt Era
0.0%
0.5%
1.0%
1.5%
2.0%
2.5%
3.0%
51 54 57 60 63 66 69 72 75 78 81 84 87 90 93 96 99 02 05
Fina
ncia
l Pro
fits
as P
erce
nt o
f GD
P
100%
150%
200%
250%
300%
350%
Total Debt as Percent of G
DP
Dec-
Total Debt
Financial Profits
Over the Past 30 Years, We Have Become a Nation Gorged in Debt – To The Benefit of Financial Services Firms

Profits and Wages in the Financial Sector Soared from 1980 Onward
Source: Moody’s Economy.com, NY Times, 12/18/08. 22

23
Wall Street Firms Were Making a Fortune Securitizing Loans
• Among the most profitable areas for Wall Street firms was producing Asset-Backed Securities (ABSs) and Collateralized Debt Obligations (CDOs)
• To produce ABSs and CDOs, Wall Street needed a lot of loan “product”
• Mortgages were a quick, easy, big source• It is easy to generate higher and higher volumes of
mortgage loans: simply lend at higher loan-to-value ratios, with ultra-low teaser rates, to uncreditworthy borrowers, and don’t bother to verify their income and assets (thereby inviting fraud)
• There’s only one problem:
DON’T EXPECT TO BE REPAID!

Mortgages Were Pooled into RMBSs, Tranches of Which Were Pooled into CDOs
This is an example of a “Mezzanine CDO.” A “High-Grade CDO” would select collateral primarily from the A and AA tranches mixed with ~25% senior tranches from other, often mezzanine, CDOs
Note: Asset-based securities backed by home mortgages are called Residential Mortgage-Backed Securities (RMBS), those backed by commercial real estate loans are called Commercial Mortgage-Backed Securities (CMBS), etc. Source: Citigroup, All Clogged Up: What’s Ailing the Financial System, 2/13/08.
Loss rates of, say, 20%, in the underlying RMBS’s can lead to catastrophic losses for a CDO
Equity
BBB
BBB
BBB
BBB
BBB
BBB
BBB
BBB
BBB
BBB
BBB
BBB
BBB
Equity
BBB
Equity
A
BBB- ABBB
A
A
A
AA
AA
AA
AAA
AAA
AAA
SuperSenior
0%
10%
20%
30%
40%
50%
60%
70%
80%
90%
100%
RMBS CDO Composition CDO Rating
24

A Case Study of Wall StreetCompensation Run Amok:Stan O’Neal, Dow Kim & the Mortgage Team at Merrill Lynch
Source: On Wall Street, Bonuses, Not Profits, Were Real, NY Times, 12/18/08.
25

The Rating Agencies Were Making a Fortune Rating Structured Finance Products
$10.00
$20.00
$30.00
$40.00
$50.00
$60.00
$70.00
2003 2004 2005 2006
Moody’s Stock Price Reflected Its Surge in Profits
Source: Yahoo! Finance.26
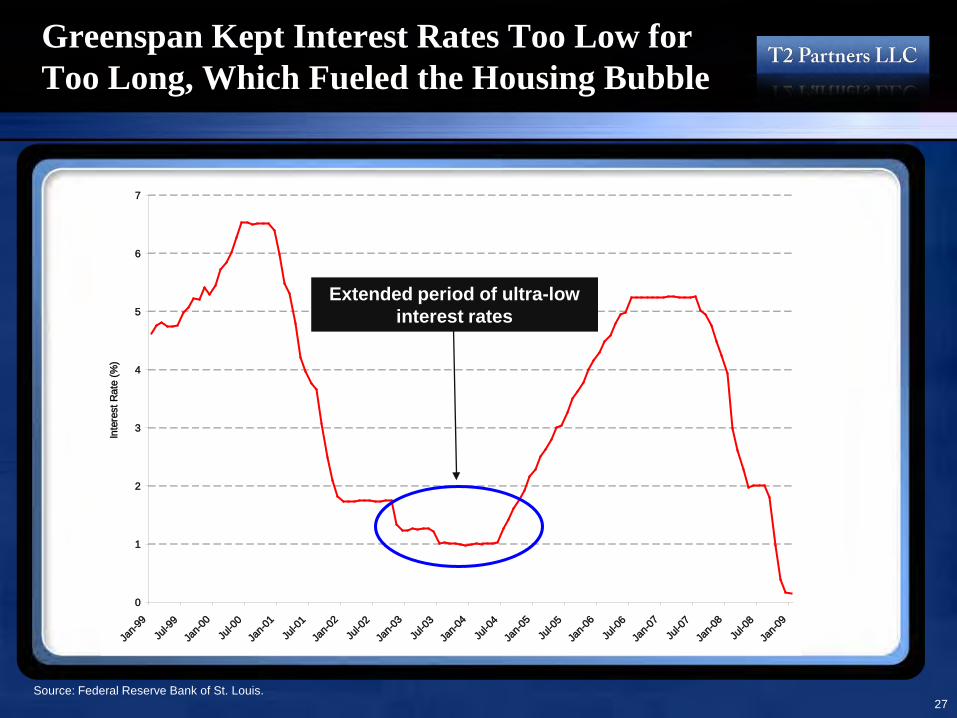
Greenspan Kept Interest Rates Too Low for Too Long, Which Fueled the Housing Bubble
0
1
2
3
4
5
6
7
Jan-9
9Ju
l-99
Jan-0
0Ju
l-00
Jan-0
1Ju
l-01
Jan-0
2Ju
l-02
Jan-0
3Ju
l-03
Jan-0
4Ju
l-04
Jan-0
5Ju
l-05
Jan-0
6Ju
l-06
Jan-0
7Ju
l-07
Jan-0
8Ju
l-08
Jan-0
9
Inte
rest
Rat
e (%
)
Source: Federal Reserve Bank of St. Louis.27
Extended period of ultra-low interest rates

Background on the U.S. Housing Market

29
There Was a Surge of Toxic Mortgages From 2000 to Mid-2007
Source: Inside Mortgage Finance, published by Inside Mortgage Finance Publications, Inc. Copyright 2009.
$0
$500
$1,000
$1,500
$2,000
$2,500
$3,000
$3,500
$4,000
1999 2000 2001 2002 2003 2004 2005 2006 2007 2008
Orig
inat
ions
(Bn)
Conforming, FHA/VAJumboAlt-ASubprimeSeconds
30
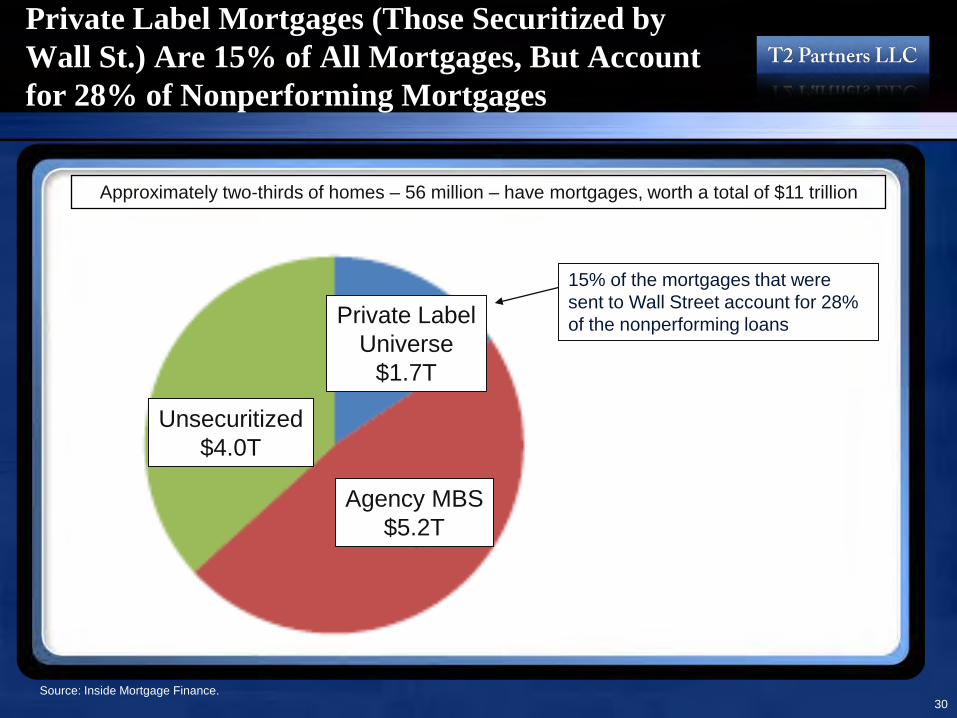
Private Label Mortgages (Those Securitized by Wall St.) Are 15% of All Mortgages, But Account for 28% of Nonperforming Mortgages
15% of the mortgages that were sent to Wall Street account for 28% of the nonperforming loans
Source: Inside Mortgage Finance.
Approximately two-thirds of homes – 56 million – have mortgages, worth a total of $11 trillion
Agency MBS$5.2T
Private LabelUniverse
$1.7T
Unsecuritized$4.0T

31
More Than 14% of Mortgages on 1-to-4 Family Homes Were Delinquent or in Foreclosure as of Q3 2009
Source: National Delinquency Survey, Mortgage Bankers Association; T2 Partners estimates. Note: Delinquencies (30+ days) are seasonally adjusted.
4%
6%
8%
10%
12%
14%
16%
Per
cent
age
of H
ome
Loan
s

32
All Types of Loans Are Seeing a Surge in Delinquencies, Led by Subprime
0%
5%
10%
15%
20%
25%
30%
35%
40%
45%
Q1 199
9
Q3 199
9
Q1 200
0
Q3 200
0
Q1 200
1
Q3 200
1
Q1 200
2
Q3 200
2
Q1 200
3
Q3 200
3
Q1 200
4
Q3 200
4
Q1 200
5
Q3 200
5
Q1 200
6
Q3 200
6
Q1 200
7
Q3 200
7
Q1 200
8
Q3 200
8
Per
cent
Non
curr
ent
Alt AOption ARMJumboSubprimePrimeHome Equity Lines of Credit
Sources: Amherst Securities, LoanPerformance; National Delinquency Survey, Mortgage Bankers Association; FDIC Quarterly Banking Profile;T2 Partners estimates. Note: Prime is seasonally adjusted.

An Examination of Subprime, Prime and Alt-A Loans

34
The Decline in Lending Standards Led to a Surge in Subprime Mortgage Origination
Source: Reprinted with permission; Inside Mortgage Finance, published by Inside Mortgage Finance Publications, Inc. Copyright 2009.
10% 9%9%
10%9%
10%10%
7% 7%8%
18%
20%20%
8%
$0
$100
$200
$300
$400
$500
$600
$700
1994 1995 1996 1997 1998 1999 2000 2001 2002 2003 2004 2005 2006 2007
Originations(Bn)
0%
5%
10%
15%
20%
25%
% ofTotal

35
$0
$5
$10
$15
$20
$25
$30
$35
Jan-0
6Apr-
06Ju
l-06
Oct-06
Jan-0
7Apr-
07Ju
l-07
Oct-07
Jan-0
8Apr-
08Ju
l-08
Oct-08
Jan-0
9Apr-
09Ju
l-09
Oct-09
Jan-1
0Apr-
10Ju
l-10
Oct-10
Loan
s w
ith P
aym
ent S
hock
(Bn)
Sources: LoanPerformance, Deutsche Bank; slide from Pershing Square presentation, How to Save the Bond Insurers, 11/28/07.
The Wave of Resets from Subprime Loans Is Mostly Behind Us
We are here
36Sources: Amherst Securities.
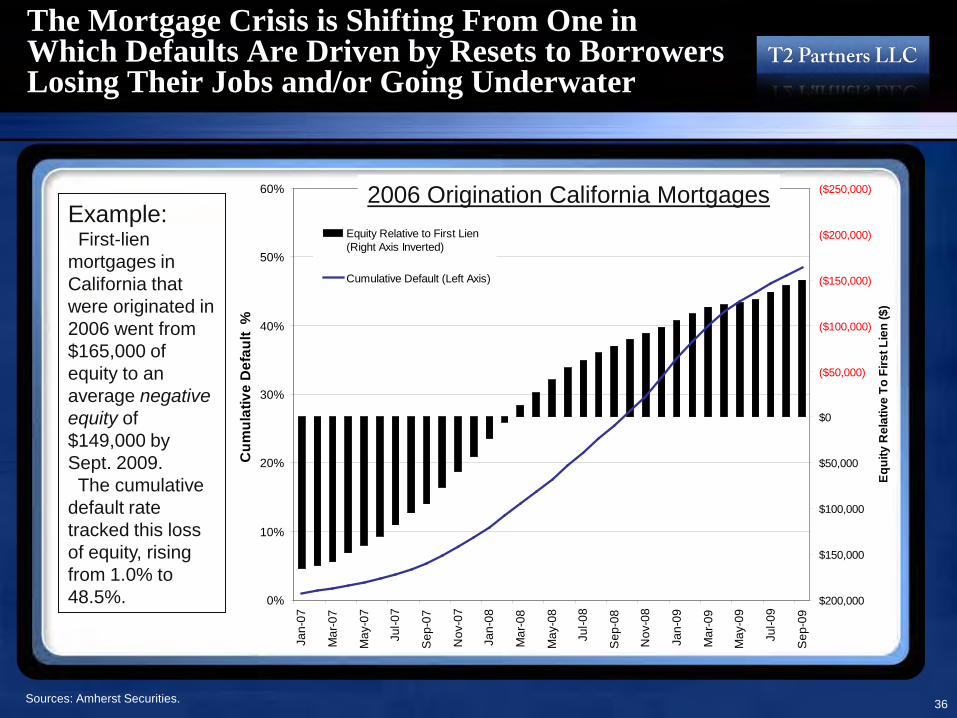
The Mortgage Crisis is Shifting From One in Which Defaults Are Driven by Resets to Borrowers Losing Their Jobs and/or Going Underwater
Example:First-lien
mortgages in California that were originated in 2006 went from $165,000 of equity to an average negative equity of $149,000 by Sept. 2009. The cumulative
default rate tracked this loss of equity, rising from 1.0% to 48.5%. 0%
10%
20%
30%
40%
50%
60%
Jan-
07
Mar
-07
May
-07
Jul-0
7
Sep
-07
Nov
-07
Jan-
08
Mar
-08
May
-08
Jul-0
8
Sep
-08
Nov
-08
Jan-
09
Mar
-09
May
-09
Jul-0
9
Sep
-09
Cum
ulat
ive
Def
ault
%
($250,000)
($200,000)
($150,000)
($100,000)
($50,000)
$0
$50,000
$100,000
$150,000
$200,000
Equi
ty R
elat
ive
To F
irst L
ien
($)
Equity Relative to First Lien(Right Axis Inverted)
Cumulative Default (Left Axis)
2006 Origination California Mortgages

37
The Mortgage Meltdown Has Moved Beyond Subprime to Five Other Areas
Sources: Federal Reserve Flow of Funds Accounts of the United States, IMF Global Financial Stability Report October 2008, Goldman Sachs Global Economics Paper No. 177, FDIC Quarterly Banking Profile, OFHEO, S&P Leverage Commentary & Data, T2 Partners estimates.
$0.0 $0.5 $1.0 $1.5 $2.0 $2.5 $3.0 $3.5 $4.0 $4.5 $5.0
CDO/ CLO
Other Consumer
Construction & Development
Option ARM
Auto
Credit Card
Home Equity
Jumbo Prime
High-Yield / Leveraged Loans
Subprime
Commercial & Industrial
Other Corporate
Alt-A
Commercial Real Estate
Prime Mortgage
Amount Outstanding (Trillions)
For further details about Jumbo Prime, HELOCs and Option ARMs, see the Appendix
Subprime is only a small part of the problem

38
Delinquencies of Prime and Alt-A Mortgages Are Soaring
Source: New York Times, 5/24/09.

39
Delinquencies of Prime Mortgages Are Soaring
Source: Mortgage Bankers Association National Delinquency Survey.
0.0%
0.5%
1.0%
1.5%
2.0%
2.5%
3.0%
3.5%
4.0%
4.5%
5.0%
Q1 199
9
Q3 199
9
Q1 200
0
Q3 200
0
Q1 200
1
Q3 200
1
Q1 200
2
Q3 200
2
Q1 200
3
Q3 200
3
Q1 200
4
Q3 200
4
Q1 200
5
Q3 200
5
Q1 200
6
Q3 200
6
Q1 200
7
Q3 200
7
Q1 200
8
Q3 200
8
Per
cent
Non
curr
ent (
60+
days
)

40
Fannie Mae and Freddie Mac Serious Delinquencies Are Soaring
Note: Serious delinquencies are loans that have missed three or more consecutive payments (90+ days).Source: Company filings.
0.0%
0.5%
1.0%
1.5%
2.0%
2.5%
3.0%
3.5%
4.0%
4.5%
5.0%
Fannie
Freddie

41
Freddie Mac’s Delinquency Rate by Vintage Underscores the Decline in Lending Standards
* Represents the cumulative transition rate of loans to a default event, and is calculated for each year of origination as the number of loans that have proceeded to foreclosure, acquisition or other disposition events, excluding liquidations through voluntary pay-off, divided by the number of loans in our single-family mortgage portfolio. Excludes certain Structured Transactions. Source: Company filing.
Total Single-Family Portfolio Cumulative Default Rates* by Book Year

42
There Is a Surge of Notices of Default and Foreclosures Among the GSEs
Prime Notices of Default
Subprime Notices of Default
Prime ForeclosuresSubprime Foreclosures
Source: The Field Check Group.

43
The Foreclosure Problem Is No Longer Only a Bubble State Phenomenon
Source: New York Times, 5/24/09.
15 States With the Highest Prime Mortgage Foreclosure Rates
44
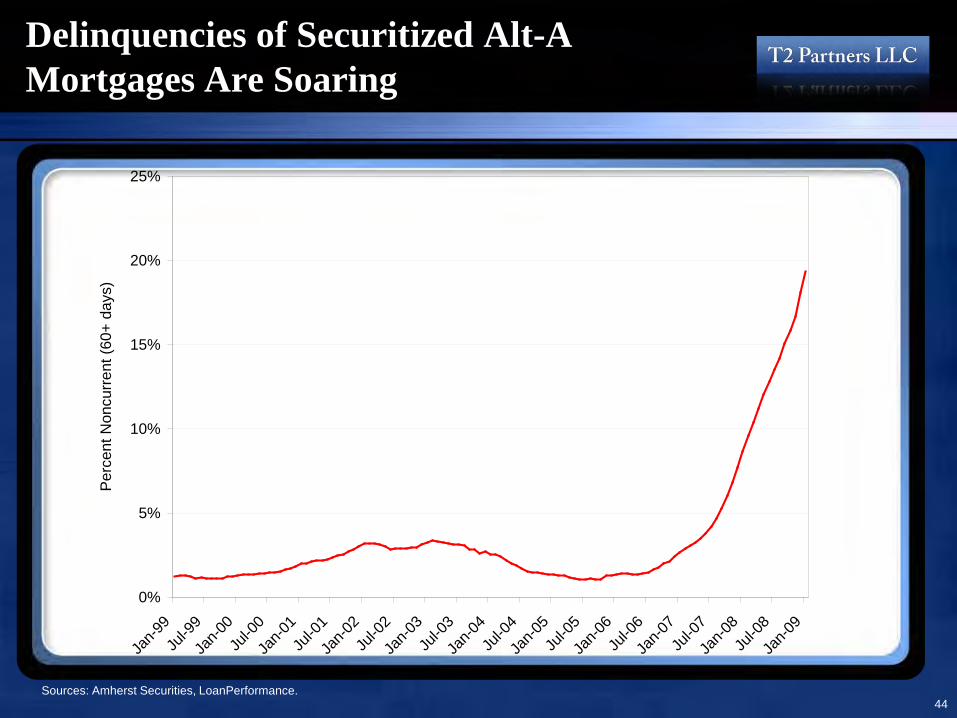
Delinquencies of Securitized Alt-A Mortgages Are Soaring
Sources: Amherst Securities, LoanPerformance.
0%
5%
10%
15%
20%
25%
Jan-9
9Ju
l-99
Jan-0
0Ju
l-00
Jan-0
1Ju
l-01
Jan-0
2Ju
l-02
Jan-0
3Ju
l-03
Jan-0
4Ju
l-04
Jan-0
5Ju
l-05
Jan-0
6Ju
l-06
Jan-0
7Ju
l-07
Jan-0
8Ju
l-08
Jan-0
9
Per
cent
Non
curr
ent (
60+
days
)

45
Alt-A Delinquencies By Vintage Show the Collapse in Lending Standards in 2006 and 2007
Sources: Amherst Securities, LoanPerformance.
0%
5%
10%
15%
20%
25%
30%
0 5 10 15 20 25 30 35 40 45 50 55 60
Months of Seasoning
Per
cent
Non
curr
ent (
60+
days
)
2007 2006
2005
2004
2003

46
There Are $2.4 Trillion of Alt-A Mortgages --And Their Resets Are Mostly Ahead of Us
$0
$1
$2
$3
$4
$5
$6
$7
$8
$9
$10
Jan-1
0Ju
l-10
Jan-1
1Ju
l-11
Jan-1
2Ju
l-12
Jan-1
3Ju
l-13
Jan-1
4Ju
l-14
Jan-1
5Ju
l-15
Am
ount
(Bn)
$0$50
$100$150
$200$250
$300
Estim
ated Cum
ulative Reset A
mount (B
n)
We are here
Sources: Credit Suisse, LoanPerformance.
NOTE: This chart only shows resets for a small fraction of Alt-A loans, but is representative of all of them.

47
Two Waves of Losses Are Behind Us…But Three Are Looming
Losses Mostly Behind Us• Wave #1: Borrowers committing (or the victim of) fraud, as well as
speculators, who defaulted quickly. Timing: beginning in late 2006 (as soon as home prices started to fall) into 2008. Mostly behind us.
• Wave #2: Mostly subprime borrowers who defaulted when their mortgages reset due to payment shock. Timing: early 2007 (as two-year teaser subprime loans written in early 2005 started to reset) to the present. Now tapering off as low interest rates mitigate payment shock.
Losses Mostly Ahead of Us• Wave #3: Prime loans (most of which are owned or guaranteed by the
GSEs) defaulting due to job loss and home price declines (i.e., underwater homeowners). Timing: started to surge in early 2008 to the present.
• Wave #4: Jumbo prime, second lien and HELOCs (most of which are on banks’ books) defaulting due to job loss and home price declines/ underwater homeowners. Timing: started to surge in early 2008 to the present.
• Wave #5: Losses among loans outside of the housing sector, the largest of which will be in the $3.5 trillion area of commercial real estate. Timing: started to surge in early 2008 to the present.

48
Why Won’t the System Collapse Again?
Given that the three looming waves are much larger than the two that are mostly behind us, why won’t they trigger a collapse of our financial system similar to what happened in late 2008?
Answer: Last year’s collapse was triggered in part by the magnitude of the losses, but also because of the suddenness. Financial institutions can withstand even large losses if they trickle in over time because they can offset losses each quarter with profits earned during the quarter – but this isn’t possible if losses are sudden.
The suddenness of last year’s losses was due in part to rapidly rising defaults, especially among subprime mortgages, but in fact, realized losses were still quite low. The real culprit was the fact that most subprime loans had been securitized into RMBSs and CDOs, turning them into tradable debt instruments.
According to GAAP accounting rules, traded instruments like stocks and bonds have to be marked to market, and in only a few months in 2008, the market price for hundreds of billions of dollars of AAA-rated RMBS and CDO securities went from close to 100 cents on the dollar to the 20-30 cent range (even though the underlying pools of mortgages hadn’t yet realized much in the way of losses). This required every institution holding these securities to immediately book enormous losses, which caused many of them to collapse.
Why did Merrill Lynch, Citigroup, Lehman and Bear Stearns fall, but Wells Fargo didn’t? Because Wells had almost nothing on its balance sheet that had to be marked to market.
Big mark to market losses are now behind us, so it’s unlikely that there will be any sudden shocks to the system. Instead, hundreds of billions of dollars of additional losses from trillions of dollars of bad loans will be realized over many, many years.
This is both good news and bad news: the good news is that while future losses will surely bankrupt many banks, especially smaller ones exposed to commercial real estate, they likely won’t threaten the system because banks are earning so much money currently that most should be able to outrun their losses.
The bad news is that very high losses will plague our financial system for many years to come –our best guess is current extremely high levels for another two years, and then slowly declining for three more years before finally returning to normal levels in five years. This drip torture of high losses every quarter, year after year, will likely keep banks extremely cautious in their lending, making robust economic growth unlikely.

49
The Housing Crisis is Shifting in a Number of Ways
First Stage of Collapse1. Subprime & fraudulent loans
account for most defaults
2. Defaults driven by loans resetting
3. Defaults mainly in sand and rust states
4. Mark-to-market losses due to bad loans being securitized
5. Little government intervention
Current Stage1. Prime, Alt-A and other loans to
better borrowers drive defaults
2. Defaults driven by job losses and underwater mortgages
3. Defaults occurring across a broad swath of the country
4. Losses from on-balance-sheet loans (not marked to market)
5. Massive government intervention

Current Status of the Housing Market
51
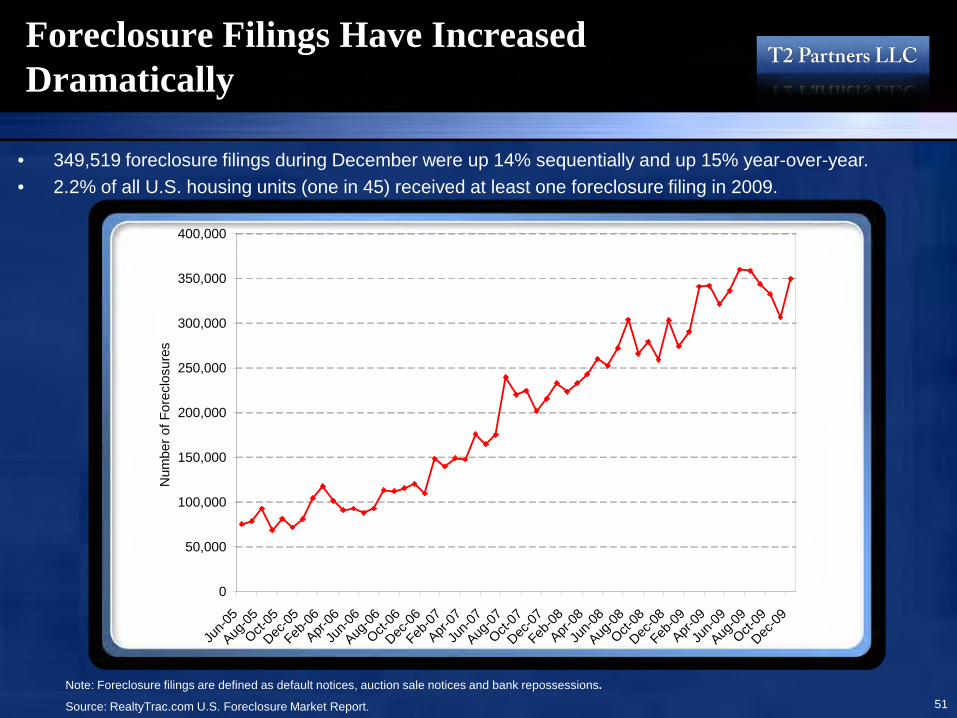
Foreclosure Filings Have Increased Dramatically
• 349,519 foreclosure filings during December were up 14% sequentially and up 15% year-over-year.• 2.2% of all U.S. housing units (one in 45) received at least one foreclosure filing in 2009.
Note: Foreclosure filings are defined as default notices, auction sale notices and bank repossessions.
Source: RealtyTrac.com U.S. Foreclosure Market Report.
0
50,000
100,000
150,000
200,000
250,000
300,000
350,000
400,000
Jun-0
5
Aug-05
Oct-05
Dec-05
Feb-06
Apr-06
Jun-0
6
Aug-06
Oct-06
Dec-06
Feb-07
Apr-07
Jun-0
7
Aug-07
Oct-07
Dec-07
Feb-08
Apr-08
Jun-0
8
Aug-08
Oct-08
Dec-08
Feb-09
Apr-09
Jun-0
9
Aug-09
Oct-09
Dec-09
Num
ber o
f For
eclo
sure
s

52
The Delinquency and Foreclosure Problem Has Spread Far Beyond the Bubble States
Source: LPS Applied Analytics, WSJ 10/22/09.

Credit Suisse Predicts More Than 6 Million Additional Foreclosures by the End of 2012
Sources: Credit Suisse, 9/08; http://calculatedrisk.blogspot.com 53
This chart is quite dated, but accurately shows how the foreclosure crisis is shifting away from subprime.
54
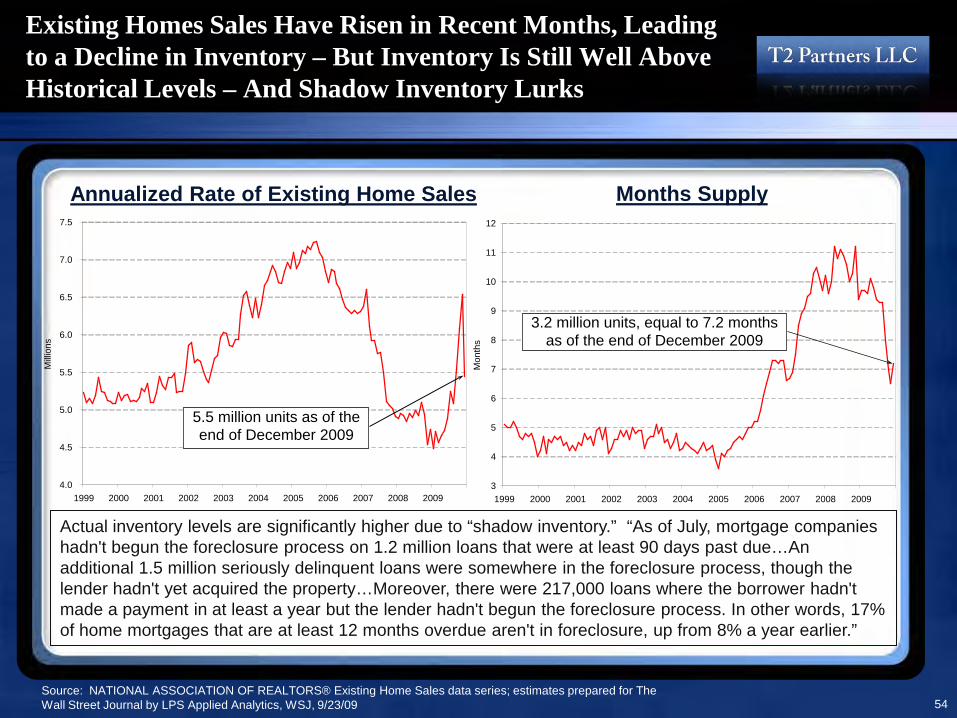
Existing Homes Sales Have Risen in Recent Months, Leading to a Decline in Inventory – But Inventory Is Still Well Above Historical Levels – And Shadow Inventory Lurks
Source: NATIONAL ASSOCIATION OF REALTORS® Existing Home Sales data series; estimates prepared for The Wall Street Journal by LPS Applied Analytics, WSJ, 9/23/09
Months SupplyAnnualized Rate of Existing Home Sales
Actual inventory levels are significantly higher due to “shadow inventory.” “As of July, mortgage companies hadn't begun the foreclosure process on 1.2 million loans that were at least 90 days past due…An additional 1.5 million seriously delinquent loans were somewhere in the foreclosure process, though the lender hadn't yet acquired the property…Moreover, there were 217,000 loans where the borrower hadn't made a payment in at least a year but the lender hadn't begun the foreclosure process. In other words, 17% of home mortgages that are at least 12 months overdue aren't in foreclosure, up from 8% a year earlier.”
4.0
4.5
5.0
5.5
6.0
6.5
7.0
7.5
1999 2000 2001 2002 2003 2004 2005 2006 2007 2008 2009
Mill
ions
5.5 million units as of the end of December 2009
3
4
5
6
7
8
9
10
11
12
1999 2000 2001 2002 2003 2004 2005 2006 2007 2008 2009
Mon
ths
3.2 million units, equal to 7.2 months as of the end of December 2009

55
Thanks to Massive Government Stimulus (Mainly the FHA & the $8,000 First-Time Homebuyers Tax Credit), Sales from June-Sept. 2009 Were Higher Than 2008, But This May Not Last
Source: Mark Hanson Advisors.
Note how seasonal home sales are

56
Thanks to Massive Government Stimulus (Mainly the FHA & the $8,000 First-Time Homebuyers Tax Credit), Sales from June-Sept. 2009 Were Higher Than 2008, But This May Not Last
Source: Mark Hanson Advisors.
Note how seasonal home sales are
Organic sales are highly seasonal, while distressed sales are have fallen in recent months due to loan mods

57
Inventory is Moving at the Low End, But As the High End Tips Over, Sales Are Falling and Inventories Are Ballooning
Sources: JP Morgan; CA Assoc. of Realtors (left chart); National Assoc. of Realtors via Moody’s Economy.com, WSJ 6/22/09 (right chart).
Months Inventory in CA By Home Price
Another example: based on the rate of sales over the seven months ending in May 2009, there is five years of housing inventory in Greenwich, CT
Sudbury, MA (July data)
Months ofPrice Inventory>$250K 6$250-500 8$500-750 5$750-1M 14$1M+ 51

58
Defaults Are Massively Outpacing Liquidations, So the Inventory Overhang Continues to Worsen
Note: This data is based on approximately 28 million loans. Total first-time defaults are running at 300,000/month.Source: First American CoreLogic Loan-Level Servicing Data, Amherst Securities.
First time defaults
Liquidations

59
Defaulted Mortgages Are Taking Longer to Liquidate, Adding to the Inventory Overhang
Source: First American CoreLogic Loan-Level Servicing Data, Amherst Securities.

60
Cure Rates Have Fallen Such That Once a Homeowner Misses Two Payments, A Foreclosure Is Almost Inevitable
Source: Loan Performance, Amherst Securities.

61
The Current “Housing Overhang” Is 7 Million Homes –Which Doesn’t Include Any New Defaults, Which Are Running at Approximately 300,000/Month!
Source: Mortgage Bankers Association, Loan Performance, Amherst Securities.

62
Shadow Inventory for Each of the 20 Cities in the Case-Shiller Index
Note: Notice of Default data is incomplete or missing for many cities.Source: www.trulia.com, Amherst Securities.

Outlook for Housing Prices

64
Home Prices Were in an Unprecedented Freefall Until A Slight Bounce in Q209
Sources: Standard & Poor’s, OFHEO Purchase-Only Index, NATIONAL ASSOCIATION OF REALTORS® Existing Home Sales data series.
100
120
140
160
180
200
220
Q1 200
0
Q3 200
0
Q1 200
1
Q3 200
1
Q1 200
2
Q3 200
2
Q1 200
3
Q3 200
3
Q1 200
4
Q3 200
4
Q1 200
5
Q3 200
5
Q1 200
6
Q3 200
6
Q1 200
7
Q3 200
7
Q1 200
8
Q3 200
8
Q1 200
9
S&P/Case-Shiller U.S. National Home Price IndexS&P/Case-Shiller 20-City CompositeOFHEO Purchase-Only IndexNAR Median Sales Price of Existing Homes

65
Home Prices Look Affordable Due to Price Declines and Ultra-Low Interest Rates
Source: Case-Shiller, Bureau of Labor Statistics, Amherst Securities.
0
100
200
300
400
500
600
700
800
Inde
x Va
lue
Date
CASE SHILLER USA (1975 = 100)
Modeled Home Prices - Interest Only
Modeled Home Prices - 30yr Fully Amortizing
S C Shill B f L b St ti ti Bl b A h t S iti

66
The Housing Affordability Index Shows Houses Are Now Affordable
14
16
18
20
22
24
26
1989
1990
1991
1992
1993
1994
1995
1996
1997
1998
1999
2000
2001
2002
2003
2004
2005
2006
2007
2008
2009
Mor
tgag
e P
aym
ent o
n M
edia
n P
riced
Hom
e as
% o
f Fam
ily In
com
e
Before concluding that houses are cheap, however, there are three big caveats: first, low rates are only available to those who qualify for conforming mortgages, which doesn’t help millions of homeowners or potential homeowners who have spotty credit histories or are underwater on their current mortgages. Second, with low enough interest rates, almost anything looks affordable; if rates rise, houses won’t look so reasonably priced based on these metrics. Finally, in light of the severe economic downturn, average income may fall for quite some time.
Source: NATIONAL ASSOCIATION OF REALTORS® Housing Affordability Index.

67
Home Prices Need to Fall Another 5-10% to Reach Trend Line
Sources: Robert J. Shiller, Irrational Exuberance: Second Edition, as updated by the author; Lawler Economic & Housing Consulting, T2 estimates.
100
125
150
175
200
225
250
275
300
1950
1954
1958
1962
1966
1970
1974
1978
1982
1986
1990
1994
1998
2002
2006
2009
Rea
l Hom
e Pr
ice
Inde
x (1
890=
100)
ShillerLawler
Trend Line
HousingBubble

68
GMO’s Study of Bubbles Shows That All of Them Eventually Return to Trend Line34 Have Returned to Trend; the Only Exception, British Housing, Is On Its Way
StocksS&P 5001920-1932
0.3
0.8
1.3
1.8
2.3
20 21 22 23 24 25 26 27 28 29 30 31
Det
rend
ed R
eal P
rice
Trend Line
S&P 5001946-1984
0.0
0.5
1.0
1.5
2.0
2.5
46 50 54 58 62 66 70 74 78 82
Det
rend
ed R
eal P
rice
Trend Line
Japan vs. EAFE ex-Japan1981-1999
0.00.51.01.52.02.53.0
81 83 85 87 89 91 93 95 97 99
Rel
ativ
e R
etur
n
Trend Line
S&P 5001992-October 2008
0.8
1.2
1.6
2.0
2.4
92 94 96 98 00 02 04 06 08
Det
rend
ed R
eal P
rice
Trend Line
CurrenciesU.S. Dollar1979-1992
0.81.01.21.41.61.82.0
79 81 83 85 87 89 91
Cum
ulat
ive
Ret
urn
U.K. Pound1979-1985
0.80.91.01.11.21.31.4
79 80 81 82 83 84
Cum
ulat
ive
Ret
urn
Japanese Yen1983-1990
0.80.91.01.11.21.31.4
83 84 85 86 87 88 89 90C
umul
ativ
e R
etur
n
Japanese Yen1992-1998
0.80.91.01.11.21.31.4
92 93 94 95 96 97
Cum
ulat
ive
Ret
urn
CommoditiesGold1970-1999
0
400
800
1200
1600
2000
70 74 78 82 86 90 94 98
Rea
l Pric
e
Crude Oil1962-1999
0
20
40
60
80
62 66 70 74 78 82 86 90 94 98
Rea
l Pric
e
Nickel1979-1999
0
50
100
150
200
250
79 81 83 85 87 89 91 93 95 97
Rea
l Pric
e
Cocoa1970-1999
0100200300400500600
70 74 78 82 86 90 94 98
Rea
l Pric
eSource: GMO LLC. Note: For S&P charts, trend is 2% real price appreciation per year. Source: GMO. Data through 10//10/08.* Detrended Real Price is the price index divided by CPI+2%, since the long-term trend increase in the price of the S&P 500 has been on the order of 2% real.
12 ExamplesGMO calls this “the greatest sucker’s rally in history”

69
The Biggest Danger is That Home Prices Overshoot on the Downside, Which Often Happens When Bubbles Burst
S&P 500 1927-1954
S&P 500 1955-1986
0.00
0.25
0.50
0.75
1.00
1.25
1.50
1.75
2.00
2.25
2.50
1927 1930 1933 1936 1939 1942 1945 1948 1951 1954
Det
rend
ed R
eal S
&P
500
Sto
ck P
rice
Inde
x
-59%
Overrun: 59%Fair Value to Bottom: 1.5 Years
Fair Value to Fair Value: 23 Years
0.00
0.25
0.50
0.75
1.00
1.25
1.50
1.75
2.00
2.25
1955 1957 1959 1961 1963 1965 1967 1969 1971 1973 1976 1978 1980 1982 1984 1986
Det
rend
ed R
eal S
&P
500
Sto
ck P
rice
Inde
x
-45%
Overrun: 45%Fair Value to Bottom: 7 Years
Fair Value to Fair Value: 12 Years
Source: GMO LLC, T2 Partners calculations.
70
Recent Signs of Stabilization Are Likely the Mother of All Head Fakes
Rather than representing a true bottom, recent signs of stabilization are likely due to seven factors that are (or are likely to be) short-term:1. Ultra-low interest rates2. The homebuyer tax credit
– In November it was extended until April 30th
– $8,000 for first-time homebuyers and $6,500 to homeowners who have lived in their current home for at least five years– Current cost: $1 billion/month
3. More middle- and upper-end homes are being sold (either voluntarily or via foreclosure), which has the effect of raising the price at which the average home is sold – but more defaults of higher priced homes is very bad news for mortgage holders
4. A decline in resets (which will ramp up again over the next few years)5. A temporary reduction in the inventory of foreclosed homes
– There are currently big delays in foreclosures due to four reasons (in descending order of importance): A) Loan modifications via the HAMP program; B) Political pressure on banks and servicers; C) The system is overwhelmed with the unprecedented volume of defaulting homeowners; and D) Some banks, weakened by losses, may be motivated to drag out the process so that losses/write-downs can be delayed, giving them more time to earn their way out of trouble.
– “For now, the delays have led to what is probably a temporary drop in the supply of bank-owned homes in California and other places where investors and first-time home buyers have been competing for bargains. In Orange County, Calif., the number of bank-owned homes listed for sale dropped to 322 in early September from 1,404 in November 2008, according to Altera Real Estate. But the number of foreclosures is expected to increase in the fourth quarter as mortgage-servicing companies determine who is eligible for a loan modification and who isn't. ‘We are going to see a spike from now to the end of the year in foreclosures as we take people out of the running’ for a loan modification or other alternatives, says a Bank of America Corp. spokeswoman. ‘Foreclosure sales had dropped to ‘abnormally low’ levels in response to government efforts to stem foreclosures, she adds.’ – WSJ, 9/23/09
6. The FHA is providing massive support to the housing market– FHA’s market share has risen from 2% in 2005 to 23% of all mortgages, in part because of lax lending standards: only 3.5% down for
people with FICO scores as low as 580 (deep subprime)– Thousands of shady subprime mortgage lenders rebranded themselves and are now doing FHA-backed business. Approved FHA
lenders grew from just over 9,600 at the end of FY07 to nearly 14,000 today, according to HUD– FHA has very poor systems and controls – it only appointed a Chief Risk Officer on Nov. 12, 2009!– It’s no surprise, therefore, that defaults are skyrocketing – 17.9% of all FHA-guaranteed loans are now in some stage of delinquency– FHA’s annual report for FY09 (which ended 9/30/09) showed that the FHA capital ratio declined dramatically from 6.4% in 2007 to
3.0% in 2008 to 0.53% in 2009, falling below its statutory minimum of 2%– FHA will likely need additional funding from Congress in the near future – one analyst estimated $54 billion – and a condition of this
might be a requirement of tighter lending standards, in which case it’s highly unlikely that any other lender would step in to fill the gap; it’s possible, however, that Congress might decide to continue the subsidy to help stabilize the housing market
7. Home sales and prices are seasonally strong in April-July due to tax refunds and the spring selling season
71
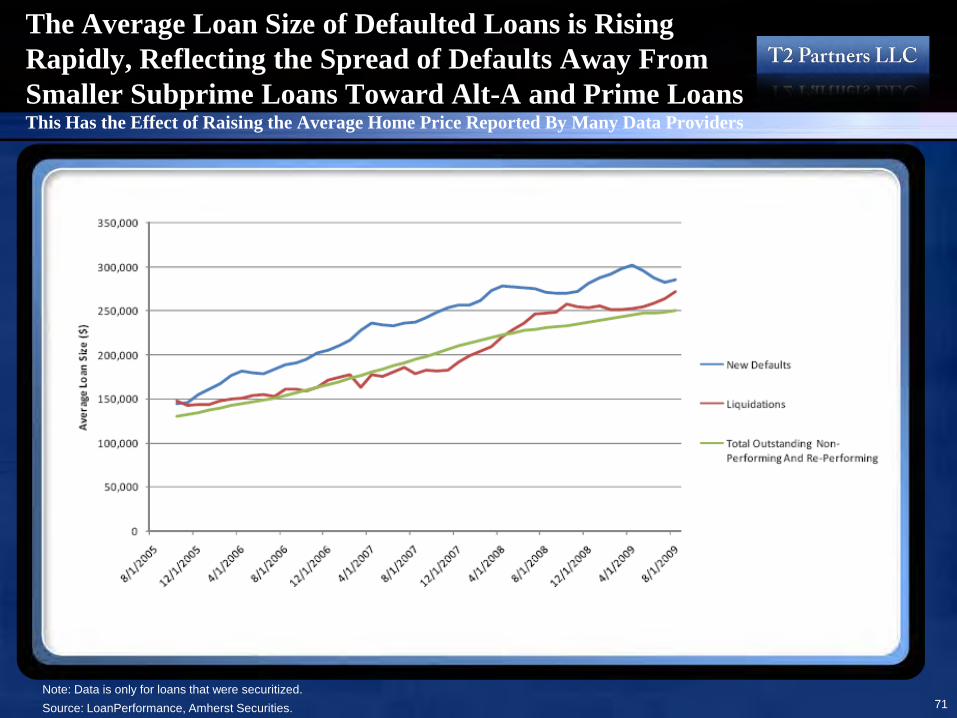
The Average Loan Size of Defaulted Loans is Rising Rapidly, Reflecting the Spread of Defaults Away From Smaller Subprime Loans Toward Alt-A and Prime LoansThis Has the Effect of Raising the Average Home Price Reported By Many Data Providers
Note: Data is only for loans that were securitized.Source: LoanPerformance, Amherst Securities.

72
Another Wave of Resetting Loans Is On the HorizonThe Last Wave Was Driven By Subprime Loans; This Time, It Will be Option ARMs
Source: Loan Performance, Amherst Securities.
0
5
10
15
20
Tota
l Loa
n Ba
lanc
e ($
Bil)
Option ARM Alt A Prime Subprime
We are here

73
Banks Are Selling Their REO, But Foreclosures Have Plunged By More Than Half, Ballooning the Inventory Pipeline
Source: Loan Performance, Amherst Securities.
0%
5%
10%
15%
20%
25%
Mon
thly
Rol
l Rat
es (%
)
Non Performing to Foreclosure Foreclosure to REO REO to Liquidation
0
200,000
400,000
600,000
800,000
1,000,000
1,200,000
1,400,000
REO 90 Days PLUS Foreclosure
Inventory Pipeline
Non-Performing to ForeclosureREO to Liquidation
Foreclosure to REO
90 Days & Foreclosure
REO
Monthly Roll Rates

74Source: HUD/FHA, through August 31, 2009, NY Times, 10/8/09; Commerce Department through Q3 09.
One Third of All New Single Family Home Sales Are Financed With FHA or VA Loans
FHA/VA Share of New SF Home Sales
0%
5%
10%
15%
20%
25%
30%
35%
40%
1988
Q1
1989
Q1
1990
Q1
1991
Q1
1992
Q1
1993
Q1
1994
Q1
1995
Q1
1996
Q1
1997
Q1
1998
Q1
1999
Q1
2000
Q1
2001
Q1
2002
Q1
2003
Q1
2004
Q1
2005
Q1
2006
Q1
2007
Q1
2008
Q1
2009
Q1
Number of FHA Loans Insured

75Source: HUD/FHA, through August 31, 2009, NY Times, 10/8/09.
FHA’s Loan Book Is a Rapidly Growing Disaster17.9% of Loans Are in Some Stage of Default; For 2007 Loans, It’s 32.4%

76
Existing Home Sales Are Highly Seasonal
Source: National Association of Realtors.

77
Existing Home Sales Are Highly Seasonal
Source: National Association of Realtors.
HPA Seasonality Coefficient -- Deviation From Mean

78
Home Prices Increased Every Month From May-October, then Fell in November
Source: S&P Case-Shiller 20-city index.
Sequential Home Prices March 2005-November 2009
-3.5%
-3.0%
-2.5%
-2.0%
-1.5%
-1.0%
-0.5%
0.0%
0.5%
1.0%
1.5%
2.0%
Mar-05
Jun-0
5
Sep-05
Dec-05
Mar-06
Jun-0
6
Sep-06
Dec-06
Mar-07
Jun-0
7
Sep-07
Dec-07
Mar-08
Jun-0
8
Sep-08
Dec-08
Mar-09
Jun-0
9
Sep-09
November 2009: -0.2%

79
…But They Always Bounce in the Spring and Summer!
Source: S&P Case-Shiller 20-city index.
Sequential Home Prices February 2000-November 2009
-4.0%
-3.0%
-2.0%
-1.0%
0.0%
1.0%
2.0%
3.0%
Feb-00
Jul-0
0
Dec-00
May-01
Oct-01
Mar-02
Aug-02
Jan-0
3
Jun-0
3
Nov-03
Apr-04
Sep-04
Feb-05
Jul-0
5
Dec-05
May-06
Oct-06
Mar-07
Aug-07
Jan-0
8
Jun-0
8
Nov-08
Apr-09
Sep-09
Red circles represent April - June each year

80
Outlook for Housing Prices
• We think housing prices will reach fair value/trend line, down 40% from the peak based on the S&P/Case-Shiller national (not 20-city) index, which implies roughly a 10% further decline from where prices were as of the end of Q3 2009
• The key question is whether housing prices will go crashing through the trend line and fall well below fair value. This is possible, though unlikely because of continued massive government subsidies. In the long-term, housing prices will likely settle around fair value, but in the short-term prices will be driven both by psychology as well as supply and demand. The recent bounce in home prices has improved psychology, but the supply-demand trends are very unfavorable
– There is a huge mismatch between supply and demand, due largely to the tsunami of foreclosures. In addition, the “shadow” inventory of foreclosed homes already exceeds one year and there will be millions more foreclosures over the next few years, creating a large overhang of excess supply that will likely cause prices to overshoot on the downside, as they did in California
• Therefore, we expect housing prices to decline approximately 40% from the peak, bottoming in late 2010
• We are also quite certain that wherever prices bottom, there will be no quick rebound
– There’s too much inventory to work off quickly, especially in light of the millions of foreclosures over the next few years
– We don’t think the economy is likely to provide a tailwind, as we expect tepid economic growth at best for a number of years
81
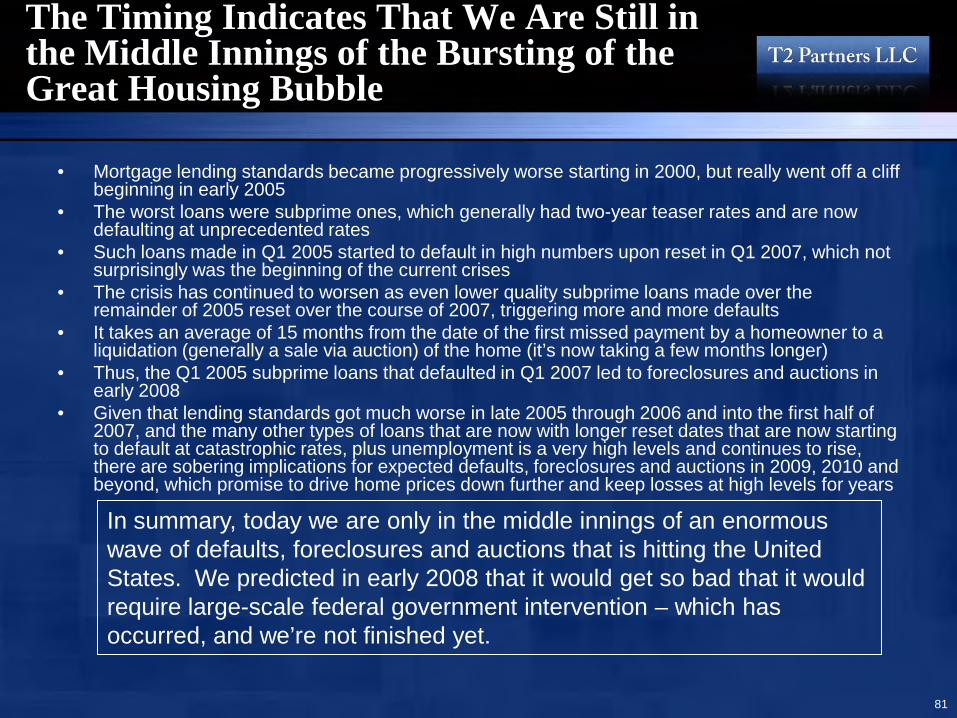
The Timing Indicates That We Are Still in the Middle Innings of the Bursting of the Great Housing Bubble
• Mortgage lending standards became progressively worse starting in 2000, but really went off a cliff beginning in early 2005
• The worst loans were subprime ones, which generally had two-year teaser rates and are now defaulting at unprecedented rates
• Such loans made in Q1 2005 started to default in high numbers upon reset in Q1 2007, which not surprisingly was the beginning of the current crises
• The crisis has continued to worsen as even lower quality subprime loans made over the remainder of 2005 reset over the course of 2007, triggering more and more defaults
• It takes an average of 15 months from the date of the first missed payment by a homeowner to a liquidation (generally a sale via auction) of the home (it’s now taking a few months longer)
• Thus, the Q1 2005 subprime loans that defaulted in Q1 2007 led to foreclosures and auctions in early 2008
• Given that lending standards got much worse in late 2005 through 2006 and into the first half of 2007, and the many other types of loans that are now with longer reset dates that are now starting to default at catastrophic rates, plus unemployment is a very high levels and continues to rise, there are sobering implications for expected defaults, foreclosures and auctions in 2009, 2010 and beyond, which promise to drive home prices down further and keep losses at high levels for years
In summary, today we are only in the middle innings of an enormous wave of defaults, foreclosures and auctions that is hitting the United States. We predicted in early 2008 that it would get so bad that it would require large-scale federal government intervention – which has occurred, and we’re not finished yet.

82
Future Losses Will Be Driven By Three Primary Factors
1. The economy• Especially unemployment
2. Interest rates• Ultra-low rates have helped mitigate some of the damage• But if the recent spike in rates continues, it could lead to an even greater surge
in defaults and losses3. Behavior of homeowners who are underwater
• Roughly one-fourth of homeowners with mortgages are currently underwater, some deeply so
• For many, it is economically rational for them to walk – leading to so-called “jingle mail” – but how many will actually do so?
• There is little historical precedent – we are in uncharted waters• As home prices continue to fall and more and more homeowners become
deeper and deeper underwater, they are obviously more likely to default, thereby creating a vicious cycle, but what exactly will the relationship be?
• Have millions of foreclosures led to a diminution of the stigma of defaulting and losing one’s home?
• Our best guess is that there will be rough symmetry: for homeowners 5% underwater, an additional 5% will default due to being underwater; 10% underwater will lead to 10% more defaults, and so forth…

Current Economic Situation

84
The Economy Rebounded at the End of 2009
Source: Bureau of Economic Analysis, 11/24/09; chart from Pershing Square presentation, 12/22/09.
5.7%
Q4’09

85
Financial Markets Are Stabilizing
Source: FRB, FDIC, Haver Analytics, Barclay’s Capital, 11/09; charts from Pershing Square presentation, 12/7/09.

86
The Stock Market Has Rallied DramaticallyThe S&P 500 Rose 68.2% from March 9, 2009 Through the End of the Year
Source: Bigcharts.com, 1/27/10.
On March 9, 2009, the S&P was down 55% from its peak only 17 months before, the largest decline since the Great Depression.

87
More Than 7 Million Jobs Have Been Lost SoFar in This Recession, Though the Monthly Rate of Losses Has Eased in Recent Months
Source: Bureau of Labor Statistics.
-1000
-800
-600
-400
-200
0
200
400
600
Jan-9
0
Jan-9
1
Jan-9
2
Jan-9
3
Jan-9
4
Jan-9
5
Jan-9
6
Jan-9
7
Jan-9
8
Jan-9
9
Jan-0
0
Jan-0
1
Jan-0
2
Jan-0
3
Jan-0
4
Jan-0
5
Jan-0
6
Jan-0
7
Jan-0
8
Jan-0
9
Cha
nge
in N
onfa
rm P
ayro
ll Em
ploy
men
t (00
0s)
There have been job losses every month since
December 2007
125,000-150,000 jobs/month are required to absorb new entrants to the workforce and
prevent unemployment from rising

88
The Unemployment Rate Remains High, Registering 10% in December
Source: Bureau of Labor Statistics.
3%
4%
5%
6%
7%
8%
9%
10%
11%
Jan-7
0
Jan-7
3
Jan-7
6
Jan-7
9
Jan-8
2
Jan-8
5
Jan-8
8
Jan-9
1
Jan-9
4
Jan-9
7
Jan-0
0
Jan-0
3
Jan-0
6
Jan-0
9
Une
mpl
oym
ent R
ate
If part-time and discouraged workers are factored in, the unemployment rate would have been 17.3% in December. The labor force participation rate was 64.6%, the lowest in 22 years. The average work week was 33.2 hours. To return to the average of 33.8 hours would be the equivalent of nearly three million new jobs not created.

89
Chronic Unemployment Is Skyrocketing
Source: Labor Department, 1/8/10; WSJ, 10/3/09.
39.8%

90
The Average Weeks Unemployed is 29.1
Source: Labor Department, 1/8/10; WSJ, 10/3/09.
29.1

91
The Percentage of Unemployed Not on Temporary Layoff Has Risen to 53.4%
Source: Labor Department, 1/8/10; WSJ, 10/3/09.
53.4%
92
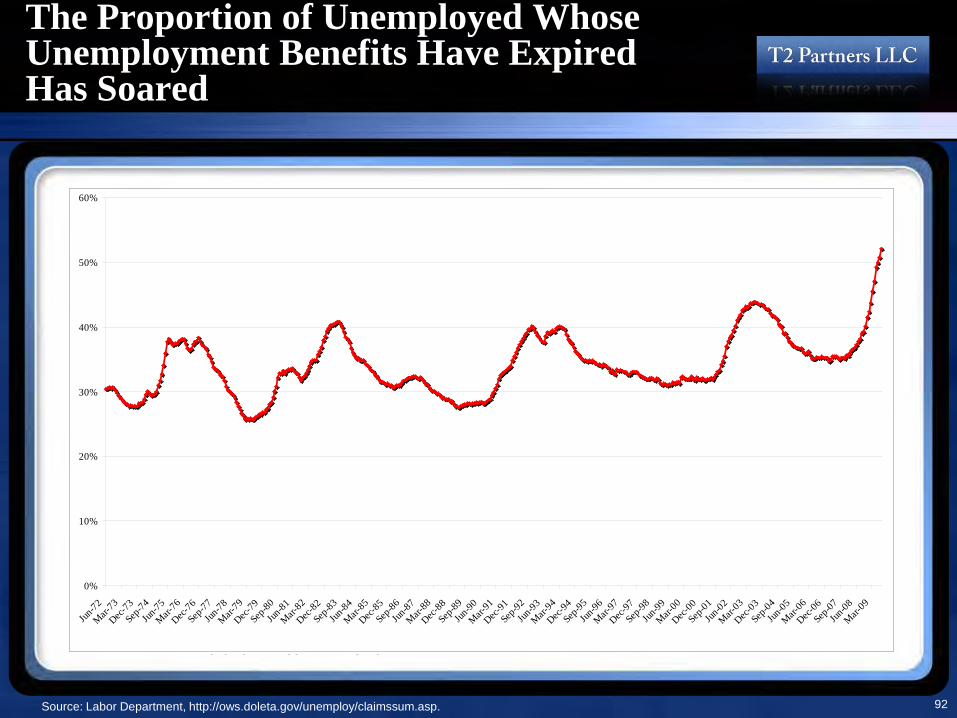
The Proportion of Unemployed Whose Unemployment Benefits Have Expired Has Soared
Source: Labor Department, http://ows.doleta.gov/unemploy/claimssum.asp.
0%
10%
20%
30%
40%
50%
60%
Jun-72
Mar-73
Dec-73Se
p-74Jun
-75
Mar-76
Dec-76Se
p-77Jun
-78
Mar-79
Dec-79Se
p-80Jun
-81
Mar-82
Dec-82Se
p-83Jun
-84
Mar-85
Dec-85Se
p-86Jun
-87
Mar-88
Dec-88Se
p-89Jun
-90
Mar-91
Dec-91Se
p-92Jun
-93
Mar-94
Dec-94Se
p-95Jun
-96
Mar-97
Dec-97Se
p-98Jun
-99
Mar-00
Dec-00Se
p-01Jun
-02
Mar-03
Dec-03Se
p-04Jun
-05
Mar-06
Dec-06Se
p-07Jun
-08
Mar-09
S D f L b h // d l / l / l i

93
There Are Now Six Unemployed People for Every Job Opening
Source: Bureau of Labor Statistics, NY Times, 9/27/09.

94
5.2% of All Jobs Have Disappeared, Worse Than Any Recession Since the Great Depression
Source: Bureau of Labor Statistics.
-5.5%
-4.5%
-3.5%
-2.5%
-1.5%
-0.5%
0 6 12 18 24 30 36 42 48Months after pre-recession peak
1948 1953 1958 1960 1969 1974 1980 1981 1990 2001 2007
2007-

95
Assuming Job Losses End Immediately (Unlikely) and Job Gains Average the Rate of the Most Recent Expansion, the Lost Jobs Won’t Be Restored Until 2016
Source: Labor Department, Wall St. Journal.

96
Consumer Confidence Has Rebounded Somewhat But Remains Low
Note: 1985=100. Source: The Conference Board (www.pollingreport.com/consumer.htm)
0
20
40
60
80
100
120
140
160
1998 1999 2000 2001 2002 2003 2004 2005 2006 2007 2008 2009 2010
Con
sum
er C
onfid
ence
Inde
x

Mortgage Equity Withdrawals of Roughly $400 Billion Annually During the Peak Bubble Years Fueled Unsustainable Consumer Spending
Source: www.calculatedriskblog.com/2009/05/mew-consumption-and-personal-saving.html.97

98
• As home prices have declined and other funding sources have dried up, millions of consumers have maxed out on home equity debt.
• In hot markets like California and Florida, a significant percentage of all consumers tapped into the value of their homes to help finance their new cars, according to CNW Marketing Research.
• Clearly this dynamic does not bode well for HELOC recovery rates or new car sales.
Many Borrowers Used Cash from Refinancings (Cash-Out Refis) and HELOCs to Buy New Cars
Source: New York Times 5/27/2008.

99
Total Consumer Credit Is Falling Sharply
Source: Federal Reserve Board, WSJ, 10/9/09.
Total Consumer Credit Outstanding(Change From Year Earlier)
Down $119 billion or 4.6% from its peak in 7/08. Down $12 billion in August, a 5.8% seasonally
adjusted annual rate, the seventh straight month of declines, the longest stretch since 1991.
Total Amount of Revolving and NonrevolvingConsumer Credit Outstanding

100
Household Credit Market Debt Outstanding Has Declined for the First Time Since This Was Measured Beginning in the Early 1950s
Source: St. Louis Fed.

101
The Percentage of Banks Tightening Standards for Consumer Loans Has Risen Sharply
Source: Federal Reserve Board Senior Loan Officer Opinion Survey on Bank Lending Practices, July 2009.

The U.S. Savings Rate Hit a 15-Year High of 6.9% in May, but Fell to 4.7% by NovemberThis is good news in the long run, but could be a severe economic headwind in the short run, given that consumer spending is 2/3 of GDP
Source: Paul Kedrosky’s blog, 6/26/09; http://paul.kedrosky.com/archives/2009/06/the_black_swan.html; www.bea.gov/newsreleases/national/pi/pinewsrelease.htm.102
Peaked

Household Liabilities as a Percentage of Disposable Income Remains Very High
Source: U.S. Federal Reserve, WSJ, 10/13/09.103
Peaked 1991: 90%
Peak: 138%
2000: 101%
Today: 129%

Private Domestic Investment Has Plunged
Source: WSJ, 10/13/09.104
Peaked
• “Of the 100 largest bond issues globally this year, only seven listed expansion, investment, capital expenditures or research and development as the purpose of the money-raising, according to Dealogic.”
• “In a recent survey conducted by the Conference Board, 51% of chief executives said they expect conditions in their industries to improve over the next six months, compared with 12% in the fourth quarter of 2008.”

105Sources: Federal Reserve, BEA, as of Q2 2007, GMO presentation.
Low Debt Era Rising Debt Era
0.0%
0.5%
1.0%
1.5%
2.0%
2.5%
3.0%
51 54 57 60 63 66 69 72 75 78 81 84 87 90 93 96 99 02 05
Fina
ncia
l Pro
fits
as P
erce
nt o
f GD
P
100%
150%
200%
250%
300%
350%
Total Debt as Percent of G
DP
Dec-
Total Debt
Financial Profits
Over the Past 30 Years, We Have Become a Nation Gorged in Debt – To The Benefit of Financial Services Firms

Interest Rates
107
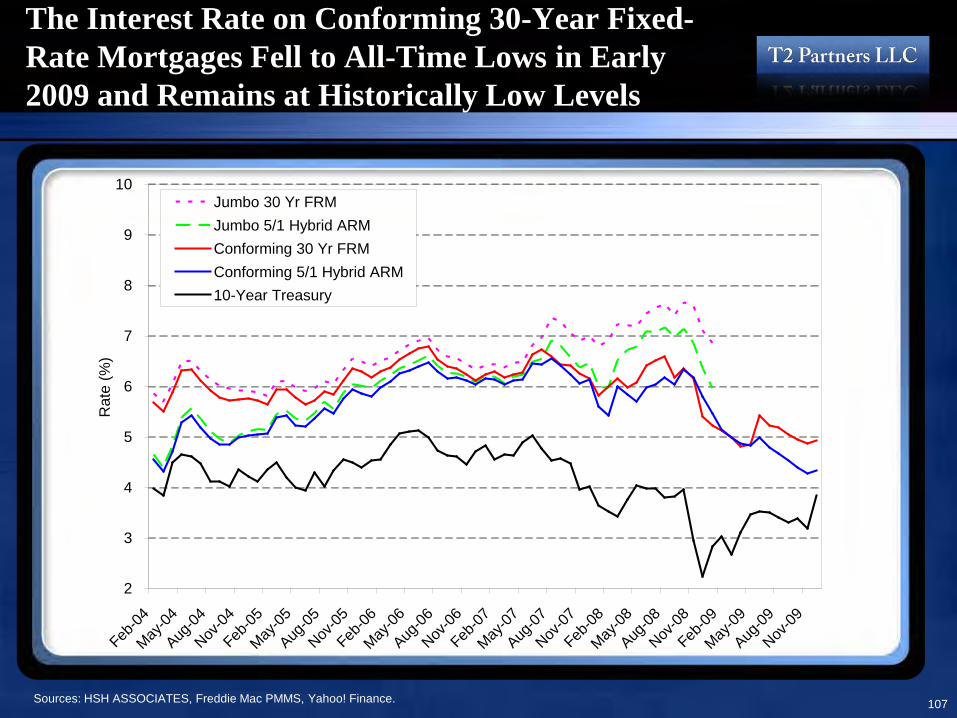
The Interest Rate on Conforming 30-Year Fixed-Rate Mortgages Fell to All-Time Lows in Early 2009 and Remains at Historically Low Levels
Sources: HSH ASSOCIATES, Freddie Mac PMMS, Yahoo! Finance.
2
3
4
5
6
7
8
9
10
Feb-04
May-04
Aug-04
Nov-04
Feb-05
May-05
Aug-05
Nov-05
Feb-06
May-06
Aug-06
Nov-06
Feb-07
May-07
Aug-07
Nov-07
Feb-08
May-08
Aug-08
Nov-08
Feb-09
May-09
Aug-09
Nov-09
Rat
e (%
)
Jumbo 30 Yr FRMJumbo 5/1 Hybrid ARMConforming 30 Yr FRMConforming 5/1 Hybrid ARM10-Year Treasury

108
Low Interest Rates Are Helping Stabilize the Housing Market
Sources: HSHAssociates.com; Ryan ALM via WSJ Market Data Group; Mortgage Bankers Association via Thomson Reuters; in the Wall St. Journal, 6/11/09 and 9/21/09.
(Conventional or nonconforming)
Roughly speaking, every 1% increase in mortgage rates reduces borrowing power by 10%

Underwater Homeowners

110
24% of Homeowners With a Mortgage Owe More Than the Home Is Worth, Making Them Much More Likely to Default
There Has Been a Dramatic Rise in Homeowners Who Are Underwater
In Bubble Markets, Far More Homeowners Are Underwater
Source: Zillow.com Q4 08 Real Estate Market Report; Moody's Economy.com, First American CoreLogic, T2 Partners estimates
Among people who bought homes in the past five years, 30%+ are underwater*
4%
6%
16%
20%
24%
0%
5%
10%
15%
20%
25%
Dec-06 Dec-07 Sep-08 Dec-08 Mar-09
Perc
ent U
nder
wat
er
Price Index Is % of Last 5 Yrsat Lowest Price Drop Purchasers Who
Metro Area Level Since Since Peak Are Under WaterNew York 2004-Q3 -15.2% 23.0%Los Angeles 2003-Q4 -32.0% 56.4%Boston 2002-Q2 -21.8% 27.8%Washington 2004-Q1 -24.8% 50.3%Miami 2004-Q1 -36.6% 65.1%San Francisco 2003-Q3 -27.8% 51.2%Atlanta 2004-Q4 -10.4% 23.2%San Diego 2002-Q4 -34.4% 63.9%Phoenix 2004-Q3 -37.7% 36.4%Las Vegas 2003-Q4 -41.8% 61.4%
* The actual figures are likely even worse, as this data doesn’t capture people who bought since 2003 and subsequently did a cash-out refi or after-the-fact second mortgage. 50% of all subprime and Alt-A loans in existence when the collapse happened were cash-out refis that carried a higher loan balance than the original purchase loan amount.
*

111
Certain Types of Loans Are Severely Underwater
Sources: Amherst Securities (January 2009), LoanPerformance, Standard & Poor’s.
73%
50%
45%
25%
0%
10%
20%
30%
40%
50%
60%
70%
80%
Prime Alt A Subprime Option ARM
Per
cent
Und
erw
ater

Investment Outlook
113
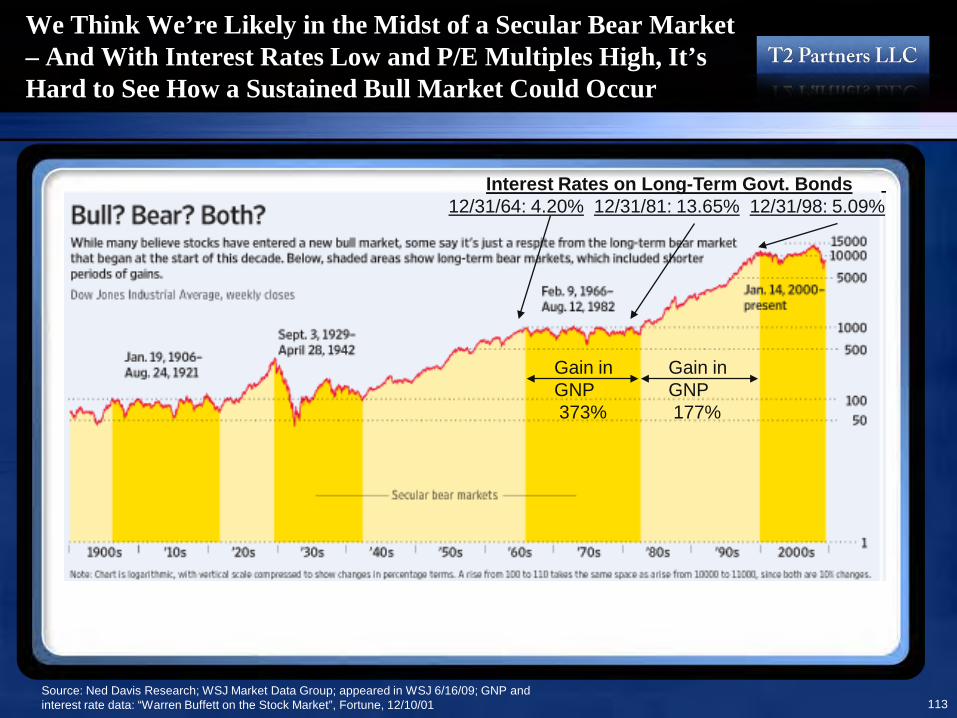
We Think We’re Likely in the Midst of a Secular Bear Market – And With Interest Rates Low and P/E Multiples High, It’s Hard to See How a Sustained Bull Market Could Occur
Source: Ned Davis Research; WSJ Market Data Group; appeared in WSJ 6/16/09; GNP and interest rate data: “Warren Buffett on the Stock Market”, Fortune, 12/10/01
Gain inGNP373%
Gain inGNP177%
Interest Rates on Long-Term Govt. Bonds12/31/64: 4.20% 12/31/81: 13.65% 12/31/98: 5.09%

114
Based on Inflation-Adjusted 10-Year Trailing Earnings, the S&P 500 at 20.8x Is Trading Above Its 130-Year Average of 16.3x
Source: Stock Market Data Used in "Irrational Exuberance" Princeton University Press, 2000, 2005, updated, Robert J. Shiller.
115
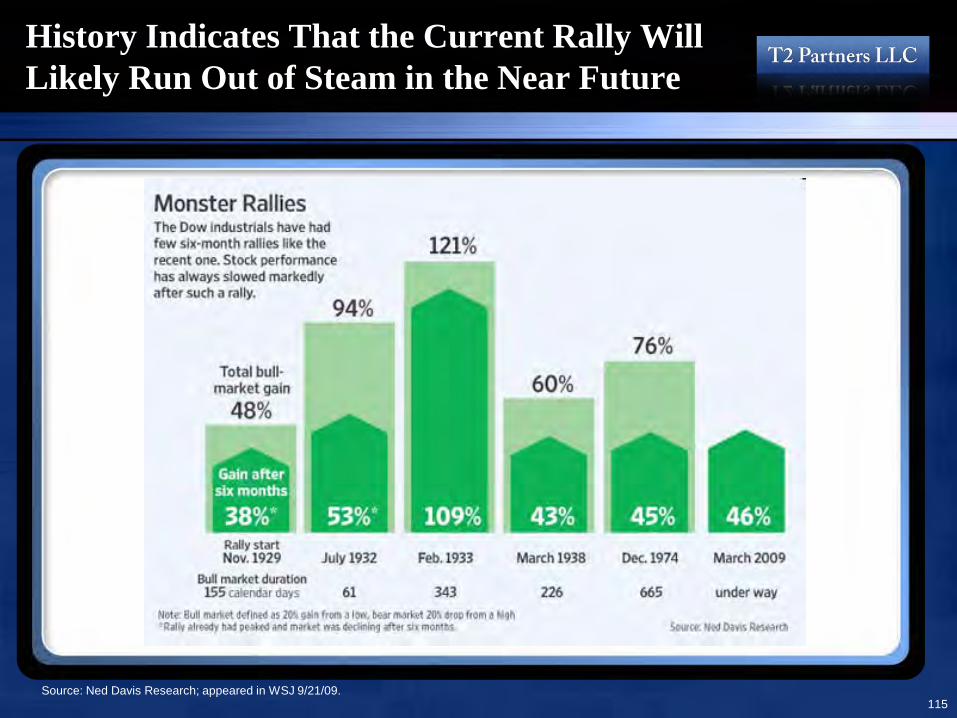
History Indicates That the Current Rally Will Likely Run Out of Steam in the Near Future
Source: Ned Davis Research; appeared in WSJ 9/21/09.

116
Where We Are Finding Opportunities10 Months Ago, We Were Playing Offense; Now We’re Playing Defense, As We Trim Our Longs, Add to Our Shorts and Shift Our Longs Toward Large, Dominant, Cash-Rich Companies
• Blue-chips. The stocks of some of the greatest businesses, with strong balance sheets and dominant competitive positions, are trading at their cheapest levels in years – due primarily to the overall market decline and weak economic conditions rather than any company-specific issues. In this category, we’d put Wal-Mart (which we own), Coca-Cola, McDonald’s, Altria, ExxonMobil, and Johnson & Johnson.
• Out of favor blue-chips. For somewhat more adventurous investors looking to buy great companies in the most out-of-favor sectors such as financials, retailers and healthcare, we own Berkshire Hathaway, Wells Fargo, American Express, Target and Pfizer. We also own Microsoft and Yahoo!. All are great businesses, but their stocks have suffered mightily thanks to the economic downturn. We think they’re good bets to rebound when things stabilize.
• Balance sheet plays. For investors who are comfortable with lower-quality businesses but want downside protection, there are many companies trading near or even below net cash on the balance sheet. Examples in our portfolio include digital media equipment company EchoStar Corp. and clothing retailer dELiA*s. Berkshire is the best of both worlds: a premier company but also a balance sheet play.
• Turnarounds. There are countless companies that have gotten clobbered by the economic downturn and are reporting dismal results – with stock prices to match. Investors in those that survive and return to anything close to former levels of profitability will be well rewarded – but picking these stocks isn’t easy. Among our holdings in this category are Wendy’s restaurants, Winn-Dixie supermarkets, Huntsman, a specialty chemical maker, Crosstex, a pipeline company, and Resource America, a specialty finance company.
• Special situations. This is somewhat of a catch-all category that, for us, includes Contango Oil & Gas, a stock that’s declined due to an aborted attempt to sell the company and the sharp drop in the price of natural gas.
• Mispriced options. Every once in a while we take a tiny position in a highly speculative situation – often where the stock price is below $1 – in which there’s a real chance that the outcome is zero, but also a decent chance, in our opinion, of making many multiples of our money. On an expected value basis, therefore, a small portfolio of such investments is attractive. Our holdings include a number of stocks and warrants of Special Purpose Acquisition Companies (SPACs), General Growth Properties, TravelCenters of America, Ambassadors International, Borders Group and PhotoChannel Networks.

Appendix(Many of these slides are out of date)

More Background Data on the Housing Market

Distressed Sales Have Fallen Due Mainly to Seasonal Factors
Sources: National Association of Realtors, NY Times, 6/9/09. 119
31% in June and July due to
seasonally strong organic sales.
This percentage is almost certain to rise in the off-
season

120
The Home Price-to-Rent Ratio Has Returned to Normal Levels
15
17
19
21
23
25
27
1989 1990 1991 1992 1993 1994 1995 1996 1997 1998 1999 2000 2001 2002 2003 2004 2005 2006 2007 2008
Med
ian
Hom
e Pr
ice
to M
edia
n G
ross
Ren
t
Source NATIONAL ASSOCIATION OF REALTORS® Existing Home Sales data series, U.S. Census Bureau, T2 Partners estimates.

The Housing Bubble Helped Many People Achieve the Dream of Home Ownership –Which is Now Turning Into a Nightmare
Source: Census Bureau.
60
61
62
63
64
65
66
67
68
69
70
1965
1967
1969
1971
1973
1975
1977
1979
1981
1983
1985
1987
1989
1991
1993
1995
1997
1999
2001
2003
2005
2007
Percentage of Households Owning Homes
%
121

The Percentage of Homes Listed for Sales Remains Near an All-Time High(Note that many more homes are vacant but not listed for sale)
Source: Census Bureau.122
0.0%
0.5%
1.0%
1.5%
2.0%
2.5%
3.0%
Q1 195
6
Q4 195
9
Q3 196
3
Q2 196
7
Q1 197
1
Q4 197
4
Q3 197
8
Q2 198
2
Q1 198
6
Q4 198
9
Q3 199
3
Q2 199
7
Q1 200
1
Q4 200
4
Q3 200
8
Hom
e V
acan
cy R
ate
Home Vacancy Rate 1965-Q2 09

Housing Starts, Completions and Sales Are At or Near All-Time Lows
Source: Commerce Department, data through 9/09.123
A slight rebound in starts and sales in recent months
200
400
600
800
1000
1200
1400
1600
1800
2000
1970 1973 1976 1979 1982 1985 1988 1991 1994 1997 2000 2003 2006 2009
Sea
sona
lly A
djus
ted
Ann
ual R
ate
(000
s)
StartsCompletionsNew Homes Sold

There Is an Enormous Inventory Glut of New HomesThe Average New Home Has Been on the Market for 12.9 Months
Source: Census Bureau, through 8/09.124
2
4
6
8
10
12
14
Jan-9
0
Jan-9
1
Jan-9
2
Jan-9
3
Jan-9
4
Jan-9
5
Jan-9
6
Jan-9
7
Jan-9
8
Jan-9
9
Jan-0
0
Jan-0
1
Jan-0
2
Jan-0
3
Jan-0
4
Jan-0
5
Jan-0
6
Jan-0
7
Jan-0
8
Jan-0
9
Med
ian
Age
(mon
ths)

Vacant Housing Stock Creates an Enormous Inventory Overhang
Source: Census BureauSource: Census Bureau, Moody’s Economy.com.
125
1.1-1.5 million excess units, equal to 2-3 years of existing home sales

Nearly 6% of Homes Built This Decade Are Vacant
Source: Census BureauSource: Census Bureau, through Q4 2008
126
5.9%
2.0%
April 2000 to presentMarch 2000 or earlier
Vacancy Rate By Date of Construction

Unlike Past Housing Downturns, New Home Sales Have Fallen Far More Than Existing Home Sales
Source: National Assoc. of Realtors (existing sales) and Census Bureau (new sales), both via Haver Analytics; chart from the New York Times, 6/27/09; manually updated through 8/09. 127
A slight rebound from March-August
New homes sales fell 76% from the peak; still down 69% through August

So Far, Few Loan Modifications Are Working
Source: Office of the Comptroller of the Currency and the Office of Thrift Supervision Mortgage Metrics
28.2%
52.1%
23.2%
36.7%
45.7%44.0%
49.8%
31.8%
46.1%
29.1%
0%
10%
20%
30%
40%
50%
60%
3 6 9 12Months Since Modification
Perc
ent o
f Mod
ified
Loa
ns 6
0+ D
ays
Del
inqu
ent
Q1 2008Q2 2008Q3 2008Q408
128

Banks Are Starting to Do Loan Modifications With Principal Reductions, Increasing the Chance of Success
Source: WSJ, 10/1/09.129

Most Loan Modifications Fail Because the Homeowner Is So Deep Underwater
Among foreclosures in California in May, the average amount owed was $412,000, yet the home was worth only $235,000. This means the homeowner was 43% underwater and the home price would have to rise 75% to equal the amount of the debt.
Source: The Field Check Group -- data provided by ForeclosureRadar.com.130
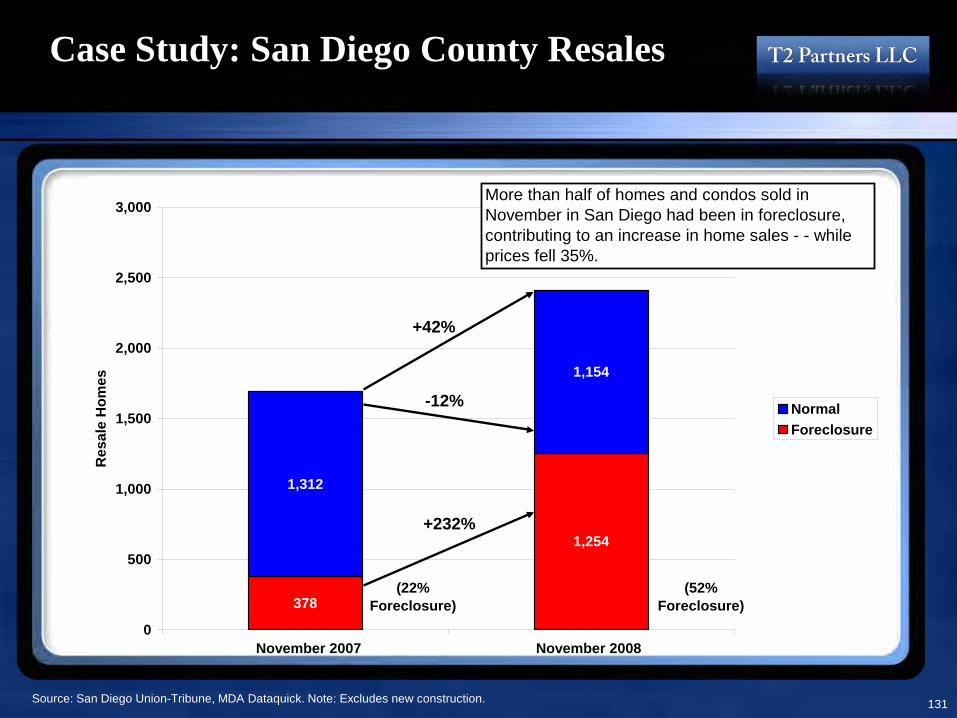
Case Study: San Diego County Resales
Source: San Diego Union-Tribune, MDA Dataquick. Note: Excludes new construction.
378
1,254
1,312
1,154
0
500
1,000
1,500
2,000
2,500
3,000
1/1/2007 1/1/2008
Res
ale
Hom
es
NormalForeclosure
+42%
-12%
+232%
More than half of homes and condos sold in November in San Diego had been in foreclosure, contributing to an increase in home sales - - while prices fell 35%.
November 2007 November 2008
(52% Foreclosure)
(22% Foreclosure)
131

Data on the Major Public Homebuilders

Debt-to-Equity Ratio ofMajor Homebuilders
Source: Census BureauSource: Company filings.
133
0.00 0.00
0.170.26
0.48 0.53 0.55 0.59 0.64
0.99
1.40
1.97
-0.5
0.0
0.5
1.0
1.5
2.0
NVR MDC TOL RYL MTH DHI LEN MHO PHM BHS KBH SPF BZH HOV
6.76
-11.98

Inventory-to-Equity Ratio ofMajor Homebuilders
Source: Census BureauSource: Company filings.
134
0.300.50
1.331.50 1.56 1.55
1.80
1.461.71
2.10
3.123.37
-0.5
0.0
0.5
1.0
1.5
2.0
2.5
3.0
3.5
4.0
NVR MDC TOL RYL MTH DHI LEN MHO PHM BHS KBH SPF BZH HOV
8.74
-12.89

Price-to-Book Ratio ofMajor Homebuilders
Source: Census BureauSource: Company filings.
135
2.69
1.76
1.21
1.621.41
1.55
1.08
0.70
1.27
0.39
1.97
2.43
1.37
-0.5
0.0
0.5
1.0
1.5
2.0
2.5
3.0
NVR MDC TOL RYL MTH DHI LEN MHO PHM BHS KBH SPF BZH HOV-3.09

Case Study: California, With a Focus on Sacramento
(California accounts for 10% of U.S. homes, but 33% of foreclosures – 43% by value)

137
Does the Recent Rise in Prices and Decline in the Percentage of Homes Sold Out of Foreclosure Mean California Has Bottomed?
Source: MDA Dataquick. Note: Includes new construction.
California
$0
$100
$200
$300
$400
$500
Jan-0
6
Apr-06
Jul-0
6
Oct-06
Jan-0
7
Apr-07
Jul-0
7
Oct-07
Jan-0
8
Apr-08
Jul-0
8
Oct-08
Jan-0
9
Apr-09
Jul-0
9
Med
ian
Hom
e P
rice
(000
s)
0%
10%
20%
30%
40%
50%
60%
70%
Foreclosure Resale %

138
Home Prices Crashed Through Trend Line in California, But Have Rebounded
Source: California Association of REALTORS ® . All rights reserved. www.rebsonline.com, T2 Partners estimates.
$0
$100
$200
$300
$400
$500
$600
Jan-7
9
Jan-8
1
Jan-8
3
Jan-8
5
Jan-8
7
Jan-8
9
Jan-9
1
Jan-9
3
Jan-9
5
Jan-9
7
Jan-9
9
Jan-0
1
Jan-0
3
Jan-0
5
Jan-0
7
Jan-0
9
Med
ian
Pric
e ($
000s
)
Median Sales Price4% Trend

139
Are We Seeing the Beginnings of a Bottom in Hard-Hit Markets Like Sacramento?
Source: NY Times, 5/4/09.

140
Home Prices in Sacramento More Than Tripled in Six Years – And Have Now Fallen 47%
Source: Zillow.com.

141
The Vast Majority of Sacramento Homeowners Who Purchased During the Bubble Years Are Now Underwater
Source: Zillow.com.

142
In Sacramento County, Home Sales Have Rebounded – But Are Still Outweighed by Defaults
Sources: MDA Dataquick; The Field Check Group -- data provided by ForeclosureRadar.com. Note: Includes new construction.
Monthly Notices-of-Default in Sacramento

143
Home Prices Are Stabilizing in Sacramento Country,In Part Due to More Higher End Homes Being Sold Off
Source: The Field Check Group -- data provided by ForeclosureRadar.com.
Sacramento House Prices at theTime of Foreclosure/REO
Sacramento Mix of Houses atthe Time of Foreclosure/REO
Comments From Mark Hanson (1)The Field Check Group, May 5, 2009
California housing – at the low end – is 'bottoming' mostly because: a) median prices are down 55% from their peak over the past two years, thereby making the low end affordable; b) foreclosures have temporarily been cut by 66% through moratoriums reducing supply; and c) demand is picking up going into the busy season.
But the moratoriums are ending and the number of foreclosures in the pipeline is massive – they will start showing themselves as REO over the near to mid-term. The Obama plan held the foreclosure wave back, creating a huge backlog and now the servicers are testing hundreds of thousands of defaults against the new loss mitigation initiatives. We presently see the Notice of Defaults at record highs and Notice of Trustee Sales back up to nine-month highs – there is no reason for a loan to go to the Notice of Trustee Sale stage if indeed it wasn't a foreclosure. However, the new 'batch' are not only from the low end but a wide mix all the way up to several million dollars in present value.
Because the majority of buyers are in ultra low and low-mid prices ranges, the supply-demand imbalance from foreclosures and organic supply will crush the mid-to-upper priced properties in 2009. We already have early seasonal hard data proving this. As the mid-to-upper end go through their respective implosions this year and the volume of sales in these bands increase as prices tumble, the mix shift will raise median and average house prices creating the ultimate in false bottoms. We also have data proving this phenomenon.
144

Comments From Mark Hanson (2)The Field Check Group, May 5, 2009
After a year or so the real pain will occur when the mid to upper bands are down 40% from where they are now, and the price compression has made the low to low-mid bands much less attractive – the very same bands that are so hot right now. Rents are tumbling and those that bought these properties for investment will be at risk of default (investors have been buying all the way down). Investors have just started to get taken to the woodshed from all of the supply and this will get much worse. Mid-to-upper end rental supply is also flooding on the market making it much better to rent a beautiful million dollar house than putting $300,000 down and buying.
After investors are punished -- and with move-up buyers gone for years – it will leave first-time homeowners to fix the housing market on their own. Good luck and good night. Five years from now when things look to be stabilizing, all of these terrible kick-the-can-down-the-road modifications that leave borrowers in 5-year-teaser, ultra-high-leverage, 150% LTV, balloon loans will start adjusting upward and it will be Mortgage Implosion 2.0. These loan mods will turn millions of homeowners into over-levered, underwater, renters and ensure housing is a dead asset class for years to come.
Due to a confluence of events including a national foreclosure moratorium and near-zero sales in the mid to upper end during the off season, the broader housing data show signs of stabilization. Taken in context, it is a blip. There are no silver linings or green shoots in housing whatsoever other than by these first-time homeowners – former renters – who now find it cheaper to own than rent. This is a very good thing, but it only applies to a small segment of the population and will not be able to support the market. In addition, the first-time buyers who come out of the rental market put continuous pressure on rents.
Our data shows that the mid-to-upper end housing market is on the precipice of the exact cliff that the market fell off of in 2007, led by new loan defaults. What happens to the economy when you hit the mid-to-upper end earners the same way the low-to-mid end was hit with the subprime implosion? We will find out soon enough. When we look back on housing at the end of 2009, anyone that made positive housing predictions this year will not believe how far off they were.
145

Detailed Information onThree Types of Mortgages:
Jumbo Prime, CES/HELOCs and Option ARMs
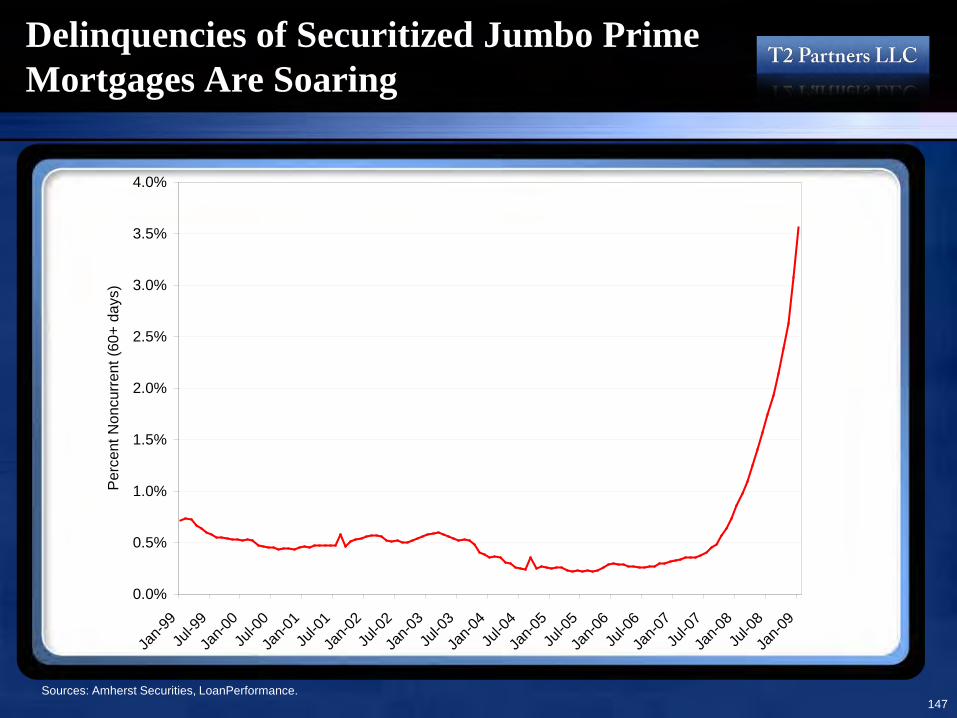
147
Delinquencies of Securitized Jumbo Prime Mortgages Are Soaring
Sources: Amherst Securities, LoanPerformance.
0.0%
0.5%
1.0%
1.5%
2.0%
2.5%
3.0%
3.5%
4.0%
Jan-9
9Ju
l-99
Jan-0
0Ju
l-00
Jan-0
1Ju
l-01
Jan-0
2Ju
l-02
Jan-0
3Ju
l-03
Jan-0
4Ju
l-04
Jan-0
5Ju
l-05
Jan-0
6Ju
l-06
Jan-0
7Ju
l-07
Jan-0
8Ju
l-08
Jan-0
9
Per
cent
Non
curr
ent (
60+
days
)

148
As the Credit Crisis Worsened, the Spread Between Jumbo and Conforming Loans Widened Dramatically
Sources: Mortgage Bankers Association via Thomson Reuters; HSHAssociates.com, in the WSJ 6/11/09.
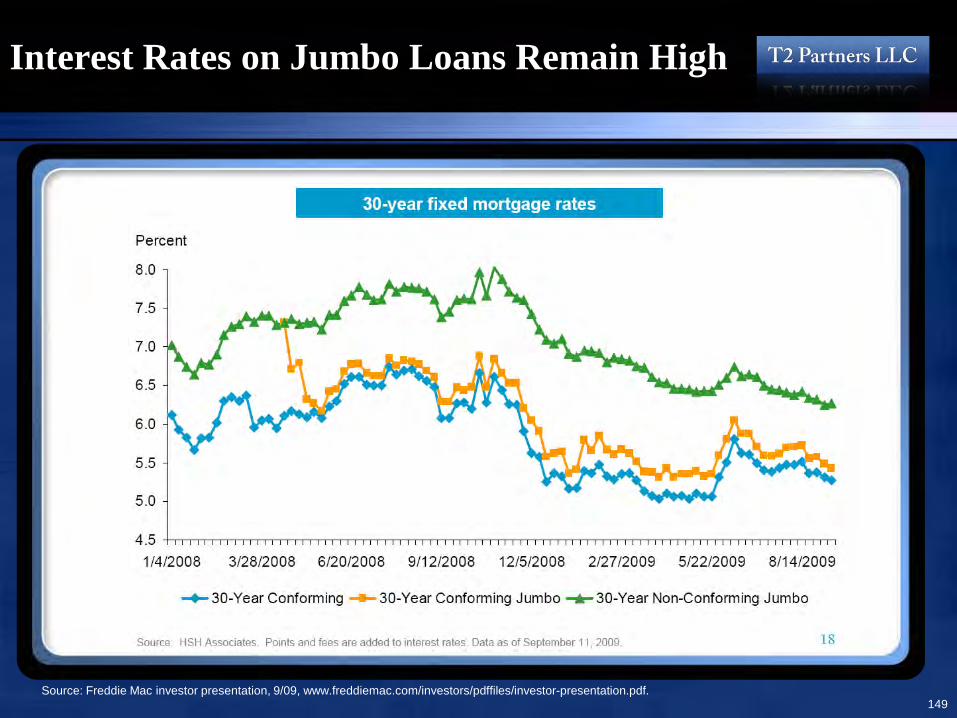
149
Interest Rates on Jumbo Loans Remain High
Source: Freddie Mac investor presentation, 9/09, www.freddiemac.com/investors/pdffiles/investor-presentation.pdf.
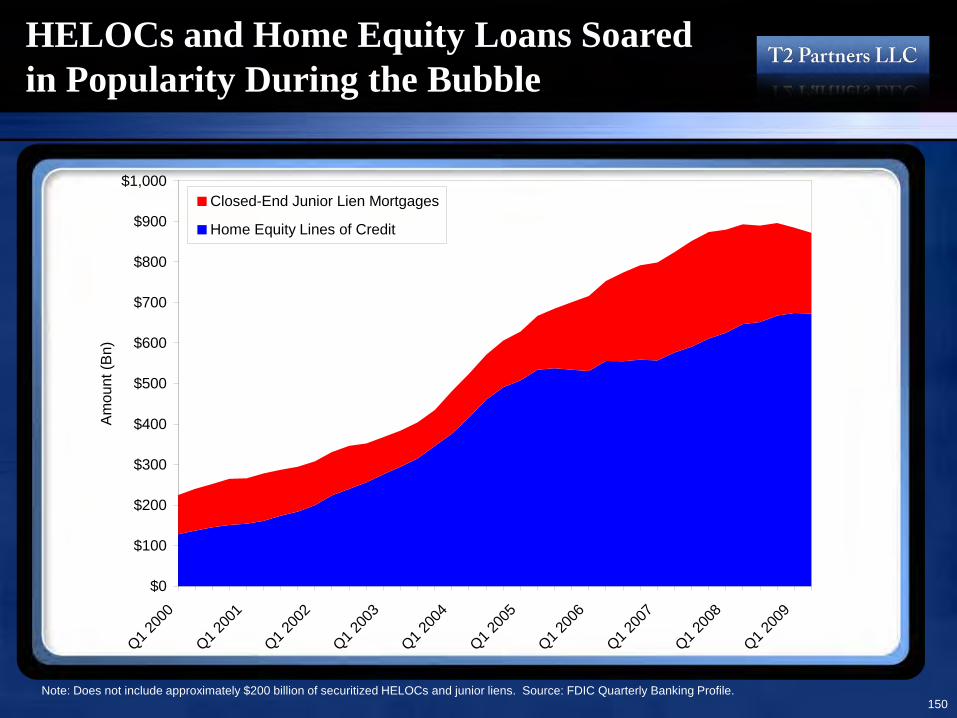
150
HELOCs and Home Equity Loans Soared in Popularity During the Bubble
Note: Does not include approximately $200 billion of securitized HELOCs and junior liens. Source: FDIC Quarterly Banking Profile.
$0
$100
$200
$300
$400
$500
$600
$700
$800
$900
$1,000
Q1 200
0
Q1 200
1
Q1 200
2
Q1 200
3
Q1 200
4
Q1 200
5
Q1 200
6
Q1 200
7
Q1 200
8
Q1 200
9
Am
ount
(Bn)
Closed-End Junior Lien Mortgages
Home Equity Lines of Credit

151
Delinquencies of HELOCs and CESs Are Soaring, Though Q2 Showed Improvement
Source: FDIC Quarterly Banking Profile.
0.0%
0.5%
1.0%
1.5%
2.0%
2.5%
3.0%
3.5%
4.0%
Q1 200
4
Q2 200
4
Q3 200
4
Q4 200
4
Q1 200
5
Q2 200
5
Q3 200
5
Q4 200
5
Q1 200
6
Q2 200
6
Q3 200
6
Q4 200
6
Q1 200
7
Q2 200
7
Q3 200
7
Q4 200
7
Q1 200
8
Q2 200
8
Q3 200
8
Q4 200
8
Q1 200
9
Q2 200
9
Per
cent
Non
curre
nt (9
0+ d
ays)
Closed-End Junior Lien MortgagesHome Equity Lines of Credit

Pools of HELOCs and CESs Can Suffer Astronomical Losses Due to 100%+ Severities
0.0%
0.5%
1.0%
1.5%
2.0%
2.5%
3.0%
1 3 5 7 9 11 13 15 17 19 21 23 25 27 29 31 33 35 37 39 41 43 45 47 49 51 53 55 57 59Months Since Close
Mon
thly
Los
s R
ate
(3m
ave
rage
)
Ambac Projection April 2008Actual
Sources: Ambac Q1 08 presentation, Amherst Securities; funds managed by T2 Partners are short Ambac.
On one second lien deal, Ambac expected losses of 10-12% when it guaranteed the senior tranche. A year ago, Ambac admitted that the pool would likely lose 81.8% of its value – and based on the pool’s performance since then, this will almost certainly prove to be conservative.
From Ambac slide, April 2008:
• Second lien deal that closed in April 2007• Loss to date 9.9%; projected loss: 81.8%• Projected collateral loss as a % of current
collateral: 86%• A reasonable estimate of projected collateral
loss for the above transaction might have been 10-12%, with the transaction having an A+ rating at inception and being structured to withstand 28-30% collateral loss
152

153
A Primer on Option ARMs
• An Option ARM is an adjustable rate mortgage typically made to a prime borrower
• Sold under various names such as “Pick-A-Pay”• Banks typically relied on the appraised value of the home and the borrower’s
high FICO score, so 83% of Option ARMs written in 2004-2007 were low- or no-doc (liar’s loans)
• Each month, the borrower can choose to pay: 1) the fully amortizing interest and principal; 2) full interest; or 3) an ultra-low teaser interest-only rate (typically 2-3%), in which case the unpaid interest is added to the balance of the mortgage (meaning it is negatively amortizing)
• Approximately 80% of Option ARMs are negatively amortizing• Lenders, however, booked earnings as if the borrowers were making full
interest payments• A typical Option ARM is a 30- or 40-year mortgage that resets (“recasts”)
after five or ten years, when it becomes fully amortizing• If an Option ARM negatively amortizes to 110-125% of the original balance
(depending on the terms of the loan), this triggers a reset even if 5 or 10 years have not elapsed
• Upon reset, the average monthly payment can jump significantly, though the payment shock is currently mitigated by today’s low interest rates

Further Details on Option ARMs
“The Option ARM home loan product is an adjustable-rate mortgage loan that provides the borrower with the option each month to make a fully-amortizing, interest-only, or minimum payment. As described in greater detail below, the minimum payment is typically insufficient to cover interest accrued in the prior month and any unpaid interest is deferred and added to the principal balance of the loan.
The minimum payment on an Option ARM loan is based on the interest rate charged during the introductory period. This introductory rate has usually been significantly below the fully-indexed rate. The fully-indexed rate is calculated using an index rate plus a margin. Once the introductory period ends, the contractual interest rate charged on the loan increases to the fully-indexed rate and adjusts monthly to reflect movements in the index.
If the borrower continues to make the minimum monthly payment after the introductory period ends, the payment may not be sufficient to cover interest accrued in the previous month. In this case, the loan will "negatively amortize" as unpaid interest is deferred and added to the principal balance of the loan.The minimum payment on an Option ARM loan is adjusted on each anniversary date of the loan but each increase or decrease is limited to a maximum of 7.5% of the minimum payment amount on such date until a "recasting event" occurs.
A recasting event occurs every 60 months or sooner upon reaching a negative amortization cap. When a recasting event occurs, a new minimum monthly payment is calculated without regard to any limits on the increase or decrease in amount that would otherwise apply under the annual 7.5% payment cap. This new minimum monthly payment is calculated to be sufficient to fully repay the principal balance of the loan, including any theretofore deferred interest, over the remainder of the loan term using the fully-indexed rate then in effect.
A recasting event occurs immediately whenever the unpaid principal balance reaches the negative amortization cap, which is expressed as a percent of the original loan balance. Prior to 2006, the negative amortization cap was 125% of the original loan balance... For all Option ARM loans originated in 2006, the negative amortization cap was 110% of the original loan balance. For Option ARM loans originated in 2007, the negative amortization cap was raised to 115%...
In the first month that follows a recasting event, the minimum payment will equal the fully-amortizing payment.
From Washington Mutual’s 2007 10K (emphasis added):
154

155
About $750 Billion of Option ARMs Were Written, Nearly All at the Peak of the Bubble
Sources: 2008 Mortgage Market Statistical Annual, published by Inside Mortgage Finance Publications, Inc. Copyright 2008. T2 Partners estimates.
5%
9%
1%
8%
5%
$0
$50
$100
$150
$200
$250
$300
2004 2005 2006 2007 2008
Orig
inat
ions
(Bn)
0%
1%
2%
3%
4%
5%
6%
7%
8%
9%
Percent of Total

156
Options ARMs Were a Bubble State Phenomenon
Sources: Amherst Securities, LoanPerformance.
California58%
Florida10%
Nevada3%
Arizona3%
Other25%

Beginning in March 2005, High-FICO-Score Borrowers Opted for an Above-Market-Rate Option ARM in Exchange for the Low Teaser Rate
Source: Amherst Securities, BloombergFinance, L.P.
4.0
4.5
5.0
5.5
6.0
6.5
7.0
7.5
8.0
8.5
Jan-0
2Apr-
02Ju
l-02
Oct-02
Jan-0
3Apr-
03Ju
l-03
Oct-03
Jan-0
4Apr-
04Ju
l-04
Oct-04
Jan-0
5Apr-
05Ju
l-05
Oct-05
Jan-0
6Apr-
06Ju
l-06
Oct-06
Jan-0
7Apr-
07Ju
l-07
Oct-07
Jan-0
8
Inte
rest
Rat
e (%
)
Fannie Mae 30 Year FRM IndexOption ARM Index
Nearly all Option ARM borrowers during this period (when nearly all Option ARMs were written) can’t afford a fully-amortizing mortgage – otherwise they would have taken one
157
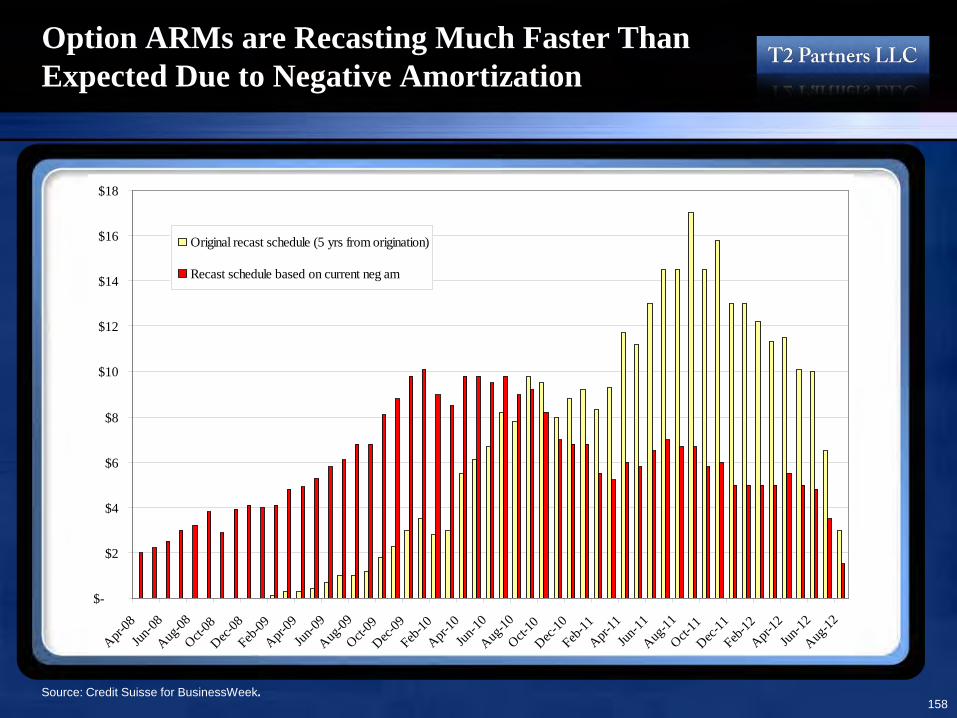
Option ARMs are Recasting Much Faster Than Expected Due to Negative Amortization
$-
$2
$4
$6
$8
$10
$12
$14
$16
$18
Apr-08
Jun-08
Aug-08
Oct-08
Dec-08
Feb-09
Apr-09
Jun-09
Aug-09
Oct-09
Dec-09
Feb-10
Apr-10
Jun-10
Aug-10
Oct-10
Dec-10
Feb-11
Apr-11
Jun-11
Aug-11
Oct-11
Dec-11
Feb-12
Apr-12
Jun-12
Aug-12
Original recast schedule (5 yrs from origination)
Recast schedule based on current neg am
Source: Credit Suisse for BusinessWeek.158
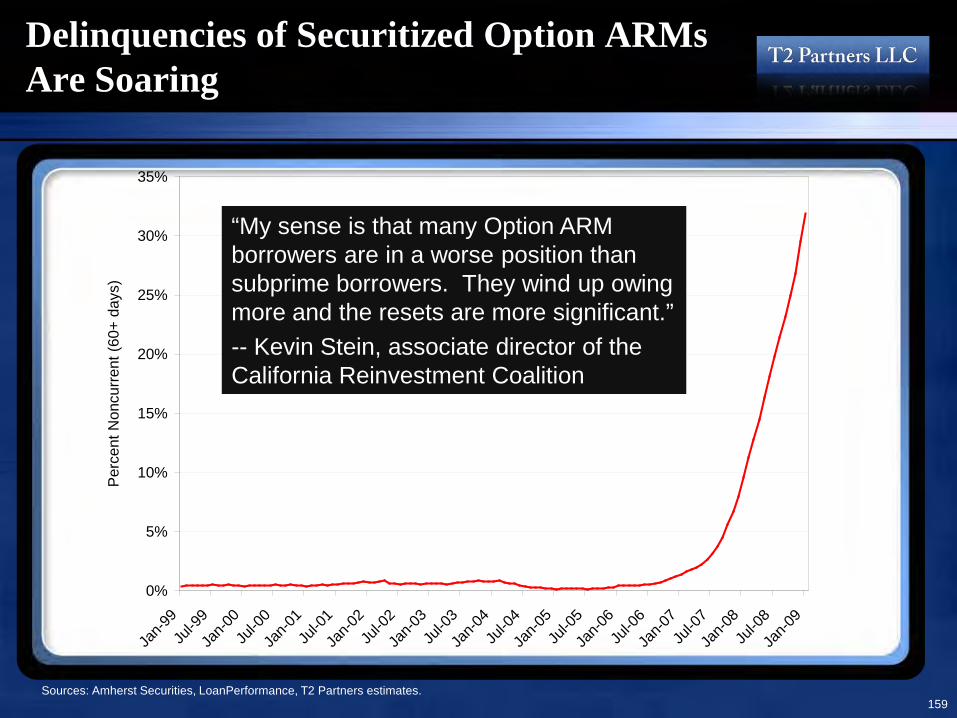
159
Delinquencies of Securitized Option ARMs Are Soaring
Sources: Amherst Securities, LoanPerformance, T2 Partners estimates.
0%
5%
10%
15%
20%
25%
30%
35%
Jan-9
9Ju
l-99
Jan-0
0Ju
l-00
Jan-0
1Ju
l-01
Jan-0
2Ju
l-02
Jan-0
3Ju
l-03
Jan-0
4Ju
l-04
Jan-0
5Ju
l-05
Jan-0
6Ju
l-06
Jan-0
7Ju
l-07
Jan-0
8Ju
l-08
Jan-0
9
Per
cent
Non
curr
ent (
60+
days
)
“My sense is that many Option ARM borrowers are in a worse position than subprime borrowers. They wind up owing more and the resets are more significant.”-- Kevin Stein, associate director of the California Reinvestment Coalition

Comments From a Federal Senior Bank Examiner (3/08)
“The next problem is with the Option ARM product. Approximately 80-90% are paying the minimum credit card payment and most loans are negatively amortizing.
Here the payment shock is two-fold – rate and principal – and the increase in payments can be astronomical: 200% or higher, not the 10 to 100% that subprime has experienced. Also, the dollars exposed in Alt-A [many analysts group Option ARMs with Alt-A] are nearly 50% higher than subprime: the Alt-A average balance is $299,000 versus $181,000 for subprime.
Also, 73% were underwritten with Low or No Doc. The Option ARM books of many lenders are already showing significant deterioration and they have not even recast yet.
This is the next tsunami to hit the housing market. This will hit much higher price points $600,000 and above as this was the affordability product used by higher income/higher FICO score households to buy that dream home.”
160

What’s Happening at the Micro LevelAmong Securitized Loans

162
Among Securitized Loans, There Are Signs of Stabilization – New Defaults Are Slowing, Though They Remain Very High
Sources: LoanPerformance, Amherst Securities.

163
The Pool of Defaulted Loans Is No Longer Growing Because Defaults Are Now Matched by Liquidations
Sources: LoanPerformance, Amherst Securities.

164
All Types of Securitized Loans Are Showing Lower Defaults in Recent Months – But It’s Unclear If This Is Sustainable
Sources: LoanPerformance, Amherst Securities.
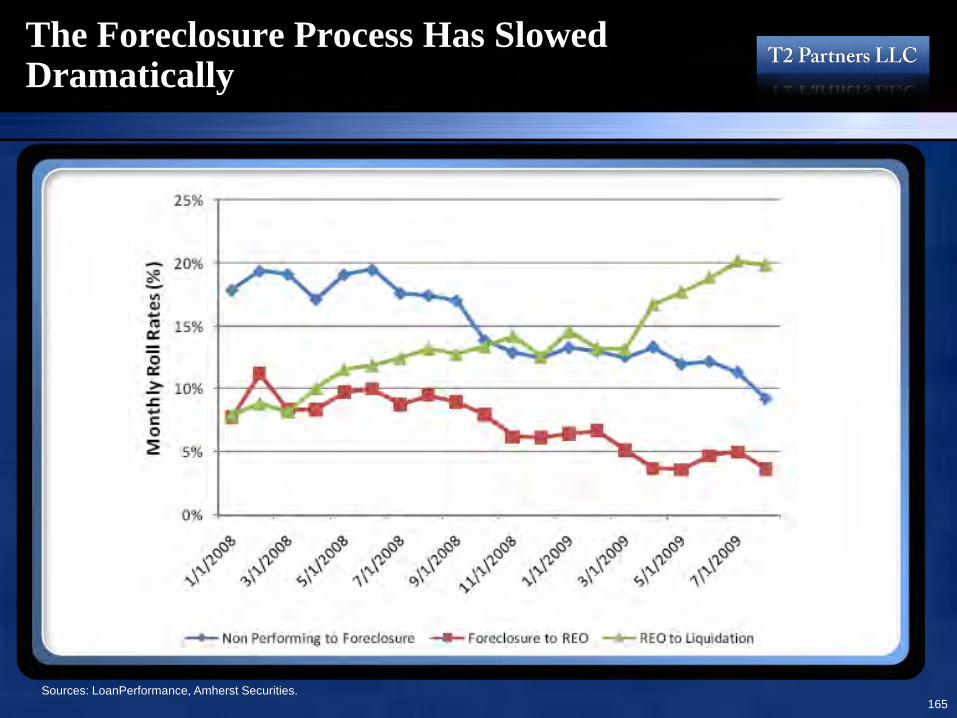
165
The Foreclosure Process Has Slowed Dramatically
Sources: LoanPerformance, Amherst Securities.
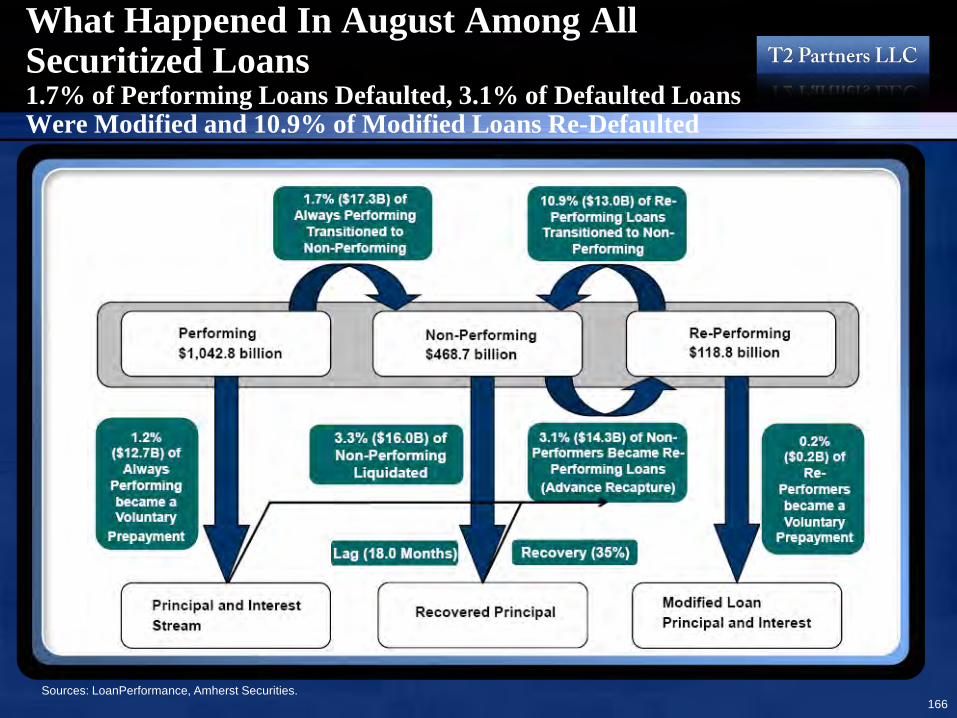
166
What Happened In August Among All Securitized Loans1.7% of Performing Loans Defaulted, 3.1% of Defaulted Loans Were Modified and 10.9% of Modified Loans Re-Defaulted
Sources: LoanPerformance, Amherst Securities.

A Closer Look at Mortgages ThatWere Securitized: Quantity and Quality

Hundreds of Billions of Dollars of Mortgages Were Securitized, Many On Terms With No Historical Precedent
Green: Loans with historical precedentYellow: Loans with limited historical precedent Red: Loans with no historical precedent
Securitized First Liens – Origination Volume
Source: Amherst Securities Group, L.P.
These are the worst loans: $828 billion worth
168

Tens of Billions of Dollars of 2nd Lien Mortgages Were Also Securitized, Many On Terms With No Historical Precedent
Green: Loans with historical precedentYellow: Loans with limited historical precedent Red: Loans with no historical precedent
Securitized Second Liens – Origination Volume
Source: Amherst Securities Group, L.P.
Another $56 billion of even bigger problems
169

Volume of June 2005 Fixed Rate and 2/28*
Full Doc Securitized Mortgage Loans
2/28 Full Doc – June 2005 ProductionTotal Volume: $16.4 billionGreen: 39.9%; Yellow: 25.2%; Red: 26.1%
Fixed Full Doc – June 2005 ProductionTotal Volume: $ 8.1 billionGreen: 70.0%; Yellow: 9.3%; Red: 5.4%
Note: Green: Loans with historical precedent; Yellow: Loans with limited historical precedent; Red: Loans with no historical precedent* 2-28 loans are those with two-year teaser interest rates that then reset, often to higher rates, causing payment shock and a surge in defaults. Because they offer the lowest monthly payments (for the first two years), they are generally the lowest-quality loans, preferred by speculators and the most over-stretched borrowers.
Source: Amherst Securities Group, L.P.
Loan-to-Value Loan-to-Value
FIC
O
170
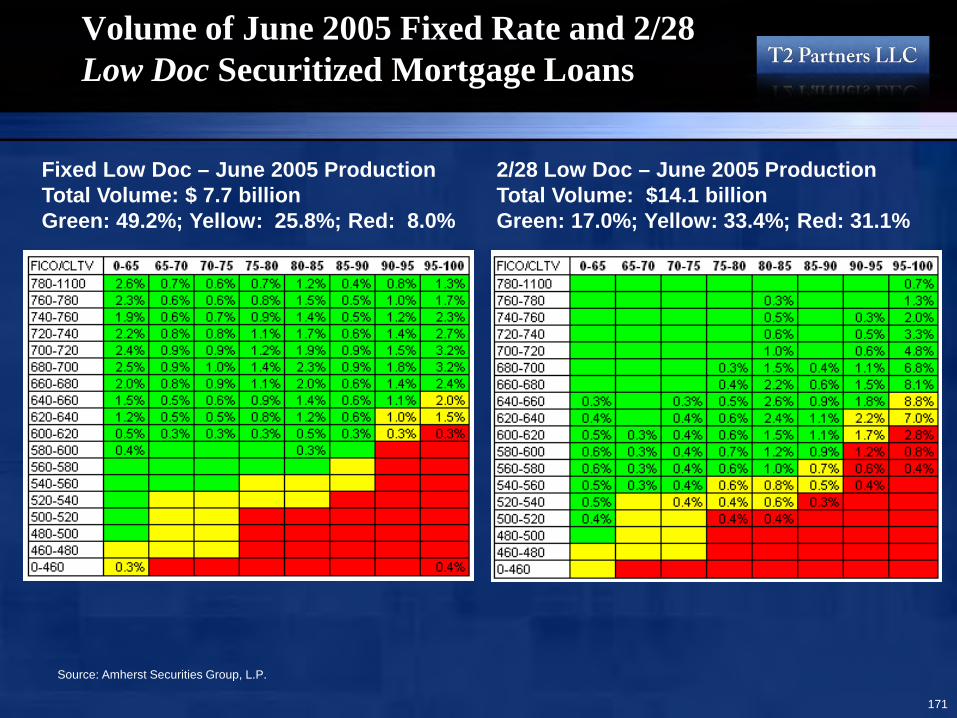
Volume of June 2005 Fixed Rate and 2/28 Low Doc Securitized Mortgage Loans
2/28 Low Doc – June 2005 ProductionTotal Volume: $14.1 billionGreen: 17.0%; Yellow: 33.4%; Red: 31.1%
Fixed Low Doc – June 2005 ProductionTotal Volume: $ 7.7 billion Green: 49.2%; Yellow: 25.8%; Red: 8.0%
Source: Amherst Securities Group, L.P.
171

Origination Volume of Fixed Rate, Full Doc Securitized Mortgage Loans, January 2005
In the best category of loans (full doc, fixed rate), in January 2005, just before mortgage lending standards collapsed, nearly all securitized mortgages were green, meaning they had FICO and LTV characteristics with historical precedent.
SubprimeAlt-APrime
172

Origination Volume of Fixed Rate, Full Doc Securitized Mortgage Loans, June 2005
Mortgage lending standards began to worsen by June 2005.
173

Origination Volume of Fixed Rate, Full Doc Securitized Mortgage Loans, January 2006
By January 2006, mortgage lending standards had deteriorated substantially, even more the best loans, with large percentages yellow and red, meaning they had FICO and LTV characteristics with little or no historical precedent.
174

Origination Volume of Fixed Rate, Full Doc Securitized Mortgage Loans, June 2006
By June 2006, mortgage lending standards had collapsed, even for the best loans, with large percentages yellow and red, meaning they had FICO and LTV characteristics with little or no historical precedent.
175

Origination Volume of 2/28, Low Doc Securitized Mortgage Loans, January 2005
For the worst category of loans (low/no doc with two-year teaser rates), mortgage lending standards were abysmal as early as January 2005 – and got worse from there.
176
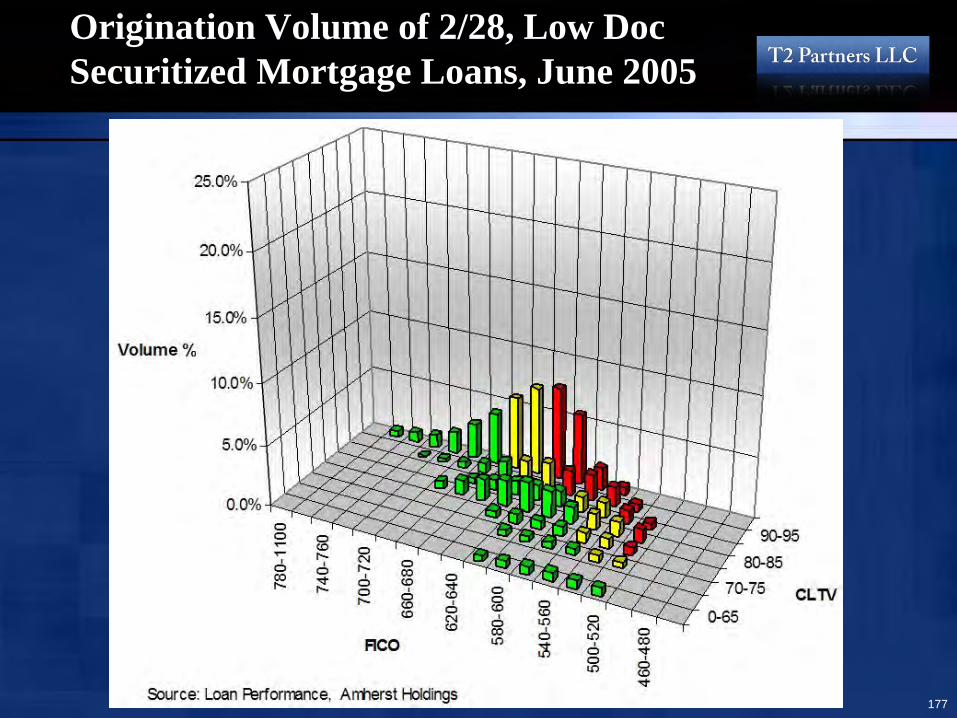
Origination Volume of 2/28, Low Doc Securitized Mortgage Loans, June 2005
177

Origination Volume of 2/28, Low Doc Securitized Mortgage Loans, January 2006
178

Origination Volume of 2/28, Low Doc Securitized Mortgage Loans, June 2006
A very high percentage of these loans will never be repaid.
179

A Closer Look at MortgagesThat Were Securitized: Defaults

Default Rates of June 2005 Fixed Rate and 2/28 Full Doc Securitized Mortgage Loans
2/28 Full Doc – June 2005 ProductionTotal Volume: $16.4 billionGreen: 39.9%; Yellow: 25.2%; Red: 26.1%
Fixed Full Doc – June 2005 ProductionTotal Volume: $ 8.1 billionGreen: 70.0%; Yellow: 9.3%; Red: 5.4%
Loan-to-Value Loan-to-Value
FIC
O
Unprecedented default rates – and lending standards got much worse subsequent to June 2005!
Source: Amherst Securities, May 25th reports, reflecting payments through 4/30/09. 181

Default Rates of June 2005 Fixed Rate and 2/28 Low Doc Securitized Mortgage Loans
2/28 Low Doc – June 2005 ProductionTotal Volume: $14.1 billionGreen: 17.0%; Yellow: 33.4%; Red: 31.1%
Fixed Low Doc – June 2005 ProductionTotal Volume: $ 7.7 billion Green: 49.2%; Yellow: 25.8%; Red: 8.0%
Default rates are much higher for no/low doc “liars” loans
Loan-to-Value Loan-to-Value
FIC
O
Source: Amherst Securities, May 25th reports, reflecting payments through 4/30/09. 182

Monthly Default Rate for Fixed Rate Securitized Mortgage Loans (Green)
Defaults are defined as loans that are 90 days or more delinquent. sTr measures the percentage of loans that become 90 days or more delinquent during the month, as a percentage of non-delinquent loans at the beginning of the month.
This chart shows the performance of the very best (fixed rate, green) mortgages. Note that late 2004 and early 2005 vintage loans have sTrs of approximately 70 basis points, which translates into roughly an 8% cumulative default rate in one year, whereas more recent vintage loans are quickly spiking up to a 2% sTr, which translates into an 21.5% cumulative default rate in one year.
12/04
9/06
Source: Amherst Securities Group, L.P. 183

Monthly Default Rate for Fixed RateSecuritized Mortgage Loans (Yellow)
In this chart, late 2004 and early 2005 vintage loans have sTrs of approximately 1.5%, which translates into a 16.6% cumulative default rate in one year, whereas more recent vintage loans are quickly spiking up to a 3% sTr, which translates into a 30.6% cumulative default rate in one year.
Source: Amherst Securities Group, L.P.184

Monthly Default Rate for Fixed RateSecuritized Mortgage Loans (Red)
In this chart, late 2004 and early 2005 vintage loans have sTrs of approximately 2%, which translates into a 21.5% cumulative default rate in one year, whereas more recent vintage loans are quickly spiking up to a 4-5% sTr, which translates into a 38-46% cumulative default rate in one year.
Source: Amherst Securities Group, L.P.185

Monthly Default Rate for 2-28Securitized Mortgage Loans (Green)
2-28 loans are those with two-year teaser interest rates that then reset, sometimes to higher rates, which triggers payment shock and a surge in defaults.In this chart, note the surge in sTr shortly after the two-year reset, as well as the rapidly rising sTr even before the reset in more recent vintage loans – compare 12/04, 12/05 and 9/06 loans, for example.
12/05(pre-reset)
Source: Amherst Securities Group, L.P.
9/06(pre-reset)
12/04-6/05(pre-reset)
186

Monthly Default Rate for 2-28Securitized Mortgage Loans (Yellow)
2006 and 2007 loans are defaulting at 5-6% per month even before the reset
Source: Amherst Securities Group, L.P. 187

Monthly Default Rate for 2-28Securitized Mortgage Loans (Red)
For recent vintage 2-28 red loans, sTrs are jumping to 6-8% long before the reset
Source: Amherst Securities Group, L.P.188

Current Trends Are Quickly Leading to Unprecedented Default Levels
Historical levels
Late 2005 and thereafter,Green, fixed
Late 2005 and thereafter,Green, 2/28
Late 2005 and thereafter,Red, 2/28
2004 green,fixed
Three-Year Cumulative Defaults
Notes: MDR = sTr = monthly default rate. CDR = cumulative default rate, which represents the amount of loans in default after 36 months as a percentage of the original balance when keeping MDR and VPR constant for that time period.
Source: Amherst Securities Group.
(1 yr):
Volu
ntar
y P
repa
ymen
tR
ate
(VP
R)
189

Bubble-Era Pools of Subprime Mortgages Are Performing Catastrophically
Source: Amherst Securities, May 25th reports, reflecting payments through 4/30/09.
Cumulative defaults Monthly default rate
Annualized default rate
Monthly prepay rate
Annualizedprepay rate
An average of 47.6% of the loans have already defaulted
On average, 5.1% of the performing loans in the pools
defaulted during the month
The monthly prepay rate only averaged 0.5%
The 20 RMBS Pools That Comprise the ABX 06-2
Total:
190

Where Did the Securitized Mortgages End Up?A Primer on ABSs and CDOs

Wall Street Firms Bought Loans and Securitized Them, First Into Asset-Backed Securities Called Residential Mortgage Backed Securities (RMBSs)
Quick Review: What is a Securitization?
Source: Deutsche Bank Securitization Research; “How to Save the Bond Insurers”, Pershing Square presentation, 11/28/07. 192

Trillions of Dollars of ABSs and CDOs Were Created and Distributed Throughout the Financial System
Note: This is all ABSs and CDOs, not just those related to mortgagesSource: Lehman Brothers, 4/08; Carlyle presentation 10/15/08. 193

What Should the Government Do in theCase of Distressed Financial Institutions?
Answer: The problem isn’t lack of capital, but lack of the right kind of capital. They have too much debt and not enough equity.
Therefore the solution is to convert some of the debt to equity.
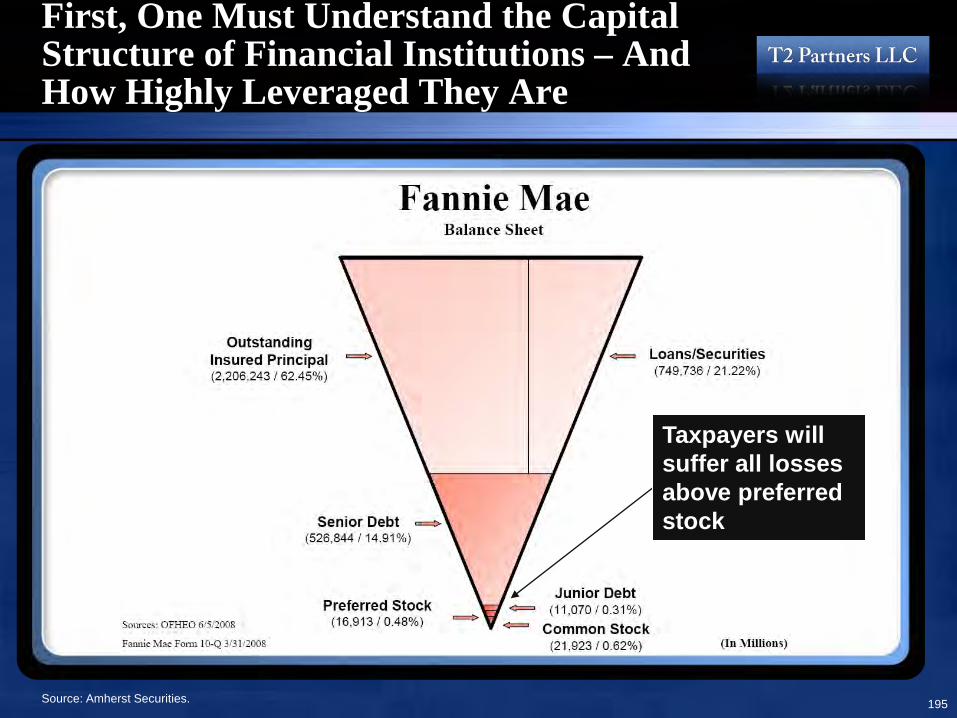
First, One Must Understand the Capital Structure of Financial Institutions – And How Highly Leveraged They Are
Taxpayers will suffer all losses above preferred stock
Source: Amherst Securities. 195

Freddie Mac
Taxpayers will suffer all losses above preferred stock
Source: Amherst Securities. 196
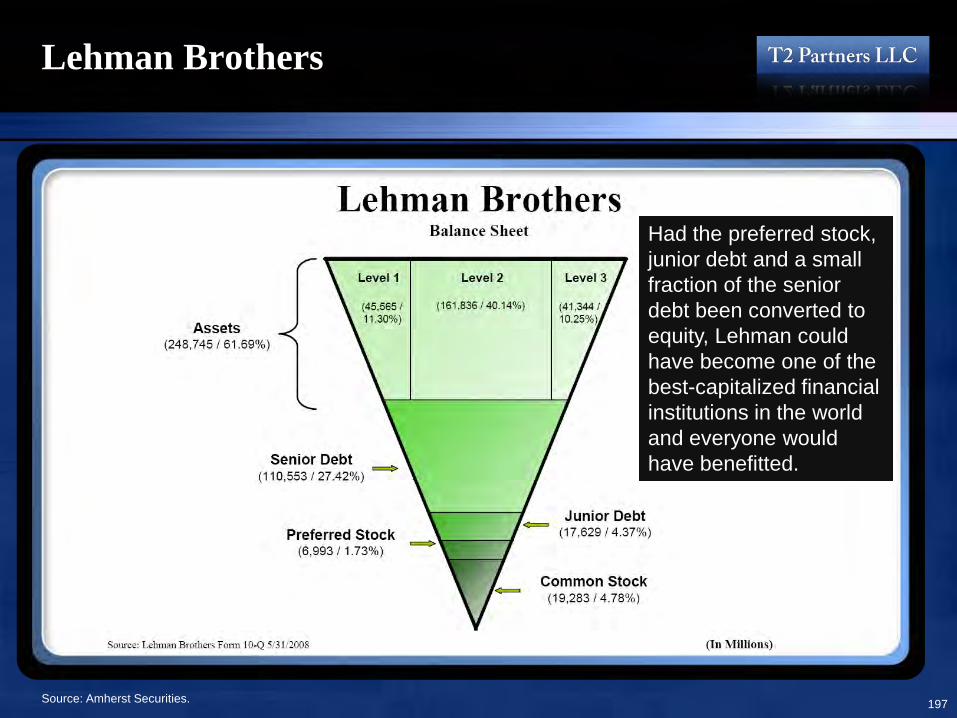
Lehman Brothers
Source: Amherst Securities.
Had the preferred stock, junior debt and a small fraction of the senior debt been converted to equity, Lehman could have become one of the best-capitalized financial institutions in the world and everyone would have benefitted.
197

Overview of Fannie, Freddie and Lehman
Source: Amherst Securities 198

The $1 Trillion Dollar Mistake
• The U.S. financial system likely faces losses of at least $1 trillion, most of which is likely to be realized within the next 2-3 years
• There is almost no equity cushion left to cover these losses, so somebody is going to have to come up with $1 trillion to save the system
• THE QUESTION IS: WHO?• Current government policy (in the cases of Fannie, Freddie, AIG, Citigroup and Bank of
America) is to invest (or guarantee assets) senior to the equity, but junior to all debt, even junior/unsecured/subordinated debt
• Absent the government, debt holders would bear the $1 trillion cost (as they did with Lehman), but under current policy, taxpayers will bear this entire cost
• This is unfair and unwise– Fairness: Debt holders were paid higher interest than, for example, buying Treasuries in
exchange for knowingly taking more risk. These investors made bad decisions, lending to highly leveraged companies that made bad decisions, so why should they be protected?
– Moral Hazard: The reckless behavior of debt investors was a major contributor to the bubble. It was low-cost debt with virtually no strings attached that allowed borrowers, especially the world's major financial institutions, to become massively overleveraged, fueling the greatest asset bubble in history. This was not an equity bubble – unlike the internet bubble, for example, stock market valuations never got crazy – it was a debt bubble, so it would be particularly perverse and ironic if government bailouts allowed equity holders to take a beating, yet fully protected debt holders.
• The solution: debt should be converted into equity199

But What About Systemic Risk?
• What about the lessons from Lehman? Unless we protect the debt holders, won’t the financial system shut down again, as it nearly did in the wake of the Lehman bankruptcy? No. The lessons from Lehman have been misunderstood.
– The mistake wasn't the failure to protect the debt, but rather allowing Lehman to go bankrupt, which not only impacted Lehman's equity and debt holders, but also stiffed Lehman's countless clients and counterparties. It's the latter that caused the true chaos.
– Lehman should have been seized and put into conservatorship, so that all of Lehman's clients and counterparties could have relied on Lehman (as was done with AIG) - but debt holders would have taken losses as they were realized (which is not being done with AIG).
• If debt holders take a hit, might other financial institutions who own the debt might become insolvent, creating a domino effect? And might debt markets freeze up such that even currently healthy banks might not be able to access debt and collapse?
– Regarding the former, the debt is owned by a wide range of institutions all over the world: sovereign wealth funds, pension funds, endowments, insurance companies and, to be sure, other banks. Some of them would no doubt be hurt if they take losses on the debt they hold in troubled financial institutions - but that's no reason to protect all of them 100% with taxpayer money.
– As for the latter concern that debt markets might freeze up, causing even healthy banks to collapse, it's important to understand that right now there is no junior debt available to any financial institution with even a hint of weakness - there's very high cost equity and government-guaranteed debt. Neither of these will be affected if legacy debt holders are forced to bear some of the cost of the failure of certain institutions.
200

Case Study: Bank of America
• As of the end of 2008 (not including Merrill Lynch), BofA had $1.82 trillion in assets ($1.72 trillion excluding goodwill and intangibles), supported by a mere $86.6 billion in tangible equity – 5.0% of tangible assets or 20:1 leverage – and $48.9 billion of tangible common equity – 2.8% of tangible assets or 35:1 leverage
• Among the company's loans are many in areas of great stress including:– $342.8 billion of commercial loans ($6.5 billion of which is nonperforming, up from $2.2 billion
a year earlier)– $253.5 billion of residential mortgages ($7.0 billion of which is nonperforming, up from $2.0
billion a year earlier)– $152.5 billion of home equity loans (HELOCs; about $33 billion of which were Countrywide's)– $18.2 billion of Option ARMs (all Countrywide’s)
• BofA is acknowledging a significant increase in losses, but its reserving has actually become more aggressive over the past year. From the end of 2007 to the end of 2008, nonperforming assets more than tripled from $5.9 billion to $18.2 billion, yet the allowance for credit losses didn't even double, from $12.1 billion to $23.5 billion. As a result, the allowance for loan and lease losses as a percentage of total nonperforming loans and leases declined from 207% to 141%
• BofA has $268.3 billion of long-term debt, $158.1 of commercial paper and other short-term borrowings
– In addition, Merrill Lynch at the time of acquisition had $5.3 billion of junior subordinated notes, $31.2 billion of short-term debt and $206.6 billion of long-term debt
201

What the Government Should Do If a Company Blows Up and Can’t Find a Buyer?
1. Seize it and put it into conservatorship2. The Conservator would replace board and management and suspend
the voting rights and other decision rights of the shareholders3. No dividends, share repurchases or other transfers of resources to the
old shareholders could take place while the Conservatorship is in effect4. The Conservator should be able to haircut all unsecured debt holders
and other unsecured creditors, regardless of seniority5. The Conservator would also be able to impose mandatory debt-to-
equity conversions on all unsecured creditors and debt holders, with or without first extinguishing the equity of the old shareholders
6. The Conservator would have full authority to sell assets and to restructure the balance sheet and the activities of the business in any way deemed appropriate and lawful
7. The Conservator would have the power to liquidate the company
Source: Time to Pull the Plug on AIG?, Willem Buiter, http://blogs.ft.com/maverecon/2008/11/time-to-pull-the-plug-on-aig
202

It Is Premature to Allow Banks to Repay TARP Money
We agree with this Financial Times editorial:
An escape too soon for US banksJune 10 2009The US Treasury’s decision to release 10 of its wards from the straitjacket of the troubled asset relief
programme was presented – and widely taken – as good news. But in fact, it sacrificed sound financial policy for political need.
Letting JPMorgan Chase, Goldman Sachs, Morgan Stanley and others repay $68bn to the US taxpayer helps placate the combustible public fury at bank bail-outs that almost escaped Barack Obama’s control this winter. The president even makes a point of noting that the government made a profit on the returned funds. The 10 financial groups’ escape from Tarp’s heavy-handed restrictions also weakens accusations of socialism by some Republicans, to which Mr Obama’s administration has been surprisingly thin-skinned.
But letting the banks out of Tarp at this point was premature. Supposedly weaned off public support, the 10 had to demonstrate they could raise funds without government guarantees. The temporary liquidity guarantee programme, however, remains available to them. In effect subsidised by the government, but freed from Tarp rules on compensation and hiring, they can poach both staff and business from competitors still in Tarp. This is more regulatory discrimination than it is restitution of market discipline.
Even worse is that, for these 10, Tarp has been terminated without addressing the problem that it was supposed to stave off. That problem – or so many thought in the chaos that followed Lehman Brothers’ collapse – was that some banks are too big to be allowed to fail, lest they drag the whole financial system down with them.
This fundamental situation has not changed. The stress tests of the largest banks – now looking rather lenient – and the demand that some of them raise additional capital were designed to make failure less likely; they did nothing to make failure less intolerable to the public interest. A bank that was too large to fail in October is still too large to fail now, should another market freeze-up occur. These walking systemic dangers have every reason to restart their risky hunt for yield.
There is much to criticise about the government’s use of Tarp to influence the banks. But returning to the status quo ante is no remedy. Tim Geithner, Treasury secretary, should first have secured the promised special resolution regime for bank holding companies. Only then would exits from Tarp have sent the right signal to the market: that the released banks were now free to fail.
203