Embed Size (px)
Citation preview
TDA Progress Report 42-124 February 15, 1996
An Overview of the GOLD Experiment Betweenthe ETS-VI Satellite and the Table
Mountain FacilityK. E. Wilson
Communications Systems and Research Section
The Ground/Orbiter Lasercomm Demonstration is a demonstration of opticalcommunications between the Japanese Engineering Test Satellite (ETS-VI) and anoptical ground transmitting and receiving station at the Table Mountain Facilityin Wrightwood, California. Laser transmissions to the satellite are performed forapproximately 4 hours every third night when the satellite is at apogee above TableMountain. The experiment requires the coordination of resources at the Communi-cations Research Laboratory (CRL), JPL, the National Aeronautics and Space De-velopment Agency (NASDA) Tsukuba tracking station, and NASA’s Deep SpaceNetwork at Goldstone, California, to generate and transmit real-time commandsand receive telemetry from the ETS-VI. Transmissions to the ETS-VI began inNovember 1995 and are scheduled to last into the middle of January 1996, whenthe satellite is expected to be eclipsed by the Earth’s shadow for a major part ofits orbit. The eclipse is expected to last for about 2 months, and during this periodthere will be limited electrical power available on board the satellite. NASDA plansto restrict experiments with the ETS-VI during this period, and no laser transmis-sions are planned. Posteclipse experiments are currently being negotiated. GOLDis a joint NASA–CRL experiment that is being conducted by JPL in coordinationwith CRL and NASDA.
I. Introduction
The Ground/Orbiter Lasercomm Demonstration (GOLD) is a joint NASA/Communications ResearchLaboratory (CRL) optical communications experiment to evaluate one-way and two-way optical commu-nications under a range of atmospheric conditions and to demonstrate optical ranging. GOLD’s objectivesand goals are outlined below.
The objectives are to
8
(1) Demonstrate two-way spatial acquisition/tracking of laser beams with a spacecraft
(2) Accomplish one-way and two-way optical data transfer to a spacecraft and measure bit-error rates
(3) Accumulate 10 elapsed hours of transmission/reception experience and 30 Gbytes over a6-month period
(4) Compare downlink atmospheric transmission losses with similar data from the TableMountain Facility’s (TMF’s) atmospheric visibility monitoring (AVM) observatory
The goals are to
(1) Gather atmospheric transmission statistics from an actual space-to-ground link and com-pare them with corresponding statistics from the AVM system
(2) Build a database for optical link acquisition/reacquisition times
(3) Validate optical communications-link performance prediction tools
(4) Demonstrate optical ranging to 10-m accuracy
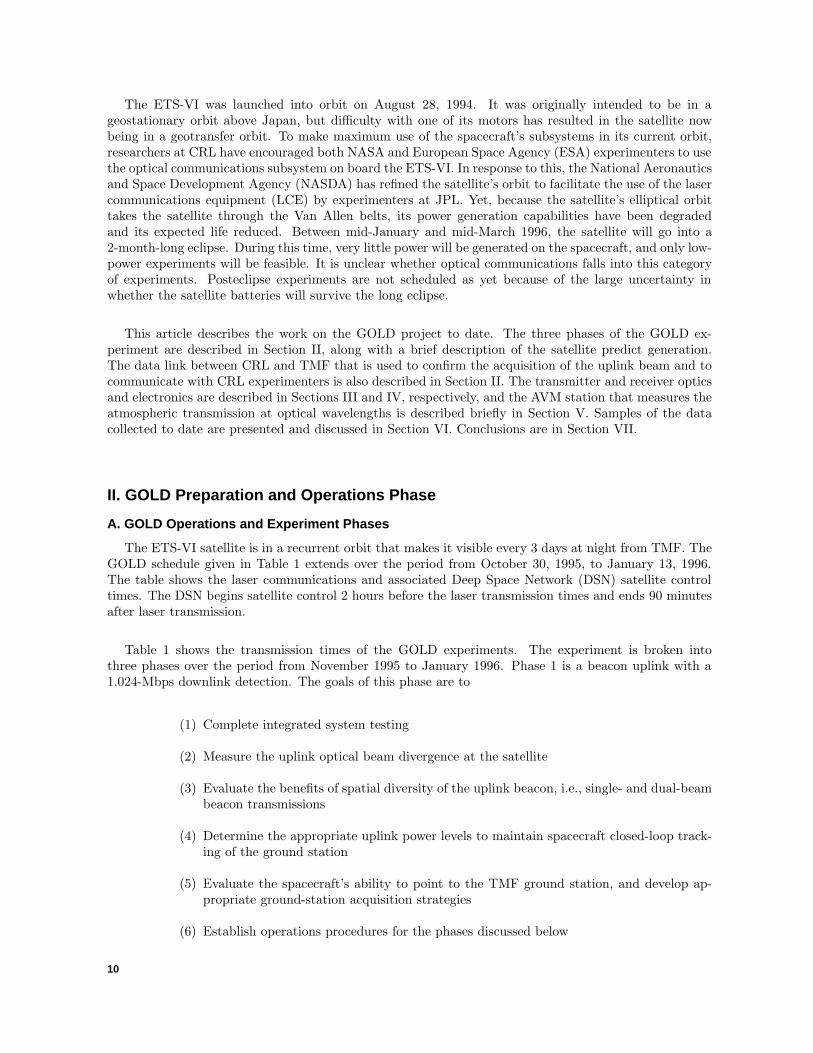
GOLD experiments will use the 0.6-m and 1.2-m telescopes located at NASA’s TMF to communicatewith the Japanese Engineering Test Satellite (ETS-VI). The experiment concept is depicted in Fig. 1. Anargon-ion laser coupled to the 0.6-m telescope transmits a 1.024-Mbps Manchester-coded pseudorandomnoise (PN) sequence to the spacecraft. The ETS-VI in turn uses its GaAs laser to transmit a similar PNsequence to the 1.2-m ground receiver located approximately 60-m from the transmitter site.
830-nm DOWNLINK
514.5-nm UPLINK
0.6-m TRANSMITTER1.2-m RECEIVER
Fig. 1. Conceptual drawing of GOLD. The transmitter at TMF uplinks a 514.5-nm com-munications signal to the ETS-VI. The satellite downlinks a 830-nm 1-Mbps signal.
9
The ETS-VI was launched into orbit on August 28, 1994. It was originally intended to be in ageostationary orbit above Japan, but difficulty with one of its motors has resulted in the satellite nowbeing in a geotransfer orbit. To make maximum use of the spacecraft’s subsystems in its current orbit,researchers at CRL have encouraged both NASA and European Space Agency (ESA) experimenters to usethe optical communications subsystem on board the ETS-VI. In response to this, the National Aeronauticsand Space Development Agency (NASDA) has refined the satellite’s orbit to facilitate the use of the lasercommunications equipment (LCE) by experimenters at JPL. Yet, because the satellite’s elliptical orbittakes the satellite through the Van Allen belts, its power generation capabilities have been degradedand its expected life reduced. Between mid-January and mid-March 1996, the satellite will go into a2-month-long eclipse. During this time, very little power will be generated on the spacecraft, and only low-power experiments will be feasible. It is unclear whether optical communications falls into this categoryof experiments. Posteclipse experiments are not scheduled as yet because of the large uncertainty inwhether the satellite batteries will survive the long eclipse.
This article describes the work on the GOLD project to date. The three phases of the GOLD ex-periment are described in Section II, along with a brief description of the satellite predict generation.The data link between CRL and TMF that is used to confirm the acquisition of the uplink beam and tocommunicate with CRL experimenters is also described in Section II. The transmitter and receiver opticsand electronics are described in Sections III and IV, respectively, and the AVM station that measures theatmospheric transmission at optical wavelengths is described briefly in Section V. Samples of the datacollected to date are presented and discussed in Section VI. Conclusions are in Section VII.
II. GOLD Preparation and Operations Phase
A. GOLD Operations and Experiment Phases
The ETS-VI satellite is in a recurrent orbit that makes it visible every 3 days at night from TMF. TheGOLD schedule given in Table 1 extends over the period from October 30, 1995, to January 13, 1996.The table shows the laser communications and associated Deep Space Network (DSN) satellite controltimes. The DSN begins satellite control 2 hours before the laser transmission times and ends 90 minutesafter laser transmission.
Table 1 shows the transmission times of the GOLD experiments. The experiment is broken intothree phases over the period from November 1995 to January 1996. Phase 1 is a beacon uplink with a1.024-Mbps downlink detection. The goals of this phase are to
(1) Complete integrated system testing
(2) Measure the uplink optical beam divergence at the satellite
(3) Evaluate the benefits of spatial diversity of the uplink beacon, i.e., single- and dual-beambeacon transmissions
(4) Determine the appropriate uplink power levels to maintain spacecraft closed-loop track-ing of the ground station
(5) Evaluate the spacecraft’s ability to point to the TMF ground station, and develop ap-propriate ground-station acquisition strategies
(6) Establish operations procedures for the phases discussed below
10
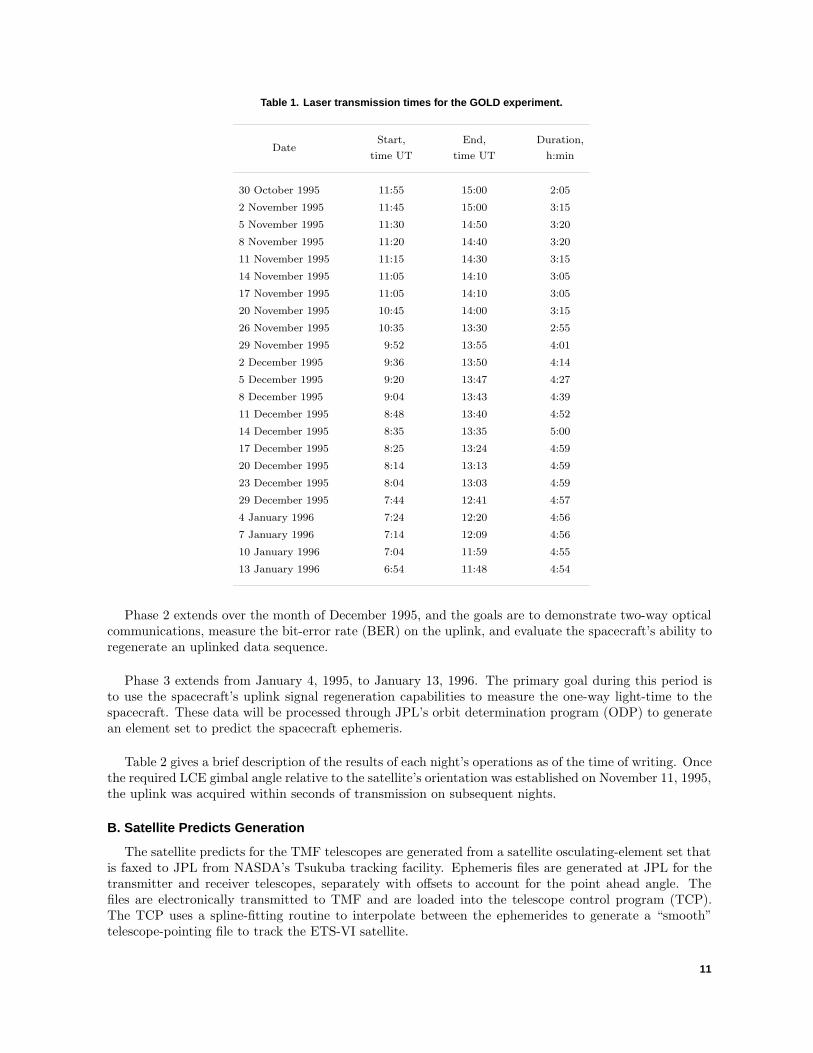
Table 1. Laser transmission times for the GOLD experiment.
Start, End, Duration,Date
time UT time UT h:min
30 October 1995 11:55 15:00 2:05
2 November 1995 11:45 15:00 3:15
5 November 1995 11:30 14:50 3:20
8 November 1995 11:20 14:40 3:20
11 November 1995 11:15 14:30 3:15
14 November 1995 11:05 14:10 3:05
17 November 1995 11:05 14:10 3:05
20 November 1995 10:45 14:00 3:15
26 November 1995 10:35 13:30 2:55
29 November 1995 9:52 13:55 4:01
2 December 1995 9:36 13:50 4:14
5 December 1995 9:20 13:47 4:27
8 December 1995 9:04 13:43 4:39
11 December 1995 8:48 13:40 4:52
14 December 1995 8:35 13:35 5:00
17 December 1995 8:25 13:24 4:59
20 December 1995 8:14 13:13 4:59
23 December 1995 8:04 13:03 4:59
29 December 1995 7:44 12:41 4:57
4 January 1996 7:24 12:20 4:56
7 January 1996 7:14 12:09 4:56
10 January 1996 7:04 11:59 4:55
13 January 1996 6:54 11:48 4:54
Phase 2 extends over the month of December 1995, and the goals are to demonstrate two-way opticalcommunications, measure the bit-error rate (BER) on the uplink, and evaluate the spacecraft’s ability toregenerate an uplinked data sequence.
Phase 3 extends from January 4, 1995, to January 13, 1996. The primary goal during this period isto use the spacecraft’s uplink signal regeneration capabilities to measure the one-way light-time to thespacecraft. These data will be processed through JPL’s orbit determination program (ODP) to generatean element set to predict the spacecraft ephemeris.
Table 2 gives a brief description of the results of each night’s operations as of the time of writing. Oncethe required LCE gimbal angle relative to the satellite’s orientation was established on November 11, 1995,the uplink was acquired within seconds of transmission on subsequent nights.
B. Satellite Predicts Generation
The satellite predicts for the TMF telescopes are generated from a satellite osculating-element set thatis faxed to JPL from NASDA’s Tsukuba tracking facility. Ephemeris files are generated at JPL for thetransmitter and receiver telescopes, separately with offsets to account for the point ahead angle. Thefiles are electronically transmitted to TMF and are loaded into the telescope control program (TCP).The TCP uses a spline-fitting routine to interpolate between the ephemerides to generate a “smooth”telescope-pointing file to track the ETS-VI satellite.
11
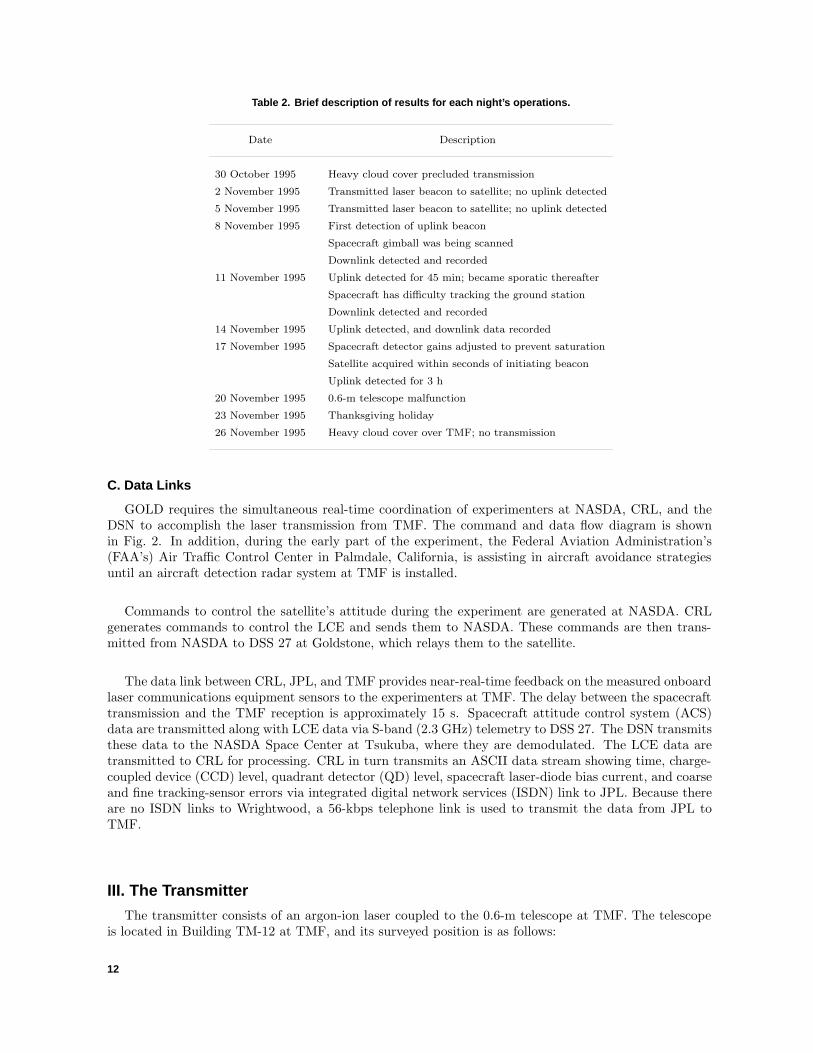
Table 2. Brief description of results for each night’s operations.
Date Description
30 October 1995 Heavy cloud cover precluded transmission
2 November 1995 Transmitted laser beacon to satellite; no uplink detected
5 November 1995 Transmitted laser beacon to satellite; no uplink detected
8 November 1995 First detection of uplink beacon
Spacecraft gimball was being scanned
Downlink detected and recorded
11 November 1995 Uplink detected for 45 min; became sporatic thereafter
Spacecraft has difficulty tracking the ground station
Downlink detected and recorded
14 November 1995 Uplink detected, and downlink data recorded
17 November 1995 Spacecraft detector gains adjusted to prevent saturation
Satellite acquired within seconds of initiating beacon
Uplink detected for 3 h
20 November 1995 0.6-m telescope malfunction
23 November 1995 Thanksgiving holiday
26 November 1995 Heavy cloud cover over TMF; no transmission
C. Data Links
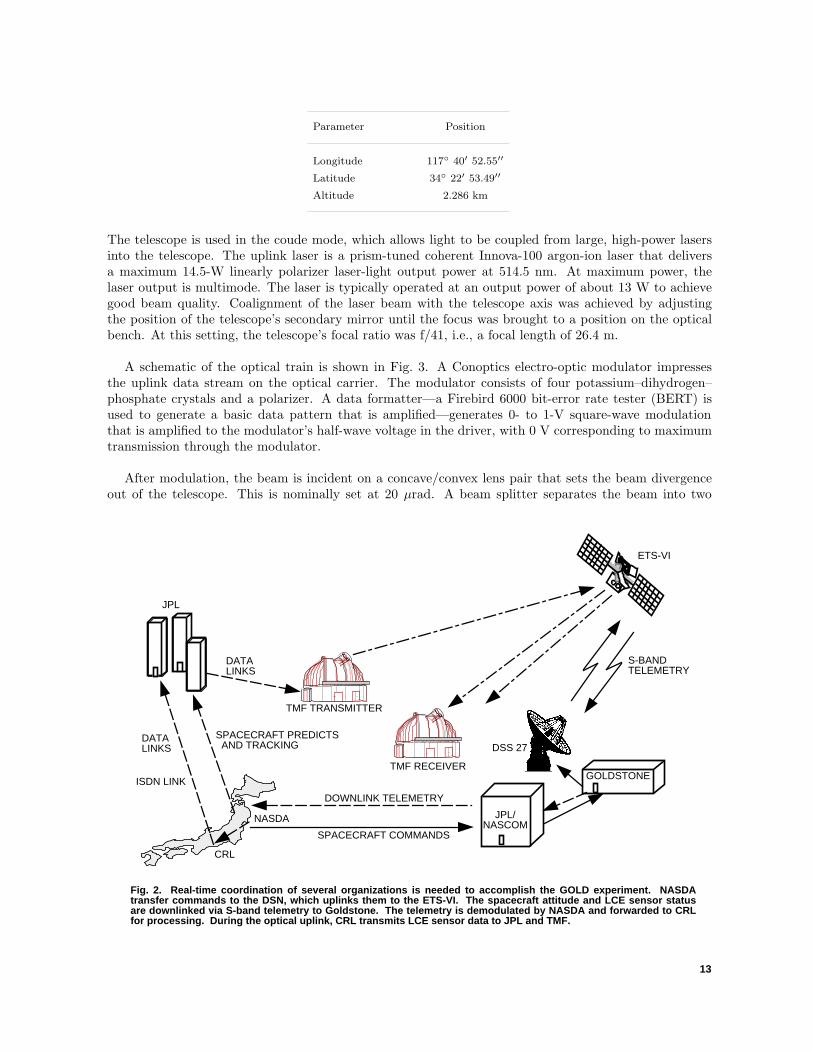
GOLD requires the simultaneous real-time coordination of experimenters at NASDA, CRL, and theDSN to accomplish the laser transmission from TMF. The command and data flow diagram is shownin Fig. 2. In addition, during the early part of the experiment, the Federal Aviation Administration’s(FAA’s) Air Traffic Control Center in Palmdale, California, is assisting in aircraft avoidance strategiesuntil an aircraft detection radar system at TMF is installed.
Commands to control the satellite’s attitude during the experiment are generated at NASDA. CRLgenerates commands to control the LCE and sends them to NASDA. These commands are then trans-mitted from NASDA to DSS 27 at Goldstone, which relays them to the satellite.
The data link between CRL, JPL, and TMF provides near-real-time feedback on the measured onboardlaser communications equipment sensors to the experimenters at TMF. The delay between the spacecrafttransmission and the TMF reception is approximately 15 s. Spacecraft attitude control system (ACS)data are transmitted along with LCE data via S-band (2.3 GHz) telemetry to DSS 27. The DSN transmitsthese data to the NASDA Space Center at Tsukuba, where they are demodulated. The LCE data aretransmitted to CRL for processing. CRL in turn transmits an ASCII data stream showing time, charge-coupled device (CCD) level, quadrant detector (QD) level, spacecraft laser-diode bias current, and coarseand fine tracking-sensor errors via integrated digital network services (ISDN) link to JPL. Because thereare no ISDN links to Wrightwood, a 56-kbps telephone link is used to transmit the data from JPL toTMF.
III. The Transmitter
The transmitter consists of an argon-ion laser coupled to the 0.6-m telescope at TMF. The telescopeis located in Building TM-12 at TMF, and its surveyed position is as follows:
12
Parameter Position
Longitude 117◦ 40′ 52.55′′
Latitude 34◦ 22′ 53.49′′
Altitude 2.286 km
The telescope is used in the coude mode, which allows light to be coupled from large, high-power lasersinto the telescope. The uplink laser is a prism-tuned coherent Innova-100 argon-ion laser that deliversa maximum 14.5-W linearly polarizer laser-light output power at 514.5 nm. At maximum power, thelaser output is multimode. The laser is typically operated at an output power of about 13 W to achievegood beam quality. Coalignment of the laser beam with the telescope axis was achieved by adjustingthe position of the telescope’s secondary mirror until the focus was brought to a position on the opticalbench. At this setting, the telescope’s focal ratio was f/41, i.e., a focal length of 26.4 m.
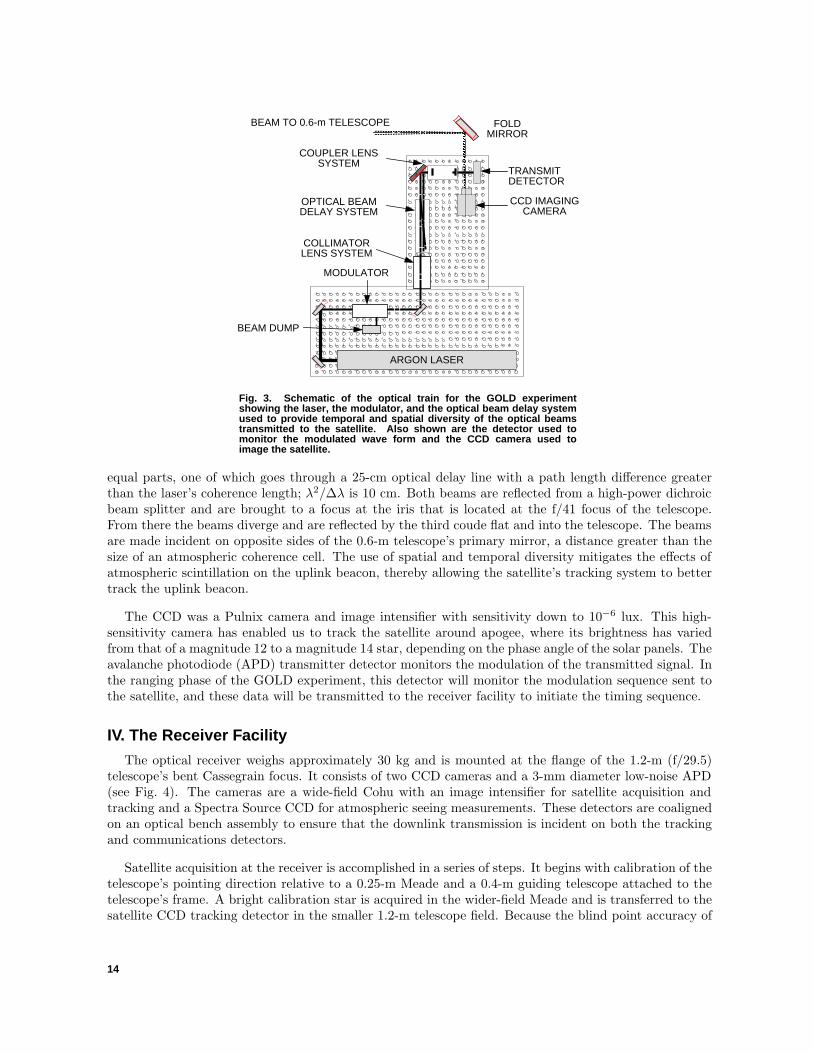
A schematic of the optical train is shown in Fig. 3. A Conoptics electro-optic modulator impressesthe uplink data stream on the optical carrier. The modulator consists of four potassium–dihydrogen–phosphate crystals and a polarizer. A data formatter—a Firebird 6000 bit-error rate tester (BERT) isused to generate a basic data pattern that is amplified—generates 0- to 1-V square-wave modulationthat is amplified to the modulator’s half-wave voltage in the driver, with 0 V corresponding to maximumtransmission through the modulator.
After modulation, the beam is incident on a concave/convex lens pair that sets the beam divergenceout of the telescope. This is nominally set at 20 µrad. A beam splitter separates the beam into two
NASDA
CRL
JPL
DATALINKS
ISDN LINK
SPACECRAFT PREDICTS AND TRACKING
DATALINKS
TMF TRANSMITTER
TMF RECEIVER
S-BANDTELEMETRY
ETS-VI
GOLDSTONE
JPL/NASCOM
Fig. 2. Real-time coordination of several organizations is needed to accomplish the GOLD experiment. NASDAtransfer commands to the DSN, which uplinks them to the ETS-VI. The spacecraft attitude and LCE sensor statusare downlinked via S-band telemetry to Goldstone. The telemetry is demodulated by NASDA and forwarded to CRLfor processing. During the optical uplink, CRL transmits LCE sensor data to JPL and TMF.
SPACECRAFT COMMANDS
DOWNLINK TELEMETRY
DSS 27
13
BEAM TO 0.6-m TELESCOPE FOLDMIRROR
CCD IMAGINGCAMERA
COUPLER LENSSYSTEM
MODULATOR
TRANSMITDETECTOR
OPTICAL BEAMDELAY SYSTEM
COLLIMATORLENS SYSTEM
BEAM DUMP
ARGON LASER
Fig. 3. Schematic of the optical train for the GOLD experimentshowing the laser, the modulator, and the optical beam delay systemused to provide temporal and spatial diversity of the optical beamstransmitted to the satellite. Also shown are the detector used tomonitor the modulated wave form and the CCD camera used toimage the satellite.
equal parts, one of which goes through a 25-cm optical delay line with a path length difference greaterthan the laser’s coherence length; λ2/∆λ is 10 cm. Both beams are reflected from a high-power dichroicbeam splitter and are brought to a focus at the iris that is located at the f/41 focus of the telescope.From there the beams diverge and are reflected by the third coude flat and into the telescope. The beamsare made incident on opposite sides of the 0.6-m telescope’s primary mirror, a distance greater than thesize of an atmospheric coherence cell. The use of spatial and temporal diversity mitigates the effects ofatmospheric scintillation on the uplink beacon, thereby allowing the satellite’s tracking system to bettertrack the uplink beacon.
The CCD was a Pulnix camera and image intensifier with sensitivity down to 10−6 lux. This high-sensitivity camera has enabled us to track the satellite around apogee, where its brightness has variedfrom that of a magnitude 12 to a magnitude 14 star, depending on the phase angle of the solar panels. Theavalanche photodiode (APD) transmitter detector monitors the modulation of the transmitted signal. Inthe ranging phase of the GOLD experiment, this detector will monitor the modulation sequence sent tothe satellite, and these data will be transmitted to the receiver facility to initiate the timing sequence.
IV. The Receiver Facility
The optical receiver weighs approximately 30 kg and is mounted at the flange of the 1.2-m (f/29.5)telescope’s bent Cassegrain focus. It consists of two CCD cameras and a 3-mm diameter low-noise APD(see Fig. 4). The cameras are a wide-field Cohu with an image intensifier for satellite acquisition andtracking and a Spectra Source CCD for atmospheric seeing measurements. These detectors are coalignedon an optical bench assembly to ensure that the downlink transmission is incident on both the trackingand communications detectors.
Satellite acquisition at the receiver is accomplished in a series of steps. It begins with calibration of thetelescope’s pointing direction relative to a 0.25-m Meade and a 0.4-m guiding telescope attached to thetelescope’s frame. A bright calibration star is acquired in the wider-field Meade and is transferred to thesatellite CCD tracking detector in the smaller 1.2-m telescope field. Because the blind point accuracy of
14
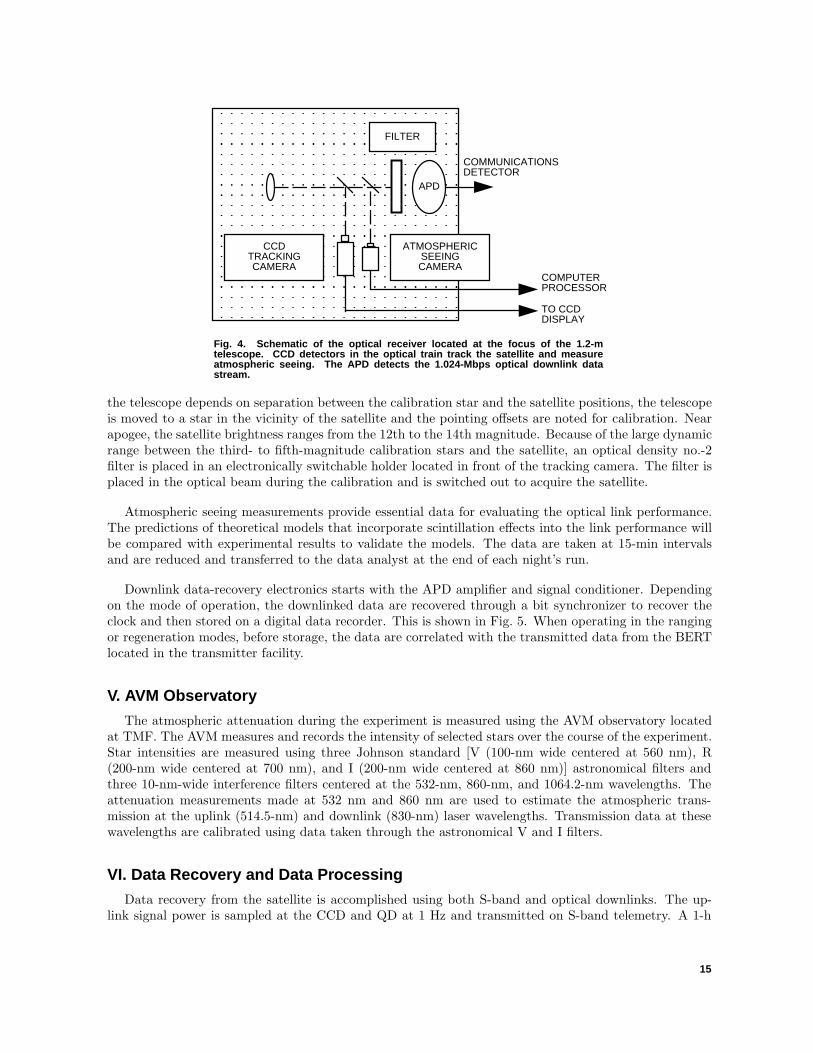
Fig. 4. Schematic of the optical receiver located at the focus of the 1.2-mtelescope. CCD detectors in the optical train track the satellite and measureatmospheric seeing. The APD detects the 1.024-Mbps optical downlink datastream.
FILTER
ATMOSPHERICSEEINGCAMERA
CCDTRACKINGCAMERA
APD
COMMUNICATIONSDETECTOR
COMPUTERPROCESSOR
TO CCDDISPLAY
the telescope depends on separation between the calibration star and the satellite positions, the telescopeis moved to a star in the vicinity of the satellite and the pointing offsets are noted for calibration. Nearapogee, the satellite brightness ranges from the 12th to the 14th magnitude. Because of the large dynamicrange between the third- to fifth-magnitude calibration stars and the satellite, an optical density no.-2filter is placed in an electronically switchable holder located in front of the tracking camera. The filter isplaced in the optical beam during the calibration and is switched out to acquire the satellite.
Atmospheric seeing measurements provide essential data for evaluating the optical link performance.The predictions of theoretical models that incorporate scintillation effects into the link performance willbe compared with experimental results to validate the models. The data are taken at 15-min intervalsand are reduced and transferred to the data analyst at the end of each night’s run.
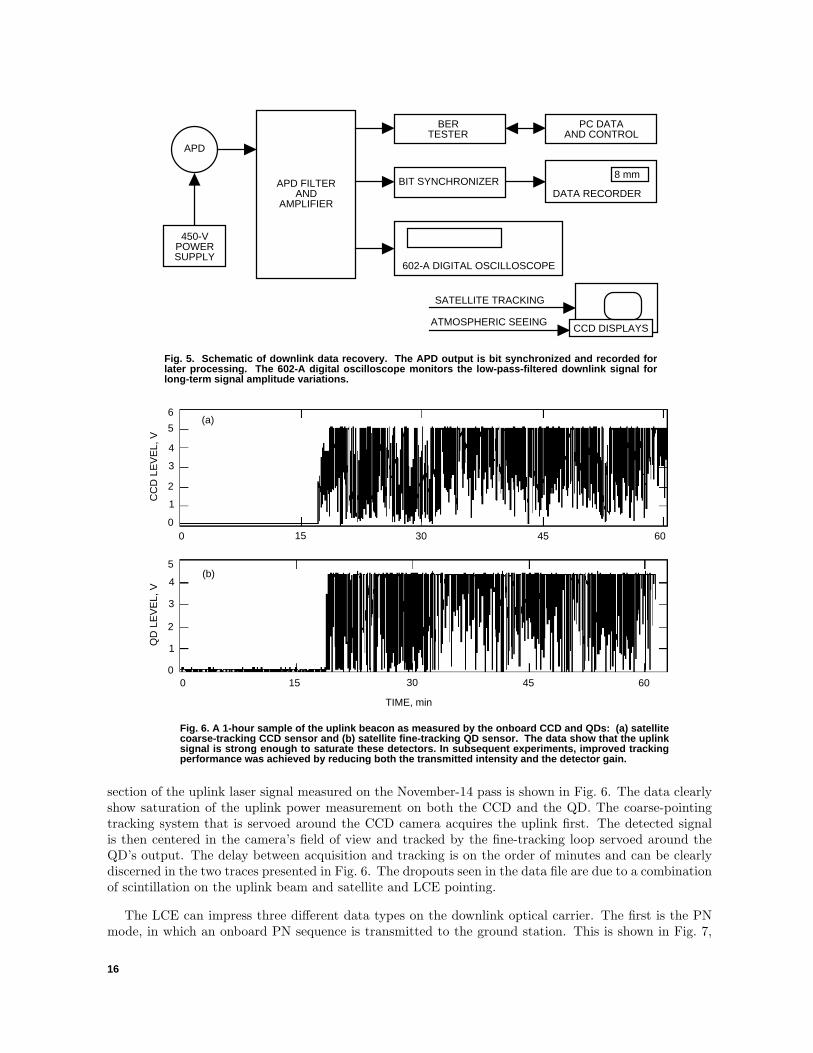
Downlink data-recovery electronics starts with the APD amplifier and signal conditioner. Dependingon the mode of operation, the downlinked data are recovered through a bit synchronizer to recover theclock and then stored on a digital data recorder. This is shown in Fig. 5. When operating in the rangingor regeneration modes, before storage, the data are correlated with the transmitted data from the BERTlocated in the transmitter facility.
V. AVM Observatory
The atmospheric attenuation during the experiment is measured using the AVM observatory locatedat TMF. The AVM measures and records the intensity of selected stars over the course of the experiment.Star intensities are measured using three Johnson standard [V (100-nm wide centered at 560 nm), R(200-nm wide centered at 700 nm), and I (200-nm wide centered at 860 nm)] astronomical filters andthree 10-nm-wide interference filters centered at the 532-nm, 860-nm, and 1064.2-nm wavelengths. Theattenuation measurements made at 532 nm and 860 nm are used to estimate the atmospheric trans-mission at the uplink (514.5-nm) and downlink (830-nm) laser wavelengths. Transmission data at thesewavelengths are calibrated using data taken through the astronomical V and I filters.
VI. Data Recovery and Data Processing
Data recovery from the satellite is accomplished using both S-band and optical downlinks. The up-link signal power is sampled at the CCD and QD at 1 Hz and transmitted on S-band telemetry. A 1-h
15
APD FILTERAND
AMPLIFIER
450-VPOWERSUPPLY
APD
BERTESTER
BIT SYNCHRONIZER
602-A DIGITAL OSCILLOSCOPE
PC DATAAND CONTROL
DATA RECORDER
8 mm
CCD DISPLAYS
SATELLITE TRACKING
ATMOSPHERIC SEEING
Fig. 5. Schematic of downlink data recovery. The APD output is bit synchronized and recorded forlater processing. The 602-A digital oscilloscope monitors the low-pass-filtered downlink signal forlong-term signal amplitude variations.
0
1
2
3
4
5
0 15 30 45 60
TIME, min
Fig. 6. A 1-hour sample of the uplink beacon as measured by the onboard CCD and QDs: (a) satellitecoarse-tracking CCD sensor and (b) satellite fine-tracking QD sensor. The data show that the uplinksignal is strong enough to saturate these detectors. In subsequent experiments, improved trackingperformance was achieved by reducing both the transmitted intensity and the detector gain.
QD
LE
VE
L, V
(b)
0
1
2
3
4
5
6
CC
D L
EV
EL,
V
0 15 30 45 60
(a)
section of the uplink laser signal measured on the November-14 pass is shown in Fig. 6. The data clearlyshow saturation of the uplink power measurement on both the CCD and the QD. The coarse-pointingtracking system that is servoed around the CCD camera acquires the uplink first. The detected signalis then centered in the camera’s field of view and tracked by the fine-tracking loop servoed around theQD’s output. The delay between acquisition and tracking is on the order of minutes and can be clearlydiscerned in the two traces presented in Fig. 6. The dropouts seen in the data file are due to a combinationof scintillation on the uplink beam and satellite and LCE pointing.
The LCE can impress three different data types on the downlink optical carrier. The first is the PNmode, in which an onboard PN sequence is transmitted to the ground station. This is shown in Fig. 7,
16
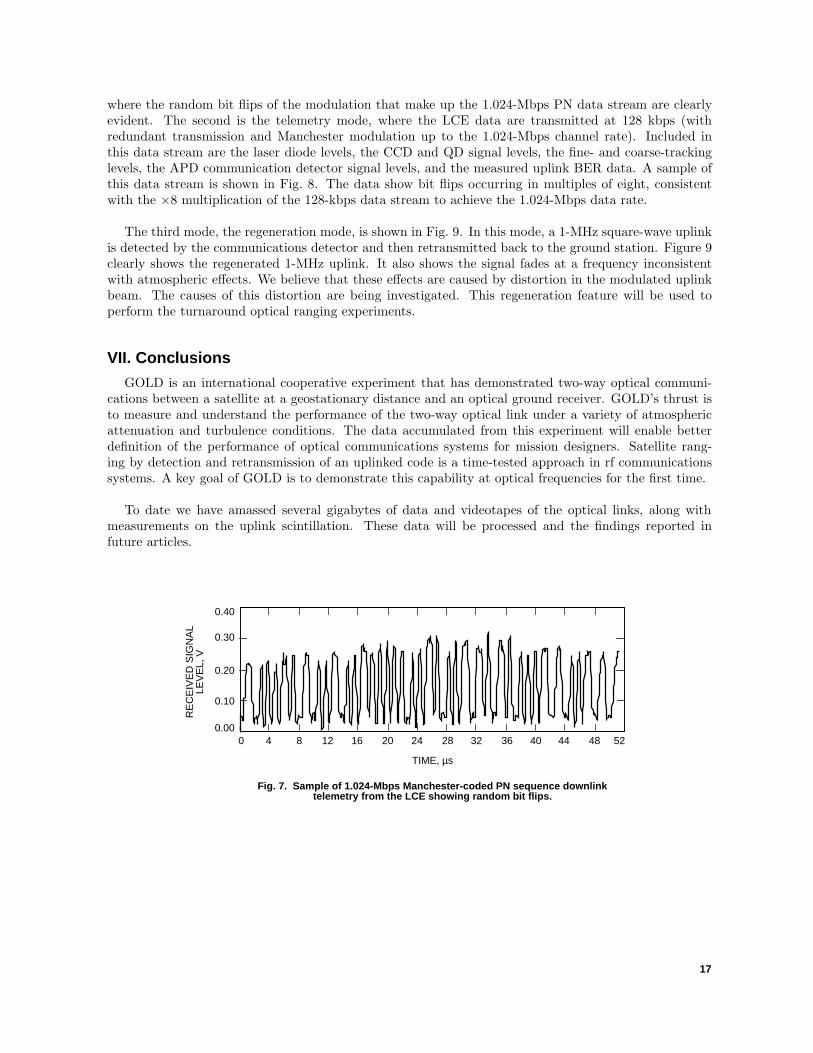
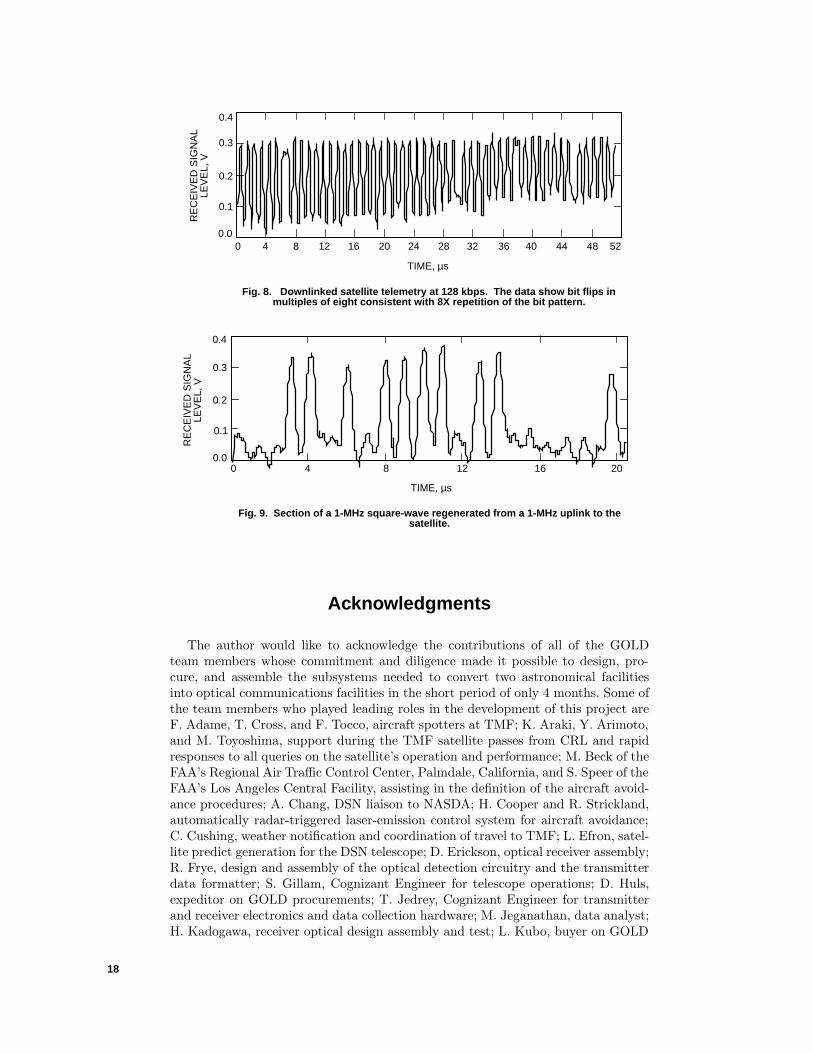
where the random bit flips of the modulation that make up the 1.024-Mbps PN data stream are clearlyevident. The second is the telemetry mode, where the LCE data are transmitted at 128 kbps (withredundant transmission and Manchester modulation up to the 1.024-Mbps channel rate). Included inthis data stream are the laser diode levels, the CCD and QD signal levels, the fine- and coarse-trackinglevels, the APD communication detector signal levels, and the measured uplink BER data. A sample ofthis data stream is shown in Fig. 8. The data show bit flips occurring in multiples of eight, consistentwith the ×8 multiplication of the 128-kbps data stream to achieve the 1.024-Mbps data rate.
The third mode, the regeneration mode, is shown in Fig. 9. In this mode, a 1-MHz square-wave uplinkis detected by the communications detector and then retransmitted back to the ground station. Figure 9clearly shows the regenerated 1-MHz uplink. It also shows the signal fades at a frequency inconsistentwith atmospheric effects. We believe that these effects are caused by distortion in the modulated uplinkbeam. The causes of this distortion are being investigated. This regeneration feature will be used toperform the turnaround optical ranging experiments.
VII. Conclusions
GOLD is an international cooperative experiment that has demonstrated two-way optical communi-cations between a satellite at a geostationary distance and an optical ground receiver. GOLD’s thrust isto measure and understand the performance of the two-way optical link under a variety of atmosphericattenuation and turbulence conditions. The data accumulated from this experiment will enable betterdefinition of the performance of optical communications systems for mission designers. Satellite rang-ing by detection and retransmission of an uplinked code is a time-tested approach in rf communicationssystems. A key goal of GOLD is to demonstrate this capability at optical frequencies for the first time.
To date we have amassed several gigabytes of data and videotapes of the optical links, along withmeasurements on the uplink scintillation. These data will be processed and the findings reported infuture articles.
RE
CE
IVE
D S
IGN
AL
LEV
EL,
V
0.00
0.10
0.20
0.30
0.40
0 4 8 12 16 20 24 28 32 36 40 44 48 52
TIME, µs
Fig. 7. Sample of 1.024-Mbps Manchester-coded PN sequence downlinktelemetry from the LCE showing random bit flips.
17
RE
CE
IVE
D S
IGN
AL
LEV
EL,
V
0.0
0.1
0.2
0.3
0.4
0 4 8 12 16 20 24 28 32 36 40 44 48 52
TIME, µs
Fig. 8. Downlinked satellite telemetry at 128 kbps. The data show bit flips inmultiples of eight consistent with 8X repetition of the bit pattern.
RE
CE
IVE
D S
IGN
AL
LEV
EL,
V
0.0
0.1
0.2
0.3
0.4
0 4 8 12 16 20
TIME, µs
Fig. 9. Section of a 1-MHz square-wave regenerated from a 1-MHz uplink to thesatellite.
Acknowledgments
The author would like to acknowledge the contributions of all of the GOLDteam members whose commitment and diligence made it possible to design, pro-cure, and assemble the subsystems needed to convert two astronomical facilitiesinto optical communications facilities in the short period of only 4 months. Some ofthe team members who played leading roles in the development of this project areF. Adame, T. Cross, and F. Tocco, aircraft spotters at TMF; K. Araki, Y. Arimoto,and M. Toyoshima, support during the TMF satellite passes from CRL and rapidresponses to all queries on the satellite’s operation and performance; M. Beck of theFAA’s Regional Air Traffic Control Center, Palmdale, California, and S. Speer of theFAA’s Los Angeles Central Facility, assisting in the definition of the aircraft avoid-ance procedures; A. Chang, DSN liaison to NASDA; H. Cooper and R. Strickland,automatically radar-triggered laser-emission control system for aircraft avoidance;C. Cushing, weather notification and coordination of travel to TMF; L. Efron, satel-lite predict generation for the DSN telescope; D. Erickson, optical receiver assembly;R. Frye, design and assembly of the optical detection circuitry and the transmitterdata formatter; S. Gillam, Cognizant Engineer for telescope operations; D. Huls,expeditor on GOLD procurements; T. Jedrey, Cognizant Engineer for transmitterand receiver electronics and data collection hardware; M. Jeganathan, data analyst;H. Kadogawa, receiver optical design assembly and test; L. Kubo, buyer on GOLD
18
procurements; J. Lesh, Principal Investigator, technical guidance and assistance indata analysis and real-time operation of the TMF-to-CRL data links; K. Masters,argon-ion laser operations; D. Mayes, receiver telescope operation; P. Moynihan,Cognizant Engineer for receiver and transmitter optical-train assemblies and GOLDoperations safety; M. Ohkwara, NASDA satellite control; W. Owen, satellite predictgeneration for the TMF telescope; N. Page, transmitter optical design, assembly,test, and operation; D. Sidwell, TMF facility upgrade for GOLD; L. Voisinet andT. Trahn, design, assembly, and test of CRL/JPL/TMF data links; S. Waldherr,DSN scheduling support; and J. Young, transmitter telescope operations. The au-thor would also like to thank Dr. C. Edwards of the TMOD Advanced TechnologyProgram Office for securing funding for this experiment.
19