Embed Size (px)
Citation preview
Open Environmental Sciences, 2012, 6, 13-19 13
1876-3251/12 2012 Bentham Open
Open Access
An Overview of the Air Pollution Trend in Klang Valley, Malaysia
Ahmad Makmom Abdullah*, Mohd Armi Abu Samah and Tham Yee Jun
Department of Environmental Science, Faculty of Environmental Studies, Universiti Putra Malaysia, 43400 Serdang,
Selangor, Malaysia
Abstract: The recent air pollution trend, as well as the factors that contribute to the air quality, were reviewed in the
Klang Valley since it has undergone rapid development over the years. The overall quality of air in the Klang Valley was
moderate for 66% of the days throughout the year of 2009 while only 5% of the days were classified at the unhealthy
level. Shah Alam and Kuala Lumpur were among the cities that recorded the highest number of unhealthy days from
2001-2009. Furthermore, places around the Klang Valley suffered from quite severe acidified rain, which indicates that
heavy air pollution is still occurringin areas around the Lang Valley. Factors like urbanization, industry, motor vehicles
and forest fires remain the main contributors to the deterioration of air quality in the Klang Valley. Hence, a more
sustainable policy has to be introduced by the government in order to tackle the air pollution issue.
Keywords: Air pollution, Klang Valley, air quality, acidified rain and urbanization.
INTRODUCTION
The KlangValley is one of the main economic zones in Malaysia. It consists of Kuala Lumpur, Putrajaya, and adjoining cities and towns in the State of Selangor, such as Petaling Jaya, Shah Alam, Klang, Gombak, Hulu Langat and Sepang, which had a population of around 3.98 million in the year of 2000 (Katiman [1]). The rapid transformation of the Klang Valley into a wide urban region during the last decade of the twentieth century has contributed to many of the environmental issues, particularly air pollution. Fig. (1) shows a map of the Klang Valley in Malaysia.
Air pollution can be caused by various sources, such as factories, power plants, dry cleaners, vehicles and even windblown dust and wildfires. Afroz et al. [2] reported that for the past five years the three major sources of air pollution in Malaysia are mobile sources (c.a. 70-75% of total air pollution), stationary sources (c.a. 20-25%), and open burning sources (c.a. 3-5%). This was proven by the high emission of unburnt hydrocarbons from motor vehicles and other oil and gas related works, and the emission of SO2 due to high sulphur fuel dependency for industrial production and electric power generation, which were found in the Klang Valley and other places in Malaysia (Awang et al. [3]). Other sources of pollutants included dust and fine particulate, which were contributed by the inefficiency of diesel-powered vehicles and also the smoke aerosol from fires on Peninsular Malaysia, which contributed to the development of haze in the Klang Valley (Keywood et al. [4]; Awang et al. [3]). Meteorological aspects like wind profile, temperature, atmospheric pressure, and others also contribute to air pollution, such as the transformation of emissions into photochemical smog, mixing of the pollutants, acid rain and many more. Although the higher
*Address correspondence to this author at the Department of Environmental
Science, Faculty of Environmental Studies, Universiti Putra Malaysia,
43400 Serdang, Selangor, Malaysia; Tel: 603-89466759;
Fax: 603-89466768; E-mail: [email protected]
phytotoxic risk was found especially in the southern part of the Klang Valley, the risk in the northern part could not be ruled out due to local prevailing winds, which were found to play a significant role. Not only is the health of human beings, animals and vegetation being threatened, but air pollution also contributes to the damage of the ozone layer, urban heating, acid rain, and buildings as well. Basically, the problems with urban air quality management in the Klang Valley include:
• Multiple sources of information, ranging from census data compiled every few years to continuous online monitoring systems;
• Arange of scales in space and time from street canyons to metropolitan areas, from short-term episodes to annual averages;
• Distributed (and mobile) emission sources with pronounced temporal patterns that include industry, households, and traffic;
• Direct regulatory and indirect economic control on emission sources, involving complex human behaviour; and
• Multiple objectives and criteria for the different actors and the regulatory framework.
This obviously defines a rather complex problem domain, which also includes a broad range of actors, stakeholders and audiences in the decision and policy making process. With the shift from more or less authoritarian and technocratic to participatory decision models that characterize the political evolution of the last few decades, technical and scientific information, and the free and open access to this information, has become an important element in the political process. Consequently, information technology plays an increasingly important role where technical and scientific issues are involved, as is certainly the case in urban environmental management (Fedra [5]). Therefore, this paper discusses the current air

14 Open Environmental Sciences, 2012, Volume 6 Abdullah et al.
pollution trend in the Klang Valley as well as the factors that contributed to the air quality.
AIR QUALITY IN THE KLANG VALLEY
The overall quality of air in the Klang Valley is determined by the Air Pollution Index (API). This API system closely follows the Pollutant Standard Index (PSI) of the United States Environmental Protection Agency (USEPA) and is mainly based on five major pollutants (PM10, SO2, NO2, CO, and O3) in the ambient air. Hourly values for PM10 and SO2 are averaged over a 24-hour running period, with an 8-hour period for CO, while O3 and NOx are read hourly before an hourly index is calculated with the use of sub-index functions for each pollutant. Then,
the highest index value recorded is then taken as the API for the hour (DOE [6]).
API = Max {sub-indices of all five air pollutants} (1)
According to the DOE ([7]), the air quality in the Klang Valley (based on API) was moderate for 66% of the days throughout the year of 2009 while only 5% of the days are classified at the unhealthy level, as shown in Fig. (2). While Putrajaya, Kuala Selangor and Batu Muda are considered to have good air quality as these places have 124, 174 and 127 number of days classified as good, respectively. None of the days in 2009was recorded as very unhealthy and hazardous in the Klang Valley.
Fig. (1). Map of the Klang Valley.
* Base on data for364 days.
** Base on data for362 days.
Fig. (2). Air Quality for the Klang Valley Status in 2009 based on API. (Data source: DOE [7]).
Sources: bahasa-malaysia-simple-fun.com Source:planetoft...gspot.com/201009/jpbd-unex...pion.html
0
50
100
150
200
250
300
350
Num
ber o
f Days
0
0
0
0
0
0
0
0
Hazardous (
Very Unhea
Unhealthy (
Modeate (5
Good (0‐50)
(>300)
althy (201‐300)
(101‐200)
51‐100)
)
)
An Overview of the Air Pollution Trend in Klang Valley, Malaysia Open Environmental Sciences, 2012, Volume 6 15
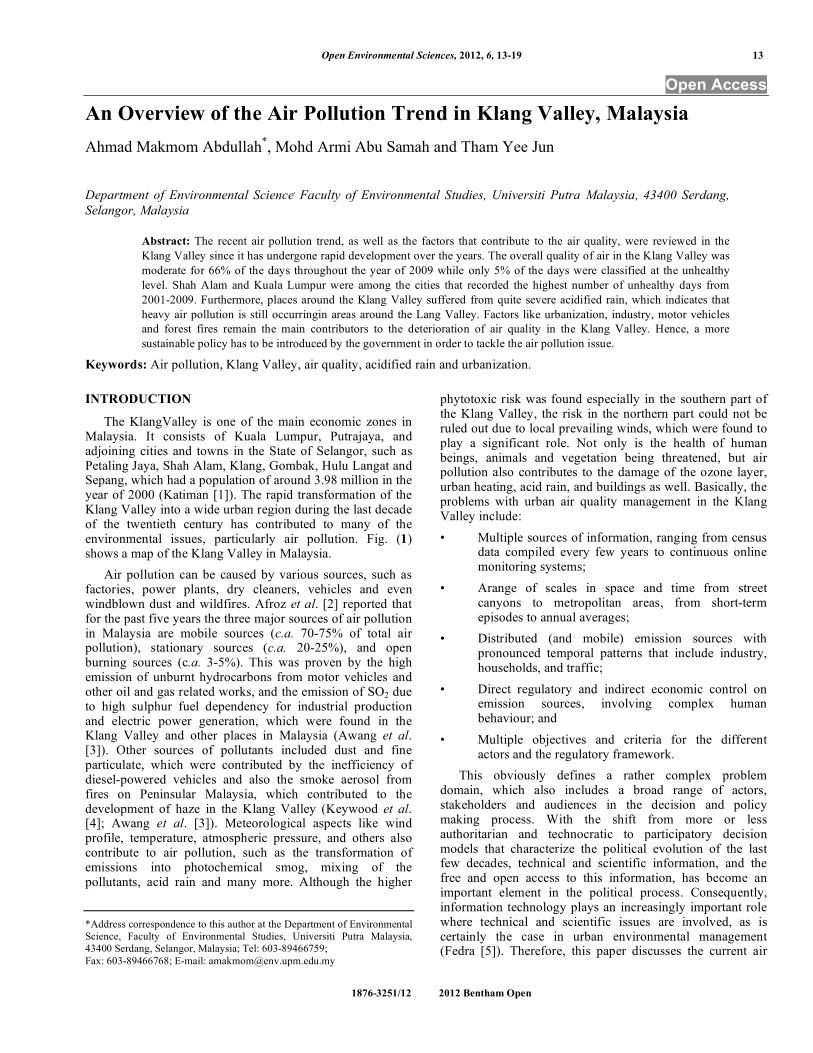
Table 1 shows the comparison of the number of unhealthy days between the main cities of the Klang Valley from 2001 to 2009. Shah Alam and Kuala Lumpur were among the cities that recorded the highest number of unhealthy days from 2001-2009. These unhealthy days recorded may be due to the high traffic volumes in those areas, which led to the formation of ground level ozone, as shown Fig. (3) where some of the days in year 2009 exceeded the Malaysian Ambient Air Quality Guideline (MAAQG). Although air quality in areas like Petaling Jaya and Kuala Selangor have shown a great improvement in the last two to three years with a low number of unhealthy days recorded, in 2009 the number of unhealthy days increased. The dry spell (effects of El-nino in this region) during June to August 2009, which resulted in a short spell of haze, might have contributed to the increment of unhealthy days in 2009.
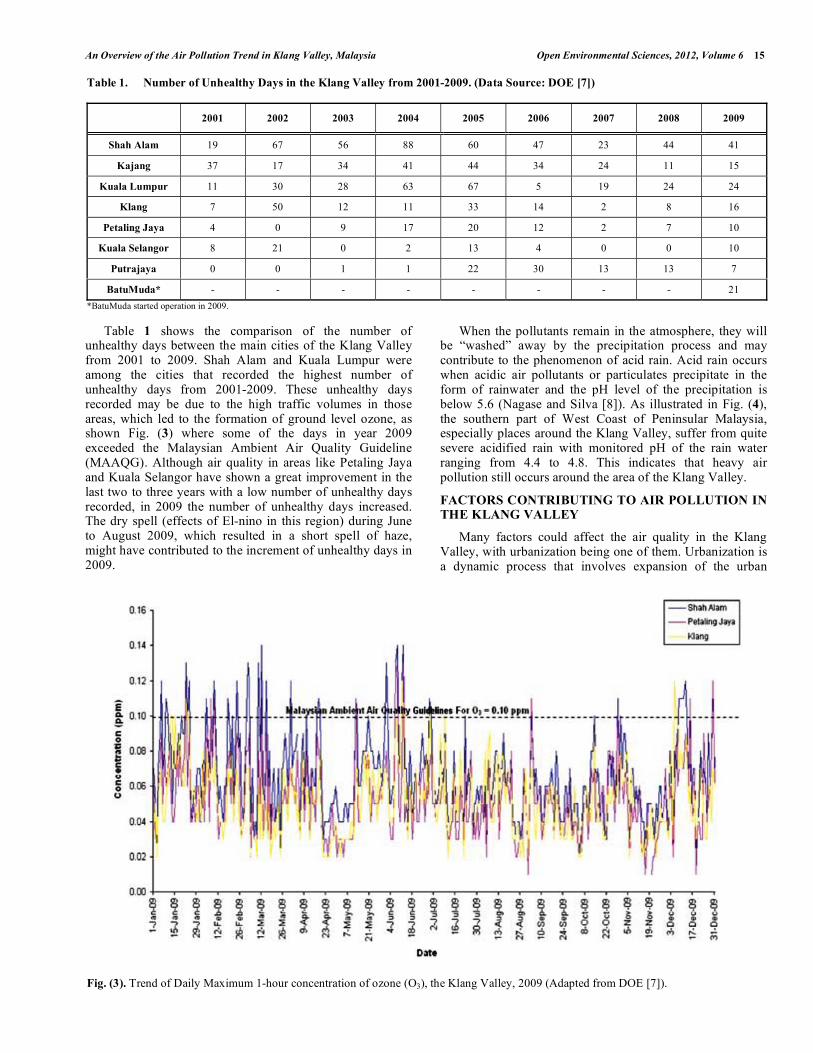
When the pollutants remain in the atmosphere, they will be “washed” away by the precipitation process and may contribute to the phenomenon of acid rain. Acid rain occurs when acidic air pollutants or particulates precipitate in the form of rainwater and the pH level of the precipitation is below 5.6 (Nagase and Silva [8]). As illustrated in Fig. (4), the southern part of West Coast of Peninsular Malaysia, especially places around the Klang Valley, suffer from quite severe acidified rain with monitored pH of the rain water ranging from 4.4 to 4.8. This indicates that heavy air pollution still occurs around the area of the Klang Valley.
FACTORS CONTRIBUTING TO AIR POLLUTION IN THE KLANG VALLEY
Many factors could affect the air quality in the Klang Valley, with urbanization being one of them. Urbanization is a dynamic process that involves expansion of the urban
Table 1. Number of Unhealthy Days in the Klang Valley from 2001-2009. (Data Source: DOE [7])
2001 2002 2003 2004 2005 2006 2007 2008 2009
Shah Alam 19 67 56 88 60 47 23 44 41
Kajang 37 17 34 41 44 34 24 11 15
Kuala Lumpur 11 30 28 63 67 5 19 24 24
Klang 7 50 12 11 33 14 2 8 16
Petaling Jaya 4 0 9 17 20 12 2 7 10
Kuala Selangor 8 21 0 2 13 4 0 0 10
Putrajaya 0 0 1 1 22 30 13 13 7
BatuMuda* - - - - - - - - 21
*BatuMuda started operation in 2009.
Fig. (3). Trend of Daily Maximum 1-hour concentration of ozone (O3), the Klang Valley, 2009 (Adapted from DOE [7]).
16 Open Environmental Sciences, 2012, Volume 6 Abdullah et al.
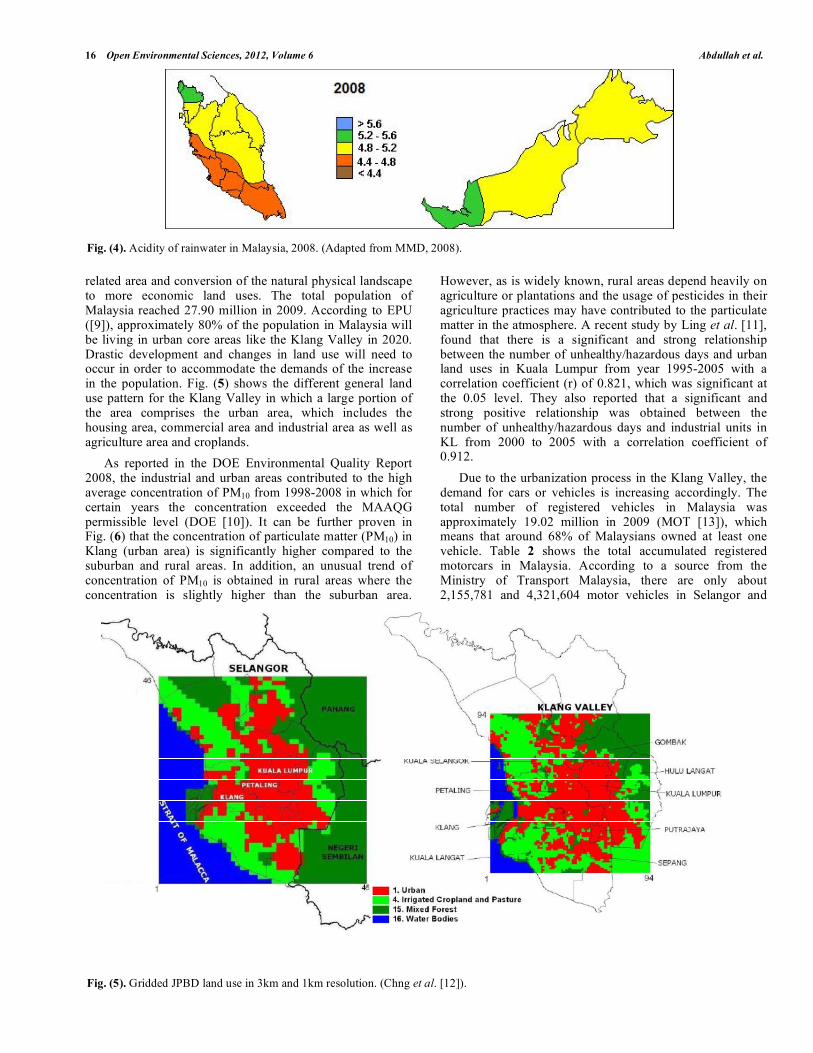
related area and conversion of the natural physical landscape to more economic land uses. The total population of Malaysia reached 27.90 million in 2009. According to EPU ([9]), approximately 80% of the population in Malaysia will be living in urban core areas like the Klang Valley in 2020. Drastic development and changes in land use will need to occur in order to accommodate the demands of the increase in the population. Fig. (5) shows the different general land use pattern for the Klang Valley in which a large portion of the area comprises the urban area, which includes the housing area, commercial area and industrial area as well as agriculture area and croplands.
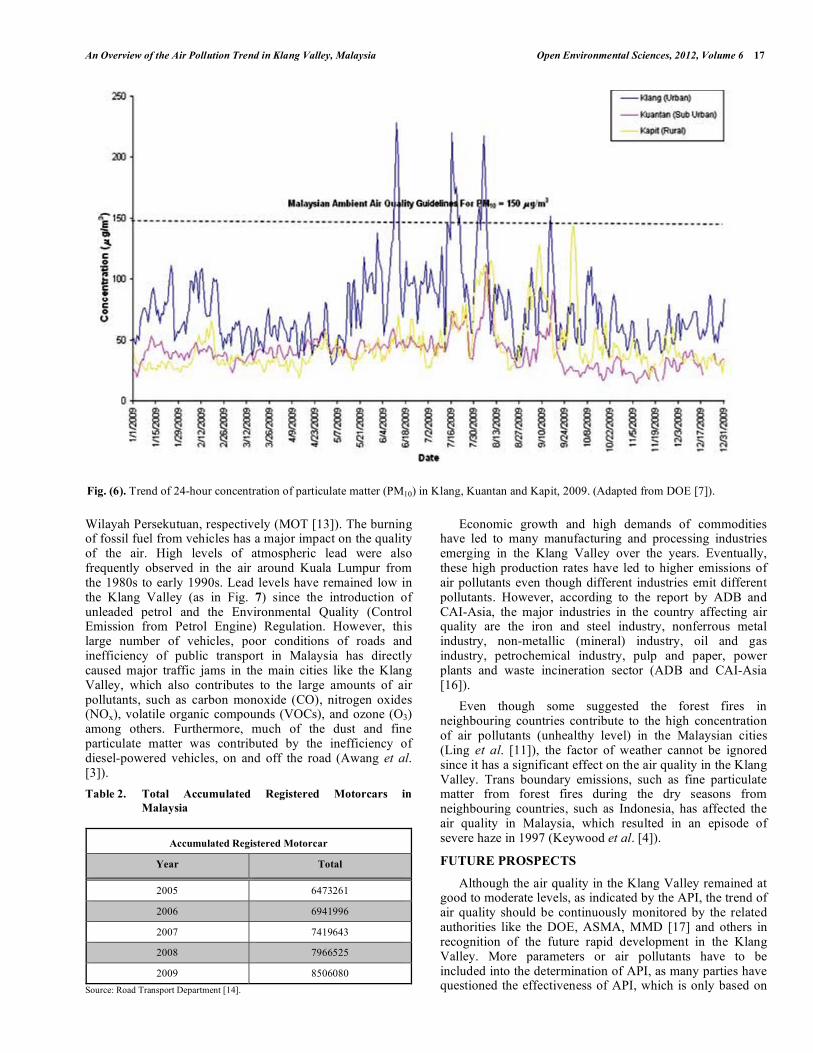
As reported in the DOE Environmental Quality Report 2008, the industrial and urban areas contributed to the high average concentration of PM10 from 1998-2008 in which for certain years the concentration exceeded the MAAQG permissible level (DOE [10]). It can be further proven in Fig. (6) that the concentration of particulate matter (PM10) in Klang (urban area) is significantly higher compared to the suburban and rural areas. In addition, an unusual trend of concentration of PM10 is obtained in rural areas where the concentration is slightly higher than the suburban area.
However, as is widely known, rural areas depend heavily on agriculture or plantations and the usage of pesticides in their agriculture practices may have contributed to the particulate matter in the atmosphere. A recent study by Ling et al. [11], found that there is a significant and strong relationship between the number of unhealthy/hazardous days and urban land uses in Kuala Lumpur from year 1995-2005 with a correlation coefficient (r) of 0.821, which was significant at the 0.05 level. They also reported that a significant and strong positive relationship was obtained between the number of unhealthy/hazardous days and industrial units in KL from 2000 to 2005 with a correlation coefficient of 0.912.
Due to the urbanization process in the Klang Valley, the demand for cars or vehicles is increasing accordingly. The total number of registered vehicles in Malaysia was approximately 19.02 million in 2009 (MOT [13]), which means that around 68% of Malaysians owned at least one vehicle. Table 2 shows the total accumulated registered motorcars in Malaysia. According to a source from the Ministry of Transport Malaysia, there are only about 2,155,781 and 4,321,604 motor vehicles in Selangor and
Fig. (4). Acidity of rainwater in Malaysia, 2008. (Adapted from MMD, 2008).
Fig. (5). Gridded JPBD land use in 3km and 1km resolution. (Chng et al. [12]).
An Overview of the Air Pollution Trend in Klang Valley, Malaysia Open Environmental Sciences, 2012, Volume 6 17
Wilayah Persekutuan, respectively (MOT [13]). The burning of fossil fuel from vehicles has a major impact on the quality of the air. High levels of atmospheric lead were also frequently observed in the air around Kuala Lumpur from the 1980s to early 1990s. Lead levels have remained low in the Klang Valley (as in Fig. 7) since the introduction of unleaded petrol and the Environmental Quality (Control Emission from Petrol Engine) Regulation. However, this large number of vehicles, poor conditions of roads and inefficiency of public transport in Malaysia has directly caused major traffic jams in the main cities like the Klang Valley, which also contributes to the large amounts of air pollutants, such as carbon monoxide (CO), nitrogen oxides (NOx), volatile organic compounds (VOCs), and ozone (O3) among others. Furthermore, much of the dust and fine particulate matter was contributed by the inefficiency of diesel-powered vehicles, on and off the road (Awang et al. [3]).
Table 2. Total Accumulated Registered Motorcars in
Malaysia
Accumulated Registered Motorcar
Year Total
2005 6473261
2006 6941996
2007 7419643
2008 7966525
2009 8506080
Source: Road Transport Department [14].
Economic growth and high demands of commodities have led to many manufacturing and processing industries emerging in the Klang Valley over the years. Eventually, these high production rates have led to higher emissions of air pollutants even though different industries emit different pollutants. However, according to the report by ADB and CAI-Asia, the major industries in the country affecting air quality are the iron and steel industry, nonferrous metal industry, non-metallic (mineral) industry, oil and gas industry, petrochemical industry, pulp and paper, power plants and waste incineration sector (ADB and CAI-Asia [16]).
Even though some suggested the forest fires in neighbouring countries contribute to the high concentration of air pollutants (unhealthy level) in the Malaysian cities (Ling et al. [11]), the factor of weather cannot be ignored since it has a significant effect on the air quality in the Klang Valley. Trans boundary emissions, such as fine particulate matter from forest fires during the dry seasons from neighbouring countries, such as Indonesia, has affected the air quality in Malaysia, which resulted in an episode of severe haze in 1997 (Keywood et al. [4]).
FUTURE PROSPECTS
Although the air quality in the Klang Valley remained at good to moderate levels, as indicated by the API, the trend of air quality should be continuously monitored by the related authorities like the DOE, ASMA, MMD [17] and others in recognition of the future rapid development in the Klang Valley. More parameters or air pollutants have to be included into the determination of API, as many parties have questioned the effectiveness of API, which is only based on
Fig. (6). Trend of 24-hour concentration of particulate matter (PM10) in Klang, Kuantan and Kapit, 2009. (Adapted from DOE [7]).

18 Open Environmental Sciences, 2012, Volume 6 Abdullah et al.
a few parameters in the atmosphere. This will remain as the future challenge as the people will demand for a better assessment and stricter law or enforcement.
The Malaysian government plays a very important role in addressing the issues of air pollution. The good news is that the Malaysian government has already foreseen the importance of managing and tackling the air pollution problems in the country, as these issues have been stated in the two recent Malaysia Plans (RMK). Different approaches have been listed in the 9
th and 10
th Malaysia Plan. In the 9
th
Malaysia Plan, a new Clean Air Action Plan will be developed and implemented to improve air quality. Detailed studies will be undertaken to formulate action plans to improve the air quality in urban areas. The emission of air pollutants from stationary sources will be addressed by promoting the use of cleaner technologies. The sulphur content in diesel and petrol will be reduced from 3,000 ppm to 500 ppm and from 1,500 ppm to 500 ppm, respectively, with the adoption of EURO 2M specifications. New emission standards based on EURO 2 for diesel vehicles and EURO 3 for petrol vehicles will also be introduced to reduce the emission of air pollutants from mobile sources. In addition, the capacity and ability to fight peat swamp fires, a domestic source of haze, will be strengthened (EPU [18]). In the most recent RMK10, the government stated that they will introduce initiatives to address climate change through the adoption of strategies to protect economic growth and development factors from the impact of climate change as well as mitigation strategies to reduce the emission of greenhouse gases (EPU [9]).
However, there were instances of air quality deterioration in the Klang Valley, Selangor and some other places in Malaysia due to the increased concentration of ambient ozone levels and particulate matter from motor vehicles, industries and open burning activities, as well as sulphur dioxide from industrial activities. The government should
also improve the public transportation and increase the coverage of the public transport besides removing the entire group of old vehicles (15-20 years old) from the road as their emissions do not meet the EURO2 or 3 standards and keep polluting the environment. However, the challenge still remains for the government concerning how to promote the use of greener technologies as all of these strategies involve a huge amount of funding.
ACKNOWLEDGEMENT
The authors appreciate the Malaysia Department of Environment for their provision of air pollution data.
CONFLICT OF INTEREST
Authors confirm that this article content has no conflict of interest.
REFERENCES
[1] Katiman R. Perbandaran dan perkembangan wilayah metropolitan
lanjutan lembah Klang-Langat, Malaysia. J Sains dan Kemanusiaan 2006; 1: 1-27.
[2] Afroz R, Hassan MN, Ibrahim NA. Review of air pollution and health impacts in Malaysia. Environ Res 2003; 92: 71-7.
[3] Awang MB, Jaafar AB, Abdullah AM, et al. Air quality in Malaysia: impacts, management issues and future challenges.
Respirology 2000; 5: 183-96. [4] Keywood MD, Ayers GP, Gras JL, Boers R, Leong CP. Haze in the
Klang Valley of Malaysia. Atmos Chem Phys 2003; 3: 615-53. [5] Fedra K. Model-based decision support for integrated urban air
quality management. In: Longhurst JW, Elsom DM, Power H, Eds. Air quality management. Southampton: WIT Press 2000; pp. 243-
60. [6] DOE. Air Pollutant Index 2010. Available from: http://www.doe.
gov.my/portal/air-air-quality/air-pollutant-index-api/ [Accessed on: 28th September 2011].
[7] DOE. Chapter 1: Air. Environmental quality report 2009. Malaysia: Department of Environment, Ministry of Nature Resources and
Environment 2009. [8] Nagase Y, Silva ECD. Acid rain in China and Japan: a game-
theoretic analysis. Reg Sci Urban Econ 2007; 37(1): 100-20.
*Data not available for DBKL in 1996.
Fig. (7). Ambient lead concentration in the Klang Valley, 1988-2007. (Data Source: DOE [15]).
Introduction of Unleaded Petrol (1991)

An Overview of the Air Pollution Trend in Klang Valley, Malaysia Open Environmental Sciences, 2012, Volume 6 19
[9] EPU (Economic Planning Unit), 2010. 10th Malaysian Plan.
Available from: http://www.epu.gov.my/html/themes/epu/html/RM KE10/img/pdf/en/chapt6.pdf . [Accessed on: 10th November 2010].
[10] DOE. Air quality. Environmental Quality Report 2008. Malaysia: Department of Environment, Ministry of Nature Resources and
Environment. 2008. [11] Ling OHL, Ting KH, Shaharuddin A, Kadaruddin A, Yaakob MJ.
Urban growth and air quality in Kuala Lumpur city, Malaysia. Environ Asia 2010; 3(2): 123-8.
[12] Chng LK, Abdullah AM, Sulaiman WNA, Ramli MF. The effects of improved land use on the meteorological modeling in Klang
Valley region Malaysia. Environ Asia 2010; 3(special issue): 117-23.
[13] MOT (Ministry of transport). [Homepage on the Internet] Total motor vehicles by type and state, Malaysia, 2009. Available from:
http://www.mot.gov.my/stat/darat/Darat_2009/Table%201.2.pdf [Accessed on: 12th November 2010].
[14] Road Transport Department. [Online] Available from: http://portal .jpj.gov.my/index.php?option=com_content&view=article&id=61
%3Astatistik-pendaftaran-motokar&catid=23%3Astatistik-kendera
an-dan-pemandu&Itemid=118&lang=ms [Accessed on: 29th August 2010].
[15] DOE. Air quality. Environmental quality report 2007. Malaysia: Department of Environment, Ministry of Nature Resources and
Environment 2007. [16] Asian Development Bank (ADB) and the clean air initiative for
Asian cities (CAI-Asia) center report. Country synthesis report on urban air quality management: Malaysia, Philippines: Asian
Development Bank (ADB) 2006; pp. 1-20. [17] MMD (Malaysian Meteorological Department). [homepage on the
Internet] Asian Develop-ment Bank (ADB). Rainfall acidity in 2008. Available from: http://www.met.gov.my/index.php?option=
com_content&task=view&id=226&Itemid=1777&lang=english [Accessed on: 11th November 2010].
[18] EPU (Economic Planning Unit). Homepage on the Internet]. 9th Malaysian Plan 2006. Available from: http://www.epu.gov.my/
html/themes/epu/html/rm9/english/Chapter22.pdf [Accessed on: 10th November 2010].
Received: April 26, 2012 Revised: June 19, 2012 Accepted: June 22, 2012
© Abdullah et al.; Licensee Bentham Open.
This is an open access article licensed under the terms of the Creative Commons Attribution Non-Commercial License (http://creativecommons.org/licenses/by-nc/3.0/)
which permits unrestricted, non-commercial use, distribution and reproduction in any medium, provided the work is properly cited.