Embed Size (px)
Citation preview

An Overview of NMR Applications
Introduction to classic
applications for small
molecule liquids NMR
Ron Crouch

Brief History of NMR
•1924: Pauli predicts the possibility of nuclear spin
September 18, 2014
2

The Water Molecule, H2O
September 18, 2014
3
O
H
H
Nuclear Spin

What happens inside a magnet…
September 18, 2014
4
N
S
No Magnetic Field Strong Magnetic Field

What happens inside the magnet…
September 18, 2014
5
N
S
No Magnetic Field Strong Magnetic Field
• If we have 2,000,000 spins in there then 1,000,001 will be aligned with the
magnetic field and 999,999 will be against it.
• We are really lucky because hydrogen is a very important element for organic
chemistry and biochemistry and it is also the most sensitive one for NMR!

September 18, 2014
6
• If we somehow “kick” the spins then their orientation is
reversed.
• But they do not like the kick and return back where they
were, giving us the energy they absorbed.
• We supply the kick in the form of a radiofrequency pulse
lasting a few micro-seconds.
• We measure the energy they give us back and thus record
the spectrum.
• We are lucky that NMR was discovered when the
technology for radio communications was already there!

The First Spectra…
September 18, 2014
7
Spectrum of water, Felix Bloch,
Stanford, 1946
NMR was hailed as an excellent method to measure the
strength of magnetic fields.
An invaluable tool for Physics!

A Disaster for Physics…
September 18, 2014
8
In 1950 Proctor attempted to measure the NMR spectrum of
nitrogen in ammonium nitrate (NH4NO3).
To his horror he discovered two signals instead of one!
He described it as an “annoying chemical affect which could
terribly impede our progress in trying to measure the
magnitude of nuclear magnetic moments”
And so chemical shift was born…
1951
30 MHz HO-CH2-CH3

Where are we now…
September 18, 2014
9
Solids state NMR
physics
NMR imaging
medicine
ppm12345678
Liquid state NMR
chemistry
Vitamine B12

The Overview
NMR has an incredibly Broad span of applications.
Tools exist which focus on small molecules and complementary set of tools for large molecules.
Dynamics and motion have their own sets of NMR Applications.
Because of the breadth, today we will focus on the tool kit for classic small molecule Applications.
Will attempt to present information in a fashion that is useful to both beginning and experienced NMR Scientists!!

Omissions!
Too Many to list !!!
CRAFT – Spectrum to Spreadsheet – Automatically!!
Dynamic Interactions.. Future Webinar!
Solids NMR
Bio

Relative Sensitivity of 1H/13C and 15N...
Product of relative natural abundance times the cube of the differences in frequency.
(a simplification for doing the math in your head )
1H is 100% abundance and highest frequency so it is most sensitive.
13C is 1.1% abundance and frequency is 1/4th 1H.
So.. 13C is (4*4*4)/0.011 or ~5,800 less sensitive than 1H!!
15N is 0.36% abundance and frequency is ~1/9.88th 1H.
So… 15N is (9.88*9.88*9.88)/0.0036 or ~268,000 less sensitive than 1H.

“Indirect Detection”
The idea of observing rare and difficult NMR nuclei like 13C and 15N by 2-dimensional methods at the high abundance and
frequency of 1H is called Indirect Detection.
Indirect detection revolutionized NMR! This pretty much began in
the 1990s and since then nearly every day new useful
experiments appear.
Not only is raw sensitivity greatly increased, we also gain an
additional dimension to simplify a complex spectrum!
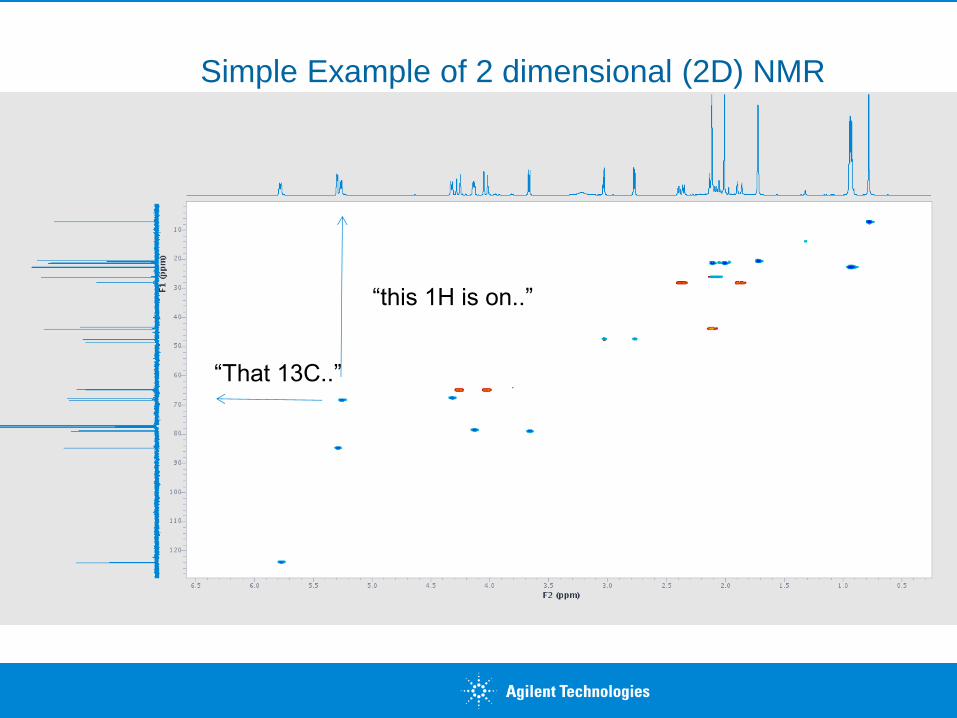
“this 1H is on..”
“That 13C..”
Simple Example of 2 dimensional (2D) NMR

Always remember that qNMR is always there!
Here the integrals are reported as mM concentration
And! CRAFT will output the amplitudes, decay rate, frequency, and
phase for the entire spectrum or a desired region to spreadsheet!
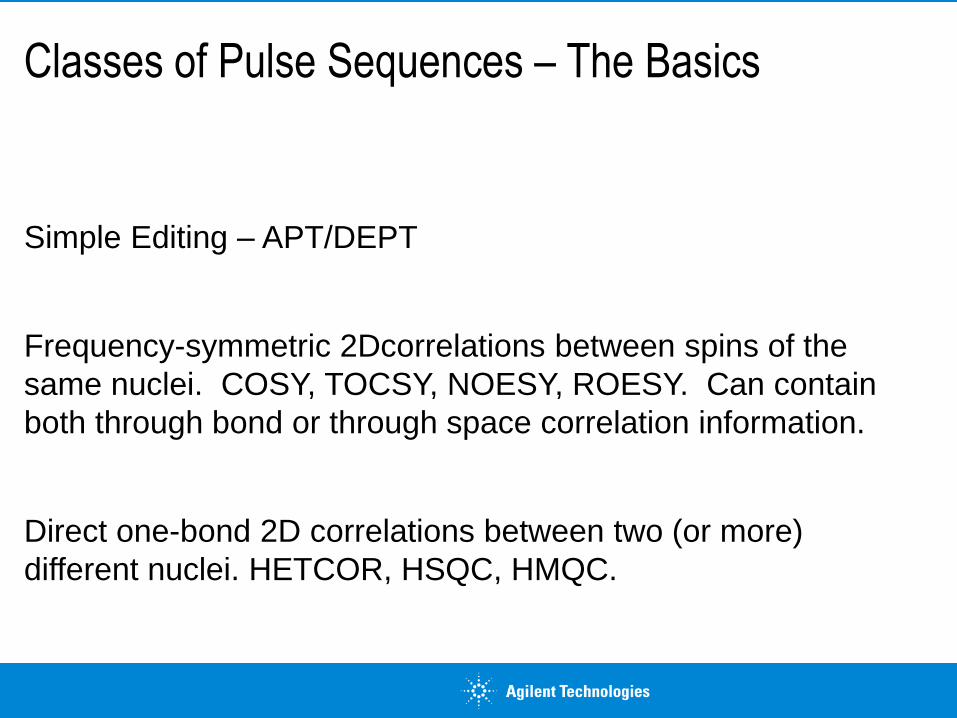
Classes of Pulse Sequences – The Basics
Simple Editing – APT/DEPT
Frequency-symmetric 2Dcorrelations between spins of the
same nuclei. COSY, TOCSY, NOESY, ROESY. Can contain
both through bond or through space correlation information.
Direct one-bond 2D correlations between two (or more)
different nuclei. HETCOR, HSQC, HMQC.

APT – “Attached Proton Test”
up = even# protons on the carbon
down = odd# protons on the carbon

Fully Edited DEPT - Results in series of spectra by type C/CH/CH2/CH3 !!
Quaternary C
Methines
Methylenes
Methyls

HETCOR – Classically H/C
2D Correlation
“This proton attached to that carbon..”
Replaced by HSQC
but should be remembered!
More Book keeping information easily Available!!
The directly acquired dimension is the wider frequency axis..

HSQCAD – Same Sample
Same information as HETCOR
~64 times more sensitivity!!

The HSQCAD Pulse Sequence – Very special Actually good Quantitation!!!

Evolution Delay = 1/2JCH
125 Hz = 4 ms (aliphatics) 165 Hz = 3 ms (aromatics)
For a “standard” HSQC we
usually just use 3.5 ms and accept that it is not perfect for
any proton-carbon pair…
CRISIS Experiments The CRISIS condition - how it works
rf pulses
nominally 15 us
September 18, 2014 22

CRISIS (compensation of refocusing inefficiency with
synchronized inversion sweeps)
Freq. Sweep low-to-high
Freq. Sweep high-to-low
aromatics evolve ~ 3 ms
aliphatics evolve ~ 4 ms
CRISIS Experiments The CRISIS condition - how it works
September 18, 2014 23
Adiabatic Pulses

The Problem of Resolution…
In 2D NMR the number of experiments you choose divided into the frequency
width for the dimension is the resolution.
EG A 21,000 Hz window sampled by 200 increments = 21,000/200 or 105Hz.
In a 400 MHz NMR that 105hz is a bit over 1ppm resolution for 13C.
So!! As needs for digital resolution increase the number of increments must follow
directly… A bit about NUS later..
Band-selected pulses can allow huge time
saving by focusing precisely where we look!!

8 Hz separation – with 21000 Hz window >2600 increments needed!

8 minute gHMBCAD…

10 minute Band-selected gHMBCAD !


Band-Selected HSQCAD -
Resolve 3 Hz carbon in 15 minutes!
Band Selection is a suite of experiments..

Experiments are Organized by type and are even searchable!
You can add your own and show/organize/group as desired.
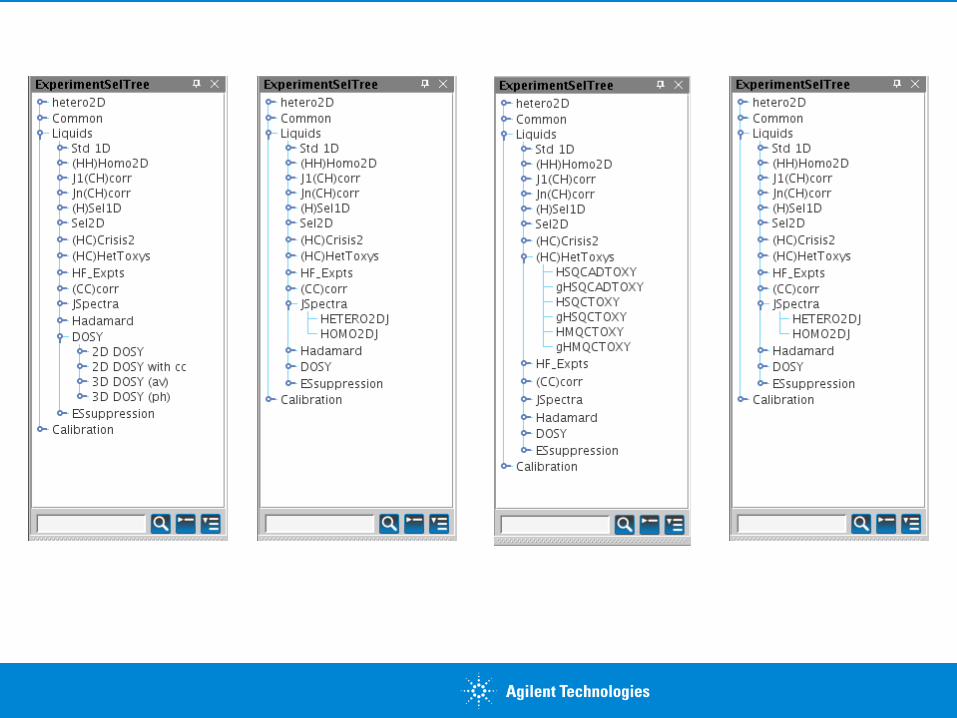

Exotic …. Everyday…. Calibrations… All available with a click in or out of automation

Homonuclear Decoupling replaced by 2Ds but remains very useful.
Can be applied during any 2D experiment!!
1”s
Decouple
2”

Consider the gDQCOSY for GAZT

GAZT – Sugars Only….
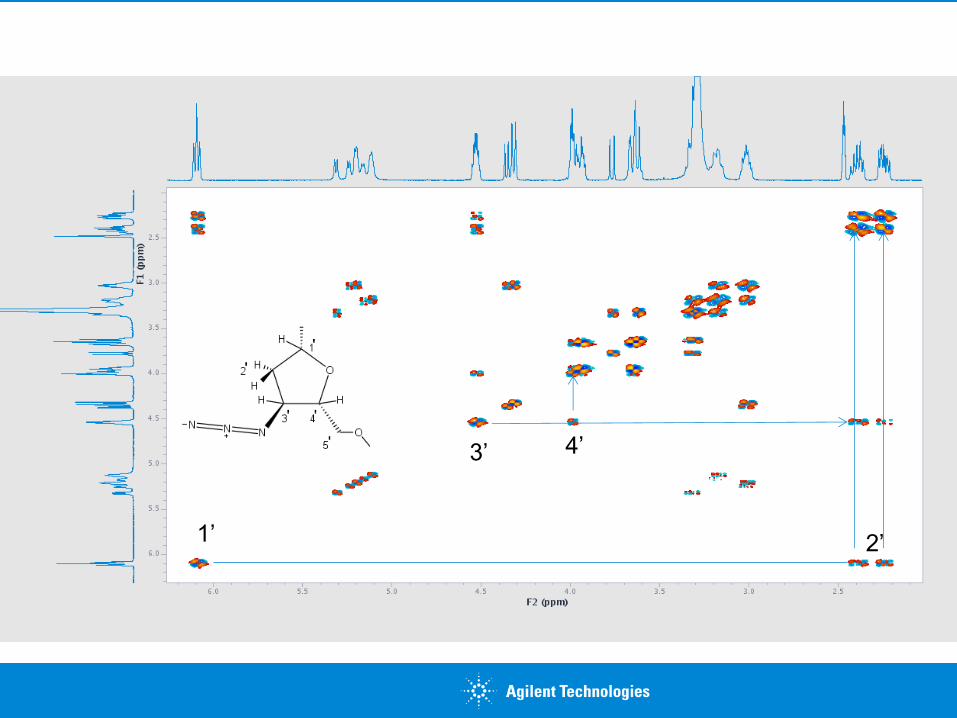
1’ 2’
3’ 4’
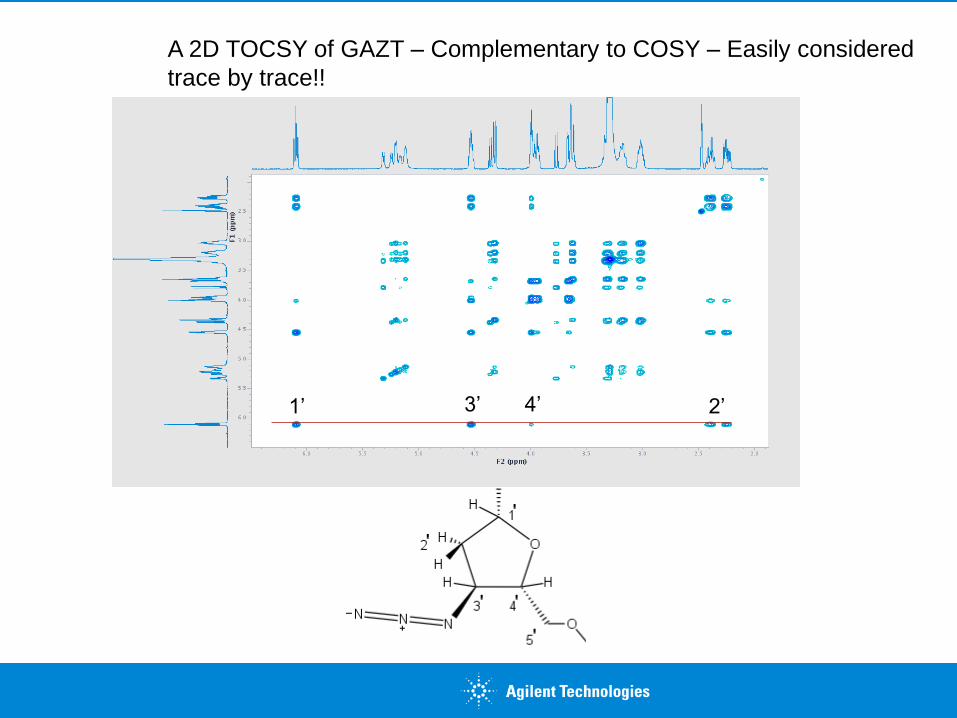
A 2D TOCSY of GAZT – Complementary to COSY – Easily considered
trace by trace!!
1’ 3’ 2’ 4’

HSQCAD - GAZT

1’
1”
3’
4’
5”a&b
5’ch2
2”
3”
4”
2’ O-H’s !

Analysis the data in a “concerted fashion” ! Chocolate Chip Cookie Principal
H-3’
3’->4’ & 3’->2’
2’
4’
1’
3’
4’
2’
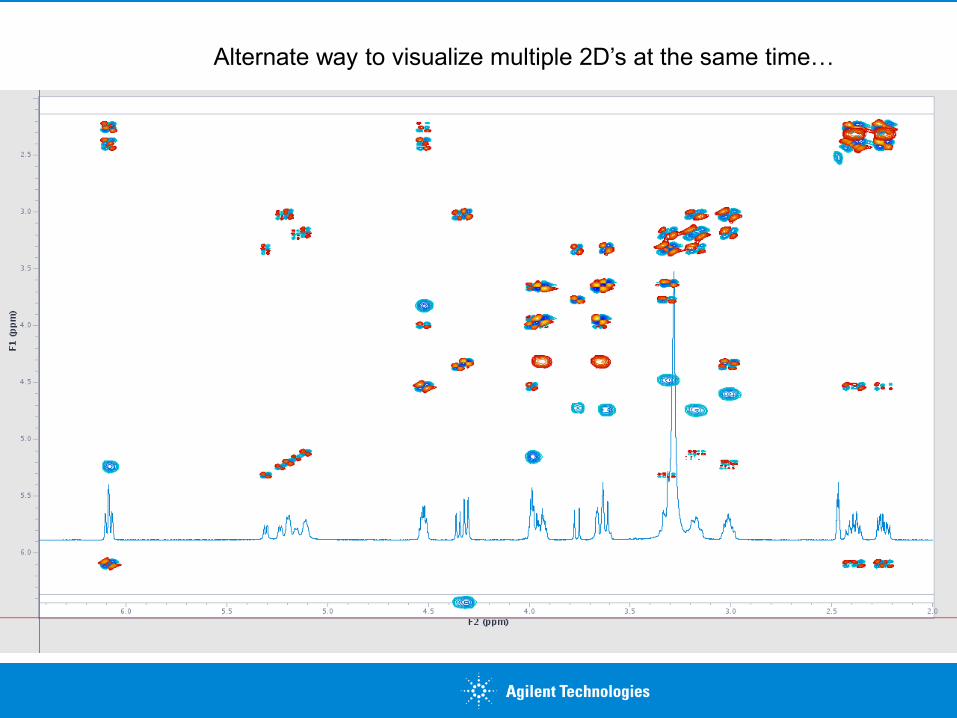
Alternate way to visualize multiple 2D’s at the same time…

Manual Assignment time?
less than 3 minutes!

Proton
Pureshift
Today we can simply acquire a proton directly with chemical shifts only!!
“Pureshift or PSYCHE” Experiments

Classes of Pulse Sequences – Assisted Connectivity
Band-Selected homo-nuclear experiments such
NOESY1D, ROESY1D, TOCSY1D, and their “Band
selected 2D” companions.
Direct H/X correlations combined with 1H/1H
connectivity such as HSQCTOCSY and H2BC.
A cornerstone for drawing Chemical bonds = The
HMBC family with the many useful variants.

ROESY-AD - Through Space -
H4 -> H3’

Often a simple 1D ROESY or NOESY alternative
to a full 2D experiment.

A nice suite of 2D Band-selected “homonuclear” experiments are provided!!
A
B

HSQCTOXY – Show 1H-1H connectivity with the resolution of 13C!!!
3’ H/C
2’C
2’H
5’C
4’/1’C
1’H

HSQCTOXY versus H2BC for 2-bond 1H-1H connectivity
H2BCAD HSQCTOXY
Cursor on 1’->2’ connectivity…

mixT=0.018
mult=2
mixT=0.018
mult=1
dm=‘nnn’
Just like H2BC..
but more robust!
HSQCTOXY – shorten Mix

About chemical shifts & multiplets.… Hom2dJ…

PROTON
PSYCHE
PSYCHE – improved PureShift 1D…(qNMR!!)

gHMBCAD – Long-range H/X connectivity – Consider Just Thymidine –H4!
H-4
CH3 at 5
C-1’
C-5
C-2
C-6

H–1’
C-4
C-2

GAZT H-N LR_HSQMBC
H1’-N3
H3’-Azide
Azide
N1
H4-N2 NH-N2

H-1”
C-4
C-2
C-3’ H-2’
C-1’
Key gHMBCAD Information…
C-5
“Highly over-determined/Redundant”
C-6
5-CH3
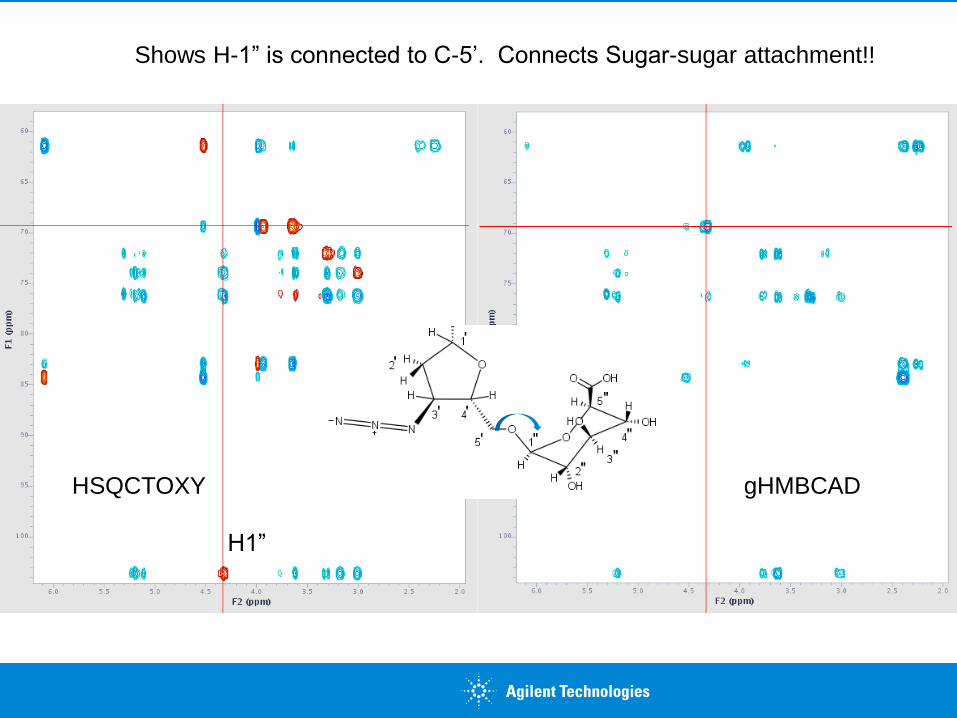
Shows H-1” is connected to C-5’. Connects Sugar-sugar attachment!!
H1”
gHMBCAD HSQCTOXY

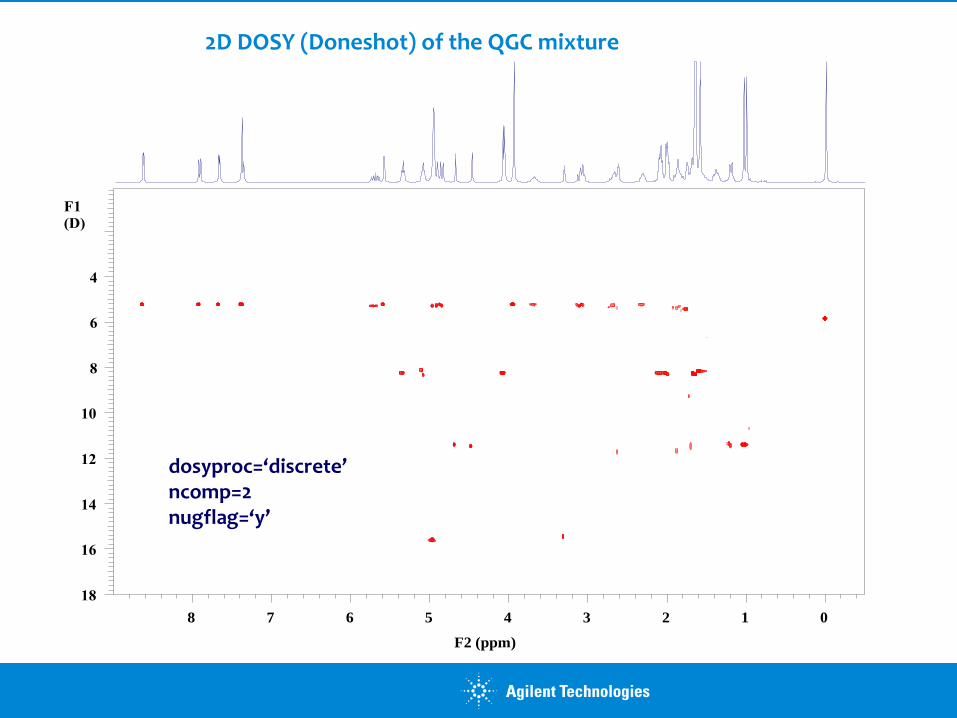
DOSY – Diffusion-Ordered Spectroscopy
In simplified terms.. Pulsed field gradient
methods can allow the separation of molecules
of differing sizes into distinct NMR spectra
without requiring an actual chemical separation.

N
N
CH2
OH
O
CH3
H
H
H
OH
CH3
CH3
CH3
CH2
CH3
CH3
geraniol quinine
camphene
ppm 1 2 3 4 5 6 7 8 ppm
Structures and 1H spectrum of the QGC mixture (in CD3OD)
F2 (ppm)
012345678
F1
(D)
4
6
8
10
12
14
16
18
dosyproc=‘discrete’ ncomp=2 nugflag=‘y’
2D DOSY (Doneshot) of the QGC mixture

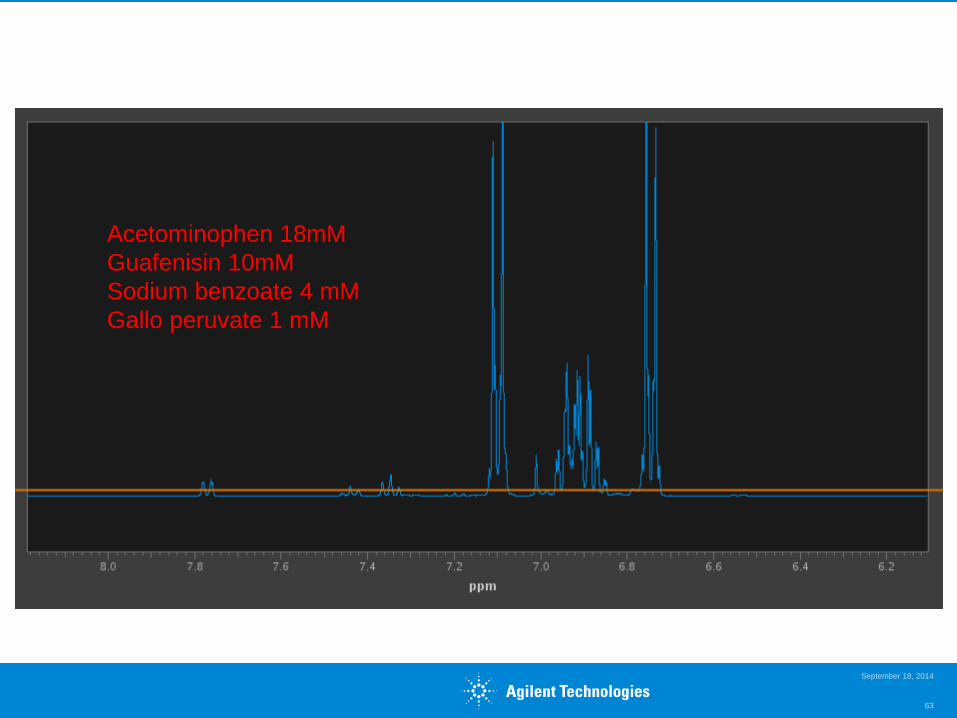
Cough Medicine – 150ul in d2o. Presat the water.
September 18, 2014
61
Propylene glycol + Glycerin. mostly

400 MHz One minute...
September 18, 2014
62
September 18, 2014
63
Acetominophen 18mM
Guafenisin 10mM
Sodium benzoate 4 mM
Gallo peruvate 1 mM

Big D 80ms little D 4ms Dbbpled – 16 G/cm max.
September 18, 2014
64

September 18, 2014 65
Conventional Sampling in 2D Spectroscopy • t1 period is incremented linearly (uniformly):
0, 1/sw1, 2/sw2,…,(ni-1)/sw1
Where sw1 is spectral width in F1 dimension and ni is total number of t1
increments
Resolution in F1 is given by maximum t1 acquisition (evolution) time (ni-
1)/sw1
Max t1

September 18, 2014 66
Uniform Sampling

September 18, 2014 67
Do we need to sample every t1 increment?
• No! This is done to satisfy the requirements of FT
• Non-Uniform Sampling (NUS) is the better way to collect data
Max t1

September 18, 2014 68
Uniform Sampling
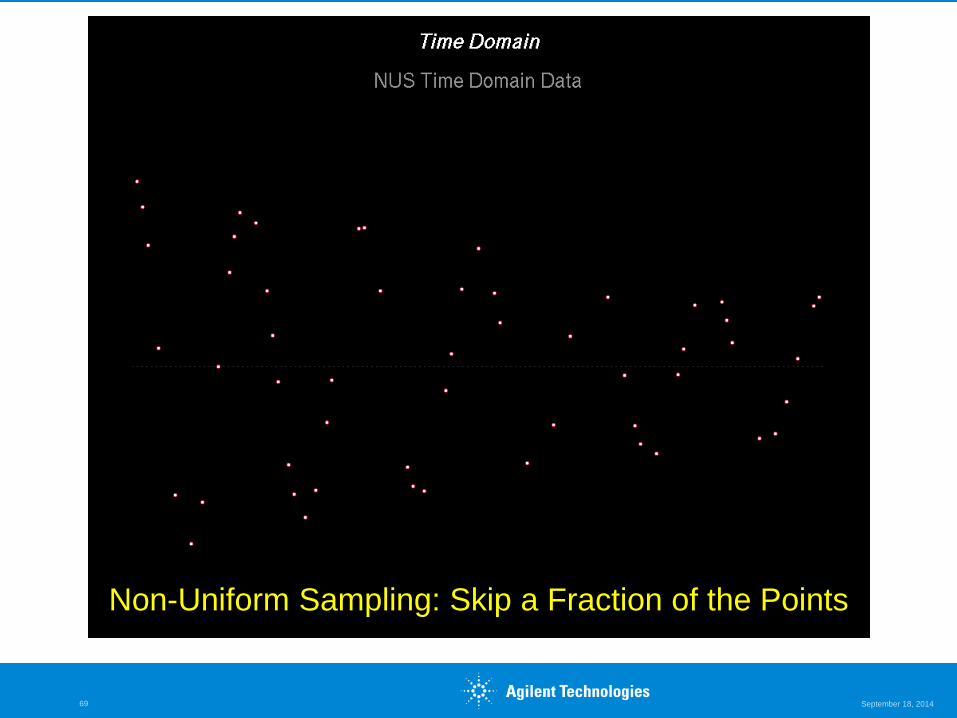
September 18, 2014 69
Non-Uniform Sampling: Skip a Fraction of the Points

Non-Uniform Sampling:
for Fourier Transform, Replace Missing Points with Zeros

September 18, 2014 71
Linear versus Non-Uniform Sampling
Linear Sampling: Broad Line and Periodic Truncation Wiggles
Non-Uniform Sampling: Narrow Line and Random Noise-Like Artifacts
Time

Non Uniform Sampling
72
IST – Iterative Soft Thresholding

Non Uniform Sampling
73
IST – Iterative Soft Thresholding

Non Uniform Sampling
74
IST – Iterative Soft Thresholding

Non Uniform Sampling
75
IST – Iterative Soft Thresholding
Fourier Spectrum IST Spectrum
September 18, 2014 76
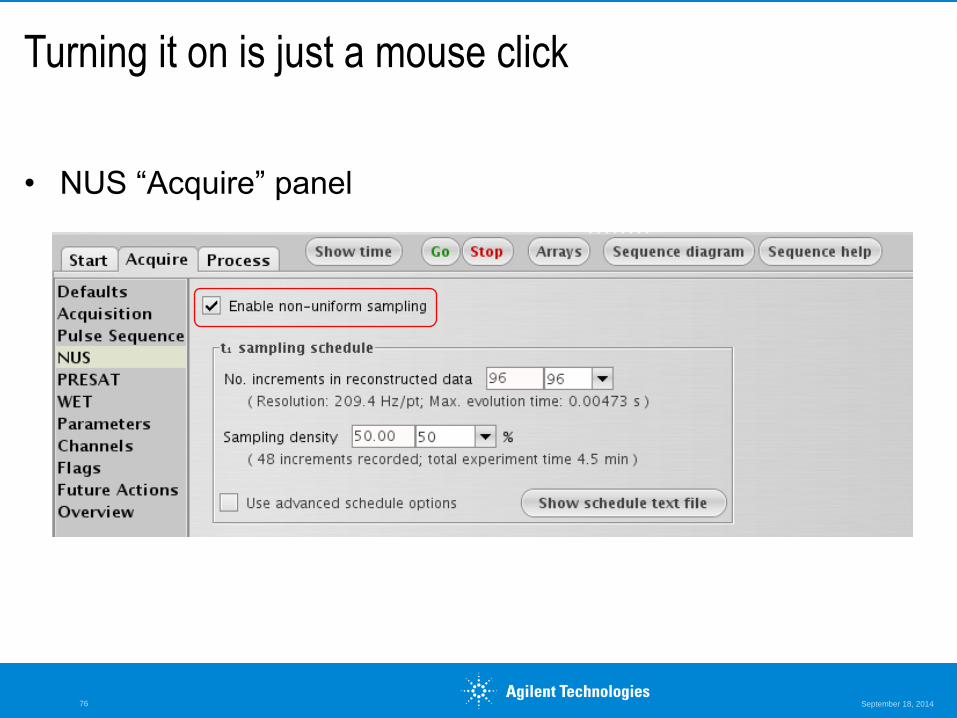
Turning it on is just a mouse click
• NUS “Acquire” panel

September 18, 2014 77
Example Results

September 18, 2014
78
ni (max) = 128 128 512
SD = 25% (32) 100% (128) 25% (128)
Exp. Time = 4 min 16 min 16 min
gain
time
gain
resolution
Conventional sampling NUS sampling NUS sampling
HSQCAD spectra of strychnine (aliphatic region)
sw1=11300 (90 ppm), phase=1,2 nt=2
N
N
O
H
H
O
H
H
13
12 11
10
8
7 6
5 4
3
2
1
23
22
21
20 18
17
16 15
14 Non-Uniform Sampling (NUS) – gHSQCAD II.
N
N
O
H
H
O
H
H
13
12 11
10
8
7 6
5 4
3
2
1
23
22
21
20 18
17
16 15
14
Sample: Strychine (MW: 334, F:C21H22N2O2), concentration: 20 mmolar (6.84 mg/ml), solvent: CDCl3

September 18, 2014
79
ni (max) = 128 128 512
SD = 25% (32) 100% (128) 25% (128)
Exp. Time = 4 min 16 min 16 min
gain
time
gain
Resolution
0.11 ppm
(14 Hz)
N
N
O
H
H
O
H
H
13
12 11
10
8
7 6
5 4
3
2
1
23
22
21
20 18
17
16 15
14 Non-Uniform Sampling (NUS) – gHSQCAD IV.
Sample: Strychine (MW: 334, F:C21H22N2O2), concentration: 20 mmolar (6.84 mg/ml), solvent: CDCl3
HSQCAD spectra of strychnine (aliphatic region – expansion #2)
sw1=11300 (90 ppm), phase=1,2 nt=2

September 18, 2014 80
NUS Processing Options
• Data measured in
StudyQ processed
automatically
• Can reprocess
NUS data with a
single button click
• CLEAN takes a few
seconds (typically
less than 5)
• IST takes about a
minute

September 18, 2014 81
Non-Uniform Sampling: Summary
- NUS gives the same quality of data in less time
or
- Higher quality data (better resolution) in the same time
or
- A bit of both!
Summary
NMR Applications are incredibly broad and diverse.
Currently very sophisticated and powerful NMR experiments
exist to allow the determination of both primary and secondary
structure for very complex molecules.
NMR is a powerful complementary addition to Mass
Spectrometry and optical analytical methods.
Modern data acquisition and processing schemes such as
linear prediction and non-uniform sampling can greatly reduce
experiment time and are very easy to use and applicable to
almost every 2D experiment.

Thank You!!!
Once again I apologize for the many omissions and I will try to
answer any questions!