Embed Size (px)
Citation preview
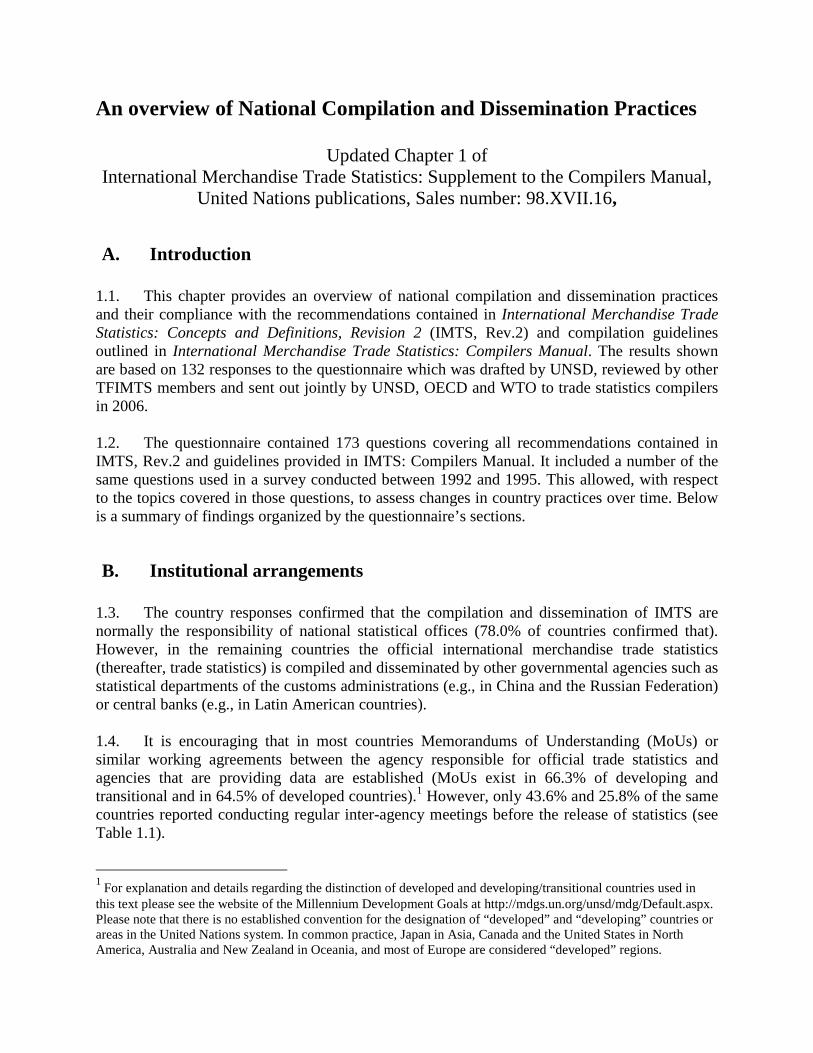
An overview of National Compilation and Dissemination Practices
Updated Chapter 1 ofInternational Merchandise Trade Statistics: Supplement to the Compilers Manual,
United Nations publications, Sales number: 98.XVII.16,
A. Introduction
1.1. This chapter provides an overview of national compilation and dissemination practicesand their compliance with the recommendations contained in International Merchandise TradeStatistics: Concepts and Definitions, Revision 2 (IMTS, Rev.2) and compilation guidelinesoutlined in International Merchandise Trade Statistics: Compilers Manual. The results shownare based on 132 responses to the questionnaire which was drafted by UNSD, reviewed by otherTFIMTS members and sent out jointly by UNSD, OECD and WTO to trade statistics compilersin 2006.
1.2. The questionnaire contained 173 questions covering all recommendations contained inIMTS, Rev.2 and guidelines provided in IMTS: Compilers Manual. It included a number of thesame questions used in a survey conducted between 1992 and 1995. This allowed, with respectto the topics covered in those questions, to assess changes in country practices over time. Belowis a summary of findings organized by the questionnaire’s sections.
B. Institutional arrangements
1.3. The country responses confirmed that the compilation and dissemination of IMTS arenormally the responsibility of national statistical offices (78.0% of countries confirmed that).However, in the remaining countries the official international merchandise trade statistics(thereafter, trade statistics) is compiled and disseminated by other governmental agencies such asstatistical departments of the customs administrations (e.g., in China and the Russian Federation)or central banks (e.g., in Latin American countries).
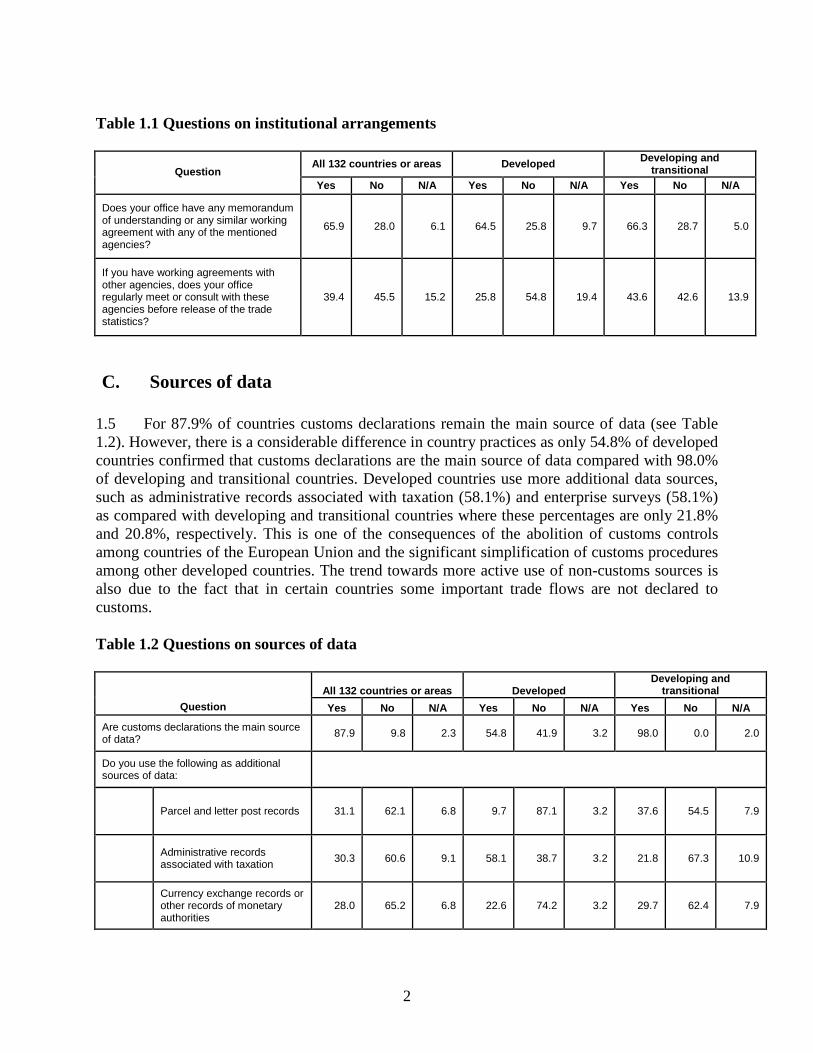
1.4. It is encouraging that in most countries Memorandums of Understanding (MoUs) orsimilar working agreements between the agency responsible for official trade statistics andagencies that are providing data are established (MoUs exist in 66.3% of developing andtransitional and in 64.5% of developed countries).1 However, only 43.6% and 25.8% of the samecountries reported conducting regular inter-agency meetings before the release of statistics (seeTable 1.1).
1For explanation and details regarding the distinction of developed and developing/transitional countries used in
this text please see the website of the Millennium Development Goals at http://mdgs.un.org/unsd/mdg/Default.aspx.Please note that there is no established convention for the designation of “developed” and “developing” countries orareas in the United Nations system. In common practice, Japan in Asia, Canada and the United States in NorthAmerica, Australia and New Zealand in Oceania, and most of Europe are considered “developed” regions.
2
Table 1.1 Questions on institutional arrangements
All 132 countries or areas DevelopedDeveloping and
transitionalQuestion
Yes No N/A Yes No N/A Yes No N/A
Does your office have any memorandumof understanding or any similar workingagreement with any of the mentionedagencies?
65.9 28.0 6.1 64.5 25.8 9.7 66.3 28.7 5.0
If you have working agreements withother agencies, does your officeregularly meet or consult with theseagencies before release of the tradestatistics?
39.4 45.5 15.2 25.8 54.8 19.4 43.6 42.6 13.9
C. Sources of data
1.5 For 87.9% of countries customs declarations remain the main source of data (see Table1.2). However, there is a considerable difference in country practices as only 54.8% of developedcountries confirmed that customs declarations are the main source of data compared with 98.0%of developing and transitional countries. Developed countries use more additional data sources,such as administrative records associated with taxation (58.1%) and enterprise surveys (58.1%)as compared with developing and transitional countries where these percentages are only 21.8%and 20.8%, respectively. This is one of the consequences of the abolition of customs controlsamong countries of the European Union and the significant simplification of customs proceduresamong other developed countries. The trend towards more active use of non-customs sources isalso due to the fact that in certain countries some important trade flows are not declared tocustoms.
Table 1.2 Questions on sources of data
All 132 countries or areas DevelopedDeveloping and
transitional
Question Yes No N/A Yes No N/A Yes No N/A
Are customs declarations the main sourceof data?
87.9 9.8 2.3 54.8 41.9 3.2 98.0 0.0 2.0
Do you use the following as additionalsources of data:
Parcel and letter post records 31.1 62.1 6.8 9.7 87.1 3.2 37.6 54.5 7.9
Administrative recordsassociated with taxation
30.3 60.6 9.1 58.1 38.7 3.2 21.8 67.3 10.9
Currency exchange records orother records of monetaryauthorities
28.0 65.2 6.8 22.6 74.2 3.2 29.7 62.4 7.9
3
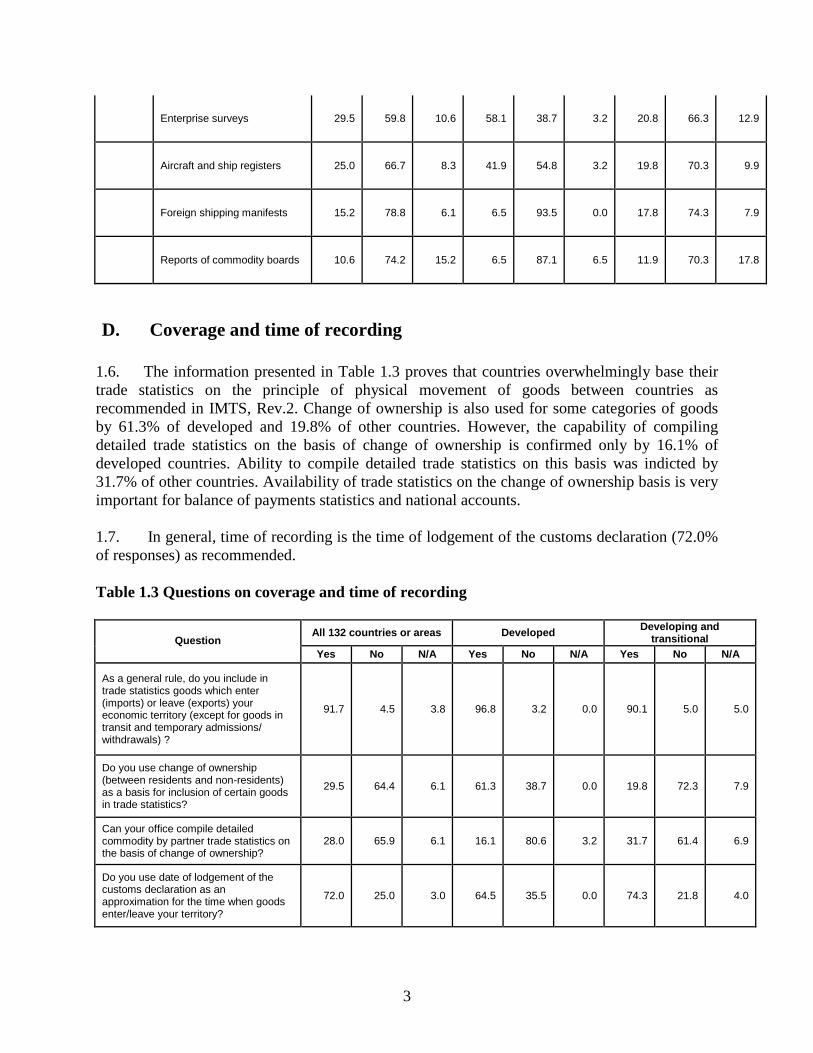
Enterprise surveys 29.5 59.8 10.6 58.1 38.7 3.2 20.8 66.3 12.9
Aircraft and ship registers 25.0 66.7 8.3 41.9 54.8 3.2 19.8 70.3 9.9
Foreign shipping manifests 15.2 78.8 6.1 6.5 93.5 0.0 17.8 74.3 7.9
Reports of commodity boards 10.6 74.2 15.2 6.5 87.1 6.5 11.9 70.3 17.8
D. Coverage and time of recording
1.6. The information presented in Table 1.3 proves that countries overwhelmingly base theirtrade statistics on the principle of physical movement of goods between countries asrecommended in IMTS, Rev.2. Change of ownership is also used for some categories of goodsby 61.3% of developed and 19.8% of other countries. However, the capability of compilingdetailed trade statistics on the basis of change of ownership is confirmed only by 16.1% ofdeveloped countries. Ability to compile detailed trade statistics on this basis was indicted by31.7% of other countries. Availability of trade statistics on the change of ownership basis is veryimportant for balance of payments statistics and national accounts.
1.7. In general, time of recording is the time of lodgement of the customs declaration (72.0%of responses) as recommended.
Table 1.3 Questions on coverage and time of recording
All 132 countries or areas DevelopedDeveloping and
transitionalQuestion
Yes No N/A Yes No N/A Yes No N/A
As a general rule, do you include intrade statistics goods which enter(imports) or leave (exports) youreconomic territory (except for goods intransit and temporary admissions/withdrawals) ?
91.7 4.5 3.8 96.8 3.2 0.0 90.1 5.0 5.0
Do you use change of ownership(between residents and non-residents)as a basis for inclusion of certain goodsin trade statistics?
29.5 64.4 6.1 61.3 38.7 0.0 19.8 72.3 7.9
Can your office compile detailedcommodity by partner trade statistics onthe basis of change of ownership?
28.0 65.9 6.1 16.1 80.6 3.2 31.7 61.4 6.9
Do you use date of lodgement of thecustoms declaration as anapproximation for the time when goodsenter/leave your territory?
72.0 25.0 3.0 64.5 35.5 0.0 74.3 21.8 4.0
4
E. Categories of included and excluded goods
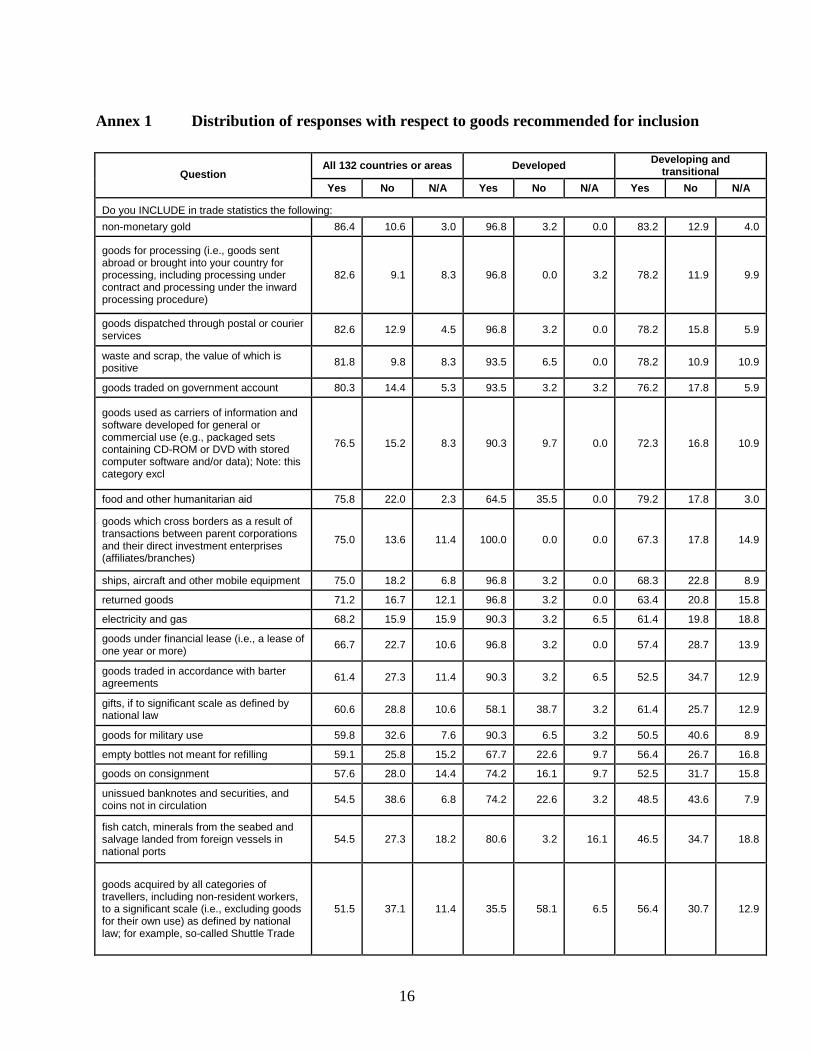
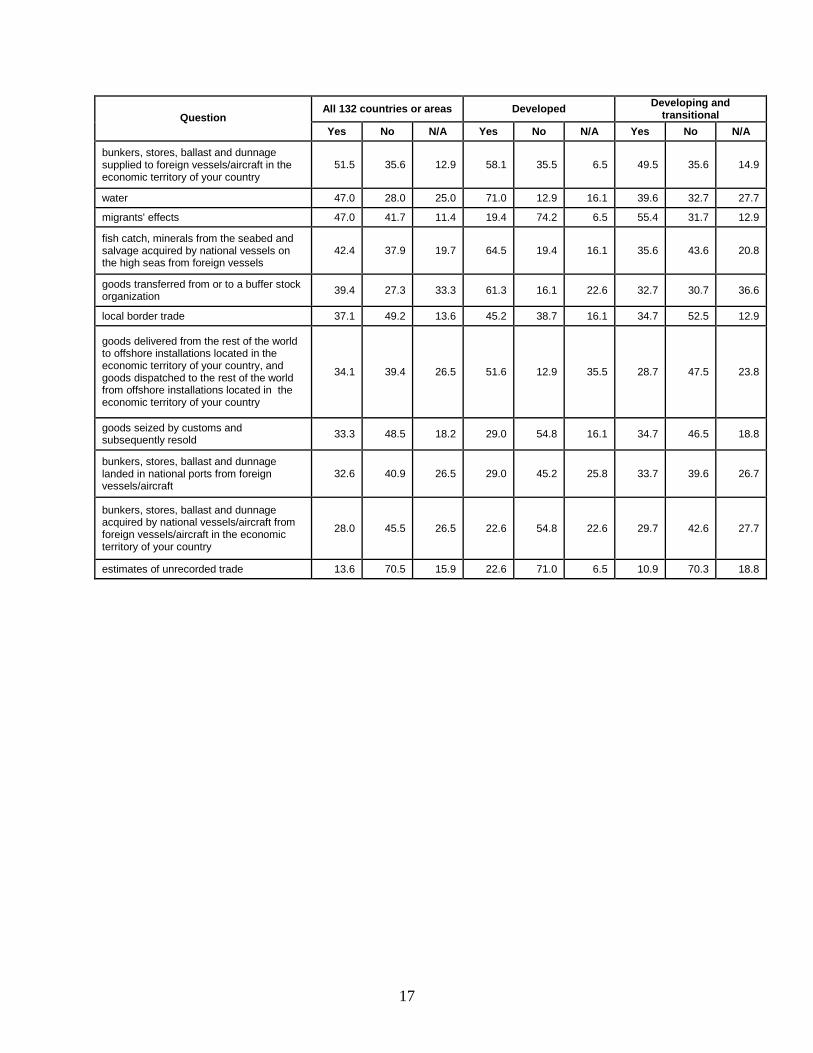
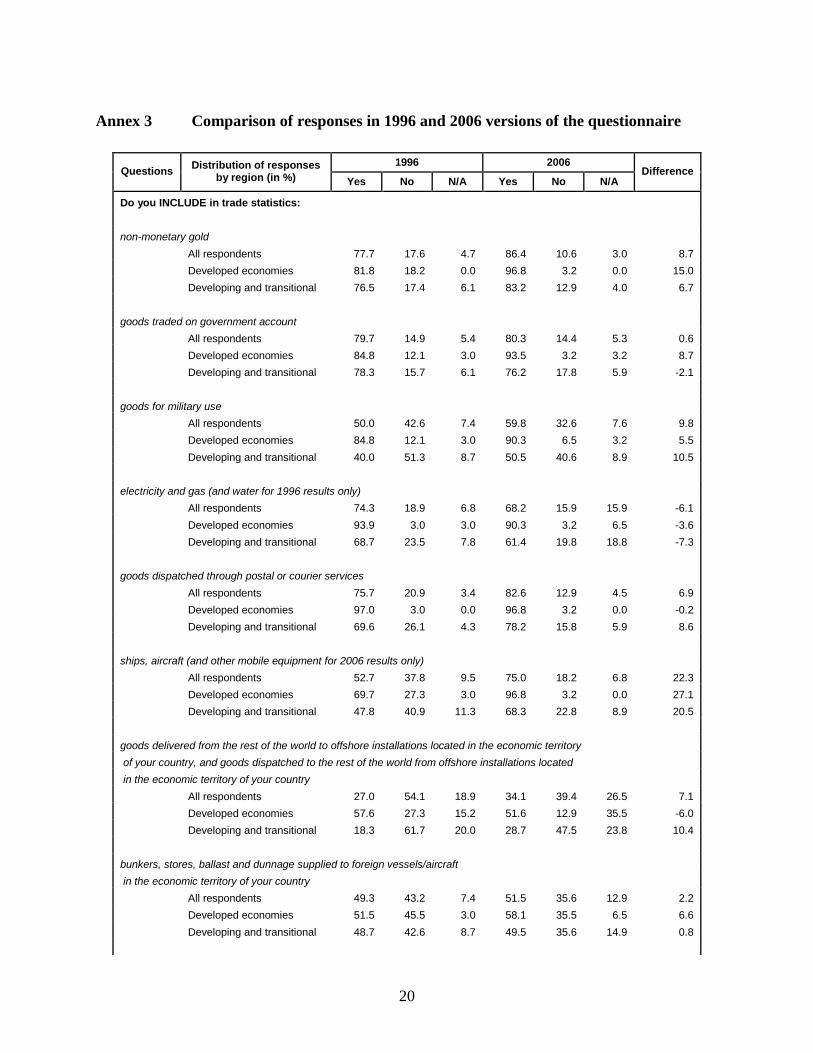
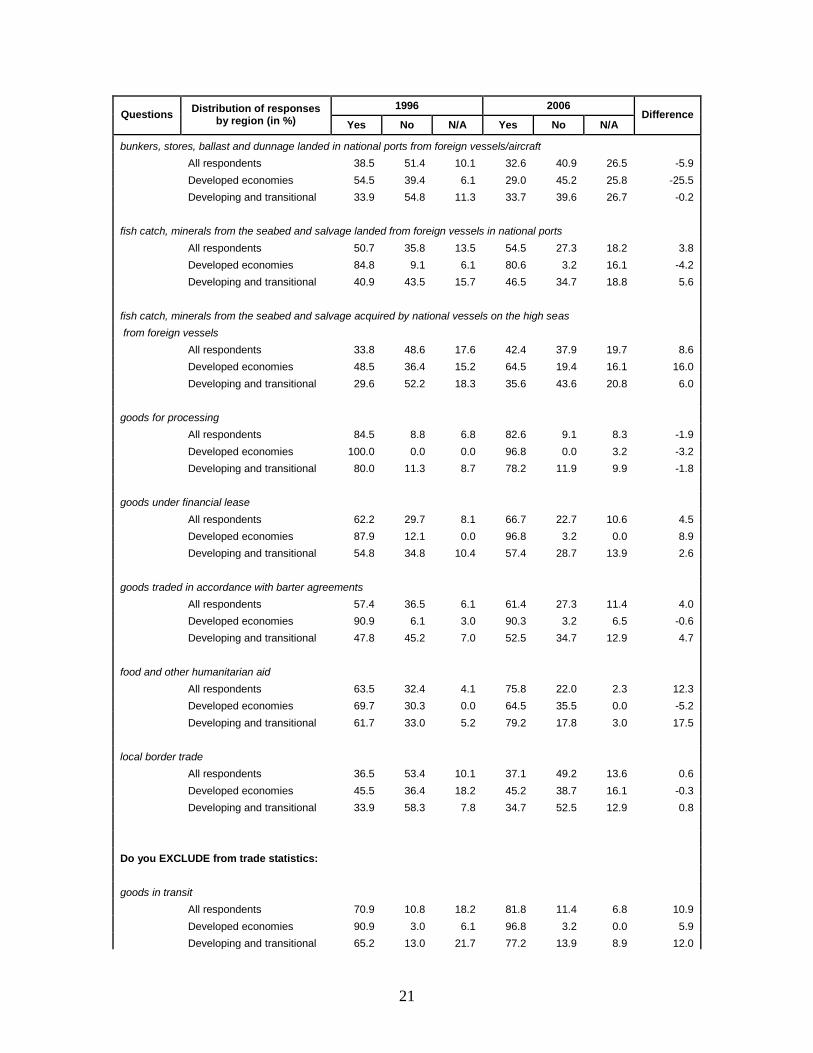
1.8. Annexes 1 and 2 to this report summarize countries’ responses to the questions abouttheir practices with respect to the inclusion and exclusion of certain categories of goods. Bothannexes list those goods in a descending order of percentage of “Yes” answers by allrespondents. Several general observations are provided below. Annex 3 contains a comparison ofcurrent and past responses (a similar survey was conducted between 1992 and 1995).
GOODS TO BE INCLUDED IN THE DETAILED INTERNATIONAL MERCHANDISE TRADE STATISTICS
1.9. Annexes 1 and 3 confirm a relatively good compliance with the IMTS, Rev.2recommendations regarding certain inclusions (IMTS, Rev.2, paragraphs 19-41) and they showimprovement in the compliance rate for most of the economically important categories of goodssince 1996. The low compliance (less than 50%) is taking place typically in the cases of goods inwhich international trade is relatively less significant and where there is no customs recording orsuch recording is very limited. Certain categories of goods, which are shown hereafter, are ofspecial interest.
1.10. Goods for processing. 96.8% developed and 78.2% of developing and transitionalcountries include these goods in their trade statistics. Countries reported also that valuation ofsuch goods is on a gross basis. It should be noted that countries are usually unable to separatelyidentify goods for processing if they are not so declared. A detailed discussion of the issue ofgoods for processing is given in chapter 4.B.
1.11. Goods used as carriers of information and software developed for general or commercialuse. Most of developed (90.3%) and developing and transitional countries (72.3%) include thesegoods in their statistics of external trade (more precisely, 16.8% of developing and transitionalcountries indicated not to include these goods and the remaining 10.9% provided no answer orindicated that it was not applicable). Countries reported also that valuation of such goods isbased on their full value.
1.12. Goods crossing borders as a result of transactions between parent corporations and theirdirect investment enterprises (affiliates/branches). All developed countries follow therecommendation to include this category of goods into their trade statistics. For developing andtransitional countries it proved to be more difficult to implement as only 67.3% of themconfirmed compliance (17.8% indicated not to include these goods and 14.9% provided noanswer or indicated that it was not applicable).
1.13. Water. The information of country practices in respect to the inclusion of water isimportant in view of growing environmental concerns. It is encouraging that 71.0% of developedcountries indicated that they are compiling data reflecting trade in water. However, only 39.6%of developing and transitional countries indicated so (32.7% indicated not to include water and27.7% provided no answer or indicated that it was not applicable).
5
1.14. Estimates of unrecorded trade. The country responses show that inclusion of estimates ofunrecorded trade into official statistics is not a widespread practice as only 22.6% of developedand 10.9% of developing and transitional countries include such estimates.
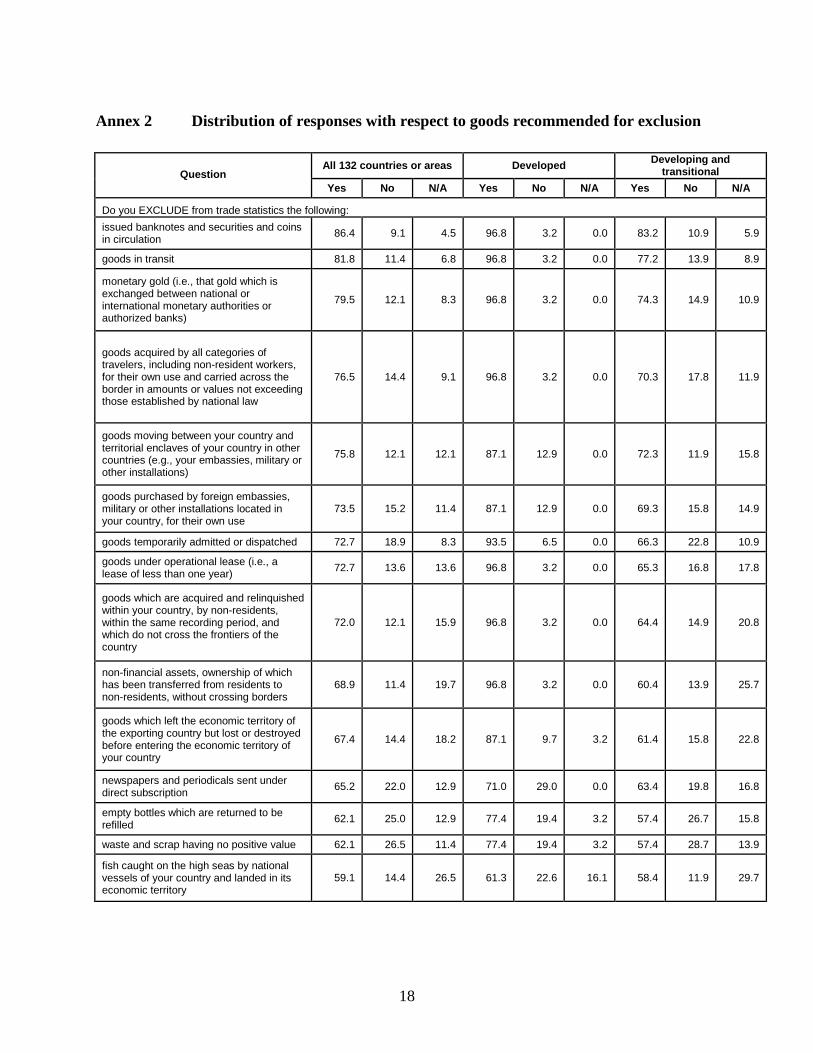
GOODS TO BE EXCLUDED FROM THE DETAILED INTERNATIONAL MERCHANDISE TRADE STATISTICS
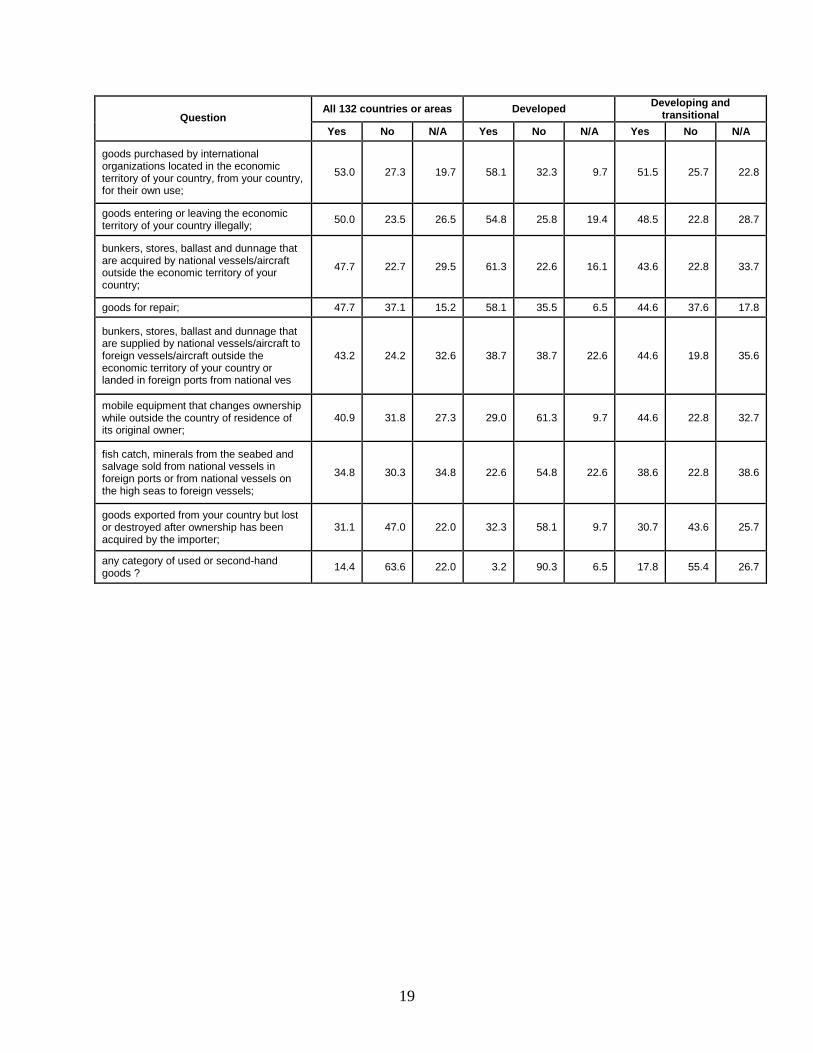
1.15. The responses shown in Annexes 2 and 3 to questions about the exclusion of particularcategories of goods (IMTS, Rev.2, paragraphs 42-54) show that most countries comply with therecommended list of specific exclusions and that the compliance rate improved noticeable formost of those categories. However, for many important categories of goods the compliance rateamong developed countries is noticeably higher than among other countries. Several examples ofthis kind are provided below.
1.16. Goods acquired by all categories of travelers, including non-resident workers, for theirown use and carried across the border in amounts or values not exceeding those established bynational law. Goods of this category are recommended for exclusion from merchandise trade asthey are to be included in trade in services. The country responses show that almost alldeveloped countries (96.8%) exclude them with 70.3% of developing and transitional countriesdoing the same.
1.17. Goods under operational lease. There is a dramatic increase in the compliance rate withrespect to this recommendation between 1996 and 2006 (from 78.8% to 96.8% for developedcountries and from only 59.1% to 65.3% for developing and transitional countries).
1.18. Non-financial assets, ownership of which has been transferred from residents to non-residents, without crossing borders. In case of these goods 96.8% of developed countries excludethem, but only 60.4% of developing and transitional countries reported their exclusion (13.9%indicated not to exclude these goods and 25.7% provided no answer or indicated that it was notapplicable).
1.19. Used or second hand goods. These goods are not recommended for exclusion and thequestion was asked to obtain information on actual country practices. The responses confirm thatthese goods are not excluded by 90.3% of developed and 55.4% of other countries.
F. Kyoto convention and relevant customs procedures
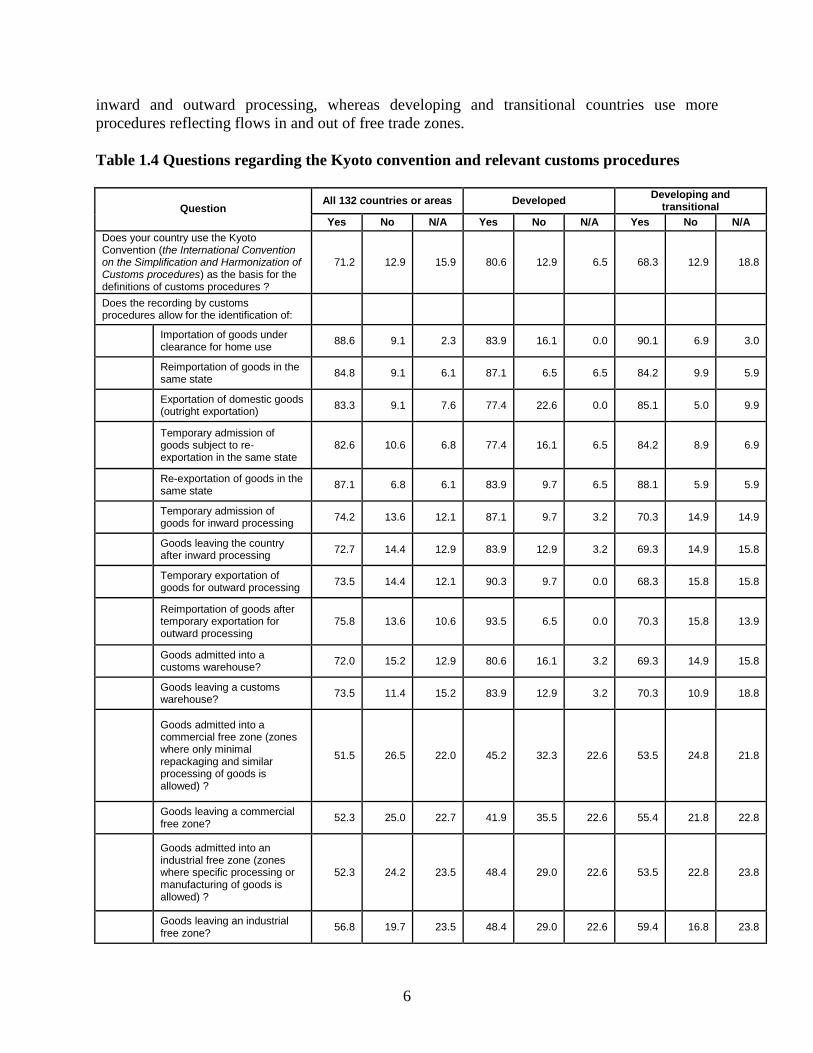
1.20. A clear majority of countries (71.2%) use the Kyoto convention on customs proceduresas the basis for their customs legislation. This is noteworthy as the application of the samecustoms standards is an important factor to improve comparability of customs records and theresulting trade statistics. Table 1.4 below provides a summary of responses to the question ofwhether customs procedures followed in countries allow for collection of data on certain flows ofgoods. In general, all countries are in a very similar position. There is a slight tendency thatdeveloped countries use more extensively the procedures allowing for recording of goods in
6
inward and outward processing, whereas developing and transitional countries use moreprocedures reflecting flows in and out of free trade zones.
Table 1.4 Questions regarding the Kyoto convention and relevant customs procedures
All 132 countries or areas DevelopedDeveloping and
transitionalQuestion
Yes No N/A Yes No N/A Yes No N/A
Does your country use the KyotoConvention (the International Conventionon the Simplification and Harmonization ofCustoms procedures) as the basis for thedefinitions of customs procedures ?
71.2 12.9 15.9 80.6 12.9 6.5 68.3 12.9 18.8
Does the recording by customsprocedures allow for the identification of:
Importation of goods underclearance for home use
88.6 9.1 2.3 83.9 16.1 0.0 90.1 6.9 3.0
Reimportation of goods in thesame state
84.8 9.1 6.1 87.1 6.5 6.5 84.2 9.9 5.9
Exportation of domestic goods(outright exportation)
83.3 9.1 7.6 77.4 22.6 0.0 85.1 5.0 9.9
Temporary admission ofgoods subject to re-exportation in the same state
82.6 10.6 6.8 77.4 16.1 6.5 84.2 8.9 6.9
Re-exportation of goods in thesame state
87.1 6.8 6.1 83.9 9.7 6.5 88.1 5.9 5.9
Temporary admission ofgoods for inward processing
74.2 13.6 12.1 87.1 9.7 3.2 70.3 14.9 14.9
Goods leaving the countryafter inward processing
72.7 14.4 12.9 83.9 12.9 3.2 69.3 14.9 15.8
Temporary exportation ofgoods for outward processing
73.5 14.4 12.1 90.3 9.7 0.0 68.3 15.8 15.8
Reimportation of goods aftertemporary exportation foroutward processing
75.8 13.6 10.6 93.5 6.5 0.0 70.3 15.8 13.9
Goods admitted into acustoms warehouse?
72.0 15.2 12.9 80.6 16.1 3.2 69.3 14.9 15.8
Goods leaving a customswarehouse?
73.5 11.4 15.2 83.9 12.9 3.2 70.3 10.9 18.8
Goods admitted into acommercial free zone (zoneswhere only minimalrepackaging and similarprocessing of goods isallowed) ?
51.5 26.5 22.0 45.2 32.3 22.6 53.5 24.8 21.8
Goods leaving a commercialfree zone?
52.3 25.0 22.7 41.9 35.5 22.6 55.4 21.8 22.8
Goods admitted into anindustrial free zone (zoneswhere specific processing ormanufacturing of goods isallowed) ?
52.3 24.2 23.5 48.4 29.0 22.6 53.5 22.8 23.8
Goods leaving an industrialfree zone?
56.8 19.7 23.5 48.4 29.0 22.6 59.4 16.8 23.8
7
Goods in customs transit? 56.8 34.1 9.1 48.4 48.4 3.2 59.4 29.7 10.9
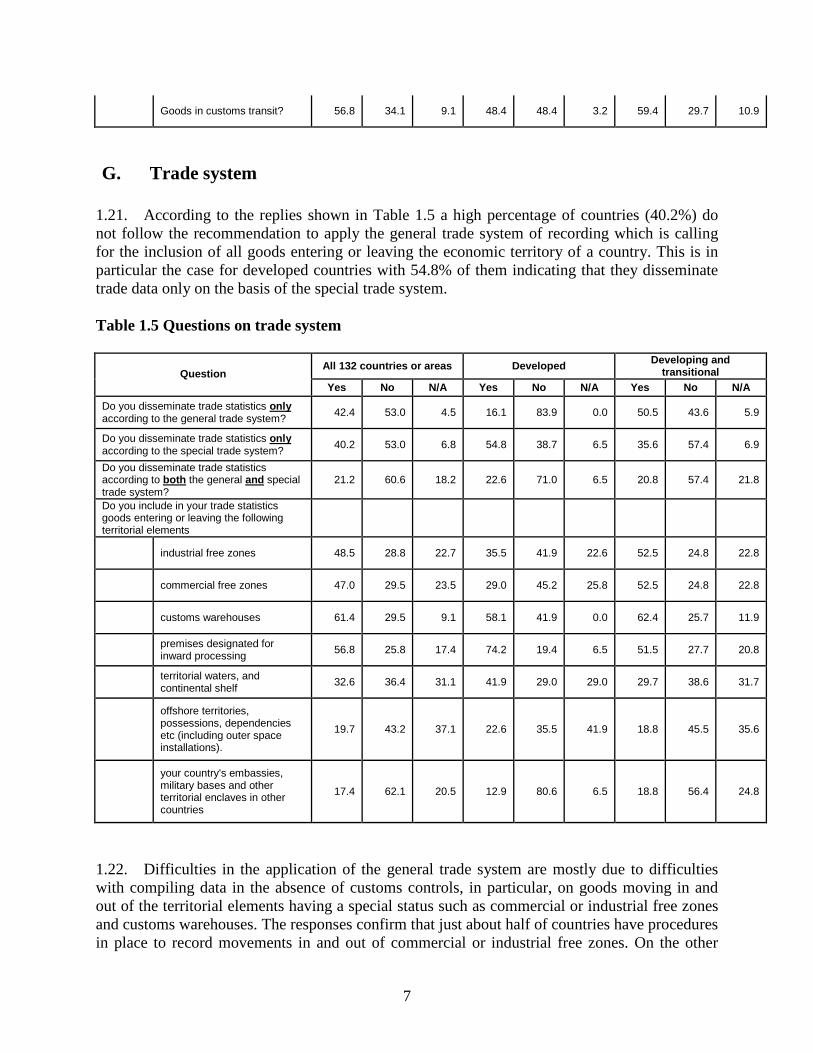
G. Trade system
1.21. According to the replies shown in Table 1.5 a high percentage of countries (40.2%) donot follow the recommendation to apply the general trade system of recording which is callingfor the inclusion of all goods entering or leaving the economic territory of a country. This is inparticular the case for developed countries with 54.8% of them indicating that they disseminatetrade data only on the basis of the special trade system.
Table 1.5 Questions on trade system
All 132 countries or areas DevelopedDeveloping and
transitionalQuestion
Yes No N/A Yes No N/A Yes No N/A
Do you disseminate trade statistics onlyaccording to the general trade system?
42.4 53.0 4.5 16.1 83.9 0.0 50.5 43.6 5.9
Do you disseminate trade statistics onlyaccording to the special trade system?
40.2 53.0 6.8 54.8 38.7 6.5 35.6 57.4 6.9
Do you disseminate trade statisticsaccording to both the general and specialtrade system?
21.2 60.6 18.2 22.6 71.0 6.5 20.8 57.4 21.8
Do you include in your trade statisticsgoods entering or leaving the followingterritorial elements
industrial free zones 48.5 28.8 22.7 35.5 41.9 22.6 52.5 24.8 22.8
commercial free zones 47.0 29.5 23.5 29.0 45.2 25.8 52.5 24.8 22.8
customs warehouses 61.4 29.5 9.1 58.1 41.9 0.0 62.4 25.7 11.9
premises designated forinward processing
56.8 25.8 17.4 74.2 19.4 6.5 51.5 27.7 20.8
territorial waters, andcontinental shelf
32.6 36.4 31.1 41.9 29.0 29.0 29.7 38.6 31.7
offshore territories,possessions, dependenciesetc (including outer spaceinstallations).
19.7 43.2 37.1 22.6 35.5 41.9 18.8 45.5 35.6
your country's embassies,military bases and otherterritorial enclaves in othercountries
17.4 62.1 20.5 12.9 80.6 6.5 18.8 56.4 24.8
1.22. Difficulties in the application of the general trade system are mostly due to difficultieswith compiling data in the absence of customs controls, in particular, on goods moving in andout of the territorial elements having a special status such as commercial or industrial free zonesand customs warehouses. The responses confirm that just about half of countries have proceduresin place to record movements in and out of commercial or industrial free zones. On the other
8
hand, inclusion in trade statistics of goods admitted into or withdrawn from the customswarehouses is possible in 61.4% of countries.
1.23. About 20% of countries are able to include in trade statistics goods entering or leavingtheir offshore territories, possessions, dependencies etc (including outer space installations)(19.7%) as well as their country's embassies, military bases and other territorial enclaves in othercountries (17.4%). In view of relatively small value of this kind of trade countries often do notdevelop procedures to capture it.
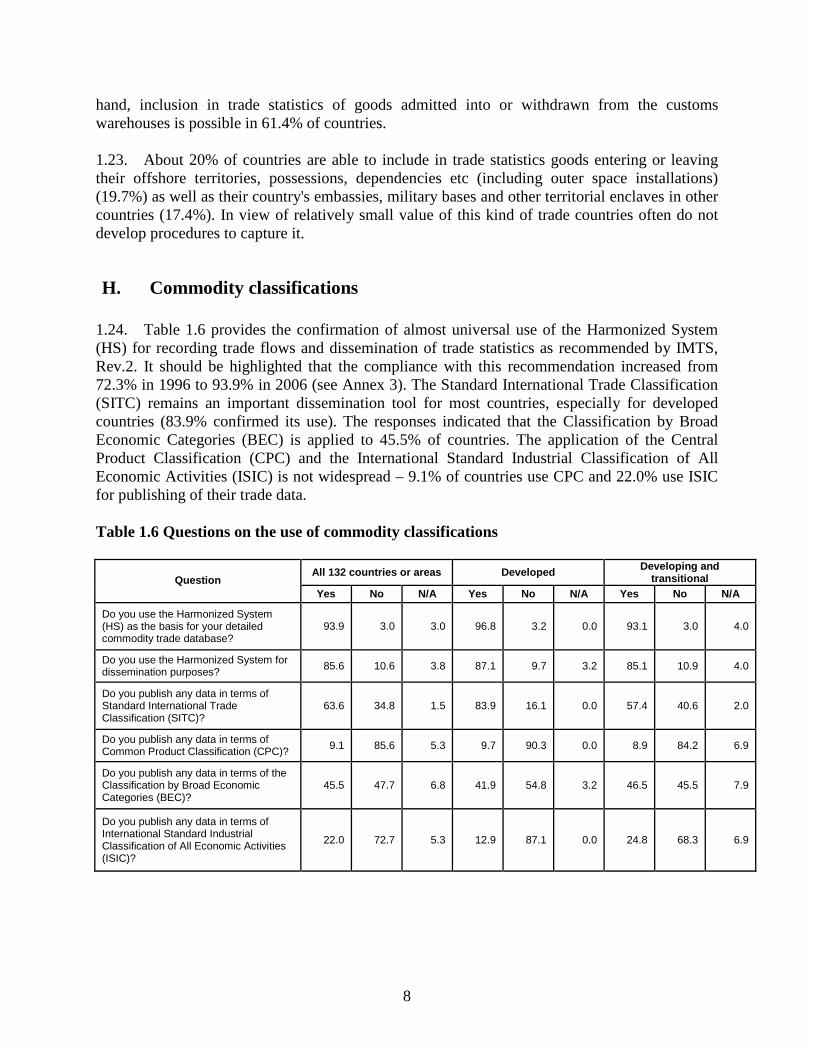
H. Commodity classifications
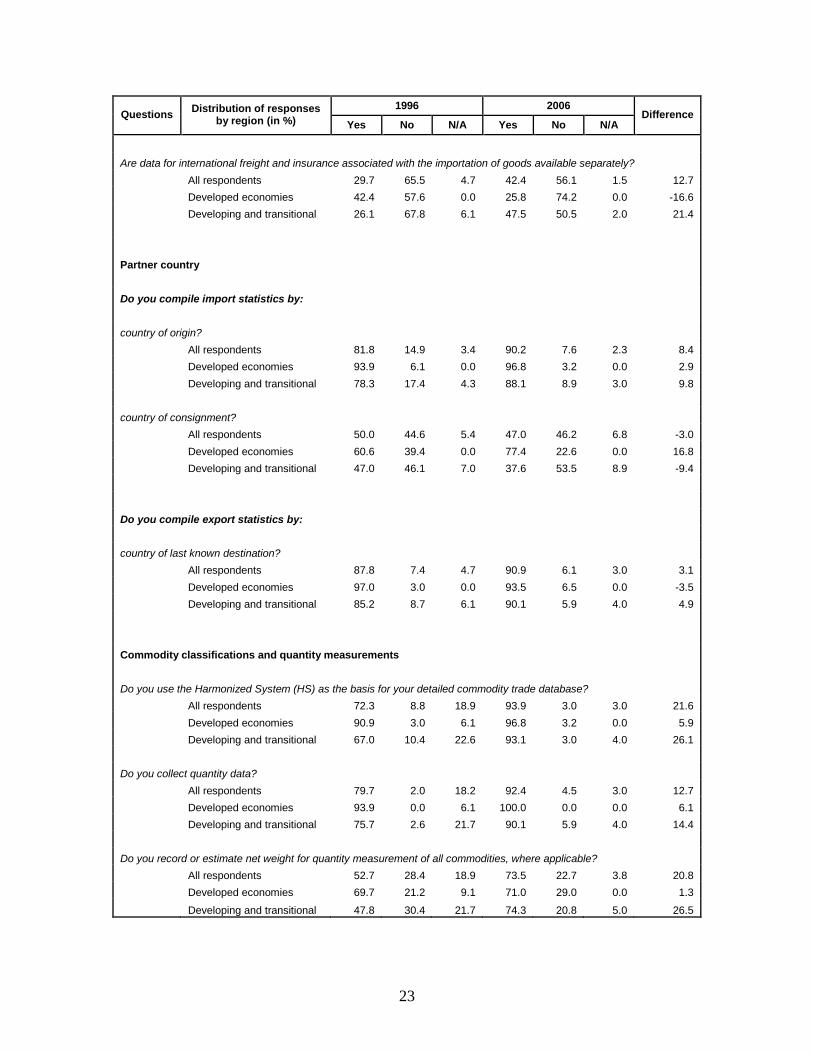
1.24. Table 1.6 provides the confirmation of almost universal use of the Harmonized System(HS) for recording trade flows and dissemination of trade statistics as recommended by IMTS,Rev.2. It should be highlighted that the compliance with this recommendation increased from72.3% in 1996 to 93.9% in 2006 (see Annex 3). The Standard International Trade Classification(SITC) remains an important dissemination tool for most countries, especially for developedcountries (83.9% confirmed its use). The responses indicated that the Classification by BroadEconomic Categories (BEC) is applied to 45.5% of countries. The application of the CentralProduct Classification (CPC) and the International Standard Industrial Classification of AllEconomic Activities (ISIC) is not widespread – 9.1% of countries use CPC and 22.0% use ISICfor publishing of their trade data.
Table 1.6 Questions on the use of commodity classifications
All 132 countries or areas DevelopedDeveloping and
transitionalQuestion
Yes No N/A Yes No N/A Yes No N/A
Do you use the Harmonized System(HS) as the basis for your detailedcommodity trade database?
93.9 3.0 3.0 96.8 3.2 0.0 93.1 3.0 4.0
Do you use the Harmonized System fordissemination purposes?
85.6 10.6 3.8 87.1 9.7 3.2 85.1 10.9 4.0
Do you publish any data in terms ofStandard International TradeClassification (SITC)?
63.6 34.8 1.5 83.9 16.1 0.0 57.4 40.6 2.0
Do you publish any data in terms ofCommon Product Classification (CPC)?
9.1 85.6 5.3 9.7 90.3 0.0 8.9 84.2 6.9
Do you publish any data in terms of theClassification by Broad EconomicCategories (BEC)?
45.5 47.7 6.8 41.9 54.8 3.2 46.5 45.5 7.9
Do you publish any data in terms ofInternational Standard IndustrialClassification of All Economic Activities(ISIC)?
22.0 72.7 5.3 12.9 87.1 0.0 24.8 68.3 6.9
9
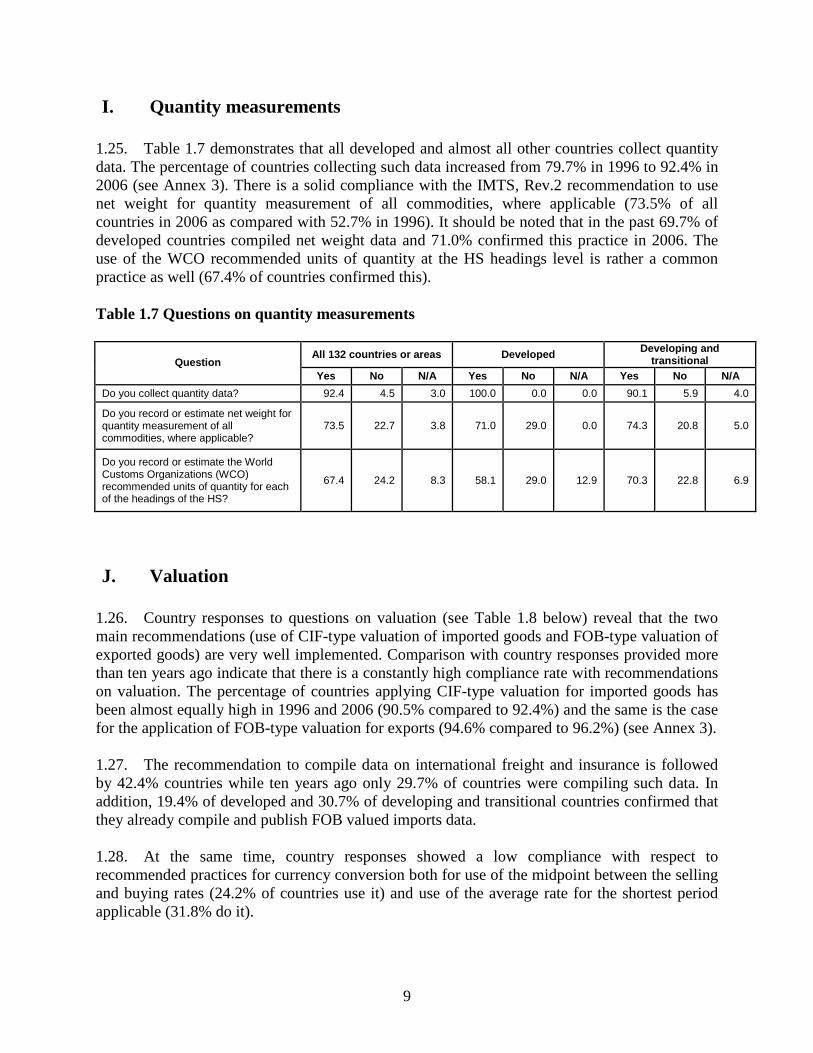
I. Quantity measurements
1.25. Table 1.7 demonstrates that all developed and almost all other countries collect quantitydata. The percentage of countries collecting such data increased from 79.7% in 1996 to 92.4% in2006 (see Annex 3). There is a solid compliance with the IMTS, Rev.2 recommendation to usenet weight for quantity measurement of all commodities, where applicable (73.5% of allcountries in 2006 as compared with 52.7% in 1996). It should be noted that in the past 69.7% ofdeveloped countries compiled net weight data and 71.0% confirmed this practice in 2006. Theuse of the WCO recommended units of quantity at the HS headings level is rather a commonpractice as well (67.4% of countries confirmed this).
Table 1.7 Questions on quantity measurements
All 132 countries or areas DevelopedDeveloping and
transitionalQuestion
Yes No N/A Yes No N/A Yes No N/A
Do you collect quantity data? 92.4 4.5 3.0 100.0 0.0 0.0 90.1 5.9 4.0
Do you record or estimate net weight forquantity measurement of allcommodities, where applicable?
73.5 22.7 3.8 71.0 29.0 0.0 74.3 20.8 5.0
Do you record or estimate the WorldCustoms Organizations (WCO)recommended units of quantity for eachof the headings of the HS?
67.4 24.2 8.3 58.1 29.0 12.9 70.3 22.8 6.9
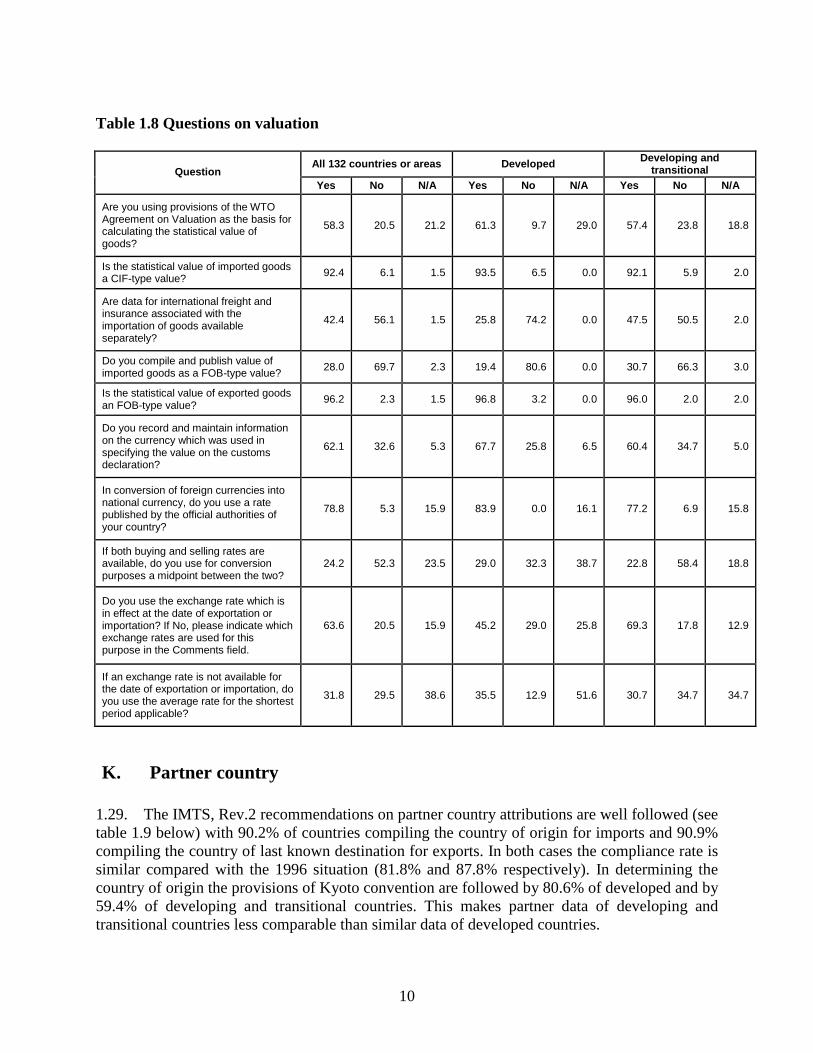
J. Valuation
1.26. Country responses to questions on valuation (see Table 1.8 below) reveal that the twomain recommendations (use of CIF-type valuation of imported goods and FOB-type valuation ofexported goods) are very well implemented. Comparison with country responses provided morethan ten years ago indicate that there is a constantly high compliance rate with recommendationson valuation. The percentage of countries applying CIF-type valuation for imported goods hasbeen almost equally high in 1996 and 2006 (90.5% compared to 92.4%) and the same is the casefor the application of FOB-type valuation for exports (94.6% compared to 96.2%) (see Annex 3).
1.27. The recommendation to compile data on international freight and insurance is followedby 42.4% countries while ten years ago only 29.7% of countries were compiling such data. Inaddition, 19.4% of developed and 30.7% of developing and transitional countries confirmed thatthey already compile and publish FOB valued imports data.
1.28. At the same time, country responses showed a low compliance with respect torecommended practices for currency conversion both for use of the midpoint between the sellingand buying rates (24.2% of countries use it) and use of the average rate for the shortest periodapplicable (31.8% do it).
10
Table 1.8 Questions on valuation
All 132 countries or areas DevelopedDeveloping and
transitionalQuestion
Yes No N/A Yes No N/A Yes No N/A
Are you using provisions of the WTOAgreement on Valuation as the basis forcalculating the statistical value ofgoods?
58.3 20.5 21.2 61.3 9.7 29.0 57.4 23.8 18.8
Is the statistical value of imported goodsa CIF-type value?
92.4 6.1 1.5 93.5 6.5 0.0 92.1 5.9 2.0
Are data for international freight andinsurance associated with theimportation of goods availableseparately?
42.4 56.1 1.5 25.8 74.2 0.0 47.5 50.5 2.0
Do you compile and publish value ofimported goods as a FOB-type value?
28.0 69.7 2.3 19.4 80.6 0.0 30.7 66.3 3.0
Is the statistical value of exported goodsan FOB-type value?
96.2 2.3 1.5 96.8 3.2 0.0 96.0 2.0 2.0
Do you record and maintain informationon the currency which was used inspecifying the value on the customsdeclaration?
62.1 32.6 5.3 67.7 25.8 6.5 60.4 34.7 5.0
In conversion of foreign currencies intonational currency, do you use a ratepublished by the official authorities ofyour country?
78.8 5.3 15.9 83.9 0.0 16.1 77.2 6.9 15.8
If both buying and selling rates areavailable, do you use for conversionpurposes a midpoint between the two?
24.2 52.3 23.5 29.0 32.3 38.7 22.8 58.4 18.8
Do you use the exchange rate which isin effect at the date of exportation orimportation? If No, please indicate whichexchange rates are used for thispurpose in the Comments field.
63.6 20.5 15.9 45.2 29.0 25.8 69.3 17.8 12.9
If an exchange rate is not available forthe date of exportation or importation, doyou use the average rate for the shortestperiod applicable?
31.8 29.5 38.6 35.5 12.9 51.6 30.7 34.7 34.7
K. Partner country
1.29. The IMTS, Rev.2 recommendations on partner country attributions are well followed (seetable 1.9 below) with 90.2% of countries compiling the country of origin for imports and 90.9%compiling the country of last known destination for exports. In both cases the compliance rate issimilar compared with the 1996 situation (81.8% and 87.8% respectively). In determining thecountry of origin the provisions of Kyoto convention are followed by 80.6% of developed and by59.4% of developing and transitional countries. This makes partner data of developing andtransitional countries less comparable than similar data of developed countries.
11
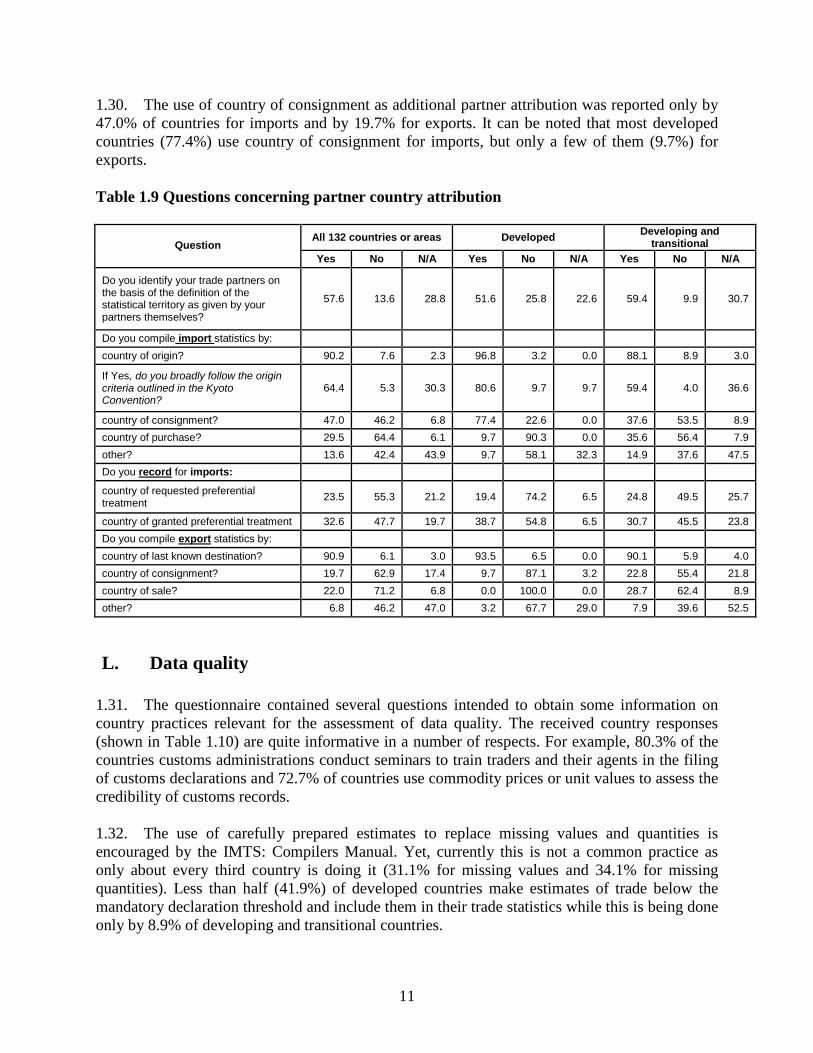
1.30. The use of country of consignment as additional partner attribution was reported only by47.0% of countries for imports and by 19.7% for exports. It can be noted that most developedcountries (77.4%) use country of consignment for imports, but only a few of them (9.7%) forexports.
Table 1.9 Questions concerning partner country attribution
All 132 countries or areas DevelopedDeveloping and
transitionalQuestion
Yes No N/A Yes No N/A Yes No N/A
Do you identify your trade partners onthe basis of the definition of thestatistical territory as given by yourpartners themselves?
57.6 13.6 28.8 51.6 25.8 22.6 59.4 9.9 30.7
Do you compile import statistics by:
country of origin? 90.2 7.6 2.3 96.8 3.2 0.0 88.1 8.9 3.0
If Yes, do you broadly follow the origincriteria outlined in the KyotoConvention?
64.4 5.3 30.3 80.6 9.7 9.7 59.4 4.0 36.6
country of consignment? 47.0 46.2 6.8 77.4 22.6 0.0 37.6 53.5 8.9
country of purchase? 29.5 64.4 6.1 9.7 90.3 0.0 35.6 56.4 7.9
other? 13.6 42.4 43.9 9.7 58.1 32.3 14.9 37.6 47.5
Do you record for imports:
country of requested preferentialtreatment
23.5 55.3 21.2 19.4 74.2 6.5 24.8 49.5 25.7
country of granted preferential treatment 32.6 47.7 19.7 38.7 54.8 6.5 30.7 45.5 23.8
Do you compile export statistics by:
country of last known destination? 90.9 6.1 3.0 93.5 6.5 0.0 90.1 5.9 4.0
country of consignment? 19.7 62.9 17.4 9.7 87.1 3.2 22.8 55.4 21.8
country of sale? 22.0 71.2 6.8 0.0 100.0 0.0 28.7 62.4 8.9
other? 6.8 46.2 47.0 3.2 67.7 29.0 7.9 39.6 52.5
L. Data quality
1.31. The questionnaire contained several questions intended to obtain some information oncountry practices relevant for the assessment of data quality. The received country responses(shown in Table 1.10) are quite informative in a number of respects. For example, 80.3% of thecountries customs administrations conduct seminars to train traders and their agents in the filingof customs declarations and 72.7% of countries use commodity prices or unit values to assess thecredibility of customs records.
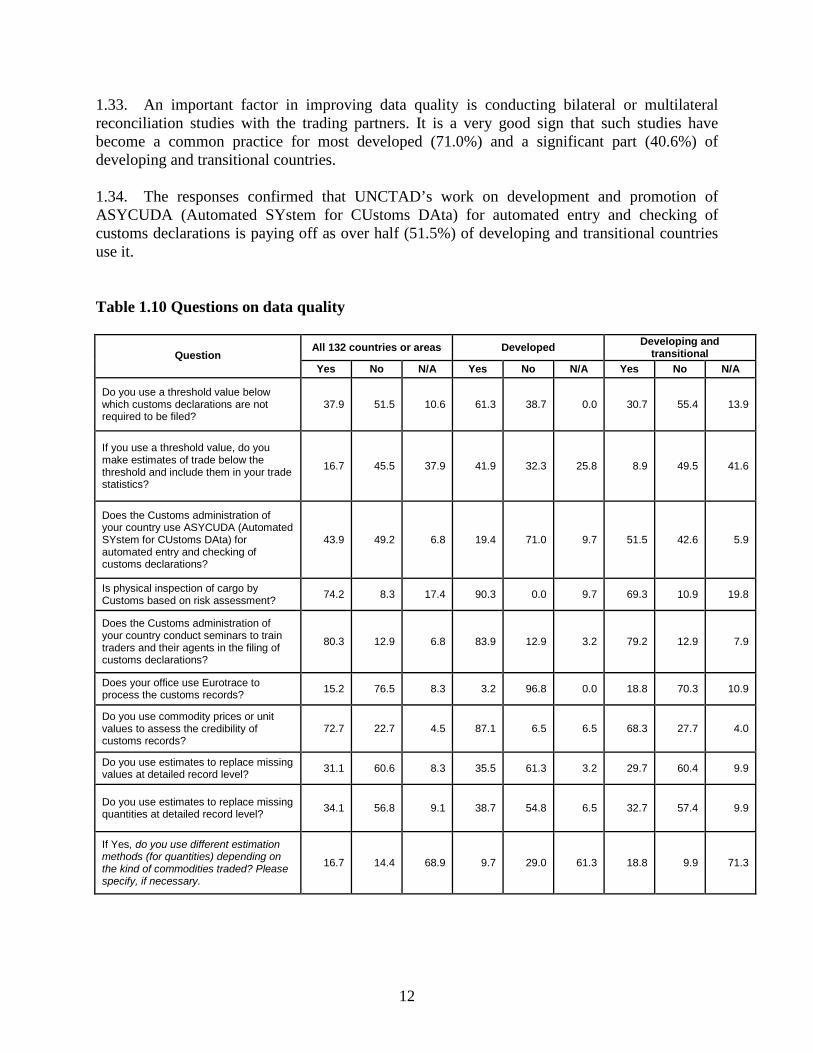
1.32. The use of carefully prepared estimates to replace missing values and quantities isencouraged by the IMTS: Compilers Manual. Yet, currently this is not a common practice asonly about every third country is doing it (31.1% for missing values and 34.1% for missingquantities). Less than half (41.9%) of developed countries make estimates of trade below themandatory declaration threshold and include them in their trade statistics while this is being doneonly by 8.9% of developing and transitional countries.
12
1.33. An important factor in improving data quality is conducting bilateral or multilateralreconciliation studies with the trading partners. It is a very good sign that such studies havebecome a common practice for most developed (71.0%) and a significant part (40.6%) ofdeveloping and transitional countries.
1.34. The responses confirmed that UNCTAD’s work on development and promotion ofASYCUDA (Automated SYstem for CUstoms DAta) for automated entry and checking ofcustoms declarations is paying off as over half (51.5%) of developing and transitional countriesuse it.
Table 1.10 Questions on data quality
All 132 countries or areas DevelopedDeveloping and
transitionalQuestion
Yes No N/A Yes No N/A Yes No N/A
Do you use a threshold value belowwhich customs declarations are notrequired to be filed?
37.9 51.5 10.6 61.3 38.7 0.0 30.7 55.4 13.9
If you use a threshold value, do youmake estimates of trade below thethreshold and include them in your tradestatistics?
16.7 45.5 37.9 41.9 32.3 25.8 8.9 49.5 41.6
Does the Customs administration ofyour country use ASYCUDA (AutomatedSYstem for CUstoms DAta) forautomated entry and checking ofcustoms declarations?
43.9 49.2 6.8 19.4 71.0 9.7 51.5 42.6 5.9
Is physical inspection of cargo byCustoms based on risk assessment?
74.2 8.3 17.4 90.3 0.0 9.7 69.3 10.9 19.8
Does the Customs administration ofyour country conduct seminars to traintraders and their agents in the filing ofcustoms declarations?
80.3 12.9 6.8 83.9 12.9 3.2 79.2 12.9 7.9
Does your office use Eurotrace toprocess the customs records?
15.2 76.5 8.3 3.2 96.8 0.0 18.8 70.3 10.9
Do you use commodity prices or unitvalues to assess the credibility ofcustoms records?
72.7 22.7 4.5 87.1 6.5 6.5 68.3 27.7 4.0
Do you use estimates to replace missingvalues at detailed record level?
31.1 60.6 8.3 35.5 61.3 3.2 29.7 60.4 9.9
Do you use estimates to replace missingquantities at detailed record level?
34.1 56.8 9.1 38.7 54.8 6.5 32.7 57.4 9.9
If Yes, do you use different estimationmethods (for quantities) depending onthe kind of commodities traded? Pleasespecify, if necessary.
16.7 14.4 68.9 9.7 29.0 61.3 18.8 9.9 71.3
13
Since the year 2000, did you conductbilateral or multilateral reconciliationstudies with your trading partners or doyou plan to conduct such studies in thenear future?
47.7 40.2 12.1 71.0 29.0 0.0 40.6 43.6 15.8
M. Trade by mode of transport
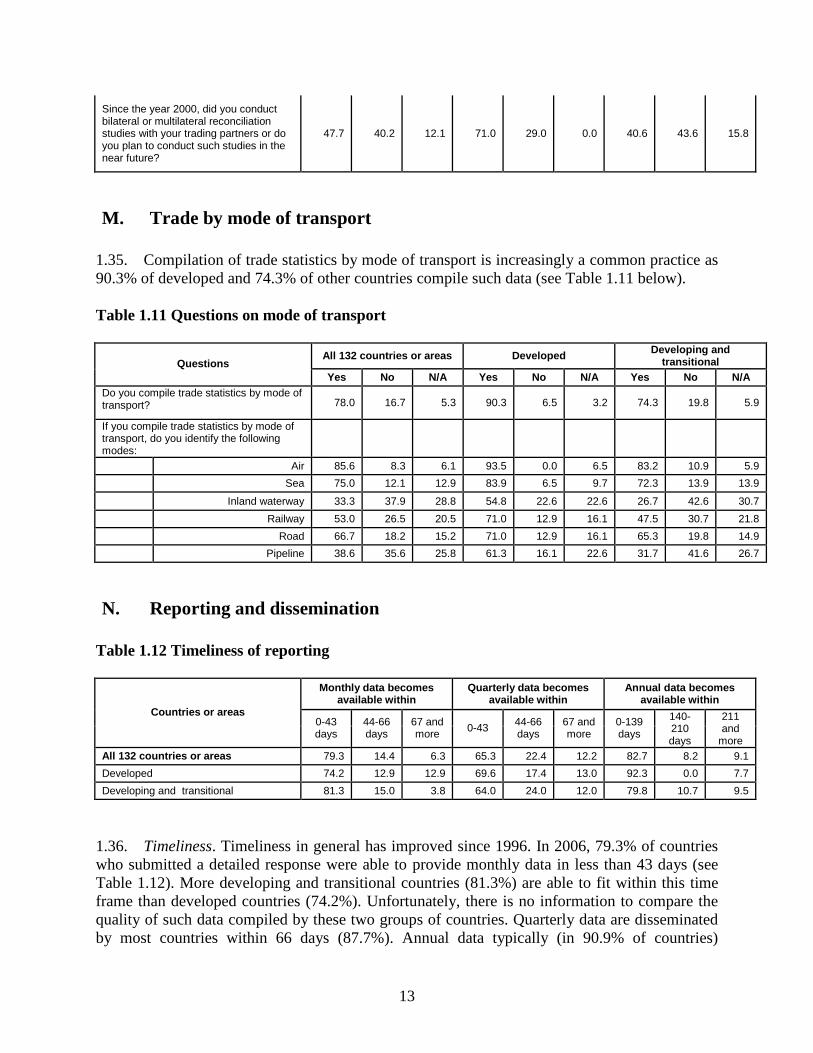
1.35. Compilation of trade statistics by mode of transport is increasingly a common practice as90.3% of developed and 74.3% of other countries compile such data (see Table 1.11 below).
Table 1.11 Questions on mode of transport
All 132 countries or areas DevelopedDeveloping and
transitionalQuestions
Yes No N/A Yes No N/A Yes No N/A
Do you compile trade statistics by mode oftransport? 78.0 16.7 5.3 90.3 6.5 3.2 74.3 19.8 5.9
If you compile trade statistics by mode oftransport, do you identify the followingmodes:
Air 85.6 8.3 6.1 93.5 0.0 6.5 83.2 10.9 5.9
Sea 75.0 12.1 12.9 83.9 6.5 9.7 72.3 13.9 13.9
Inland waterway 33.3 37.9 28.8 54.8 22.6 22.6 26.7 42.6 30.7
Railway 53.0 26.5 20.5 71.0 12.9 16.1 47.5 30.7 21.8
Road 66.7 18.2 15.2 71.0 12.9 16.1 65.3 19.8 14.9
Pipeline 38.6 35.6 25.8 61.3 16.1 22.6 31.7 41.6 26.7
N. Reporting and dissemination
Table 1.12 Timeliness of reporting
Monthly data becomesavailable within
Quarterly data becomesavailable within
Annual data becomesavailable within
Countries or areas0-43days
44-66days
67 andmore
0-4344-66days
67 andmore
0-139days
140-210days
211and
more
All 132 countries or areas 79.3 14.4 6.3 65.3 22.4 12.2 82.7 8.2 9.1
Developed 74.2 12.9 12.9 69.6 17.4 13.0 92.3 0.0 7.7
Developing and transitional 81.3 15.0 3.8 64.0 24.0 12.0 79.8 10.7 9.5
1.36. Timeliness. Timeliness in general has improved since 1996. In 2006, 79.3% of countrieswho submitted a detailed response were able to provide monthly data in less than 43 days (seeTable 1.12). More developing and transitional countries (81.3%) are able to fit within this timeframe than developed countries (74.2%). Unfortunately, there is no information to compare thequality of such data compiled by these two groups of countries. Quarterly data are disseminatedby most countries within 66 days (87.7%). Annual data typically (in 90.9% of countries)
14
becomes available within 210 days. It follows that timeliness of external trade statistics, in mostcases, complies or even exceeds normally recommended guidelines for economic statistics.
1.37. It should be noted that international reporting as manifested in the provision of annualdata to UN Comtrade lags significantly behind the data availability reported by countries in thisquestionnaire.
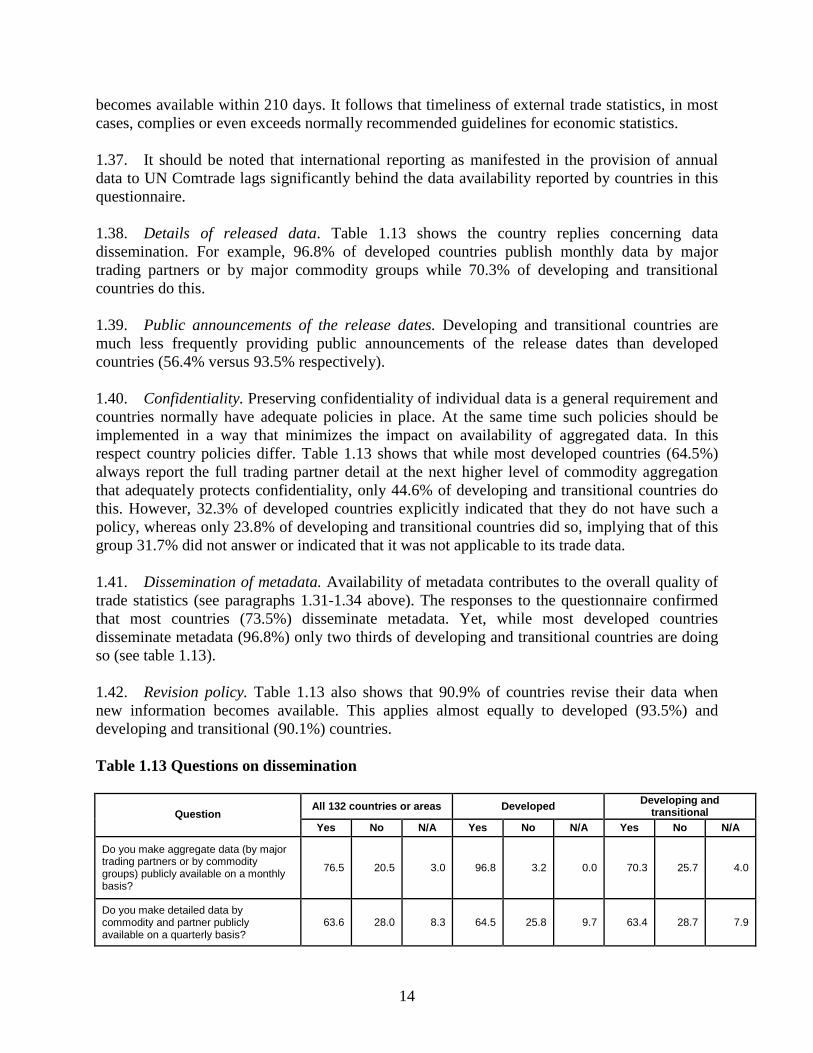
1.38. Details of released data. Table 1.13 shows the country replies concerning datadissemination. For example, 96.8% of developed countries publish monthly data by majortrading partners or by major commodity groups while 70.3% of developing and transitionalcountries do this.
1.39. Public announcements of the release dates. Developing and transitional countries aremuch less frequently providing public announcements of the release dates than developedcountries (56.4% versus 93.5% respectively).
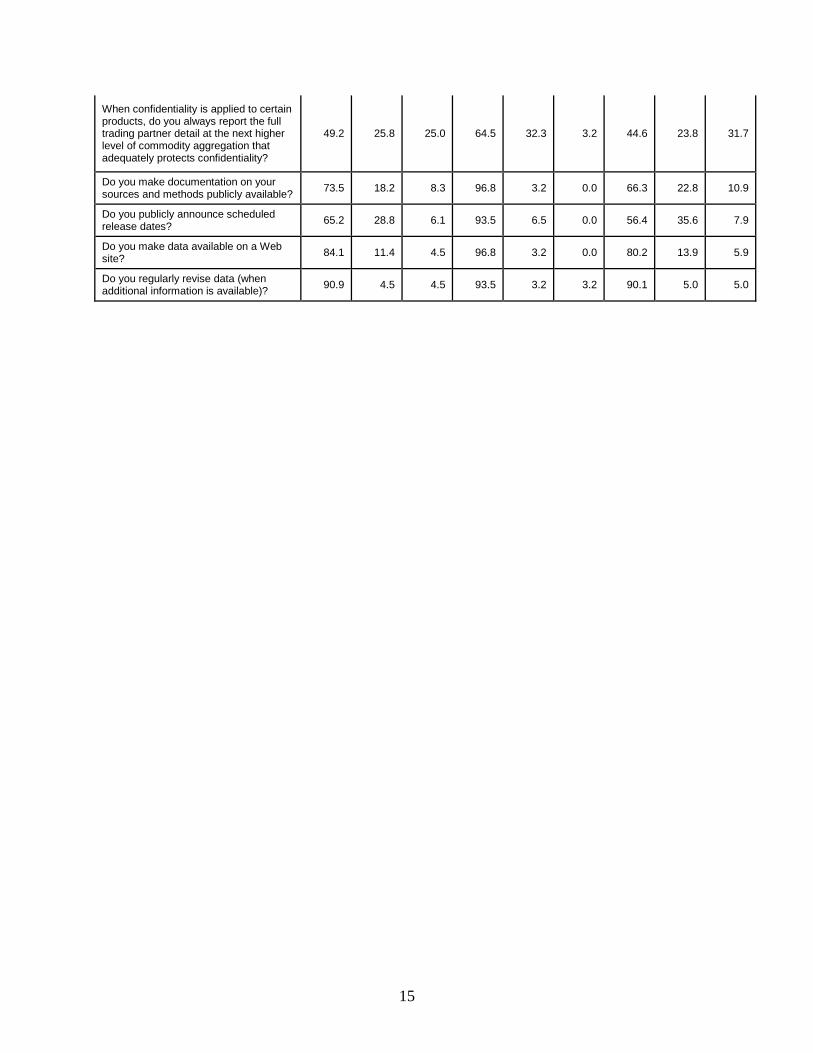
1.40. Confidentiality. Preserving confidentiality of individual data is a general requirement andcountries normally have adequate policies in place. At the same time such policies should beimplemented in a way that minimizes the impact on availability of aggregated data. In thisrespect country policies differ. Table 1.13 shows that while most developed countries (64.5%)always report the full trading partner detail at the next higher level of commodity aggregationthat adequately protects confidentiality, only 44.6% of developing and transitional countries dothis. However, 32.3% of developed countries explicitly indicated that they do not have such apolicy, whereas only 23.8% of developing and transitional countries did so, implying that of thisgroup 31.7% did not answer or indicated that it was not applicable to its trade data.
1.41. Dissemination of metadata. Availability of metadata contributes to the overall quality oftrade statistics (see paragraphs 1.31-1.34 above). The responses to the questionnaire confirmedthat most countries (73.5%) disseminate metadata. Yet, while most developed countriesdisseminate metadata (96.8%) only two thirds of developing and transitional countries are doingso (see table 1.13).
1.42. Revision policy. Table 1.13 also shows that 90.9% of countries revise their data whennew information becomes available. This applies almost equally to developed (93.5%) anddeveloping and transitional (90.1%) countries.
Table 1.13 Questions on dissemination
All 132 countries or areas DevelopedDeveloping and
transitionalQuestion
Yes No N/A Yes No N/A Yes No N/A
Do you make aggregate data (by majortrading partners or by commoditygroups) publicly available on a monthlybasis?
76.5 20.5 3.0 96.8 3.2 0.0 70.3 25.7 4.0
Do you make detailed data bycommodity and partner publiclyavailable on a quarterly basis?
63.6 28.0 8.3 64.5 25.8 9.7 63.4 28.7 7.9
15
When confidentiality is applied to certainproducts, do you always report the fulltrading partner detail at the next higherlevel of commodity aggregation thatadequately protects confidentiality?
49.2 25.8 25.0 64.5 32.3 3.2 44.6 23.8 31.7
Do you make documentation on yoursources and methods publicly available?
73.5 18.2 8.3 96.8 3.2 0.0 66.3 22.8 10.9
Do you publicly announce scheduledrelease dates?
65.2 28.8 6.1 93.5 6.5 0.0 56.4 35.6 7.9
Do you make data available on a Website?
84.1 11.4 4.5 96.8 3.2 0.0 80.2 13.9 5.9
Do you regularly revise data (whenadditional information is available)?
90.9 4.5 4.5 93.5 3.2 3.2 90.1 5.0 5.0
16
Annex 1 Distribution of responses with respect to goods recommended for inclusion
All 132 countries or areas DevelopedDeveloping and
transitionalQuestion
Yes No N/A Yes No N/A Yes No N/A
Do you INCLUDE in trade statistics the following:
non-monetary gold 86.4 10.6 3.0 96.8 3.2 0.0 83.2 12.9 4.0
goods for processing (i.e., goods sentabroad or brought into your country forprocessing, including processing undercontract and processing under the inwardprocessing procedure)
82.6 9.1 8.3 96.8 0.0 3.2 78.2 11.9 9.9
goods dispatched through postal or courierservices
82.6 12.9 4.5 96.8 3.2 0.0 78.2 15.8 5.9
waste and scrap, the value of which ispositive
81.8 9.8 8.3 93.5 6.5 0.0 78.2 10.9 10.9
goods traded on government account 80.3 14.4 5.3 93.5 3.2 3.2 76.2 17.8 5.9
goods used as carriers of information andsoftware developed for general orcommercial use (e.g., packaged setscontaining CD-ROM or DVD with storedcomputer software and/or data); Note: thiscategory excl
76.5 15.2 8.3 90.3 9.7 0.0 72.3 16.8 10.9
food and other humanitarian aid 75.8 22.0 2.3 64.5 35.5 0.0 79.2 17.8 3.0
goods which cross borders as a result oftransactions between parent corporationsand their direct investment enterprises(affiliates/branches)
75.0 13.6 11.4 100.0 0.0 0.0 67.3 17.8 14.9
ships, aircraft and other mobile equipment 75.0 18.2 6.8 96.8 3.2 0.0 68.3 22.8 8.9
returned goods 71.2 16.7 12.1 96.8 3.2 0.0 63.4 20.8 15.8
electricity and gas 68.2 15.9 15.9 90.3 3.2 6.5 61.4 19.8 18.8
goods under financial lease (i.e., a lease ofone year or more)
66.7 22.7 10.6 96.8 3.2 0.0 57.4 28.7 13.9
goods traded in accordance with barteragreements
61.4 27.3 11.4 90.3 3.2 6.5 52.5 34.7 12.9
gifts, if to significant scale as defined bynational law
60.6 28.8 10.6 58.1 38.7 3.2 61.4 25.7 12.9
goods for military use 59.8 32.6 7.6 90.3 6.5 3.2 50.5 40.6 8.9
empty bottles not meant for refilling 59.1 25.8 15.2 67.7 22.6 9.7 56.4 26.7 16.8
goods on consignment 57.6 28.0 14.4 74.2 16.1 9.7 52.5 31.7 15.8
unissued banknotes and securities, andcoins not in circulation
54.5 38.6 6.8 74.2 22.6 3.2 48.5 43.6 7.9
fish catch, minerals from the seabed andsalvage landed from foreign vessels innational ports
54.5 27.3 18.2 80.6 3.2 16.1 46.5 34.7 18.8
goods acquired by all categories oftravellers, including non-resident workers,to a significant scale (i.e., excluding goodsfor their own use) as defined by nationallaw; for example, so-called Shuttle Trade
51.5 37.1 11.4 35.5 58.1 6.5 56.4 30.7 12.9
17
All 132 countries or areas DevelopedDeveloping and
transitionalQuestion
Yes No N/A Yes No N/A Yes No N/A
bunkers, stores, ballast and dunnagesupplied to foreign vessels/aircraft in theeconomic territory of your country
51.5 35.6 12.9 58.1 35.5 6.5 49.5 35.6 14.9
water 47.0 28.0 25.0 71.0 12.9 16.1 39.6 32.7 27.7
migrants' effects 47.0 41.7 11.4 19.4 74.2 6.5 55.4 31.7 12.9
fish catch, minerals from the seabed andsalvage acquired by national vessels onthe high seas from foreign vessels
42.4 37.9 19.7 64.5 19.4 16.1 35.6 43.6 20.8
goods transferred from or to a buffer stockorganization
39.4 27.3 33.3 61.3 16.1 22.6 32.7 30.7 36.6
local border trade 37.1 49.2 13.6 45.2 38.7 16.1 34.7 52.5 12.9
goods delivered from the rest of the worldto offshore installations located in theeconomic territory of your country, andgoods dispatched to the rest of the worldfrom offshore installations located in theeconomic territory of your country
34.1 39.4 26.5 51.6 12.9 35.5 28.7 47.5 23.8
goods seized by customs andsubsequently resold
33.3 48.5 18.2 29.0 54.8 16.1 34.7 46.5 18.8
bunkers, stores, ballast and dunnagelanded in national ports from foreignvessels/aircraft
32.6 40.9 26.5 29.0 45.2 25.8 33.7 39.6 26.7
bunkers, stores, ballast and dunnageacquired by national vessels/aircraft fromforeign vessels/aircraft in the economicterritory of your country
28.0 45.5 26.5 22.6 54.8 22.6 29.7 42.6 27.7
estimates of unrecorded trade 13.6 70.5 15.9 22.6 71.0 6.5 10.9 70.3 18.8
18
Annex 2 Distribution of responses with respect to goods recommended for exclusion
All 132 countries or areas DevelopedDeveloping and
transitionalQuestion
Yes No N/A Yes No N/A Yes No N/A
Do you EXCLUDE from trade statistics the following:
issued banknotes and securities and coinsin circulation
86.4 9.1 4.5 96.8 3.2 0.0 83.2 10.9 5.9
goods in transit 81.8 11.4 6.8 96.8 3.2 0.0 77.2 13.9 8.9
monetary gold (i.e., that gold which isexchanged between national orinternational monetary authorities orauthorized banks)
79.5 12.1 8.3 96.8 3.2 0.0 74.3 14.9 10.9
goods acquired by all categories oftravelers, including non-resident workers,for their own use and carried across theborder in amounts or values not exceedingthose established by national law
76.5 14.4 9.1 96.8 3.2 0.0 70.3 17.8 11.9
goods moving between your country andterritorial enclaves of your country in othercountries (e.g., your embassies, military orother installations)
75.8 12.1 12.1 87.1 12.9 0.0 72.3 11.9 15.8
goods purchased by foreign embassies,military or other installations located inyour country, for their own use
73.5 15.2 11.4 87.1 12.9 0.0 69.3 15.8 14.9
goods temporarily admitted or dispatched 72.7 18.9 8.3 93.5 6.5 0.0 66.3 22.8 10.9
goods under operational lease (i.e., alease of less than one year)
72.7 13.6 13.6 96.8 3.2 0.0 65.3 16.8 17.8
goods which are acquired and relinquishedwithin your country, by non-residents,within the same recording period, andwhich do not cross the frontiers of thecountry
72.0 12.1 15.9 96.8 3.2 0.0 64.4 14.9 20.8
non-financial assets, ownership of whichhas been transferred from residents tonon-residents, without crossing borders
68.9 11.4 19.7 96.8 3.2 0.0 60.4 13.9 25.7
goods which left the economic territory ofthe exporting country but lost or destroyedbefore entering the economic territory ofyour country
67.4 14.4 18.2 87.1 9.7 3.2 61.4 15.8 22.8
newspapers and periodicals sent underdirect subscription
65.2 22.0 12.9 71.0 29.0 0.0 63.4 19.8 16.8
empty bottles which are returned to berefilled
62.1 25.0 12.9 77.4 19.4 3.2 57.4 26.7 15.8
waste and scrap having no positive value 62.1 26.5 11.4 77.4 19.4 3.2 57.4 28.7 13.9
fish caught on the high seas by nationalvessels of your country and landed in itseconomic territory
59.1 14.4 26.5 61.3 22.6 16.1 58.4 11.9 29.7
19
All 132 countries or areas DevelopedDeveloping and
transitionalQuestion
Yes No N/A Yes No N/A Yes No N/A
goods purchased by internationalorganizations located in the economicterritory of your country, from your country,for their own use;
53.0 27.3 19.7 58.1 32.3 9.7 51.5 25.7 22.8
goods entering or leaving the economicterritory of your country illegally;
50.0 23.5 26.5 54.8 25.8 19.4 48.5 22.8 28.7
bunkers, stores, ballast and dunnage thatare acquired by national vessels/aircraftoutside the economic territory of yourcountry;
47.7 22.7 29.5 61.3 22.6 16.1 43.6 22.8 33.7
goods for repair; 47.7 37.1 15.2 58.1 35.5 6.5 44.6 37.6 17.8
bunkers, stores, ballast and dunnage thatare supplied by national vessels/aircraft toforeign vessels/aircraft outside theeconomic territory of your country orlanded in foreign ports from national ves
43.2 24.2 32.6 38.7 38.7 22.6 44.6 19.8 35.6
mobile equipment that changes ownershipwhile outside the country of residence ofits original owner;
40.9 31.8 27.3 29.0 61.3 9.7 44.6 22.8 32.7
fish catch, minerals from the seabed andsalvage sold from national vessels inforeign ports or from national vessels onthe high seas to foreign vessels;
34.8 30.3 34.8 22.6 54.8 22.6 38.6 22.8 38.6
goods exported from your country but lostor destroyed after ownership has beenacquired by the importer;
31.1 47.0 22.0 32.3 58.1 9.7 30.7 43.6 25.7
any category of used or second-handgoods ?
14.4 63.6 22.0 3.2 90.3 6.5 17.8 55.4 26.7
20
Annex 3 Comparison of responses in 1996 and 2006 versions of the questionnaire
1996 2006Questions
Distribution of responsesby region (in %) Yes No N/A Yes No N/A
Difference
Do you INCLUDE in trade statistics:
non-monetary gold
All respondents 77.7 17.6 4.7 86.4 10.6 3.0 8.7
Developed economies 81.8 18.2 0.0 96.8 3.2 0.0 15.0
Developing and transitional 76.5 17.4 6.1 83.2 12.9 4.0 6.7
goods traded on government account
All respondents 79.7 14.9 5.4 80.3 14.4 5.3 0.6
Developed economies 84.8 12.1 3.0 93.5 3.2 3.2 8.7
Developing and transitional 78.3 15.7 6.1 76.2 17.8 5.9 -2.1
goods for military use
All respondents 50.0 42.6 7.4 59.8 32.6 7.6 9.8
Developed economies 84.8 12.1 3.0 90.3 6.5 3.2 5.5
Developing and transitional 40.0 51.3 8.7 50.5 40.6 8.9 10.5
electricity and gas (and water for 1996 results only)
All respondents 74.3 18.9 6.8 68.2 15.9 15.9 -6.1
Developed economies 93.9 3.0 3.0 90.3 3.2 6.5 -3.6
Developing and transitional 68.7 23.5 7.8 61.4 19.8 18.8 -7.3
goods dispatched through postal or courier services
All respondents 75.7 20.9 3.4 82.6 12.9 4.5 6.9
Developed economies 97.0 3.0 0.0 96.8 3.2 0.0 -0.2
Developing and transitional 69.6 26.1 4.3 78.2 15.8 5.9 8.6
ships, aircraft (and other mobile equipment for 2006 results only)
All respondents 52.7 37.8 9.5 75.0 18.2 6.8 22.3
Developed economies 69.7 27.3 3.0 96.8 3.2 0.0 27.1
Developing and transitional 47.8 40.9 11.3 68.3 22.8 8.9 20.5
goods delivered from the rest of the world to offshore installations located in the economic territory
of your country, and goods dispatched to the rest of the world from offshore installations located
in the economic territory of your country
All respondents 27.0 54.1 18.9 34.1 39.4 26.5 7.1
Developed economies 57.6 27.3 15.2 51.6 12.9 35.5 -6.0
Developing and transitional 18.3 61.7 20.0 28.7 47.5 23.8 10.4
bunkers, stores, ballast and dunnage supplied to foreign vessels/aircraft
in the economic territory of your country
All respondents 49.3 43.2 7.4 51.5 35.6 12.9 2.2
Developed economies 51.5 45.5 3.0 58.1 35.5 6.5 6.6
Developing and transitional 48.7 42.6 8.7 49.5 35.6 14.9 0.8
21
1996 2006Questions
Distribution of responsesby region (in %) Yes No N/A Yes No N/A
Difference
bunkers, stores, ballast and dunnage landed in national ports from foreign vessels/aircraft
All respondents 38.5 51.4 10.1 32.6 40.9 26.5 -5.9
Developed economies 54.5 39.4 6.1 29.0 45.2 25.8 -25.5
Developing and transitional 33.9 54.8 11.3 33.7 39.6 26.7 -0.2
fish catch, minerals from the seabed and salvage landed from foreign vessels in national ports
All respondents 50.7 35.8 13.5 54.5 27.3 18.2 3.8
Developed economies 84.8 9.1 6.1 80.6 3.2 16.1 -4.2
Developing and transitional 40.9 43.5 15.7 46.5 34.7 18.8 5.6
fish catch, minerals from the seabed and salvage acquired by national vessels on the high seas
from foreign vessels
All respondents 33.8 48.6 17.6 42.4 37.9 19.7 8.6
Developed economies 48.5 36.4 15.2 64.5 19.4 16.1 16.0
Developing and transitional 29.6 52.2 18.3 35.6 43.6 20.8 6.0
goods for processing
All respondents 84.5 8.8 6.8 82.6 9.1 8.3 -1.9
Developed economies 100.0 0.0 0.0 96.8 0.0 3.2 -3.2
Developing and transitional 80.0 11.3 8.7 78.2 11.9 9.9 -1.8
goods under financial lease
All respondents 62.2 29.7 8.1 66.7 22.7 10.6 4.5
Developed economies 87.9 12.1 0.0 96.8 3.2 0.0 8.9
Developing and transitional 54.8 34.8 10.4 57.4 28.7 13.9 2.6
goods traded in accordance with barter agreements
All respondents 57.4 36.5 6.1 61.4 27.3 11.4 4.0
Developed economies 90.9 6.1 3.0 90.3 3.2 6.5 -0.6
Developing and transitional 47.8 45.2 7.0 52.5 34.7 12.9 4.7
food and other humanitarian aid
All respondents 63.5 32.4 4.1 75.8 22.0 2.3 12.3
Developed economies 69.7 30.3 0.0 64.5 35.5 0.0 -5.2
Developing and transitional 61.7 33.0 5.2 79.2 17.8 3.0 17.5
local border trade
All respondents 36.5 53.4 10.1 37.1 49.2 13.6 0.6
Developed economies 45.5 36.4 18.2 45.2 38.7 16.1 -0.3
Developing and transitional 33.9 58.3 7.8 34.7 52.5 12.9 0.8
Do you EXCLUDE from trade statistics:
goods in transit
All respondents 70.9 10.8 18.2 81.8 11.4 6.8 10.9
Developed economies 90.9 3.0 6.1 96.8 3.2 0.0 5.9
Developing and transitional 65.2 13.0 21.7 77.2 13.9 8.9 12.0

22
1996 2006Questions
Distribution of responsesby region (in %) Yes No N/A Yes No N/A
Difference
goods entering or leaving the economic territory of your country illegally
All respondents 83.1 10.1 6.8 50.0 23.5 26.5 -33.1
Developed economies 87.9 9.1 3.0 54.8 25.8 19.4 -33.1
Developing and transitional 81.7 10.4 7.8 48.5 22.8 28.7 -33.2
monetary gold
All respondents 78.4 13.5 8.1 79.5 12.1 8.3 1.1
Developed economies 90.9 9.1 0.0 96.8 3.2 0.0 5.9
Developing and transitional 74.8 14.8 10.4 74.3 14.9 10.9 -0.5
fish catch, minerals from the seabed and salvage sold from national vessels in foreign ports or
from national vessels on the high seas to foreign vessels
All respondents 59.5 25.7 14.9 34.8 30.3 34.8 -24.7
Developed economies 54.5 36.4 9.1 22.6 54.8 22.6 -31.9
Developing and transitional 60.9 22.6 16.5 38.6 22.8 38.6 -22.3
goods under operational lease
All respondents 63.5 27.7 8.8 72.7 13.6 13.6 9.2
Developed economies 78.8 21.2 0.0 96.8 3.2 0.0 18.0
Developing and transitional 59.1 29.6 11.3 65.3 16.8 17.8 6.2
goods for repair
All respondents 44.6 45.9 9.5 47.7 37.1 15.2 3.1
Developed economies 48.5 51.5 0.0 58.1 35.5 6.5 9.6
Developing and transitional 43.5 44.3 12.2 44.6 37.6 17.8 1.1
goods temporarily admitted or dispatched
All respondents 61.5 30.4 8.1 72.7 18.9 8.3 11.2
Developed economies 72.7 24.2 3.0 93.5 6.5 0.0 20.8
Developing and transitional 58.3 32.2 9.6 66.3 22.8 10.9 8.0
Valuation
Is the statistical value of imported goods a CIF-type value?
All respondents 90.5 6.1 3.4 92.4 6.1 1.5 1.9
Developed economies 93.9 6.1 0.0 93.5 6.5 0.0 -0.4
Developing and transitional 89.6 6.1 4.3 92.1 5.9 2.0 2.5
Is the statistical value of exported goods an FOB-type value?
All respondents 94.6 2.0 3.4 96.2 2.3 1.5 1.6
Developed economies 97.0 3.0 0.0 96.8 3.2 0.0 -0.2
Developing and transitional 93.9 1.7 4.3 96.0 2.0 2.0 2.1
Do you use the exchange rate which is in effect at the date of exportation or importation?
All respondents 52.7 25.7 21.6 63.6 20.5 15.9 10.9
Developed economies 45.5 45.5 9.1 45.2 29.0 25.8 -0.3
Developing and transitional 54.8 20.0 25.2 69.3 17.8 12.9 14.5
23
1996 2006Questions
Distribution of responsesby region (in %) Yes No N/A Yes No N/A
Difference
Are data for international freight and insurance associated with the importation of goods available separately?
All respondents 29.7 65.5 4.7 42.4 56.1 1.5 12.7
Developed economies 42.4 57.6 0.0 25.8 74.2 0.0 -16.6
Developing and transitional 26.1 67.8 6.1 47.5 50.5 2.0 21.4
Partner country
Do you compile import statistics by:
country of origin?
All respondents 81.8 14.9 3.4 90.2 7.6 2.3 8.4
Developed economies 93.9 6.1 0.0 96.8 3.2 0.0 2.9
Developing and transitional 78.3 17.4 4.3 88.1 8.9 3.0 9.8
country of consignment?
All respondents 50.0 44.6 5.4 47.0 46.2 6.8 -3.0
Developed economies 60.6 39.4 0.0 77.4 22.6 0.0 16.8
Developing and transitional 47.0 46.1 7.0 37.6 53.5 8.9 -9.4
Do you compile export statistics by:
country of last known destination?
All respondents 87.8 7.4 4.7 90.9 6.1 3.0 3.1
Developed economies 97.0 3.0 0.0 93.5 6.5 0.0 -3.5
Developing and transitional 85.2 8.7 6.1 90.1 5.9 4.0 4.9
Commodity classifications and quantity measurements
Do you use the Harmonized System (HS) as the basis for your detailed commodity trade database?
All respondents 72.3 8.8 18.9 93.9 3.0 3.0 21.6
Developed economies 90.9 3.0 6.1 96.8 3.2 0.0 5.9
Developing and transitional 67.0 10.4 22.6 93.1 3.0 4.0 26.1
Do you collect quantity data?
All respondents 79.7 2.0 18.2 92.4 4.5 3.0 12.7
Developed economies 93.9 0.0 6.1 100.0 0.0 0.0 6.1
Developing and transitional 75.7 2.6 21.7 90.1 5.9 4.0 14.4
Do you record or estimate net weight for quantity measurement of all commodities, where applicable?
All respondents 52.7 28.4 18.9 73.5 22.7 3.8 20.8
Developed economies 69.7 21.2 9.1 71.0 29.0 0.0 1.3
Developing and transitional 47.8 30.4 21.7 74.3 20.8 5.0 26.5