Embed Size (px)
Citation preview

NASA/TM-2002-210729
An Overview of Flight Test Results for a Formation Flight Autopilot
Curtis E. Hanson, Jack Ryan, Michael J. Allen, and Steven R. JacobsonNASA Dryden Flight Research CenterEdwards, California
August 2002

The NASA STI Program Office…in Profile
Since its founding, NASA has been dedicatedto the advancement of aeronautics and space science. The NASA Scientific and Technical Information (STI) Program Office plays a keypart in helping NASA maintain thisimportant role.
The NASA STI Program Office is operated byLangley Research Center, the lead center forNASA’s scientific and technical information.The NASA STI Program Office provides access to the NASA STI Database, the largest collectionof aeronautical and space science STI in theworld. The Program Office is also NASA’s institutional mechanism for disseminating theresults of its research and development activities. These results are published by NASA in theNASA STI Report Series, which includes the following report types:
• TECHNICAL PUBLICATION. Reports of completed research or a major significantphase of research that present the results of NASA programs and include extensive dataor theoretical analysis. Includes compilations of significant scientific and technical data and information deemed to be of continuing reference value. NASA’s counterpart of peer-reviewed formal professional papers but has less stringent limitations on manuscriptlength and extent of graphic presentations.
• TECHNICAL MEMORANDUM. Scientificand technical findings that are preliminary orof specialized interest, e.g., quick releasereports, working papers, and bibliographiesthat contain minimal annotation. Does notcontain extensive analysis.
• CONTRACTOR REPORT. Scientific and technical findings by NASA-sponsored contractors and grantees.
• CONFERENCE PUBLICATION. Collected papers from scientific andtechnical conferences, symposia, seminars,or other meetings sponsored or cosponsoredby NASA.
• SPECIAL PUBLICATION. Scientific,technical, or historical information fromNASA programs, projects, and mission,often concerned with subjects havingsubstantial public interest.
• TECHNICAL TRANSLATION. English- language translations of foreign scientific and technical material pertinent toNASA’s mission.
Specialized services that complement the STIProgram Office’s diverse offerings include creating custom thesauri, building customizeddatabases, organizing and publishing researchresults…even providing videos.
For more information about the NASA STIProgram Office, see the following:
• Access the NASA STI Program Home Pageat
http://www.sti.nasa.gov
• E-mail your question via the Internet to [email protected]
• Fax your question to the NASA Access HelpDesk at (301) 621-0134
• Telephone the NASA Access Help Desk at(301) 621-0390
• Write to:NASA Access Help DeskNASA Center for AeroSpace Information7121 Standard DriveHanover, MD 21076-1320

NASA/TM-2002-210729
An Overview of Flight Test Results for a Formation Flight Autopilot
Curtis E. Hanson, Jack Ryan, Michael J. Allen, and Steven R. JacobsonNASA Dryden Flight Research CenterEdwards, California
August 2002
National Aeronautics andSpace Administration
Dryden Flight Research CenterEdwards, California 93523-0273
NOTICE
Use of trade names or names of manufacturers in this document does not constitute an official endorsementof such products or manufacturers, either expressed or implied, by the National Aeronautics andSpace Administration.
Available from the following:
NASA Center for AeroSpace Information (CASI) National Technical Information Service (NTIS)7121 Standard Drive 5285 Port Royal RoadHanover, MD 21076-1320 Springfield, VA 22161-2171(301) 621-0390 (703) 487-4650
AN OVERVIEW OF FLIGHT TEST RESULTS FOR AFORMATION FLIGHT AUTOPILOT
Curtis E. Hanson,* Jack Ryan,† Michael J. Allen,‡ and Steven R. Jacobson§
NASA Dryden Flight Research CenterEdwards, California
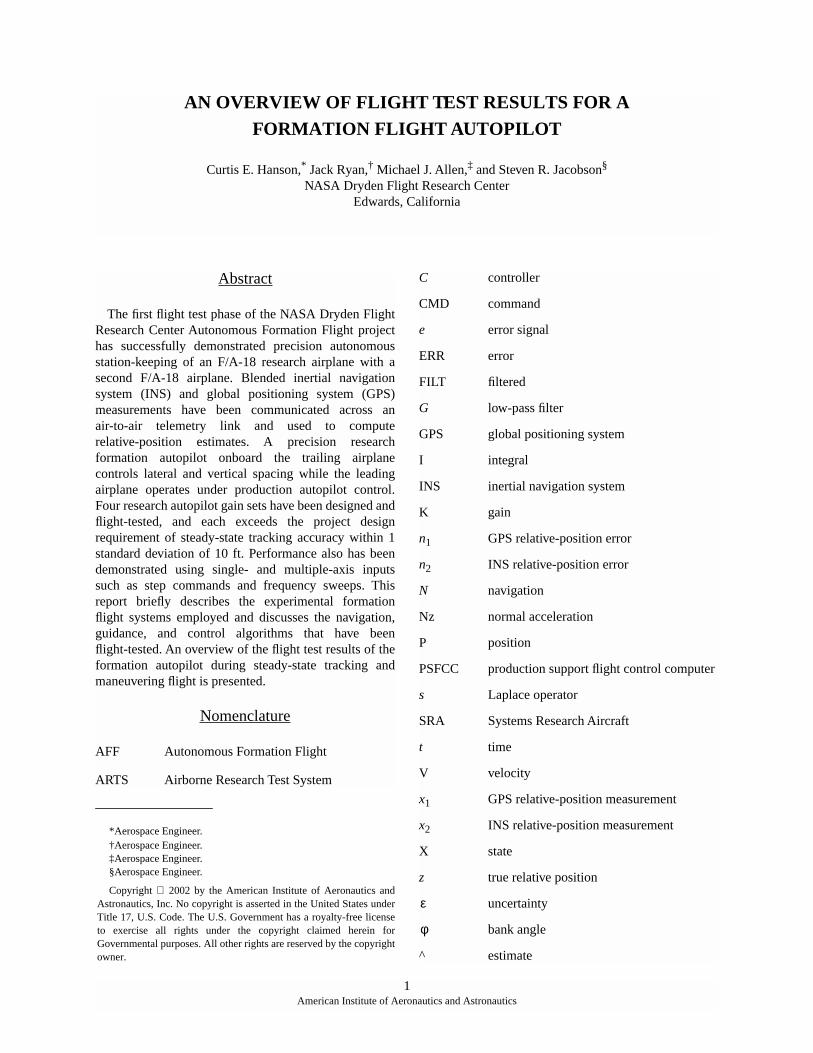
Abstract
The first flight test phase of the NASA Dryden FlightResearch Center Autonomous Formation Flight projecthas successfully demonstrated precision autonomousstation-keeping of an F/A-18 research airplane with asecond F/A-18 airplane. Blended inertial navigationsystem (INS) and global positioning system (GPS)measurements have been communicated across anair-to-air telemetry link and used to computerelative-position estimates. A precision researchformation autopilot onboard the trailing airplanecontrols lateral and vertical spacing while the leadingairplane operates under production autopilot control.Four research autopilot gain sets have been designed andflight-tested, and each exceeds the project designrequirement of steady-state tracking accuracy within 1standard deviation of 10 ft. Performance also has beendemonstrated using single- and multiple-axis inputssuch as step commands and frequency sweeps. Thisreport briefly describes the experimental formationflight systems employed and discusses the navigation,guidance, and control algorithms that have beenflight-tested. An overview of the flight test results of theformation autopilot during steady-state tracking andmaneuvering flight is presented.
Nomenclature
AFF Autonomous Formation Flight
ARTS Airborne Research Test System
1American Institute of Aero
*Aerospace Engineer.†Aerospace Engineer.‡Aerospace Engineer.§Aerospace Engineer.
Copyright 2002 by the American Institute of Aeronautics andAstronautics, Inc. No copyright is asserted in the United States underTitle 17, U.S. Code. The U.S. Government has a royalty-free licenseto exercise all rights under the copyright claimed herein forGovernmental purposes. All other rights are reserved by the copyrightowner.
C controller
CMD command
e error signal
ERR error
FILT filtered
G low-pass filter
GPS global positioning system
I integral
INS inertial navigation system
K gain
n1 GPS relative-position error
n2 INS relative-position error
N navigation
Nz normal acceleration
P position
PSFCC production support flight control computer
s Laplace operator
SRA Systems Research Aircraft
t time
V velocity
x1 GPS relative-position measurement
x2 INS relative-position measurement
X state
z true relative position
uncertainty
bank angle
^ estimate
ε
φ
nautics and Astronautics

Introduction
A formation autopilot capable of precisestation-keeping is required for applications such asformation flight drag reduction. Formation flight showssignificant promise to improve efficiency throughcooperative aircraft operations. In a manner similar tomigrating flocks of birds, aircraft in formation can takeadvantage of the vortex upwash created by the aircraftahead of them, allowing them to operate moreefficiently. Flight tests that showed drag reduction bymeasuring power reduction were first performed inGermany in 1990.1 Beukenberg and Hummelsuccessfully tested an optimization technique andmeasured an average power reduction of approximately10 percent.1, 2 One limitation of their approach was alack of intership communication that preventedcoordination among the aircraft within the formation.
The objective of the NASA Dryden Flight ResearchCenter (Edwards, California) Autonomous FormationFlight (AFF) project has been to develop and flight-testa formation autopilot system capable of achievingsustained drag reduction by exploiting robust intershipcommunication and precise formation navigation andcontrol. The AFF project had three planned phases;beginning with autonomous station-keeping withoutdrag reduction, then proceeding to the piloted mappingof wingtip vortex locations and effects, and finallyculminating with the testing of an autonomous dragreduction system. The project, however, was cancelledshortly after completion of the second phase.
The first phase of the AFF project, named “Phase 0,”has successfully demonstrated precision autonomousstation-keeping of two aircraft in flight. Although flightwithin the vortex was not the intention of this phase ofthe program, the station-keeping flight tests discussedherein are the first steps in that development. TwoNASA Dryden–owned F/A-18 (McDonnell DouglasCorporation, now The Boeing Company, St. Louis,Missouri; and Northrop Corporation, now NorthropGrumman, Newbury Park, California) research aircraftwere outfitted with identical global positioning system(GPS) receivers and an air-to-air telemetry system forintership communication. In addition, the trailingairplane was equipped with an experimental precisionformation autopilot control system. Using GPS andinertial measurement data from both aircraft, theexperimental system computed the equivalent of pilotstick commands to fly the trailing airplane to the desiredposition within the formation.
A total of 167 test points have been accomplished in11 research flights over a period of 2 months. Thisreport briefly describes the experimental formationflight systems employed and discusses the navigation,guidance, and control algorithms that were flight-tested.An overview of the flight test results of the formationautopilot during steady-state tracking and maneuveringflight is presented.
Note that use of trade names or names ofmanufacturers in this document does not constitute anofficial endorsement of such products or manufacturers,either expressed or implied, by the National Aeronauticsand Space Administration.
Research Objectives
The ultimate goal of the AFF project has been to bringAFF technology and its associated drag reductionbenefits to a readiness level that will be attractive tocommercial cargo operators and the military. Additionalapplications of AFF technology include autonomousaerial refueling, low-visibility formation separationassurance, and uninhabited combat air vehicle pack andswarm operations.
The objective of the initial phase (Phase 0) of the AFFresearch has been to reduce the programmatic risks forachieving drag reduction through autonomousformation flight. Although pilots regularly achieve veryaccurate formation spacing, an automatic system isdesirable for reducing pilot workload, particularly onlong-endurance missions. Data were sought regardingthe feasibility of using GPS for formation navigationand the achievable control precision of a formationautopilot.
Phase 0 of the experiment evaluated a wide range offormation autopilot performance and robustness levelsto provide guidance to future formation flight controlsystem designers. Flight test measurements also helpedvalidate and improve the project design tools inpreparation for the next phases of the project. Much ofthe systems integration effort accomplished and testedby NASA Dryden during Phase 0 was also to be usedfor the planned drag reduction tests.
Design Requirements
The formation autopilot controlled only the lateraland vertical motion of the airplane because hardwarerestrictions limited the number of available commandoutputs to two. The primary design goal has been toachieve precision tracking during steady, level flight.
2American Institute of Aeronautics and Astronautics

Performance requirements for the formation autopilotspecify that the formation control accuracy be within 1standard deviation of 10 ft. This position-error budget ispartitioned into two categories: navigation uncertainty,and controller performance. These two random anduncorrelated error sources are combined as the root ofthe sum of their squares:
(1)
where is the total uncertainty, is the navigationuncertainty, and is the uncertainty in controllerperformance. Navigation uncertainty has been allocated±4 ft based upon the results of preliminary pilotedrisk-reduction flight tests. The remaining approximately±9 ft of position error is the performance design goal ofthe formation autopilot.
Three levels of stability robustness requirements(table 1) have been defined to allow the full range offormation autopilot performance levels to be evaluated.The high and medium categories are based upon themilitary specification3 robustness requirements formodes greater and less than 0.06 Hz, respectively. Thelow category is consistent with the minimumflight-demonstrated margins for the X-29 aircraft.4
The NASA Dryden F/A-18 “Class B” flight envelopedefines operational limits within which simulationanalysis has shown that any combination of fullydeflected control surfaces will not cause structuraldamage to the aircraft nor put the aircraft in anunrecoverable condition. This envelope is bounded by amaximum airspeed of 250-kn calibrated airspeed and analtitude range from 20,000 to 32,000 ft. A single designcondition has been selected within this envelope: Mach0.56 and an altitude of 25,000 ft. This point is in themiddle of the Class B altitude range and is at areasonably high dynamic pressure for good aircraftcontrollability. The single-point design has beenevaluated in the simulation and cleared for operationwithin an altitude band of 20,000–30,000 ft at a constantindicated airspeed.
Research Systems Overview
The research systems primarily have been developedfrom existing capabilities at NASA Dryden andintegrated onto the two F/A-18 research aircraft.Elements from past and current research experimentsinclude instrumentation systems on both aircraft, anair-to-air telemetry system, a research computer, a flightcrew interface, and a set of specially modified F/A-18flight control computers. This approach reduced costand development time for the experiment.
Research Aircraft Description
Figure 1 shows the two NASA Dryden F/A-18 aircraftused for this experiment. A two-seat chase-supportairplane equipped with a GPS receiver and a telemetrysystem served as the leading airplane; the SystemsResearch Aircraft (SRA) served as the trailing one. Inaddition to its research instrumentation, GPS receiver,and telemetry modifications;5 the SRA was outfittedwith the experimental formation flight systemsdescribed in the following section. A third NASADryden chase-support airplane was occasionally usedfor video and photographic documentation of theexperiment.
Formation Flight Systems Overview
The formation flight systems were located on thetrailing airplane and integrated an air-to-air telemetryreceiving system and a research flight control system.The telemetry system was used for intershipcommunication, and the control system computed
Table 1. Stability robustness requirements.
Robustnesslevel
Gain margin, dB
Phase margin, deg
High 6.0 45
Medium 4.5 30
Low 3.0 20
ε εN2 εC
2+=
ε εNεC
Figure 1. The NASA F/A-18 AFF research aircraft information flight.
EC01-0050-9
3American Institute of Aeronautics and Astronautics

formation station-keeping commands. These commandsreplaced the pilot stick commands in the F/A-18inner-loop control system. Other than thequadruply-redundant F/A-18 flight control computers,the experimental systems were single-string. Figure 2shows the formation flight systems.
Inertial state information and GPS position datatelemetered from the leading airplane were received anddecoded by the Airborne Research Test System (ARTS)computer onboard the trailing airplane. A real-timeembedded system, the ARTS also contained theformation autopilot software that calculated pitch androll stick commands to maintain the desired position ofthe trailing airplane within the formation. Thesingle-string analog pitch and roll commands were sentfrom the ARTS to a set of analog multiplex and filter
cards.6 These cards applied a 40-Hz low-pass filter toeach command and multiplexed them into four identicalsignals. The signals interfaced with the four channels ofthe production support flight control computers(PSFCCs) and to a pilot display. These PSFCCs arespecially modified F/A-18 flight control computers7, 8
with software that allows selection between the pilot'spitch and roll stick commands and the external ARTScommands. A pushbutton display unit located in the aftcockpit of the trailing airplane and connected to theARTS allowed the flight test engineer to monitor thestatus of the ARTS and change various parameters of theformation autopilot, such as spacing commands andfeedback gains.
Formation Autopilot
A precision formation autopilot (fig. 3) has beendesigned to control the lateral and vertical separation ofthe trailing airplane with respect to the leading airplanein the formation. This control is accomplished byreplacing the pilot control stick commands to theF/A-18 inner-loop control laws with the formationautopilot commands. The separation distance betweenthe nose of the trailing airplane and the tail of theleading one is regulated by the pilot of the trailing onethrough throttle adjustments.
A leader-follower guidance and control approach isused. In this approach, the leading airplane has noresponsibility for maintaining the formation and ismerely required to pursue an independent flightpath.The trailing airplane is solely responsible for making allof the required maneuvers to achieve the desired
Figure 2. The trailing airplane formation flight systems.
4American Institute of Aeronautics and Astronautics
Figure 3. Formation autopilot.

position behind the leading airplane; formation controlis applied only to the trailing one. For design purposes,the operational concept for the formation autopilot isrestricted to straight-and-level flight; however, someflight tests have been performed in dynamic conditionsto fully evaluate the limitations of the system.
Formation Guidance and Navigation
Relative positions are calculated in a formationreference frame (fig. 4) that is fixed in alignment withthe heading selected by the flight test engineer. Thisapproach minimizes lateral spacing errors caused byfluctuations in one or both of the aircraft headings, aproblem that can be magnified by increasingly largenose-to-tail separations.
Real-time relative positions between the two aircraftare derived at 20 Hz by time-correlating and thendifferencing their twice/sec GPS positionmeasurements.9 With common satellites and closeproximity between the aircraft, common mode errorssuch as ephemeris data errors, satellite clock errors, andatmospheric distortion effects are very nearlyeliminated.10 The remaining dominant error is causedby the 2 samples/sec data being processed at 20 Hz. Theresulting GPS relative-position measurement thereforecan be represented as
(2)
where x1(t) is the GPS-measured position, z(t) is the trueposition, and n1(t) is the measurement error.
A second relative-position measurement between thetwo aircraft is obtained by differencing and thenintegrating their inertial navigation system (INS)velocities at 20 Hz. The primary errors in thismeasurement are low-frequency drift caused by biasesin the INS velocities. The inertial position measurementtherefore can be represented as
(3)
where x2(t) is the INS-measured position, z(t) is the trueposition, and n2(t) is the low-frequency error caused byintegration drift.
The two independent relative-position measurementsare combined together using a complementary filter11 toprovide formation navigation information to the controlalgorithms (fig. 5). By subtracting one measurementfrom the other ( ), the error ( ) isobtained. A first-order low-pass filter,
(4)
tuned to remove n1 from e, provides n2. Subtracting thisresult from the original inertial measurement ( )produces an accurate relative-position measurement.
The complementary-filtered position estimate isdifferentiated to provide a velocity estimate with areliable low-frequency component. This estimate is usedto isolate and correct the inertial relative velocitymeasurement through a second complementary filteremploying an identical first-order low-pass filter.
x1 t( ) z t( ) n1 t( )+=
x2 t( ) z t( ) n2 t( )+=
x2 x1– e n2 n1–=
G s( ) 0.25πs 0.25π+----------------------=
z n2+
5American Institute of Aeronautics and Astronautics
Figure 4. Formation reference frame.

Figure 5. INS/GPS complementary filter.
Control feedback errors are calculated as nonzerorelative velocities and deviations in relative positionfrom the commanded formation spacing. These errorsare provided to the formation autopilot control systemand also are used to drive the pilot’s display.Relative-position errors are displayed to the pilot asdeviations of the instrument landing system needles.This implementation helps minimize engagementtransients by assisting the pilot in “getting on condition”before activating the formation control system. Duringthe experiment, the pilot could use the instrumentlanding system needles to monitor the performance ofthe formation autopilot.
Position Control Algorithms
A classical control design employing proportionalplus derivative relative-position error feedback (fig. 3),is used with additional state feedback for improveddamping characteristics. An integral term is added toensure zero steady-state position error. Acceptabledamping is achieved in the vertical axis through normalacceleration feedback, and in the lateral axis throughbank angle feedback. The controller uses thecomplementary-filtered position and velocity estimatesas inputs, in addition to normal acceleration and bankangle from the local aircraft INS computer.
Four gain sets have been designed for each axis of thecontroller. Three of the gain sets (A, B, and C)correspond to the three levels of stability robustnessrequirements shown in table 1. The fourth gain set (D) isdesigned for the medium stability robustness category,but includes a nonzero position error integral gain. Thegain sets have been tuned using a feasible sequentialquadratic programming tool, CONDUIT,12 and an
F/A-18 model that contains the nonlinear aircraftinner-loop control system and a linear model of thedynamics of the trailing airplane. The design approachhas been to optimize the controller response to a 1-ftstep command within specified constraints for rise time,percent of overshoot, settling time, and degree ofsteady-state error. Each axis has been separately tuned,with constraints placed on the allowable stabilitymargins. The leading airplane has been excluded fromthe design process by virtue of the leader-followerapproach and by considering its states as time invariant.
Because of differences between the quasilinear designmodels and the nonlinear, hardware-in-the-loop F/A-18simulation, small adjustments have been made to thegains provided by CONDUIT to achieve the desiredcombinations of robustness and performance describedin table 2. Stability margins have been analyzed bybreaking the loop at the equivalent stick command, andin all cases met or exceeded their design requirements.All four gain sets have been implemented in thesoftware and flight-tested.
Table 2. Controller gain sets.
Gain set Description
A Highly robust and low performance
B Medium robustness and performance
C Low robustness and high performance
D Medium robustness and performance with position error integral
6American Institute of Aeronautics and Astronautics

Flight Test Results
The leading airplane used production F/A-18autopilot modes to maintain constant heading, altitude,and airspeed. Desired lateral, vertical, and nose-to-tailseparation distances between the aircraft were selectedby the flight test engineer through the pushbuttondisplay. When the research system was engaged, thetrailing airplane automatically made all of theadjustments necessary to correct for lateral and verticalrelative-position errors from the specified locationwithin the formation. Nose-to-tail separation wasregulated by the pilot through throttle adjustments.
All testing was performed in formations that allowedthe pilot of the trailing airplane good visibility of theleading airplane. A nose-to-tail separation limit betweenthe two aircraft of 56 ft was imposed to mitigate thepossibility that errant pitch or roll inputs from theresearch system would result in a collision between thetwo aircraft while in formation flight. This limit equatesto one aircraft body length, and ensured that adequatemaneuvering room was available for the trailingairplane after the pilot disengaged the research controlsystem.
The standard test block developed for the experimentreflects a buildup approach. A full evaluation of thestability and performance of the most robust gain setwas accomplished before proceeding to the next gainset. Six types of maneuvers were defined that hadincreasing levels of aggressiveness. A steady-statetracking test was accomplished first, followed byposition step command response tests independentlyperformed in each axis. A position step then wascommanded by the flight test engineer in the back seatof the trailing airplane simultaneously in both axes toevaluate coupling between the axes. Additional dynamicperformance of the formation autopilot was evaluatedby having the leading airplane perform maneuvers infirst the lateral and then the vertical axis.
A total of 167 test points were completed in 11research flights over a span of 2 months. All of theprimary project goals were accomplished; and severaladditional research objectives were achieved, includingtracking while in the wingtip vortex of the leadingairplane. The flight test results are presented herein infive groups: air-to-air navigation, steady-state tracking,step command response, maneuvering flight, and flightwithin the vortex.
Air-to-Air Navigation Accuracy
The GPS-based air-to-air navigation system relied oncommon satellites and close proximity between theaircraft. Close proximity was assured through theselection of test conditions. During the final six flights,the two aircraft observed different satellite sets onlytwice while in formation flight. Large GPS positionerrors occurred in these situations. A change in theformation heading resulted in the reacquisition ofcommon satellites. Although close formation flightaided in ensuring common satellites between theaircraft, it also tended to give rise to telemetry systemcommunication dropouts caused by multipathinterference.
The accuracy of the air-to-air navigation system wasevaluated by comparing the real-time recordedmeasurements with postflight-corrected GPS data.Postflight-corrected GPS data measurements have beenshown through experimentation at NASA Dryden to beaccurate to within 1 ft. Figure 6 shows a plot of thedifference between the real-time–calculated andpostflight-corrected GPS relative positions for each axisduring the entire time at altitude for one of the AFF testflights. Figure 6 also shows the normalized errordistribution for each axis. The error distributions showthat the uncertainty in relative GPS positions wasgenerally less than ±4 ft.
Steady-State Tracking Performance
During all of the flights, the pilots reported turbulencelevels ranging from “no turbulence” to “light chop.” Aslight degradation in tracking performance wasobserved with increased turbulence levels, althoughcontrol accuracy was always better than the design goalof ±9 ft. Figure 7 shows a 3-min tracking performanceplot of the “A” gain formation autopilot. The pilot of theleading airplane performed all of the steady-statetracking tests in a consistent manner, flying within 0.25°of the formation reference frame heading and with lessthan 0.25° of bank angle. Additionally, rudder trimdeflection was less than 1° with the pilot flying “feet onthe floor.”
Occasionally, significant biases existed between theINS velocities of the two aircraft because they hadslightly different INS systems, and preflight operationsoften resulted in unequal alignment qualities prior totakeoff. Figure 8 shows a comparison of the normalizedheading alignment and INS velocity errors between thetwo aircraft for the entirety of flight 715.
7American Institute of Aeronautics and Astronautics

8
American Institute of Aeronautics and Astronautics
Figure 6. Relative GPS errors from flight 713.
Figure 7. Flight 714 gain set “A” steady-statetracking performance.

Figure 8. INS alignment errors from flight 715.
These heading alignment errors resulted in a biasedrelative-velocity calculation. The complementary filtercombined the derivative of the GPS-corrected positiondata with the INS velocities, effectively eliminating thisbias. The relative-velocity feedback signal to thecontroller was selectable between filtered and unfilteredvalues by the flight test engineer using the pushbuttondisplay unit. Figure 9 shows a portion of the gain set“B” steady-state tracking test from flight 715 duringwhich the velocity filter was activated. During the timein which the unfiltered velocity error was being sent tothe controller, the linear controller developed a large,lateral position offset while attempting to counteract the
effects of the lateral velocity error bias. When thefiltered output was selected, the tracking performance ofthe formation autopilot improved significantly.
Table 3 shows a summary of the steady-state trackingperformance of the four gain sets. No GPS errors areincluded and only results with the velocity filterengaged are considered.
Step Command Response
Step response characteristics of all four gain sets werecrisp and predictable. Pilot comments indicate that gainset “C” is a little too aggressive, although acceptable.
9American Institute of Aeronautics and Astronautics
Figure 9. Velocity filter effects on gain set “B” tracking from flight 715.

The pilot's description of the combined step response ofgain set “B” is “[I] couldn't have done it any bettermyself.” Figure 10 shows a comparison between thegain set “B” design model response predictions and sixrepeated flight test results for independent 30-ft positioncommand changes for both axes. A high level ofcorrelation exists between the model predictions andresults from flight for all four gain sets. Variationsbetween the flight responses, especially in the lateralaxis, primarily are a result of a nonsteady-state initialcondition.
Lateral and vertical position steps simultaneouslywere commanded to identify any cross-coupling
between the axes. Figure 11 shows the response of gainset “C” for simultaneous vertical and lateral 20-ftposition command changes. During the combined stepsfor each of the gain sets, no significant coupling wasobserved between the axes, and pitch response generallywas faster than roll response.
Maneuvering Flight
Dynamic response of the lateral position controllerwas tested by having the leading airplane fly headingsweeps of increasing magnitude. Although some phaselag, approximately 45°, was evident in the lateralposition response of the trailing airplane (fig. 12), noinstabilities were observed. The tracking performance ofthe system deteriorated to worse than the design goal of±9 ft for all four gain sets, partly because of the effect ofvarying aircraft heading while measuring errors relativeto a fixed formation heading. The stable dynamicresponse of the system is acceptable, however, becauseit was designed strictly for nonmaneuvering flight.
Dynamic response of the vertical position controllerwas observed during a series of slowly increasingaltitude sweeps performed by the leading airplane(fig. 13). Significantly less phase lag was present in thevertical axis than in the lateral axis. The vertical axiscommands pitch stick, which in the F/A-18 aircraftessentially is a normal acceleration command,analogous to the second derivative of the vertical
Table 3. Controller tracking performance summary.
Lateral axis Vertical axis
Gain set
Standard deviation, ft
Absolute mean, ft
Standard deviation, ft
Absolute mean, ft
A 0.9 0.8 0.8 0.3
B 0.5 0.0 0.3 0.2
C 0.3 0.3 0.5 0.1
D 0.8 0.2 0.6 0.1
Note: No GPS errors included; results with velocity filter on.
10American Institute of Aeronautics and Astronautics
Figure 10. Gain set “B” individual step responses.

position error. The lateral stick command controls rollrate, which is analogous to the third derivative of thelateral position error. The additional integral fromcommand to response in the lateral axis results ingreater phase lag. The vertical tracking error for this testalso exceeded the ±9-ft design requirement; however,vertical tracking is stable and adequately tracks theleading airplane, considering it was designed for onlystraight-and-level flight.
The tracking performance of the vertical controllergain set “D” was evaluated in a steady dive, initiated bythe pilot of the leading airplane, from an altitude of22,500 ft at a rate of descent of approximately2000 ft/min. The heading and airspeed were heldconstant. As figure 14 shows, the controller was able tovery accurately maintain the desired position within theformation during the descent.
Flight Within the Vortex
Although beyond the scope of the original objectives,the Phase 0 formation autopilot was tested in thepresence of the leading airplane wingtip vortex to learnwhether the current controller structure is adequate toachieve the Phase 1 objective of autonomous formationdrag reduction. A model of the vortex was incorporatedinto the NASA Dryden F/A-18 hardware-in-the-loopsimulation for this purpose. The most significant vortexdisturbance when positioned for maximum dragreduction is a strong rolling moment effect.13 Gain set“D” was chosen for evaluation because of the ability ofits position error integral term to generate a lateralcommand bias to offset the vortex rolling moment. Thesimulation showed that the formation autopilot canstabilize within the outer regions of the vortex where themoment effects are not the strongest, but the systembecomes unstable when flown near the core of thevortex.
Figure 11. Gain set “C” combined step error responsefrom flight 717.
11American Institute of Aeronautics and Astronautics
Figure 12. Gain set “C” lateral dynamic response from flight 715.

12
American Institute of Aeronautics and Astronautics
Figure 13. Gain set “C” vertical dynamic response from flight 717.
Figure 14. Gain set “D” vertical dive response from flight 717.

The simulation vortex model had not been confirmedto accurately model the characteristics of real F/A-18wingtip vortices, so the response of the Phase 0formation autopilot system to vortex effects was alsotested in flight. The results, shown in figure 15, weresimilar to the simulation study. With the wingtips of thetwo aircraft spaced approximately 10-ft apart and theleading airplane 15 ft above, the trailing airplane wascommanded closer to the vortex core in 5-ft verticalincrements. Upon reaching the same altitude as theleading airplane, the trailing airplane appeared tostabilize, with approximately 0.1 in. of roll trim, at150 sec. At this point, the trailing airplane wascommanded 5-ft laterally closer to the vortex core. The
control requirements associated with the vortex rollingmoment then exceeded the bandwidth of the formationautopilot and caused the trailing airplane to exit thevortex. Because of large fluctuations inpilot-commanded throttle position to maintainnose-to-tail separation, no appreciable fuel flowreduction was measured.
The response similarities between simulation andflight improved confidence in the vortex model. Furthersimulation studies have shown that the removal ofstick-path nonlinearities and the addition of roll ratefeedback in the lateral axis significantly improve thevortex disturbance rejection capability of the formationautopilot.14, 15
13American Institute of Aeronautics and Astronautics
Figure 15. Gain set “D” vortex immersion flight test results from flight 718.

Concluding Remarks
The Autonomous Formation Flight projectsuccessfully designed, implemented, and flight-testedan F/A-18 formation autopilot system that combinesinertial and global positioning system measurements tomaintain precision station-keeping with another aircraftin formation. Four formation autopilot gain sets weretested, and each exceeded project design requirementsfor steady-state tracking accuracy. Steady-state trackingperformance exceeded the goal of ±10 ft and typicallyshowed values less than ±5 ft. The complementary filterimproved tracking results by eliminating inertial systeminitialization and drift errors. Step responses werewell-damped, and simultaneous maneuvering showedno cross-coupling issues. Pilot comments indicate thatthe system demonstrated an acceptable level ofperformance for a formation flight autopilot.
The formation autopilot also showed acceptablebehavior beyond the scope of its design concept duringmaneuvering flight. More phase lag was observed in thelateral axis than in the vertical, although both axesremained stable. Tracking response during descendingflight was excellent, exceeding the steady-state designrequirement of ±10 ft.
The strong level of agreement between simulationpredictions and aircraft response in flight has providedconfidence in the design tools used in development. Theperformance of the formation autopilot demonstratedthe feasibility of this type of tracking system for moreadvanced applications.
References
1Beukenberg, Markus and Dietrich Hummel,“Aerodynamics, Performance and Control of Airplanesin Formation Flight,” ICAS Proceedings 1990: 17thCongress of the International Council of theAeronautical Sciences, Sept. 1990, pp. 1777–1794.
2Hummel, Dietrich, “Formation Flight as anEnergy-Saving Mechanism,” Israel Journal of Zoology,vol. 41, 1995, pp. 261–278.
3Military Specification, Flight ControlSystems –General Specifications for Design,Installation and Test of Piloted Aircraft, MIL-F-9490D,1975.
4Gera, Joseph and John T. Bosworth, DynamicStability and Handling Qualities Tests on aHighly Augmented, Statically Unstable Airplane,NASA TM-88297, 1987.
5Sitz, Joel R., F-18 Systems Research Aircraft
Facility, NASA TM-4433, 1992.
6Carter, John F. and P. C. Stoliker, Flying Quality
Analysis of a JAS 39 Gripen Ministick Controller in an
F/A-18 Aircraft, NASA TM-2000-209024, 2000.
7Carter, John F., Production Support Flight Control
Computers: Research Capability for F/A-18 Aircraft at
Dryden Flight Research Center, NASA TM-97-206233,1997.
8Carter, John and Mark Stephenson, Initial Flight Test
of the Production Support Flight Control Computers at
NASA Dryden Flight Research Center, NASATM-1999-206581, 1999.
9Ryan, Jack, et al., Data Synchronization
Discrepancies in a Formation Flight Control System,NASA TM-2001-210720, 2001.
10Parkinson, Bradford W., “GPS Error Analysis,”Global Positioning System: Theory and Applications,vol. 1, American Institute of Aeronautics andAstronautics, Inc., Washington, D. C., 1996,pp. 469–483.
11Brown, Robert Grover and Patrick Y. C. Hwang,Introduction to Random Signals and Applied Kalman
Filtering, John Wiley & Sons, New York, 1997.
12Tischler, Mark B., et al., “CONDUIT–A NewMultidisciplinary Integration Environment for FlightControl Development,” AIAA-97-3773, 1997.
13Vachon, M. Jake, Ronald J. Ray, Kevin R. Walsh,Kimberly A. Ennix, “Measured Performance BenefitsDuring the Autonomous Formation Flight Program,”AIAA-2002-4491, Aug. 2002.
14Lavretsky, Eugene, “F/A-18 AutonomousFormation Flight Control System Design,”AIAA-2002-4757, Aug. 2002.
15Misovec, Kathleen, “Applied Adaptive Techniquesfor F/A-18 Formation Flight,” AIAA-2002-4550,Aug. 2002.
14American Institute of Aeronautics and Astronautics

REPORT DOCUMENTATION PAGE
Form ApprovedOMB No. 0704-0188
Public reporting burden for this collection of information is estimated to average 1 hour per response, including the time for reviewing instructions, searching existing data sources, gathering andmaintaining the data needed, and completing and reviewing the collection of information. Send comments regarding this burden estimate or any other aspect of this collection of information,including suggestions for reducing this burden, to Washington Headquarters Services, Directorate for Information Operations and Reports, 1215 Jefferson Davis Highway, Suite 1204, Arlington,VA 22202-4302, and to the Office of Management and Budget, Paperwork Reduction Project (0704-0188), Washington, DC 20503.
1. AGENCY USE ONLY (Leave blank) 2. REPORT DATE 3. REPORT TYPE AND DATES COVERED
4. TITLE AND SUBTITLE 5. FUNDING NUMBERS
6. AUTHOR(S)
8. PERFORMING ORGANIZATION REPORT NUMBER
7. PERFORMING ORGANIZATION NAME(S) AND ADDRESS(ES)
9. SPONSORING/MONITORING AGENCY NAME(S) AND ADDRESS(ES) 10. SPONSORING/MONITORING AGENCY REPORT NUMBER
11. SUPPLEMENTARY NOTES
12a. DISTRIBUTION/AVAILABILITY STATEMENT 12b. DISTRIBUTION CODE
13. ABSTRACT (Maximum 200 words)
14. SUBJECT TERMS 15. NUMBER OF PAGES
16. PRICE CODE
17. SECURITY CLASSIFICATION OF REPORT
18. SECURITY CLASSIFICATION OF THIS PAGE
19. SECURITY CLASSIFICATION OF ABSTRACT
20. LIMITATION OF ABSTRACT
NSN 7540-01-280-5500 Standard Form 298 (Rev. 2-89)
Prescribed by ANSI Std. Z39-18298-102
An Overview of Flight Test Results for a Formation Flight Autopilot
WU 706 35 00 E8 28 00 AFF
Curtis E. Hanson, Jack Ryan, Michael J. Allen, and Steven R. Jacobson
NASA Dryden Flight Research CenterP.O. Box 273Edwards, California 93523-0273
H-2499
National Aeronautics and Space AdministrationWashington, DC 20546-0001 NASA/TM-2002-210729
The first flight test phase of the NASA Dryden Flight Research Center Autonomous Formation Flight project hassuccessfully demonstrated precision autonomous station-keeping of an F/A-18 research airplane with a second F/A-18airplane. Blended inertial navigation system (INS) and global positioning system (GPS) measurements have beencommunicated across an air-to-air telemetry link and used to compute relative-position estimates. A precision researchformation autopilot onboard the trailing airplane controls lateral and vertical spacing while the leading airplane operatesunder production autopilot control. Four research autopilot gain sets have been designed and flight-tested, and each exceedsthe project design requirement of steady-state tracking accuracy within 1 standard deviation of 10 ft. Performance also hasbeen demonstrated using single- and multiple-axis inputs such as step commands and frequency sweeps. This report brieflydescribes the experimental formation flight systems employed and discusses the navigation, guidance, and controlalgorithms that have been flight-tested. An overview of the flight test results of the formation autopilot during steady-statetracking and maneuvering flight is presented.
Formation autopilot, Formation flight, Station keeping
A03
17
Unclassified Unclassified Unclassified Unlimited
August 2002 Technical Memorandum
Also presented at the AIAA Guidance, Navigation and Control, AIAA Atmospheric Flight Mechanics, AIAAModeling and Simulation Technologies, and AIAA/AAS Astrodynamics Conferences, Monterey, California,AIAA-2002-4755.
Unclassified—UnlimitedSubject Category —08
This report is available at http://www.dfrc.nasa.gov/DTRS/