Embed Size (px)
Citation preview
INTAS Project: Supporting the International Development of the CIS Agricultural Sector
Working Paper No.06/4
Alexander Skripnik, Svetlana Chernyshova and Tatyana Vinichenko
October 2006
An Overview of Findings from the Ukrainian Survey

Page 2
Table of content Section 1. General description of the survey .................................................................................3
1.1 The outline of the survey process. ...............................................................................................3
1.2 The sampling procedure and sample characteristics ....................................................................3
1.3 The context of the survey .............................................................................................................5 Section 2. Sample characteristics, findings and results. ..............................................................6 2.1 Characteristics of farms surveyed.................................................................................................6
2.2 Buyer relationships (Section 1 of the questionnaire). ....................................................................8
2.3 Production, productivity, prices (Section 2 of the questionnaire)...................................................15
2.4 Contract relations. (Section 3 of the questionnaire). .....................................................................18
2.5 Investments. (Section 5 of the questionnaire). ..............................................................................21
Section 3. Experiences of the survey..............................................................................................22
3.1 The lessons we gained from the survey........................................................................................22
Conclusions. ....................................................................................................................................25 Appendix I. Some statistical facts on Dnepropetrovsk region and Ukraine ................................26
Appendix II. Questionnaire...............................................................................................................27
Appendix III. Descriptive statistics of all variables for three samples .........................................35

1. General description of the survey
1.1 The outline of the survey process. The results reported here are derived from data collected as part of cross national comparison of farmer – processor relationships in Armenia, Moldova and Ukraine. The research instrument presented in Appendix II was used to collect a representative sample of data from 300 or more farmers from each country. Results and conclusions presented here relate only to the data collected from Ukraine. The survey results sought to address two of the project’s research objectives (2 and 3). Namely, to understand and analyse the performance of commercially oriented farms, identifying determinates of growth paying particular attention to the issues of contract enforcement between farms and purchasers of agricultural products in the NIS and product quality (objective 2); and objective 3 - to test a formal model of contracting to identify factors that affect the sustainability and enforcement of contracts. As a result of the first phase of research (presented elsewhere) the dairy sector was identified as the appropriate sector to investigate. In order to be included in the survey farmers needed to be commercial agricultural producers. A commercial agricultural producer is defined here as any actor engaged in the primary production of milk for a market. Householders selling dairy products at spot markets were excluded. Both households and corporate farms were considered as commercial agri-producers for the purpose of the survey providing they met the conditions outlined above. It should be noted that elsewhere in this report where reference is made to agri-enterprise reference is made to either corporate or a state owned farms. Survey data was collected from the Dnepropetrovsk region. The main statistical facts about the region are presented in Appendix I. A The interviews were conducted in the period from October 2005 till May 2006. The interviews were fulfilled by three interviewers attending dairy farms in the ‘rayons’ (administrative territories). Answers were recorded as they were given by interviewees. Besides completing the questionnaire interviewers often freely discussed additional issues with farmers related to the topic but not included in the questionnaire. The outline of those discussions and findings from them are given later in Section 3 of this report.
1.2 Sampling procedure and sample characteristics Among the 316 producers interviewed, 288 were householders, the remaining 28 interviews were with representatives of private and state owned farms (agri-enterprises). For some interviews the information needed was obtained from two or more persons (director, livestock expert, chief accountant). Corporate farms were identified using a list received from regional or ‘rayon’ agri-administration. Whilst moving between locations interviewers stopped in villages and randomly selected householders for interview. Villages were located more than 30 km from Dnepropetrovsk and not near major roads, because most householders nearer Dnepropetrovsk who have surplus milk for sale prefer to sell it at marketplaces where they get higher prices than those received from milk collectors. As a filter question to determine suitability for completing the questionnaire householders were asked if they had a cow, and if so if they sold milk to milk collectors. No more than 3 interviews were held in hamlets (small villages). In larger villages with a few parts divided by roads or ravines the interviewers made 2-3 interviews in each major part. According to official statistics nearly 75% of milk collected for dairy processors comes from households1. However, the proportion can vary considerably between rayons. For example, in some rayons like Novomoskovskiy there are several large farms which account for nearly half of total milk production. The 1 Source: Statistical annual on Dnepropetrovsk region, 2003.
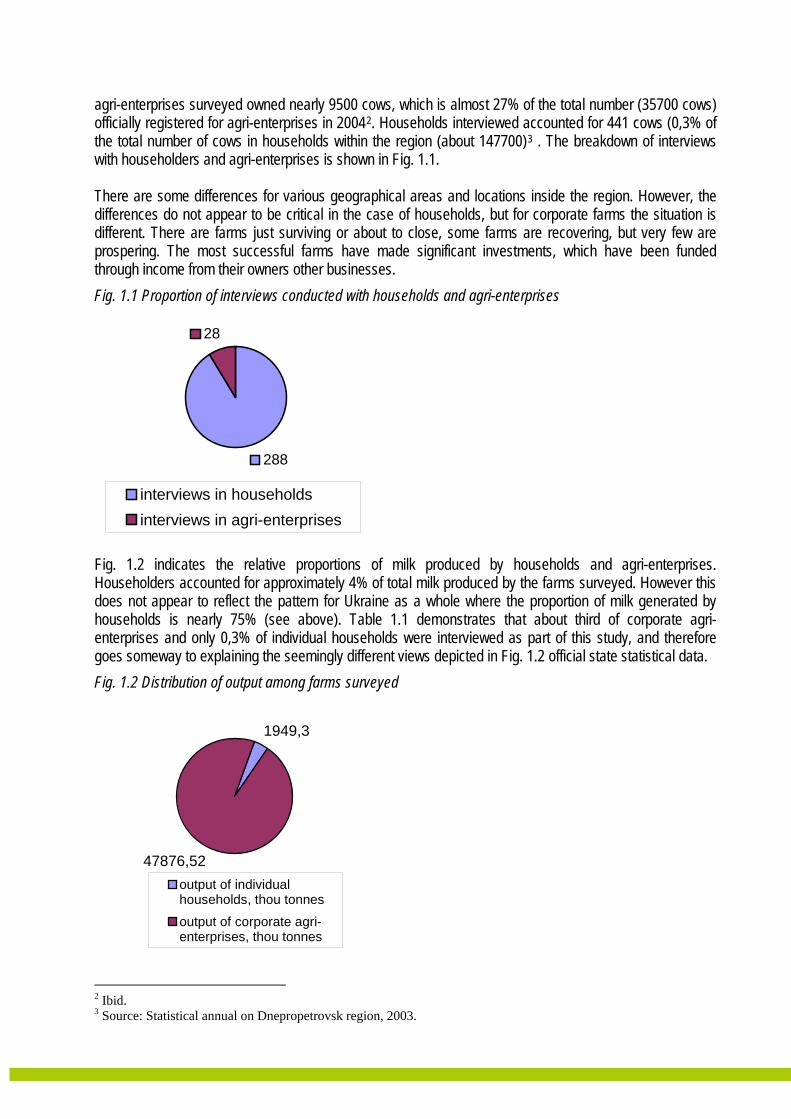
agri-enterprises surveyed owned nearly 9500 cows, which is almost 27% of the total number (35700 cows) officially registered for agri-enterprises in 20042. Households interviewed accounted for 441 cows (0,3% of the total number of cows in households within the region (about 147700)3 . The breakdown of interviews with householders and agri-enterprises is shown in Fig. 1.1. There are some differences for various geographical areas and locations inside the region. However, the differences do not appear to be critical in the case of households, but for corporate farms the situation is different. There are farms just surviving or about to close, some farms are recovering, but very few are prospering. The most successful farms have made significant investments, which have been funded through income from their owners other businesses. Fig. 1.1 Proportion of interviews conducted with households and agri-enterprises
288
28
interviews in householdsinterviews in agri-enterprises
Fig. 1.2 indicates the relative proportions of milk produced by households and agri-enterprises. Householders accounted for approximately 4% of total milk produced by the farms surveyed. However this does not appear to reflect the pattern for Ukraine as a whole where the proportion of milk generated by households is nearly 75% (see above). Table 1.1 demonstrates that about third of corporate agri-enterprises and only 0,3% of individual households were interviewed as part of this study, and therefore goes someway to explaining the seemingly different views depicted in Fig. 1.2 official state statistical data. Fig. 1.2 Distribution of output among farms surveyed
1949,3
47876,52output of individualhouseholds, thou tonnes
output of corporate agri-enterprises, thou tonnes
2 Ibid. 3 Source: Statistical annual on Dnepropetrovsk region, 2003.
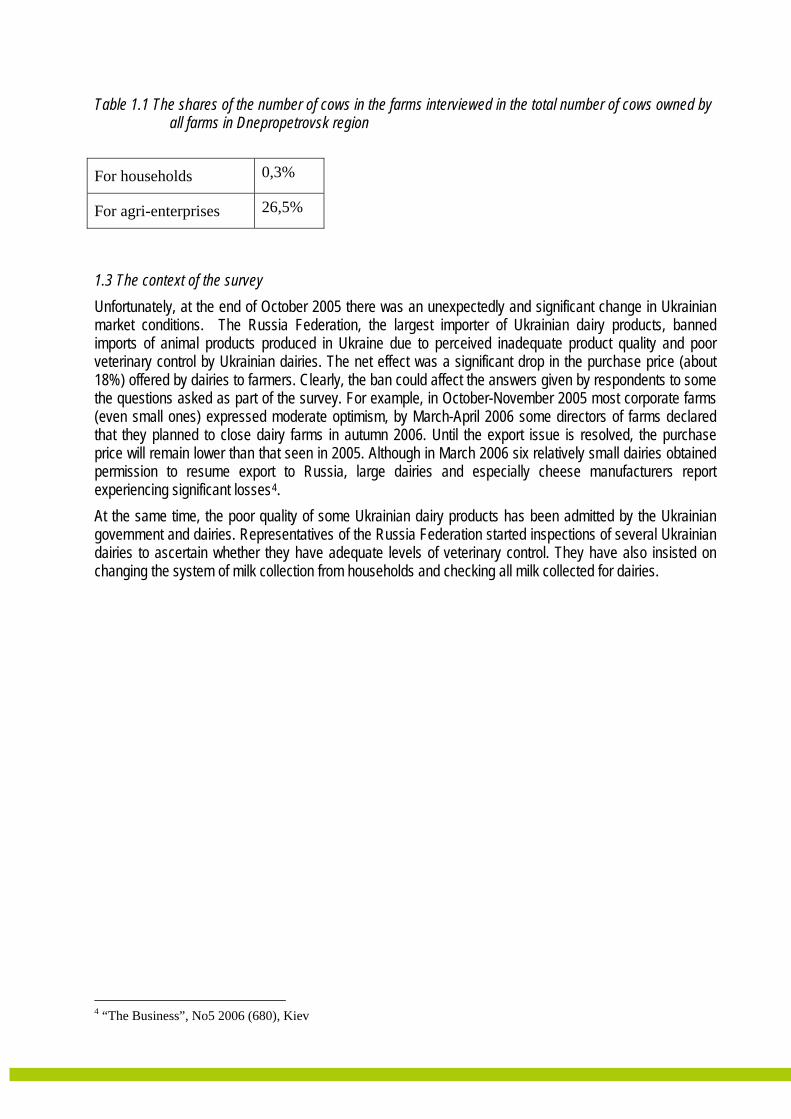
Table 1.1 The shares of the number of cows in the farms interviewed in the total number of cows owned by all farms in Dnepropetrovsk region
For households 0,3%
For agri-enterprises 26,5%
1.3 The context of the survey Unfortunately, at the end of October 2005 there was an unexpectedly and significant change in Ukrainian market conditions. The Russia Federation, the largest importer of Ukrainian dairy products, banned imports of animal products produced in Ukraine due to perceived inadequate product quality and poor veterinary control by Ukrainian dairies. The net effect was a significant drop in the purchase price (about 18%) offered by dairies to farmers. Clearly, the ban could affect the answers given by respondents to some the questions asked as part of the survey. For example, in October-November 2005 most corporate farms (even small ones) expressed moderate optimism, by March-April 2006 some directors of farms declared that they planned to close dairy farms in autumn 2006. Until the export issue is resolved, the purchase price will remain lower than that seen in 2005. Although in March 2006 six relatively small dairies obtained permission to resume export to Russia, large dairies and especially cheese manufacturers report experiencing significant losses4. At the same time, the poor quality of some Ukrainian dairy products has been admitted by the Ukrainian government and dairies. Representatives of the Russia Federation started inspections of several Ukrainian dairies to ascertain whether they have adequate levels of veterinary control. They have also insisted on changing the system of milk collection from households and checking all milk collected for dairies.
4 “The Business”, No5 2006 (680), Kiev
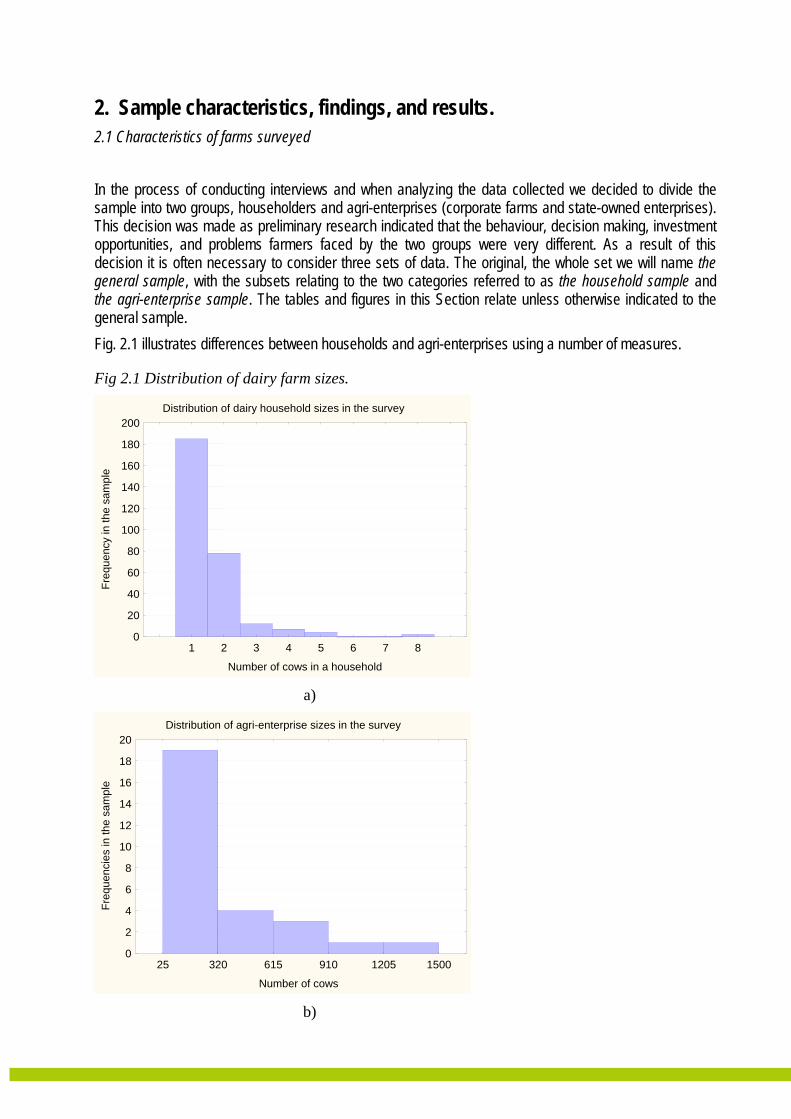
2. Sample characteristics, findings, and results. 2.1 Characteristics of farms surveyed In the process of conducting interviews and when analyzing the data collected we decided to divide the sample into two groups, householders and agri-enterprises (corporate farms and state-owned enterprises). This decision was made as preliminary research indicated that the behaviour, decision making, investment opportunities, and problems farmers faced by the two groups were very different. As a result of this decision it is often necessary to consider three sets of data. The original, the whole set we will name the general sample, with the subsets relating to the two categories referred to as the household sample and the agri-enterprise sample. The tables and figures in this Section relate unless otherwise indicated to the general sample. Fig. 2.1 illustrates differences between households and agri-enterprises using a number of measures.
Fig 2.1 Distribution of dairy farm sizes.
Distribution of dairy household sizes in the survey
1 2 3 4 5 6 7 8
Number of cows in a household
0
20
40
60
80
100
120
140
160
180
200
Freq
uenc
y in
the
sam
ple
a)
Distribution of agri-enterprise sizes in the survey
25 320 615 910 1205 1500
Number of cows
0
2
4
6
8
10
12
14
16
18
20
Freq
uenc
ies
in th
e sa
mpl
e
b)

Distribution of farm sizes measured by land area (owned or rented)
82 150
4 2916 433
8 57510 717
12 85815 000
Land area, ha
0
2
4
6
8
10
12
14
16
Freq
uenc
ies
c)
Distribution of farm size measured by number of employees
0 11 23 34 46 57 69 80
Number of full-time employees
0
1
2
3
4
5
6
7
8
9
10
Freq
uenc
ies
d)
Most of households possess only one cow. The interviewees noted that there are at least three factors that had led to the decrease in the number of cows in households. Firstly, an aging population in rural areas as a result of reduced job opportunities in rural areas, and migration of younger more active people to urban areas. Elderly farmers indicated they just are not able to keep more than one cow. Secondly, householders stated that due to the high cost of forage and low purchase price for milk they do not consider it cost effective to keep more cows. Thirdly, pasture available for grazing is both of poor quality and in short supply. Among agri-enterprises there are a few categories demonstrating different performance and behaviour. For example, there are privatised so called agrifirms that inherited large herds of livestock from former kolkhozes and sovkhozes. Some of them are pedigree stockbreeding, whilst others have dramatically cut down the head of livestock in recent years due to poor profitability or even losses. For most agri-enterprises dairy is not their main business and they are usually withdrawing from the sector. Some farms were re-established by other businesses, and as a result have benefited from significant investments and now employ cutting edge dairy technology. There are also some farms that have to maintain dairy farms even though they would prefer to dispense with them. Usually such enterprises are partially or entirely owned by the state.

2.2 Buyer relationships (Section 1 of the questionnaire). The questions in this section address relationships between farmers and their main buyers, the context of deals, attitude to the main buyer and perceptions of the market environment. Question 1.1. Extent of main buyer involvement in farm business. Descriptive statistics for the general sample are presented below in Table 2.1 and illustrated in Fig. 2.2. In most cases a main buyer rarely or never attends the farm, never trains farmers, and from time to time provides feedback about milk quality. In fact buyers only visit agri-enterprises, not households. Fig. 2.2 Distribution of answers to Question 1.1
Histogram of variable 1.1a
2 3 4 51.1 a
0
50
100
150
200
250
300
350
No
of o
bs
a)
Histogram of variable b
2 3 4 51.1 b
0
50
100
150
200
250
300
350
No
of o
bs
b)
Histogram of variable1.1c
1 2 3 4 51.1 c
0
20
40
60
80
100
120
140
160
180
No
of o
bs
c)
Histogram of variable 1.1d
1 2 3 4 51.1 d
0
20
40
60
80
100
120
140
No
of o
bs
d)
Table 2.1 Descriptive statistics for question 1.1 (for the general data set)
Variables 1.1a 1.1b 1.1c 1.1dMean value 4,882911 4,981013 3,161392 3,243671Standard error 0,027019 0,010927 0,047307 0,061968Median 5 5 3 3Mode 5 5 3 3SD 0,480303 0,194251 0,840954 1,101568Dispersion 0,230691 0,037734 0,707203 1,213452Kurtosis 20,21994 182,7429 0,505487 -0,37657Skewness -4,46827 -12,78 -0,11919 -0,1649Minimum 2 2 1 1Maximum 5 5 5 5

Question 1.2. Attitude to the main buyer and perception of market situation. Descriptive statistics for the general sample and related histograms are given below in Fig. 2.3. The questions here are presented in up to four groups depending on the issues that are being considered.
Fig.2.3. Distribution of answers to Question 1.2. Histogram of variables 1.2a and 1.2b
(intensity of competition )
1.2 a
1.2 b
1 2 3 4 50
20406080
100120140160180200220240
No
of o
bs
a)
Histogram of variables 1.2c, 1.2d, 1.2g, 1.2h(main buyer support )
1.2 c
1.2 d
1.2 g
1.2 h
1 2 3 4 50
20406080
100120140160180200220240260280
No
of o
bs
b) Histogram of variables 1.2e, 1.2f, 1.2i, 1.2j, 1.2k
(main buyer credibility )
1.2 e
1.2 f
1.2 i
1.2 j
1.2 k
1 2 3 4 50
20406080
100120140160180200220240260280
No
of o
bs
c)
Histogram of variables 1.2l and 1.2m(perception of profitability )
1.2 l
1.2 m
1 2 3 4 50
20406080
100120140160180200220240260
No
of o
bs
d)
Table 2.2 Descriptive statistics for question 1.2 (for the general sample) Variables 1.2a 1.2b 1.2c 1.2d 1.2e 1.2f 1.2g 1.2h 1.2i 1.2j 1.2k 1.2l 1.2m Mean value 3,45 3,07 2,06 1,86 3,62 2,83 2,61 2,32 3,24 3,00 3,10 2,82 2,84 Standard error 0,05 0,03 0,03 0,04 0,03 0,03 0,03 0,03 0,03 0,03 0,03 0,05 0,03 Median 3,00 3,00 2,00 2,00 4,00 3,00 3,00 2,00 3,00 3,00 3,00 3,00 3,00 Mode 3,00 3,00 2,00 2,00 4,00 3,00 3,00 2,00 3,00 3,00 3,00 2,00 3,00 SD 0,83 0,58 0,61 0,69 0,54 0,52 0,60 0,60 0,57 0,46 0,57 0,87 0,51 Dispersion 0,69 0,33 0,37 0,47 0,29 0,27 0,36 0,36 0,33 0,21 0,32 0,75 0,26 Kurtosis -0,41 1,31 5,20 4,11 0,93 0,90 -0,60 -0,18 -0,22 2,72 0,05 -1,04 3,72 Skewness -0,07 0,20 1,67 1,32 -1,03 -0,06 0,32 0,11 0,05 0,20 0,02 0,28 -0,65 Minimum 1,00 1,00 1,00 1,00 1,00 2,00 1,00 1,00 2,00 2,00 2,00 1,00 1,00 Maximum 5,00 5,00 5,00 5,00 5,00 5,00 4,00 4,00 5,00 5,00 4,00 5,00 5,00
Correlation coefficients for variables 1.2 are presented in Table 2.3 to illustrate the extent to which answers to questions are linked. In addition it can be used to check data consistency. The letters in the first row and first column denote the appropriate questions 1.2a – 1.2m.

Table 2.3 Correlation coefficients for variables in question 1.1 (for the general sample) a b c d e f g h i j k l m
a 1 0,352 -0,17 -0,25 -0,2 0,09 -0,06 0,05 -0,2 0,07 0,09 0,01 -0,12 b 0,35 1 -0,23 -0,18 -0,09 0,14 -0,3 -0,2 -0,3 0,16 0,22 -0,2 -0,19 c -0,17 -0,23 1 0,74 0,26 -0,3 0,37 0,36 0,4 -0,3 -0,29 0,38 0,409 d -0,25 -0,18 0,74 1 0,39 -0,3 0,26 0,26 0,36 -0,2 -0,24 0,23 0,397 e -0,2 -0,09 0,26 0,39 1 -0,4 0,14 0,02 0,32 -0,2 0,01 0,02 0,133 f 0,09 0,136 -0,29 -0,33 -0,38 1 -0,28 -0,34 -0,5 0,37 0,38 -0,3 -0,2 g -0,06 -0,3 0,37 0,26 0,14 -0,3 1 0,53 0,33 -0,2 -0,34 0,3 0,322 h 0,05 -0,2 0,36 0,26 0,02 -0,3 0,53 1 0,31 -0,1 -0,32 0,38 0,344 i -0,19 -0,28 0,4 0,36 0,32 -0,5 0,33 0,31 1 -0,5 -0,52 0,26 0,165 j 0,07 0,157 -0,25 -0,18 -0,19 0,37 -0,2 -0,14 -0,5 1 0,39 -0,1 -0,05 k 0,09 0,222 -0,29 -0,24 0,01 0,38 -0,34 -0,32 -0,5 0,39 1 -0,2 -0,06 l 0,01 -0,2 0,38 0,23 0,02 -0,3 0,3 0,38 0,26 -0,1 -0,23 1 0,433
m -0,12 -0,19 0,41 0,4 0,13 -0,2 0,32 0,34 0,16 -0,1 -0,06 0,43 1 Question 1.3. Period of dealing. The histogram in Fig. 2.4 indicates the number of years a farmer has been dealing with their main buyer. Fig. 2.4 Distribution of periods farmers deal with main buyers (in years).
Mean value 3,19
Standard error 0,13
Median 3
Mode 3
SD 2,35
Dispersion 5,52
Kurtosis 24,38
Skewness 3,242
Minimum 0,1
Histogram of variable 1.3
0 2 4 6 8 10 12 14 16 18 20 22 241,300000
0
10
20
30
40
50
60
70
80
No
of o
bs
Maximum 25
Question 1.4. Main buyer name.
The histogram provided in Fig. 2.5 shows frequency with which names of main buyers appeared in the survey. Some names belong to milk collectors, who mostly supply milk to dairy processors. It was not always possible to find out where collectors sold the milk they bought. Sometimes householders knew where their milk was processed, sometimes not. Some small dairy processors collected milk themselves. Large dairies used intermediaries, wholesalers. The data was somewhat confusing as the ability of householders in particular to answer this question varied, some when asked about their main buyer could provide the name of the dairy (if they knew it) or second name of a collector, or even only the first name of a collector.
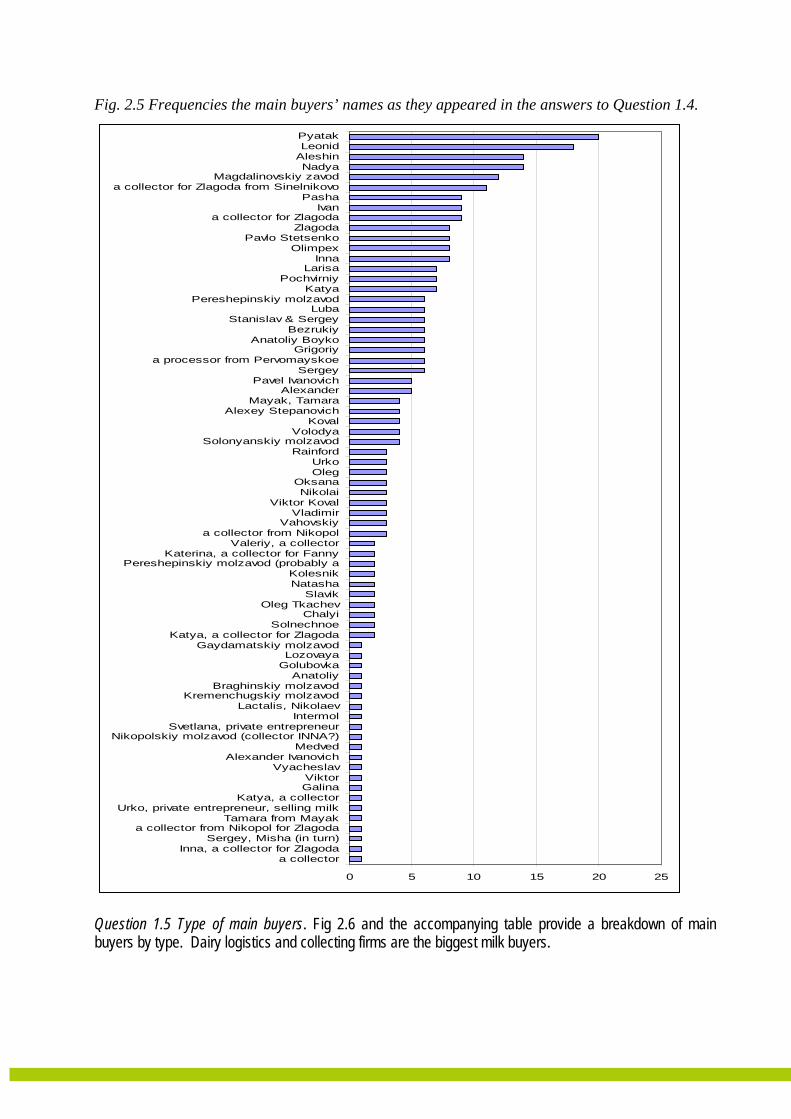
Fig. 2.5 Frequencies the main buyers’ names as they appeared in the answers to Question 1.4.
0 5 10 15 20 25
a collectorInna, a collector for Zlagoda
Sergey, Misha (in turn)a collector from Nikopol for Zlagoda
Tamara from MayakUrko, private entrepreneur, selling milk
Katya, a collectorGalinaViktor
VyacheslavAlexander Ivanovich
MedvedNikopolskiy molzavod (collector INNA?)
Svetlana, private entrepreneurIntermol
Lactalis, NikolaevKremenchugskiy molzavod
Braghinskiy molzavodAnatoliy
GolubovkaLozovaya
Gaydamatskiy molzavodKatya, a collector for Zlagoda
SolnechnoeChalyi
Oleg TkachevSlavik
NatashaKolesnik
Pereshepinskiy molzavod (probably aKaterina, a collector for Fanny
Valeriy, a collectora collector from Nikopol
VahovskiyVladimir
Viktor KovalNikolai
OksanaOlegUrko
RainfordSolonyanskiy molzavod
VolodyaKoval
Alexey StepanovichMayak, Tamara
AlexanderPavel Ivanovich
Sergeya processor from Pervomayskoe
GrigoriyAnatoliy Boyko
BezrukiyStanislav & Sergey
LubaPereshepinskiy molzavod
KatyaPochvirniy
LarisaInna
OlimpexPavlo Stetsenko
Zlagodaa collector for Zlagoda
IvanPasha
a collector for Zlagoda from SinelnikovoMagdalinovskiy zavod
NadyaAleshinLeonidPyatak
Question 1.5 Type of main buyers. Fig 2.6 and the accompanying table provide a breakdown of main buyers by type. Dairy logistics and collecting firms are the biggest milk buyers.

Fig. 2.6 Distribution of main buyer types.
Mean value 1,95
Standard error 0,03
Median 2,00
Mode 2,00
SD 0,49
Dispersion 0,24
Kurtosis 8,67
Skewness 1,52
Minimum 1,00
Histogram of variable 1.5
1 2 3 41,500000
020406080
100120140160180200220240260280300
No
of o
bs
Maximum 4,00
Question 1.6 How is milk collected? As demonstrated in Fig 2.7 the majority of milk is collected from the farm by the dairy. Fig. 2.7 Distribution of ways milk is collected.
Mean value 1,72Standard error 0,03Median 2Mode 2SD 0,45Dispersion 0,21Kurtosis -1,02Skewness -0,99Minimum 1
Histogram for variable 1.6
1 21,600000
020406080
100120140160180200220240
No
of o
bs
Maximum 2
Question 1.7. When are you paid for the milk you supply to your main buyer? Here zero value in the horizontal axis stands for the case when a farmer is paid on delivery. Value ‘3’ corresponds to payment twice a week, ‘7’ to weekly payment etc. Value ‘1’ corresponds to one-day delay in payment, ‘2’ – to 2-day delay. The descriptive statistics of the general sample for Question 1.7 are presented in the table aside Fig. 2.8. Fig. 2.8 Distribution of delays in payment after delivery.
Mean value 4,06
Standard error 0,27
Median 1
Mode 0
SD 4,84
Dispersion 23,40
Kurtosis 6,23
Skewness 1,72
Minimum 0
Histogram of variable 1.8
0 3 6 9 12 15 18 21 24 27 30
Var1
0
20
40
60
80
100
120
140
160
No
of o
bs
Maximum 30

Questions 1.8-1.12 The descriptive statistics for variables 1.8-1.12 are reported in Table 2.4, while Fig 2.9-2.12 illustrate the distribution of frequencies for the appropriate variables. About half of the farmers interviewed indicated they were satisfied with their main buyer, about 25% were not satisfied and the remainder were neither satisfied or dissatisfied. Most respondents do not consider extra services or price stability as critical factors influencing main buyer selection decisions. The greatest priority is given to payment reliability and price paid. Fig. 2.9 Question 1.8 Satisfaction with main buyer.
Histogram for variable 1.8 (satisfaction with main buyer)
1 2 3 4 51,800000
0
20
40
60
80
100
120
140
160
No
of o
bs
Fig. 2.10 Distribution of answers to questions 1.9a-1.9e.
Histogram for variables 1.9a-1.9e
1.9 a
1.9 b
1.9 c
1.9 d
1.9 e
1 2 3 4 50
20406080
100120140160180200220240260280
No
of o
bs

Fig. 2.11 Distribution of the numbers of potential buyers.
Histogram for variable 1.10 (the number of potential buyers)
1 2 3 4 5 61,10
0
20
40
60
80
100
120
No
of o
bs
Fig. 2.12 Distribution of answers to Questions 1.11 and 1.12 (How difficult is to switch to
another buyer? How difficult is it for the buyer to switch to another supplier?)
Histogram for variables 1.11-1.12
1,11
1,12
1 2 3 4 50
20
40
60
80
100
120
140
No
of o
bs
Table 2.4 Descriptive statistics for variables 1.8-1.12.
Variables 1.8 1.9a 1.9b 1.9c 1.9d 1.9e 1.10 1.11 1.12 Mean value 3,24 4,35 4,82 2,18 3,73 3,99 2,59 2,98 3,83 Standard error 0,05 0,03 0,02 0,06 0,04 0,03 0,06 0,07 0,05 Median 3,00 4,00 5,00 2,00 4,00 4,00 3,00 3,00 4,00 Mode 4,00 4,00 5,00 2,00 4,00 4,00 2,00 4,00 4,00 SD 0,89 0,49 0,41 1,05 0,68 0,52 1,05 1,25 0,89 Dispersion 0,79 0,24 0,17 1,10 0,47 0,27 1,11 1,56 0,79 Kurtosis -0,83 -1,51 7,12 -0,66 0,14 0,70 0,44 -1,24 -0,50 Skewness -0,53 0,53 -2,36 0,56 -0,32 -0,01 0,61 -0,16 -0,26 Minimum 1,00 3,00 2,00 1,00 2,00 3,00 1,00 1,00 1,00 Maximum 5,00 5,00 5,00 5,00 5,00 5,00 6,00 5,00 5,00
Correlation coefficient for variables 1.10 and 1.11 is equal to 0,48. Correlation coefficient for variables 1.10 and 1.12 is equal to - 0,11.
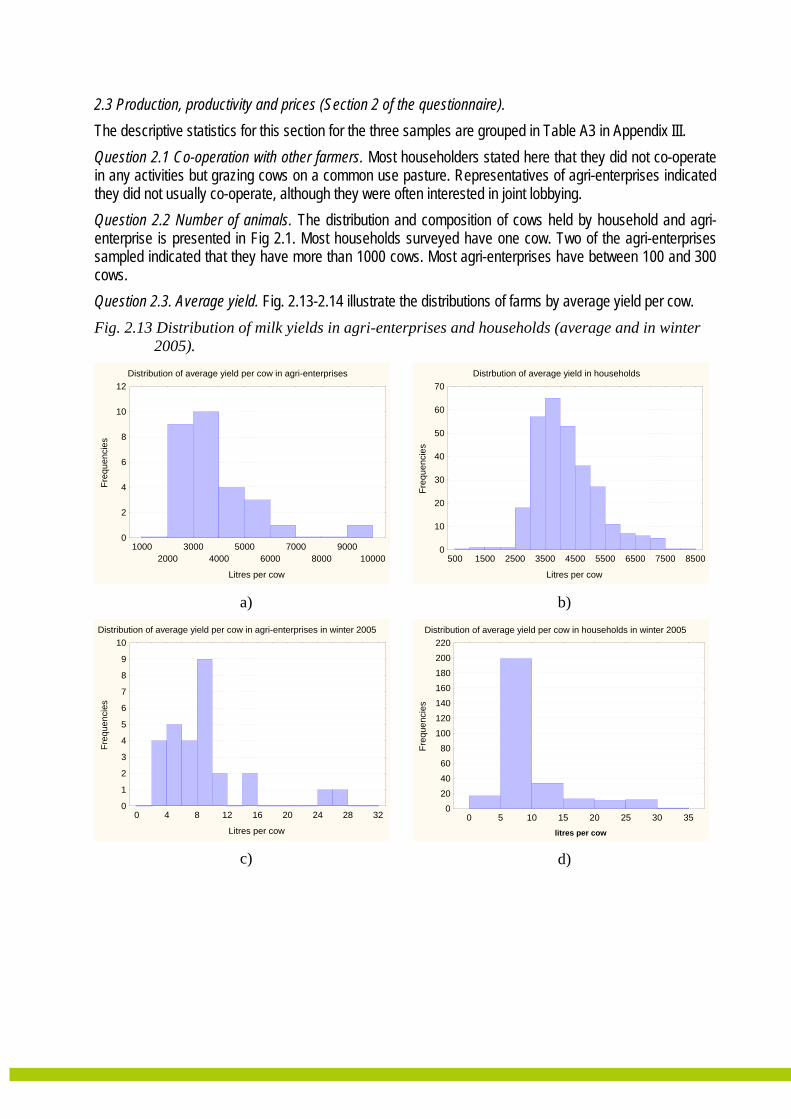
2.3 Production, productivity and prices (Section 2 of the questionnaire). The descriptive statistics for this section for the three samples are grouped in Table A3 in Appendix III. Question 2.1 Co-operation with other farmers. Most householders stated here that they did not co-operate in any activities but grazing cows on a common use pasture. Representatives of agri-enterprises indicated they did not usually co-operate, although they were often interested in joint lobbying. Question 2.2 Number of animals. The distribution and composition of cows held by household and agri-enterprise is presented in Fig 2.1. Most households surveyed have one cow. Two of the agri-enterprises sampled indicated that they have more than 1000 cows. Most agri-enterprises have between 100 and 300 cows. Question 2.3. Average yield. Fig. 2.13-2.14 illustrate the distributions of farms by average yield per cow. Fig. 2.13 Distribution of milk yields in agri-enterprises and households (average and in winter
2005). Distribution of average yield per cow in agri-enterprises
10002000
30004000
50006000
70008000
900010000
Litres per cow
0
2
4
6
8
10
12
Freq
uenc
ies
a)
Distrbution of average yield in households
500 1500 2500 3500 4500 5500 6500 7500 8500
Litres per cow
0
10
20
30
40
50
60
70
Freq
uenc
ies
b)
Distribution of average yield per cow in agri-enterprises in winter 2005
0 4 8 12 16 20 24 28 32
Litres per cow
0
1
2
3
4
5
6
7
8
9
10
Freq
uenc
ies
c)
Distribution of average yield per cow in households in winter 2005
0 5 10 15 20 25 30 35
litres per cow
0
20
40
60
80
100
120
140
160
180
200
220
Freq
uenc
ies
d)
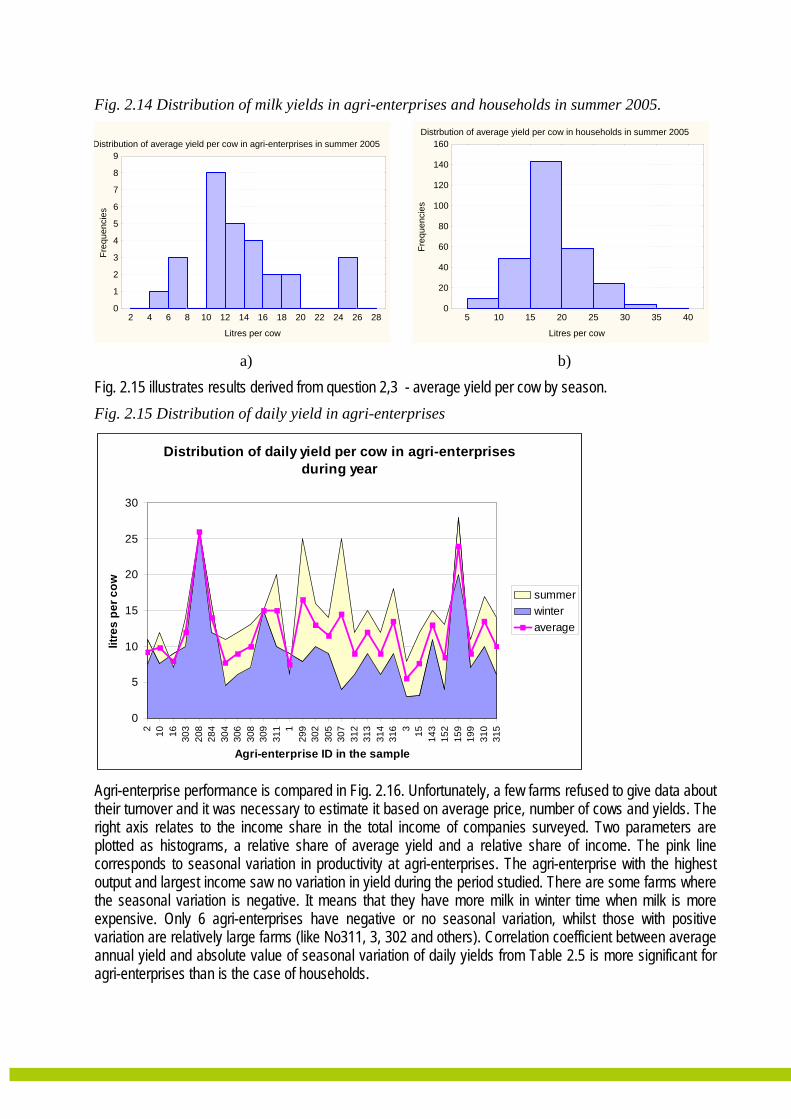
Fig. 2.14 Distribution of milk yields in agri-enterprises and households in summer 2005.
Distribution of average yield per cow in agri-enterprises in summer 2005
2 4 6 8 10 12 14 16 18 20 22 24 26 28
Litres per cow
0
1
2
3
4
5
6
7
8
9
Freq
uenc
ies
a)
Distrbution of average yield per cow in households in summer 2005
5 10 15 20 25 30 35 40
Litres per cow
0
20
40
60
80
100
120
140
160
Freq
uenc
ies
b)
Fig. 2.15 illustrates results derived from question 2,3 - average yield per cow by season. Fig. 2.15 Distribution of daily yield in agri-enterprises
Distribution of daily yield per cow in agri-enterprises during year
0
5
10
15
20
25
30
2 10 16 303
208
284
304
306
308
309
311 1
299
302
305
307
312
313
314
316 3 15 143
152
159
199
310
315
Agri-enterprise ID in the sample
litre
s pe
r cow
summerwinteraverage
Agri-enterprise performance is compared in Fig. 2.16. Unfortunately, a few farms refused to give data about their turnover and it was necessary to estimate it based on average price, number of cows and yields. The right axis relates to the income share in the total income of companies surveyed. Two parameters are plotted as histograms, a relative share of average yield and a relative share of income. The pink line corresponds to seasonal variation in productivity at agri-enterprises. The agri-enterprise with the highest output and largest income saw no variation in yield during the period studied. There are some farms where the seasonal variation is negative. It means that they have more milk in winter time when milk is more expensive. Only 6 agri-enterprises have negative or no seasonal variation, whilst those with positive variation are relatively large farms (like No311, 3, 302 and others). Correlation coefficient between average annual yield and absolute value of seasonal variation of daily yields from Table 2.5 is more significant for agri-enterprises than is the case of households.

Fig. 2.16 Distribution of income, yield and seasonal variation among corporate respondents
Comparison of agri-enterprises performance
-40,00%
-20,00%
0,00%
20,00%
40,00%
60,00%
80,00%2 10 16 303
208
284
304
306
308
309
311 1
299
302
305
307
312
313
314
316 3 15 143
152
159
199
310
315
ID of agri-enterprises in the survey
%
-20,00%
-10,00%
0,00%
10,00%
20,00%
30,00%
40,00%
share of annual yield in the total yield of agri-enterprises in surveyshare of income in the total income of agri-enterprises surveyed(average daily yield-winter daily yield)/average dailyyield
Table 2.5a (agri-enterprise sample)
Correlation coefficients between variables Average annual
yield, 2.3 (2005 total)
Annual income,
4.1g
Annual income per cow
Var1 = (Average daily yield – Average winter daily yield)/Average daily yield), i.e. ((2.32005W +2.32005S )/2- 2.32005W )/ (2.32005W +2.32005S )/2
-0,42 -0,02 0,15
ABSOLUTE VALUE(Var1) -0,52 -0,16 0,12
Table 2.5b (household sample)
Correlation coefficients between variables Average annual
yield, 2.3 (2005 total)
Annual income, 4.1g*
Annual income per cow
Var1 = (Average daily yield – Average winter daily yield)/Average daily yield), i.e. ((2.32005W +2.32005S )/2- 2.32005W )/ (2.32005W +2.32005S )/2
-0,36 -0,06 -0,29
ABSOLUTE VALUE(Var1) -0,2 -0,03 -0,19* The value of household income was estimated as if householders sell all milk every day
Questions 2.4 – 2.6. Price issues. A breakdown of prices paid for milk supplied by agri-enterprises and households is shown in Fig. 2.17. As a general rule households receive lower prices for milk than their agri-enterprise counterparts. Prices paid are higher in winter than in summer.

Fig. 2.17 Distributions of prices. Distribution of maximal prices received by agri-enterprises
from main buyer in October 2005
0,9 1,0 1,1 1,2 1,3 1,4 1,5 1,6 1,7UAH/litre, 1USD=5,05 UAH
0
2
4
6
8
10
12
Freq
uenc
ies
a)
Distribution of p rices received by householdsfrom main buyer in October 2005
0,951,00
1,051,10
1,151,20
1,251,30
1,351,40
1,45
UAH/litre, 1USD=5,05UAH
0
20
40
60
80
100
120
140
Freq
uenc
ies
b)
Distribution of p rices received by agri-enterprisesfrom main buyer in summer 20 05
2.5 (Min)
2.5 (Ave)
2.5 (Max)0,6 0,7 0,8 0,9 1,0 1,1 1,2 1,3 1,4 1,5 1,6 1,7
UAH/litre, 1USD=5,05UAH
0
2
4
6
8
10
12
14
Freq
uenc
ies
c)
Distribution of p rices received by householdsfrom main buyer in summer 20 05
2.5 (Min)
2.5 (Ave)
2.5 (Max)0,3 0,4 0,5 0,6 0,7 0,8 0,9 1,0 1,1 1,2 1,3
UAH/litre, 1USD=5,05UAH
0
20
40
60
80
100
120
140
160
Freq
uenc
ies
d)
Distribution of p rices received by agri-enterprisesfrom main buyer in winter 2005
2.6 (Min)
2.6 (Ave)
2.6 (Max)0,7 0,8 0,9 1,0 1,1 1,2 1,3 1,4 1,5 1,6 1,7
UAH/litre, 1USD=5,05UAH
0
2
4
6
8
10
12
Freq
uenc
ies
e)
Distribution of p rices received by householdsfrom main buyer in winter 2005
2.6 (Min)
2.6 (Ave)
2.6 (Max)0,3 0,4 0,5 0,6 0,7 0,8 0,9 1,0 1,1 1,2 1,3 1,4 1,5 1,6
UAH/litre, 1USD=5,05UAH
0
20
40
60
80
100
120
140
160
Freq
uenc
ies
f)
2.4 Contract relations. (Section 3 of the questionnaire). Question 3.1 Most respondents indicated that they had only one main buyer. None of the householders interviewed had signed contracts with buyers, although some of them stated that they had an oral agreement with their main buyer. However, it was difficult to determine whether they had an oral contract or not. Nothing is defined by the oral agreement other than a requirement on the part of the farmer to sell their milk to a stated buyer. Fig 2.18 provides a breakdown of tonnes of milk sold by the different types buyer.
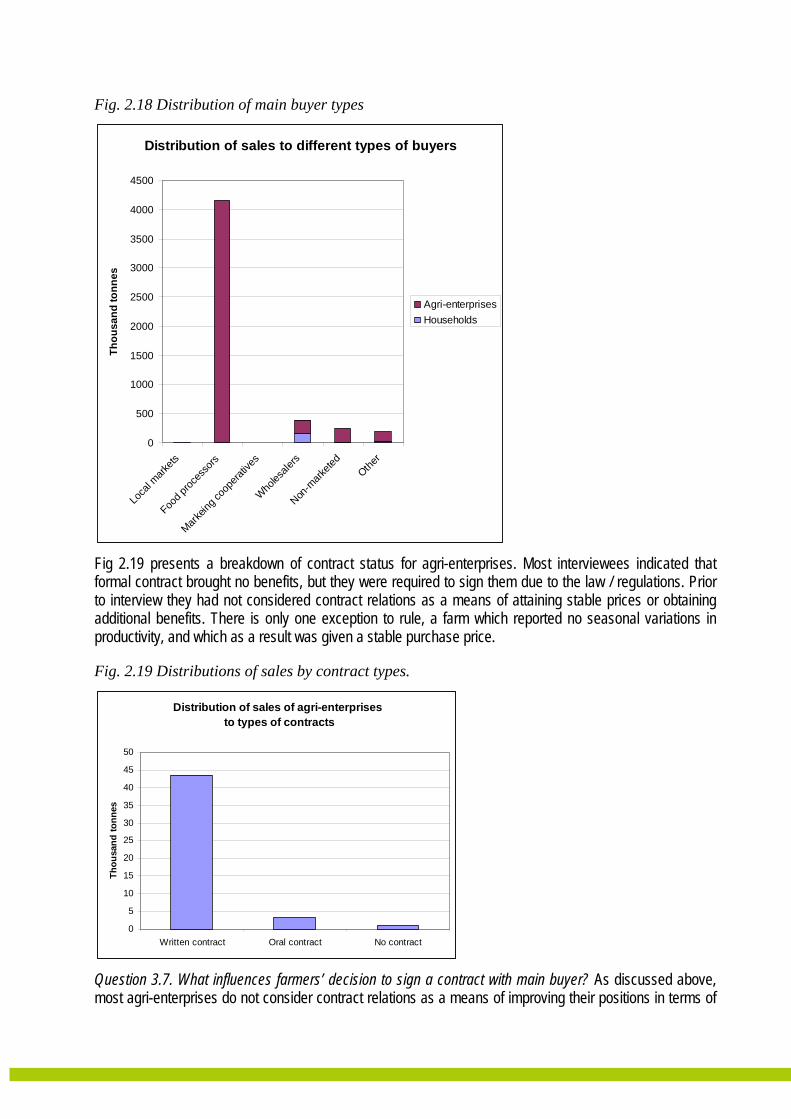
Fig. 2.18 Distribution of main buyer types
Distribution of sales to different types of buyers
0
500
1000
1500
2000
2500
3000
3500
4000
4500
Loca
l mark
ets
Food p
roces
sors
Marke
ing co
opera
tives
Wholes
alers
Non-m
arkete
dOthe
r
Thou
sand
tonn
es
Agri-enterprisesHouseholds
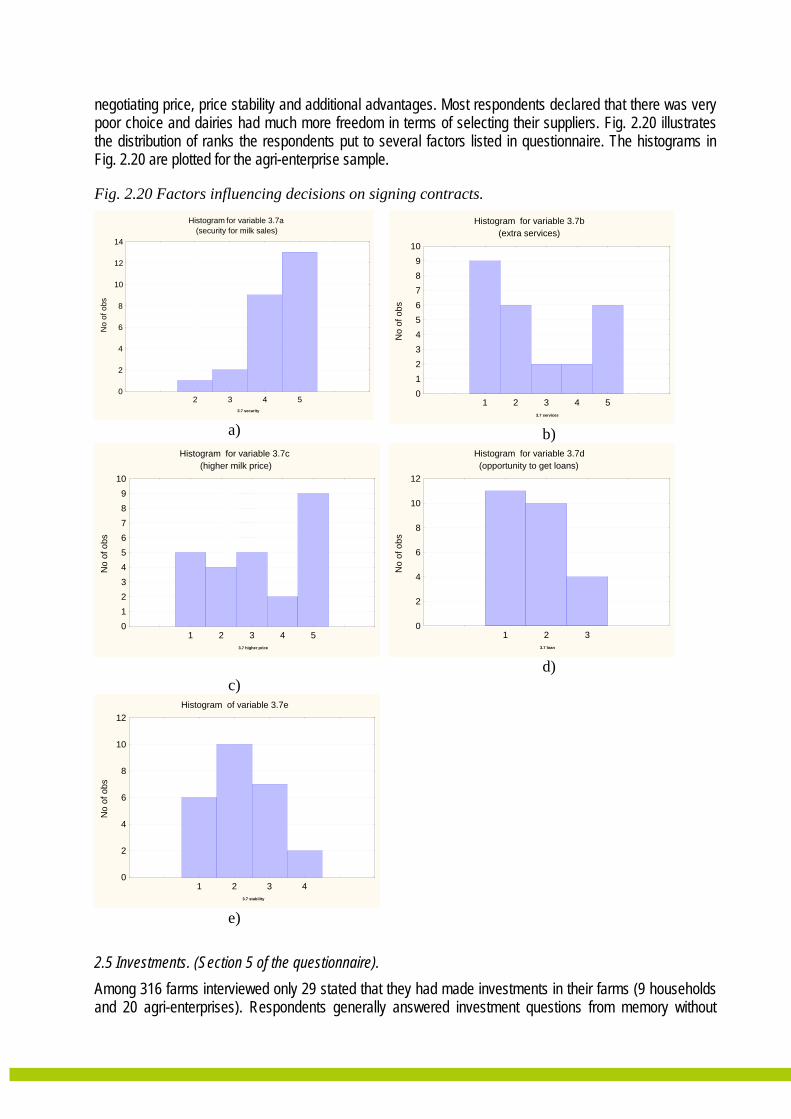
Fig 2.19 presents a breakdown of contract status for agri-enterprises. Most interviewees indicated that formal contract brought no benefits, but they were required to sign them due to the law / regulations. Prior to interview they had not considered contract relations as a means of attaining stable prices or obtaining additional benefits. There is only one exception to rule, a farm which reported no seasonal variations in productivity, and which as a result was given a stable purchase price.
Fig. 2.19 Distributions of sales by contract types.
Distribution of sales of agri-enterprises to types of contracts
0
5
10
15
20
25
30
35
40
45
50
Written contract Oral contract No contract
Thou
sand
tonn
es
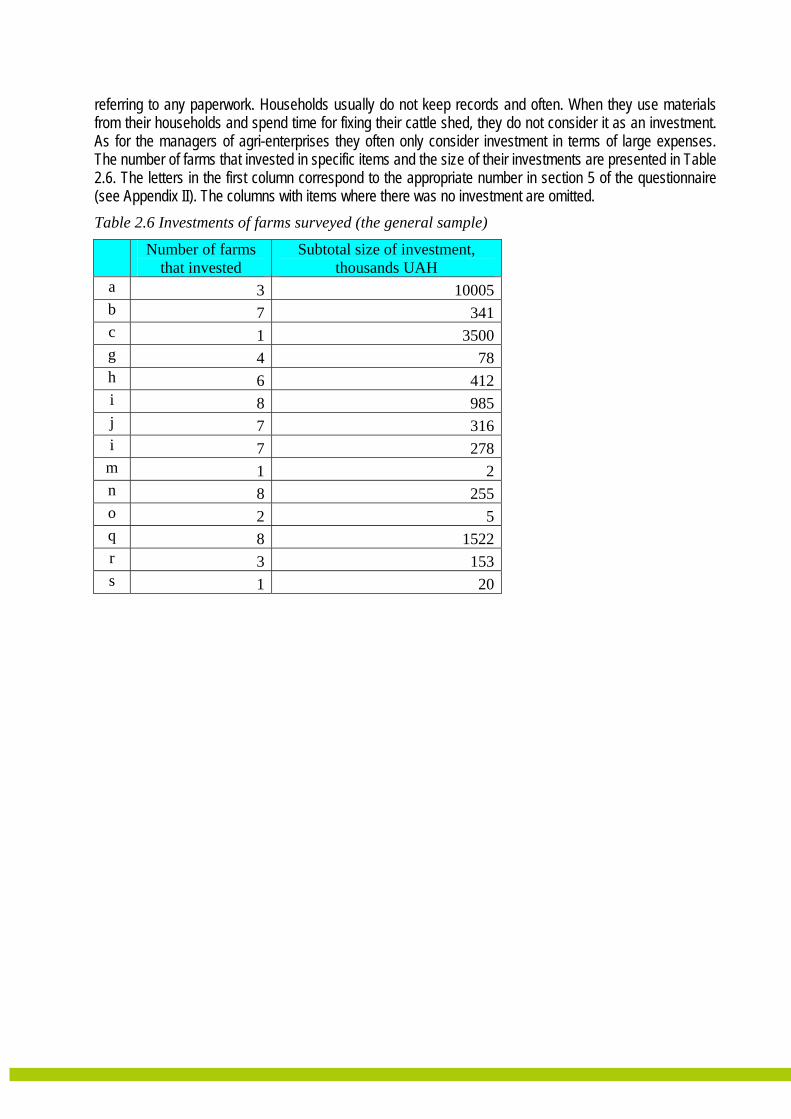
Question 3.7. What influences farmers’ decision to sign a contract with main buyer? As discussed above, most agri-enterprises do not consider contract relations as a means of improving their positions in terms of
negotiating price, price stability and additional advantages. Most respondents declared that there was very poor choice and dairies had much more freedom in terms of selecting their suppliers. Fig. 2.20 illustrates the distribution of ranks the respondents put to several factors listed in questionnaire. The histograms in Fig. 2.20 are plotted for the agri-enterprise sample.
Fig. 2.20 Factors influencing decisions on signing contracts. Histogram for variable 3.7a
(security for milk sales)
2 3 4 53.7 security
0
2
4
6
8
10
12
14
No
of o
bs
a)
Histogram for variable 3.7b(extra services)
1 2 3 4 53.7 services
0123456789
10
No
of o
bs
b)
Histogram for variable 3.7c(higher milk price)
1 2 3 4 53.7 higher price
0123456789
10
No
of o
bs
c)
Histogram for variable 3.7d(opportunity to get loans)
1 2 33.7 loan
0
2
4
6
8
10
12
No
of o
bs
d)
Histogram of variable 3.7e
1 2 3 43.7 stability
0
2
4
6
8
10
12
No
of o
bs
e)
2.5 Investments. (Section 5 of the questionnaire). Among 316 farms interviewed only 29 stated that they had made investments in their farms (9 households and 20 agri-enterprises). Respondents generally answered investment questions from memory without
referring to any paperwork. Households usually do not keep records and often. When they use materials from their households and spend time for fixing their cattle shed, they do not consider it as an investment. As for the managers of agri-enterprises they often only consider investment in terms of large expenses. The number of farms that invested in specific items and the size of their investments are presented in Table 2.6. The letters in the first column correspond to the appropriate number in section 5 of the questionnaire (see Appendix II). The columns with items where there was no investment are omitted. Table 2.6 Investments of farms surveyed (the general sample)
Number of farms that invested
Subtotal size of investment, thousands UAH
a 3 10005b 7 341c 1 3500g 4 78h 6 412i 8 985j 7 316i 7 278m 1 2n 8 255o 2 5q 8 1522r 3 153s 1 20

3. Experiences of the survey There are some observations we made during the survey that are reported in the narrative relating the questionnaire given above. 3.1 Lessons learnt from the survey. Whilst we were aware of the difficulties that farmers in the Ukraine face, we were still shocked when faced with the realities of modern rural life. When compared with levels seen in the 1980s there are very few dairy farms left, and almost all of them 'drag out a miserable existence'. In the past there was more or less a large dairy farms near to almost every village, most of them were equipped with storage equipment and simple laboratories. Now almost all of them (more than 98%) are destroyed, and the equipment has been sold as scrap metal. Almost all (if not all) kolkhozes became insolvent, with their members getting almost nothing but some land. The land plots they received are now in some cases rented by agri-enterprises. There are almost no jobs in villages with most inhabitants being elderly / pensioners. Those farmers who live close to marketplaces and cities tend to sell their milk to spot markets. Those who live further from towns and / or have no transport to bring the milk to spot markets (or it is not cost effective to do so) have to sell the milk to collectors at the price offered. Milk collectors control the market for milk coming from individual farms. Usually they have informal agreement between them about sharing territories and the price they are prepared to buy milk at. If a new collector enters the market offering higher prices or better conditions, existing collectors will force them out of the market, and in some cases have resorted to violence to do so. Sometimes local authorities will nominate a preferred collector. In some cases / regions local processors are able to coexist even when price differentials exist between buyers. In such cases the buyers may differentiate on the basis of quality or payment conditions. One additional benefit which collectors sometimes offer is discounted food products for farmers selling them milk. Whilst this is seen as a benefit by farmers it is not seen as a crucial one. At the same time the market segment of milk coming from households affects the market of milk coming provided by agri-enterprises. Whilst householders do not keep records and do not factor in their own labour when considering prices, the corporate farms have costs which they need to bear. Most relatively small farms (less than 200 cows) demonstrate low profitability and are considering closure, this is especially the case if they have other more profitable businesses including growing sunflower, crops, and vegetables. Although respondents stated in interviews that they had milk of extra and first class, the reality is quite different. Meanwhile large farms (1000 or more cows) make use of modern technologies and are therefore able to produce premium milk with high productivity levels. They do not suffer from low profitability and enjoy significant economies of scale advantage, and as a result higher prices and higher margins. Their milk is taken to other regions for use by dairies producing premium products. However, the segment of premium milk seems not very large and only few processors are ready to pay bonus for quality. When asked about their expectations of the future state of the dairy sector and the methods to improve production and quality, householders usually answered that they would keep cows and sell milk in any case, because according to them it is as good as their only source of income. Many directors of the smaller farms think that the state should pay subsidies to farms and introduce a minimum purchase price to enable proper profitability. Only a relatively small number of directors of the larger farms stated that the only way to improve the sector is to impose severe quality controls so as to protect the market from poor quality milk and make dairies compete for milk of improved quality. They also indicated that one of the key conditions for success is not just big investments but also integrated production. A farm they argued should own land to produce forage for livestock. Therefore, they suggest land ownership is critical for investments in dairy farming. Some directors of large farms think that it is important to unite with other dairies interested in

procuring milk of acceptable quality and to lobby for regulation to enforce more severe tests of milk entering dairies, thereby also protecting the consumer. This would then have an effect on markets with dairies having to differentiate between milk of poor and proper quality. Quality improvements would also have the effect of making Ukrainian dairy products more competitive in world market, and will help to promote the development of fairer contract relationships between farms and dairies. The number of cows held is slowly decreasing. All directors of corporate farms that were interviewed stated that the future in the dairy sector is only likely to be positive for corporate farming. The milk produced by individual farms is usually of low quality, owners are often elderly and as a result are not physically able to cope with more cows and therefore cannot obtain the benefits that a more productive farm would deliver. However, there were some villages where the population was younger than average, and in such cases more cows were managed. According to official statistics and it supported by this research, individual cows were found to be more productive than 'corporate' ones at small farms. A possible explanation for this is that some corporate milk production is servicing the shadow economy. What is beyond doubt however is that currently it is impossible to increase either the quantity or quality of the milk that is collected from individual farms. As a result of the survey it was identified that all households sell milk without a written contract, whilst almost all corporate farms sign contracts with dairies or collectors but only because the law demands it. In hindsight it may have been interesting to employ two questionnaires, one for households and the other for agri-enterprises. Answers reported here were recorded as the respondents gave them. However, sometimes the information given seems questionable. It relates to quality of milk, to amount of the milk produced, to productivity of cows. Often, householders could not give specific figures relating to yield and cow productivity, as it was not something they had ever tried to calculate. A similar situation was evident when collecting data on investments. Even where householders had spent time and money on improving their household dairy, they did not initially consider it as an investment. To a lesser extent these problems were also experienced when interviewing directors of small farms.

4. Conclusions The current market situation seems to be one in which large dairies dominate. They dictate prices for milk, because households despite the fact that they provide the major share of their milk are not able to effectively negotiate prices. Existing procedures for collecting milk do not result in an acceptable quality of milk. However, dairies are very cost conscious and are not prepared to pay a premium for better quality milk. Smaller corporate farms (less than 500 cows) also lack the bargaining power required to secure higher prices, this is attributable in part to the fact that their milk is often of lower quality than their large farm counterparts. Large farms that have made significant investments in technology, livestock and equipment have usually been able to improve milk quality, and as a result can service a segment of the market which is seeking premium products. However, it should be noted that demand for premium dairy products is very limited. One of the main factors here is weak control on dairy quality from independent organisations. In fact, most dairy products do not meet even local standards, but they are sold on the market.
Bringing about significant changes in the sector are impossible without changing the sector structure. Managers of dairy farms who are interested in improving quality are considering forming a trade association to lobby for such changes. However, it is likely that direct state intervention / regulations like introducing minimal purchase price or providing subsidies will not be effective.
In the Dnepropetrovsk region processors are yet to provide stationary procurement and collection facilities. In the absence of facilities with laboratories and cooling equipment, it is difficult to envisage any real improvement in the quality of milk supplied by households.
Establishing and enforcing quality standards for collection would also make it easier for organisations to export dairy products, which is an opportunity which Ukrainian dairies are not currently well positioned to capitalise on.
Contract increase in importance when demand for normal-quality milk increases. Advanced farms like Agrosouz use contract relations to guarantee price and offer incentives to support the production of good quality milk.
It is notable that almost all respondents said that they had not received assistance from dairies, for anything other than the testing of milk quality. Earlier investigations and publications in the mass-media have stated that dairies support farms in a number of different ways. Probably, the percentage of such enterprises in Dnepropetrovsk region is small. The dairies from other regions interested in high-quality milk take this milk from farms located in Dnepropetrovsk region and pay 30-35% more than the normal season maximum. Local dairies, some of which are among the national leaders with large market shares, prefer to source milk from households and small farm.

Appendix I. Some statistical facts on the Dnepropetrovsk region and Ukraine
Area: 31.9 thousand sq. km Length: from North to South 210 km From West to East 340 km Present population as of Jan 1, 2006 3447,2 thousand incl. regional center Dnipropetrovsk 1047 thousand Number of districts: 22 Some dairy facts for Ukraine (2005) 5
• Near 4,9 mln households in the country (211800 of them are in Dnepropetrovsk region) produced 81,3% of milk (11 224 thousand tonnes).
• Agri-enterprises produced 2579 thousand tonnes (18,7% of the total amount). • The average purchase price for milk from agri-enterprises in 2005 was 1120 UAH/t (for exception
small enterprises). • In the beginning of 2006 households had 76% of the total number of cows (of 3,5 mln).
Some dairy facts for Dnepropetrovsk region (2003)6:
• The households in the region had 112 thousand cows from the total number equal to 147,7 thousand cows. The households produced 387,9 thousand tonnes of milk (76,4%), while the agri-enterprises gave 120,1 tonnes (23,6%).
• The average annual yield of milk in households was 3110 litres/cow, while at agri-enterprises it was equal to 2282 litre/cow.
• Near 71% of total milk was bought and processed. Near 10,7% was sold at marketplaces.
5 Source: State Committee of Statistics. 6 Source: Statistical annual on Dnepropetrovsk region, 2003.
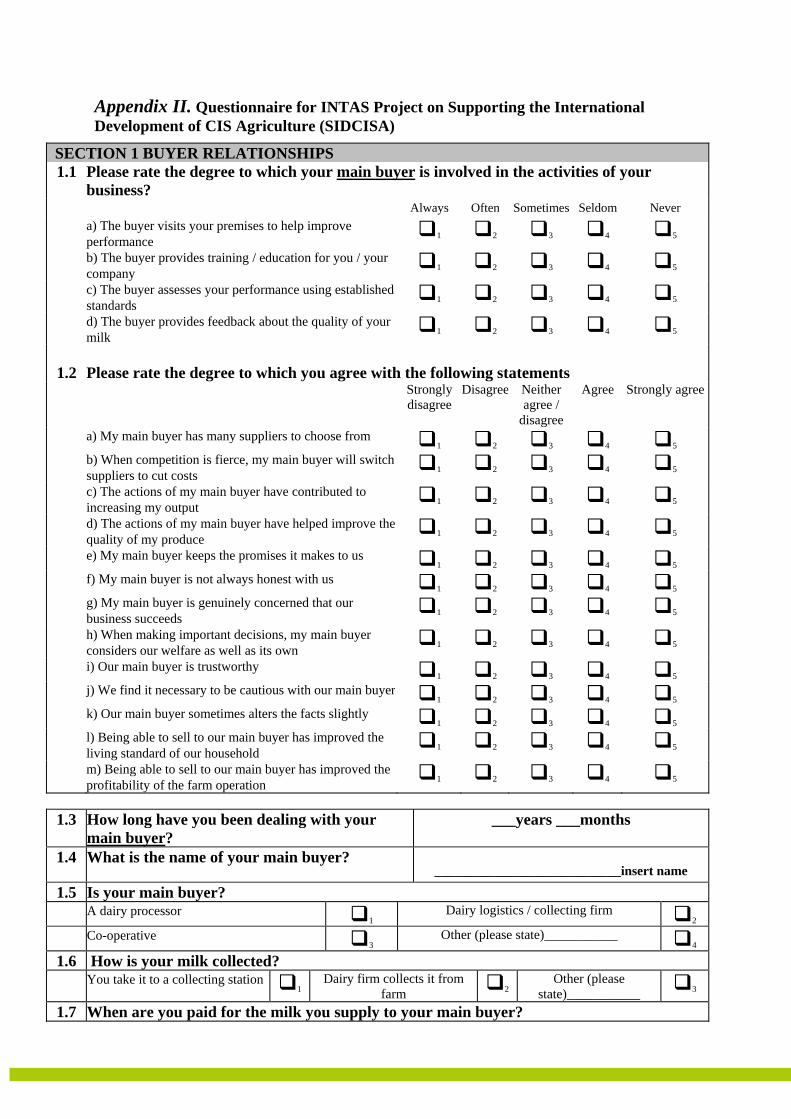
Appendix II. Questionnaire for INTAS Project on Supporting the International Development of CIS Agriculture (SIDCISA)
SECTION 1 BUYER RELATIONSHIPS 1.1 Please rate the degree to which your main buyer is involved in the activities of your
business? Always Often Sometimes Seldom Never a) The buyer visits your premises to help improve
performance 1 2 3 4 5 b) The buyer provides training / education for you / your
company 1 2 3 4 5 c) The buyer assesses your performance using established
standards 1 2 3 4 5 d) The buyer provides feedback about the quality of your
milk 1 2 3 4 5
1.2
Please rate the degree to which you agree with the following statements
Strongly disagree
Disagree Neither agree /
disagree
Agree Strongly agree
a) My main buyer has many suppliers to choose from 1 2 3 4 5
b) When competition is fierce, my main buyer will switch suppliers to cut costs 1 2 3 4 5
c) The actions of my main buyer have contributed to increasing my output 1 2 3 4 5
d) The actions of my main buyer have helped improve the quality of my produce 1 2 3 4 5
e) My main buyer keeps the promises it makes to us 1 2 3 4 5
f) My main buyer is not always honest with us 1 2 3 4 5
g) My main buyer is genuinely concerned that our business succeeds 1 2 3 4 5
h) When making important decisions, my main buyer considers our welfare as well as its own 1 2 3 4 5
i) Our main buyer is trustworthy 1 2 3 4 5
j) We find it necessary to be cautious with our main buyer1 2 3 4 5
k) Our main buyer sometimes alters the facts slightly 1 2 3 4 5
l) Being able to sell to our main buyer has improved the living standard of our household 1 2 3 4 5
m) Being able to sell to our main buyer has improved the profitability of the farm operation 1 2 3 4 5
1.3 How long have you been dealing with your
main buyer? ___years ___months
1.4 What is the name of your main buyer?
____________________________insert name
1.5 Is your main buyer? A dairy processor
1 Dairy logistics / collecting firm 2
Co-operative 3
Other (please state)___________ 4
1.6 How is your milk collected? You take it to a collecting station
1 Dairy firm collects it from
farm 2 Other (please
state)___________ 3
1.7 When are you paid for the milk you supply to your main buyer?

On delivery 1 After delivery
(record how many days _____) 2
Very dissatisfied
Dis-satisfied
Neither satisfied /
dissatisfied
Satisfied Very satisfied
1.8 Overall how satisfied are you with the relationship with your main buyer?
1 2 3 4 5
1.9 How important are the following factors in your choice of main buyer? No
importance Slight
importanceModerate
importance Very
important Most
important a) Reliability of payments by buyer
1 2 3 4 5 b) Higher prices offered by buyer
1 2 3 4 5 c) Extra services offered by buyer (e.g. credit)
1 2 3 4 5 d) Price stability
1 2 3 4 5 e) Buyer is trustworthy
1 2 3 4 5 f) Other (please state) _________________
1 2 3 4 5 1.10 How many potential commercial buyers do
you think there realistically are for your milk?
______________insert number
Very difficult
Difficult Neither easy nor difficult
Easy Very easy
1.11 How easy is it for you to switch to another main buyer for your milk?
1 2 3 4 5
1.12 How easy do you think it would be for your main buyer to replace you as a supplier?
1 2 3 4 5
SECTION 2: PRODUCTION, PRODUCTIVITY AND PRICES 2.1 Do you collaborate (organise) with other farmers on any of the following activities? Yes No If No, would you be willing to
collaborate in future? a) marketing of milk
1 2 Yes, in future 1 No, in future 2 b) processing of milk
1 2 Yes, in future 1 No, in future 2 c) marketing of processed dairy
products 1 2 Yes, in future 1 No, in future 2
d) input purchasing 1 2 Yes, in future 1 No, in future 2
e) lobbing 1 2 Yes, in future 1 No, in future 2
f) milk storage 1 2 Yes, in future 1 No, in future 2
g) other (specify) ____________________
1 2 Yes, in future 1
Specify other future______________
No, in future 2

2.2 Please complete the following table on your number of animals
In 2001 In 2003 In 2005 a) Number of milking cows of productive age (older
than 2 years)
b) Number of heifers c) Number of calves 2.3 Please complete the following table on the average yield in litres per cow
In 2001 In 2003 In 2005 Per day Per day per day
Winter Summ-er
Total for
year Winter
Summ-er
Total for year Winter Summ-
er
Total for
year Milking cows
2.4 What price did you get on average for the cows' milk you produced for your main buyer last month? (local currency/ltr.) ________
2.5 What price did you receive from your main buyer for cows’ milk during the 2005 summer season? (local currency/ltr.)
Min ______
Average _____
Max_____
2.6 What price did you receive from your main buyer for cows’ milk during the last (i.e. 2004/5) winter season? (local currency/ltr.)
Min ______
Average _____
Max_____
SECTION 3: CONTRACT RELATIONSHIPS 3.1 Please complete the table outlining what proportion of your total output of milk you sell to
different types of buyers and how many you dealt with. Year 2001 Year 2005
No. of firms / actors dealt with (2001)
No. of firms /actors dealt with (2005)
% of output sold on
contract (2001)
% of output sold on
contract (2005)
Local markets / auctions
________%
________%
_______
_______
________%
________%
Food processors
________%
________%
_______
_______
________%
________%
Marketing co-operative / organisations
________%
________%
_______
_______
________%
________%
Wholesalers
________%
________%
_______
_______
________%
________%
Household / family / non-marketed consumption
________%
________%
_______
_______
________%
________%
Other
________%
________%
_______
_______
________%
________%
Total
__100__%
__100__%
_______
_______

3.2 Considering your relationship with your most important buyer, does the buyer provide any of the following types of support? Possible Support Measure Offer Yes
or No If Yes
Year first gained
How would you rate the importance of this measure on a scale of 1 to 5 (1= not important; 5 = most important)
What has been the impact of the support measure on your milk yields? (obtain figure for average % change in yields)
What has been the impact of the support on the quality of your milk?
(a) % change in output meeting highest grade standards
(b) % change in output meeting minimum standards
Credit including loans and forward payments. If granted specify term i.e. 3 months, year etc. _______________
Physical Inputs (e.g. seeds, feed, including pre-financing feed etc.)
Machinery If granted, specify whether rented, free or on lease: _________________
Transportation If granted, specify whether rented, free or on lease: _________________
Specialised storage If granted, specify whether rented, free or on lease: _________________
Guaranteed prices

3.2 (continued) Possible Support Measure Offer Yes
or No If Yes
Year first gained
How would you rate the importance of this measure on a scale of 1 to 5 (1= not important; 5 = most important)
What has been the impact of the support measure on your milk yields? (obtain figure for average % change in yields)
What has been the impact of the support on the quality of your milk?
(a) % change in output meeting highest grade standards
(b) % change in output meeting minimum standards
Veterinary Support
Business and financial management support
Harvest & handling support
Farm loan guarantees (given by processor to banks)
Investment loans
Quality control
Prompt payments
Market access
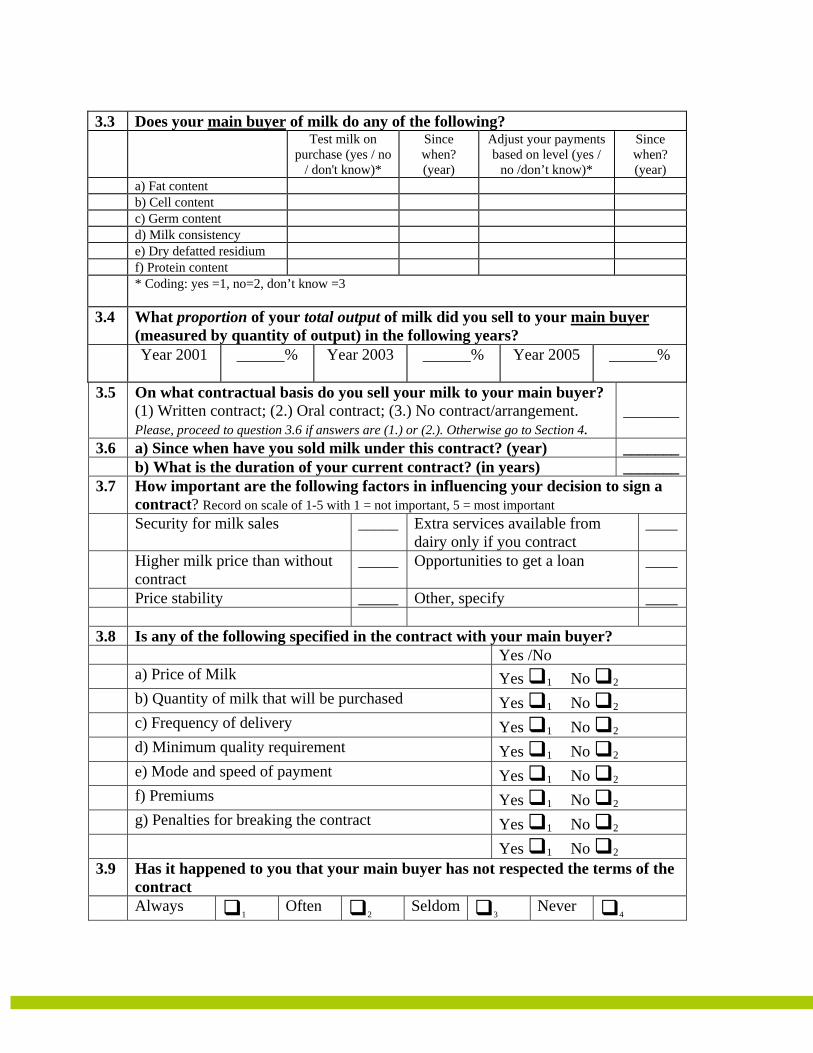
3.3 Does your main buyer of milk do any of the following? Test milk on
purchase (yes / no / don't know)*
Since when? (year)
Adjust your payments based on level (yes /
no /don’t know)*
Since when? (year)
a) Fat content b) Cell content c) Germ content d) Milk consistency e) Dry defatted residium f) Protein content * Coding: yes =1, no=2, don’t know =3
3.4 What proportion of your total output of milk did you sell to your main buyer
(measured by quantity of output) in the following years? Year 2001 ______% Year 2003 ______% Year 2005 ______%
3.5 On what contractual basis do you sell your milk to your main buyer?
(1) Written contract; (2.) Oral contract; (3.) No contract/arrangement. Please, proceed to question 3.6 if answers are (1.) or (2.). Otherwise go to Section 4.
_______
3.6 a) Since when have you sold milk under this contract? (year) _______ b) What is the duration of your current contract? (in years) _______3.7 How important are the following factors in influencing your decision to sign a
contract? Record on scale of 1-5 with 1 = not important, 5 = most important Security for milk sales _____ Extra services available from
dairy only if you contract ____
Higher milk price than without contract
_____ Opportunities to get a loan ____
Price stability _____ Other, specify ____ 3.8 Is any of the following specified in the contract with your main buyer? Yes /No a) Price of Milk Yes 1 No 2 b) Quantity of milk that will be purchased Yes 1 No 2 c) Frequency of delivery Yes 1 No 2 d) Minimum quality requirement Yes 1 No 2 e) Mode and speed of payment Yes 1 No 2 f) Premiums Yes 1 No 2 g) Penalties for breaking the contract Yes 1 No 2 Yes 1 No 2 3.9 Has it happened to you that your main buyer has not respected the terms of the
contract Always
1 Often 2 Seldom
3 Never 4
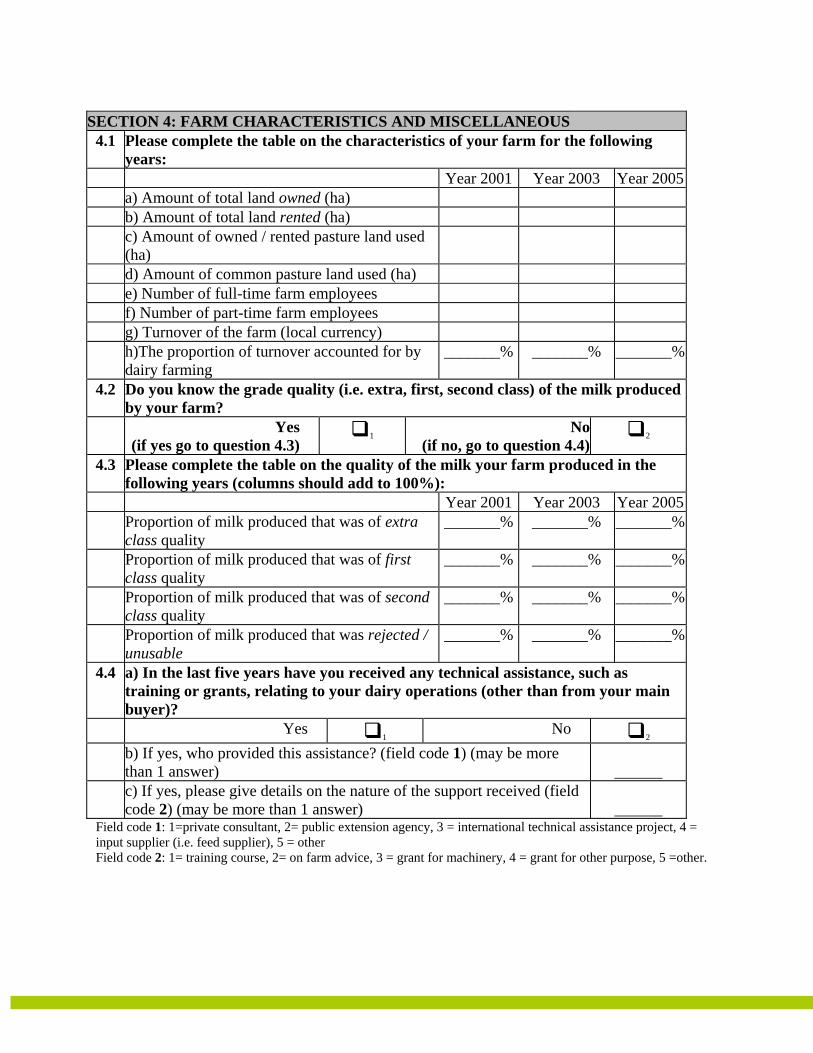
SECTION 4: FARM CHARACTERISTICS AND MISCELLANEOUS
4.1 Please complete the table on the characteristics of your farm for the following years:
Year 2001 Year 2003 Year 2005 a) Amount of total land owned (ha) b) Amount of total land rented (ha) c) Amount of owned / rented pasture land used
(ha)
d) Amount of common pasture land used (ha) e) Number of full-time farm employees f) Number of part-time farm employees g) Turnover of the farm (local currency) h)The proportion of turnover accounted for by
dairy farming _______% _______% _______%
4.2 Do you know the grade quality (i.e. extra, first, second class) of the milk produced by your farm?
Yes (if yes go to question 4.3)
1 No (if no, go to question 4.4)
2
4.3 Please complete the table on the quality of the milk your farm produced in the following years (columns should add to 100%):
Year 2001 Year 2003 Year 2005 Proportion of milk produced that was of extra
class quality _______% _______% _______%
Proportion of milk produced that was of first class quality
_______% _______% _______%
Proportion of milk produced that was of second class quality
_______% _______% _______%
Proportion of milk produced that was rejected / unusable
_______% _______% _______%
4.4 a) In the last five years have you received any technical assistance, such as training or grants, relating to your dairy operations (other than from your main buyer)?
Yes 1 No
2 b) If yes, who provided this assistance? (field code 1) (may be more
than 1 answer)
______ c) If yes, please give details on the nature of the support received (field
code 2) (may be more than 1 answer)
______ Field code 1: 1=private consultant, 2= public extension agency, 3 = international technical assistance project, 4 = input supplier (i.e. feed supplier), 5 = other Field code 2: 1= training course, 2= on farm advice, 3 = grant for machinery, 4 = grant for other purpose, 5 =other.
Page 33
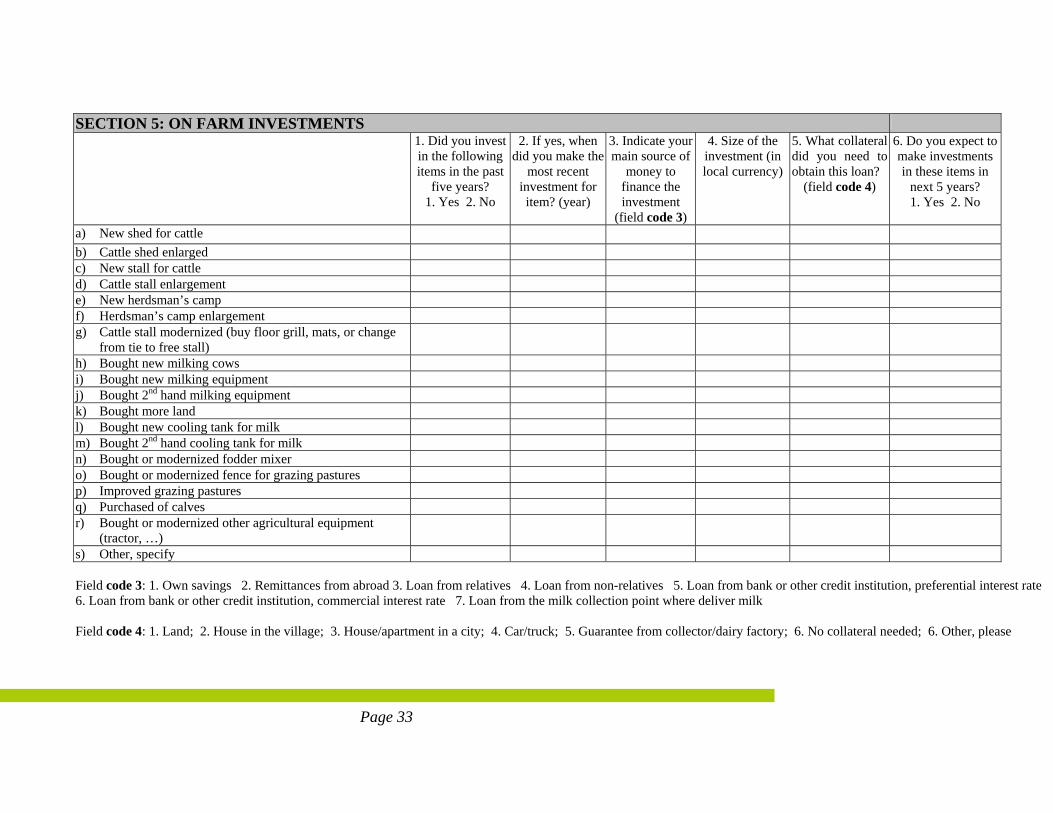
SECTION 5: ON FARM INVESTMENTS 1. Did you invest
in the following items in the past
five years? 1. Yes 2. No
2. If yes, when did you make the
most recent investment for item? (year)
3. Indicate your main source of
money to finance the investment
(field code 3)
4. Size of the investment (in local currency)
5. What collateral did you need to obtain this loan?
(field code 4)
6. Do you expect to make investments in these items in
next 5 years? 1. Yes 2. No
a) New shed for cattle b) Cattle shed enlarged c) New stall for cattle d) Cattle stall enlargement e) New herdsman’s camp f) Herdsman’s camp enlargement g) Cattle stall modernized (buy floor grill, mats, or change
from tie to free stall)
h) Bought new milking cows i) Bought new milking equipment j) Bought 2nd hand milking equipment k) Bought more land l) Bought new cooling tank for milk m) Bought 2nd hand cooling tank for milk n) Bought or modernized fodder mixer o) Bought or modernized fence for grazing pastures p) Improved grazing pastures q) Purchased of calves r) Bought or modernized other agricultural equipment
(tractor, …)
s) Other, specify Field code 3: 1. Own savings 2. Remittances from abroad 3. Loan from relatives 4. Loan from non-relatives 5. Loan from bank or other credit institution, preferential interest rate 6. Loan from bank or other credit institution, commercial interest rate 7. Loan from the milk collection point where deliver milk Field code 4: 1. Land; 2. House in the village; 3. House/apartment in a city; 4. Car/truck; 5. Guarantee from collector/dairy factory; 6. No collateral needed; 6. Other, please
34
Intermediate report INTAS PROJECT 04-79-6928, Phase II, Ukraine
specify

Page 35
Appendix III. Descriptive statistics of all variables for three samples The original sample
Variables 1.1 a 1.1 b 1.1 c 1.1 d 1.2 a 1.2 b 1.2 c 1.2 d Mean value 4,88 4,98 3,16 3,24 3,45 3,07 2,06 1,86Median 5,00 5,00 3,00 3,00 3,00 3,00 2,00 2,00Mode 5,00 5,00 3,00 3,00 3,00 3,00 2,00 2,00SD 0,48 0,19 0,84 1,10 0,83 0,58 0,61 0,69Kurtosis 20,22 182,74 0,51 -0,38 -0,41 1,31 5,20 4,11Skewness -4,47 -12,78 -0,12 -0,16 -0,07 0,20 1,67 1,32Minimum 2,00 2,00 1,00 1,00 1,00 1,00 1,00 1,00Maximum 5,00 5,00 5,00 5,00 5,00 5,00 5,00 5,00Sum 1543,00 1574,00 999,00 1025,00 1090,00 970,00 652,00 588,00Sample size 316,00 316,00 316,00 316,00 316,00 316,00 316,00 316,00
The householder sample
Variables 1.1 a 1.1 b 1.1 c 1.1 d 1.2 a 1.2 b 1.2 c 1.2 d Mean value 4,99 5,00 3,20 3,41 3,48 3,07 2,02 1,80Median 5,00 5,00 3,00 3,00 3,00 3,00 2,00 2,00Mode 5,00 5,00 3,00 3,00 3,00 3,00 2,00 2,00SD 0,12 0,00 0,73 0,96 0,79 0,52 0,50 0,56Kurtosis 288,00 n/a 0,61 -0,35 -0,43 1,38 9,24 2,82Skewness -16,97 n/a 0,11 0,07 0,00 -0,05 1,86 0,57Minimum 3,00 5,00 1,00 1,00 2,00 1,00 1,00 1,00Maximum 5,00 5,00 5,00 5,00 5,00 4,00 5,00 4,00Sum 1438,00 1440,00 923,00 982,00 1001,00 884,00 583,00 518,00Sample size 288,00 288,00 288,00 288,00 288,00 288,00 288,00 288,00
The corporate farms
Variables 1.1 a 1.1 b 1.1 c 1.1 d 1.2 a 1.2 b 1.2 c 1.2 d Mean value 3,75 4,79 2,71 1,54 3,18 3,07 2,46 2,50Median 4,00 5,00 2,00 1,00 3,00 3,00 2,00 2,00Mode 4,00 5,00 2,00 1,00 2,00 2,00 2,00 2,00SD 1,04 0,63 1,56 1,00 1,16 1,02 1,20 1,29Kurtosis -1,03 14,68 -1,44 5,33 -1,10 -0,79 -1,52 -0,95Skewness -0,31 -3,64 0,39 2,29 0,09 0,53 0,23 0,50Minimum 2,00 2,00 1,00 1,00 1,00 2,00 1,00 1,00Maximum 5,00 5,00 5,00 5,00 5,00 5,00 4,00 5,00Sum 105,00 134,00 76,00 43,00 89,00 86,00 69,00 70,00Sample size 28,00 28,00 28,00 28,00 28,00 28,00 28,00 28,00

Intermediate report INTAS PROJECT 04-79-6928, Phase II, Ukraine
Variables 1.2 e 1.2 f 1.2 g 1.2 h 1.2 i 1.2 j 1.2 k 1.2 l 1.2 m Mean value 3,62 2,83 2,61 2,32 3,24 3,00 3,10 2,82 2,84Median 4,00 3,00 3,00 2,00 3,00 3,00 3,00 3,00 3,00Mode 4,00 3,00 3,00 2,00 3,00 3,00 3,00 2,00 3,00SD 0,54 0,52 0,60 0,60 0,57 0,46 0,57 0,87 0,51Kurtosis 0,93 0,90 -0,60 -0,18 -0,22 2,72 0,05 -1,04 3,72Skewness -1,03 -0,06 0,32 0,11 0,05 0,20 0,02 0,28 -0,65Minimum 1,00 2,00 1,00 1,00 2,00 2,00 2,00 1,00 1,00Maximum 5,00 5,00 4,00 4,00 5,00 5,00 4,00 5,00 5,00Sum 1144,00 893,00 825,00 732,00 1024,00 948,00 980,00 890,00 897,00Sample size 316,00 316,00 316,00 316,00 316,00 316,00 316,00 316,00 316,00
Variables 1.2 e 1.2 f 1.2 g 1.2 h 1.2 i 1.2 j 1.2 k 1.2 l 1.2 m Mean value 3,61 2,85 2,60 2,31 3,22 3,00 3,13 2,82 2,85Median 4,00 3,00 3,00 2,00 3,00 3,00 3,00 3,00 3,00Mode 4,00 3,00 3,00 2,00 3,00 3,00 3,00 2,00 3,00SD 0,52 0,48 0,58 0,58 0,55 0,40 0,54 0,87 0,43Kurtosis -0,77 0,66 -0,75 -0,32 -0,22 3,48 0,28 -1,06 3,86Skewness -0,75 -0,38 0,33 0,06 0,06 0,03 0,11 0,29 -1,53Minimum 2,00 2,00 2,00 1,00 2,00 2,00 2,00 1,00 1,00Maximum 4,00 4,00 4,00 4,00 4,00 4,00 4,00 5,00 4,00Sum 1039,00 820,00 748,00 666,00 927,00 865,00 901,00 813,00 822,00Sample size 288,00 288,00 288,00 288,00 288,00 288,00 288,00 288,00 288,00
Variables 1.2 e 1.2 f 1.2 g 1.2 h 1.2 i 1.2 j 1.2 k 1.2 l 1.2 mMean value 3,75 2,61 2,75 2,36 3,46 2,96 2,82 2,75 2,68Median 4,00 2,00 3,00 2,00 4,00 3,00 3,00 3,00 2,50Mode 4,00 2,00 3,00 2,00 4,00 3,00 2,00 2,00 2,00SD 0,75 0,79 0,80 0,78 0,74 0,88 0,77 0,84 1,02Kurtosis 6,79 1,80 -0,55 -0,05 -0,21 -0,76 -1,21 -0,86 0,30Skewness -2,36 1,34 0,03 0,26 -0,45 0,42 0,33 0,12 0,71Minimum 1,00 2,00 1,00 1,00 2,00 2,00 2,00 1,00 1,00Maximum 5,00 5,00 4,00 4,00 5,00 5,00 4,00 4,00 5,00Sum 105,00 73,00 77,00 66,00 97,00 83,00 79,00 77,00 75,00Sample size 28,00 28,00 28,00 28,00 28,00 28,00 28,00 28,00 28,00

Intermediate report INTAS PROJECT 04-79-6928, Phase II, Ukraine
Variables 1,3 1,5 1,6 1.7 days 1,8 1.9 a 1.9 b 1.9 c Mean value 3,20 1,95 1,72 4,06 3,24 4,35 4,82 2,18Median 3,00 2,00 2,00 1,00 3,00 4,00 5,00 2,00Mode 3,00 2,00 2,00 0,00 4,00 4,00 5,00 2,00SD 2,35 0,49 0,45 4,84 0,89 0,49 0,41 1,05Kurtosis 24,39 8,67 -1,02 6,23 -0,83 -1,51 7,12 -0,66Skewness 3,24 1,52 -0,99 1,72 -0,53 0,53 -2,36 0,56Minimum 0,10 1,00 1,00 0,00 1,00 3,00 2,00 1,00Maximum 25,00 4,00 2,00 30,00 5,00 5,00 5,00 5,00Sum 1010,75 616,00 544,00 1283,00 1025,00 1376,00 1523,00 690,00Sample size 316,00 316,00 316,00 316,00 316,00 316,00 316,00 316,00
Variables 1,3 1,5 1,6 1.7 days 1,8 1.9 a 1.9 b 1.9 c Mean value 3,12 2,01 1,72 3,75 3,25 4,34 4,83 2,15Median 3,00 2,00 2,00 1,00 3,00 4,00 5,00 2,00Mode 3,00 2,00 2,00 0,00 4,00 4,00 5,00 2,00SD 1,82 0,43 0,45 4,59 0,88 0,48 0,40 1,05Kurtosis 0,31 14,15 -1,09 6,15 -0,71 -1,42 8,56 -0,59Skewness 0,67 2,50 -0,96 1,68 -0,58 0,58 -2,56 0,60Minimum 0,10 1,00 1,00 0,00 1,00 3,00 2,00 1,00Maximum 10,00 4,00 2,00 30,00 5,00 5,00 5,00 5,00Sum 898,80 578,00 494,00 1081,00 937,00 1250,00 1391,00 620,00Sample size 288,00 288,00 288,00 288,00 288,00 288,00 288,00 288,00
Variables 1,3 1,5 1,6 1.7 days 1,8 1.9 a 1.9 b 1.9 c Mean value 4,00 1,36 1,79 7,21 3,14 4,50 4,71 2,50Median 2,00 1,00 2,00 7,00 3,50 4,50 5,00 2,00Mode 5,00 1,00 2,00 10,00 4,00 4,00 5,00 2,00SD 5,34 0,68 0,42 6,18 1,01 0,51 0,46 1,00Kurtosis 8,71 7,62 0,18 5,84 -1,68 -2,16 -1,08 -0,97Skewness 2,72 2,48 -1,47 1,66 -0,07 0,00 -1,00 0,24Minimum 0,15 1,00 1,00 0,00 2,00 4,00 4,00 1,00Maximum 25,00 4,00 2,00 30,00 5,00 5,00 5,00 4,00Sum 111,95 38,00 50,00 202,00 88,00 126,00 132,00 70,00Sample size 28,00 28,00 28,00 28,00 28,00 28,00 28,00 28,00
Intermediate report INTAS PROJECT 04-79-6928, Phase II, Ukraine
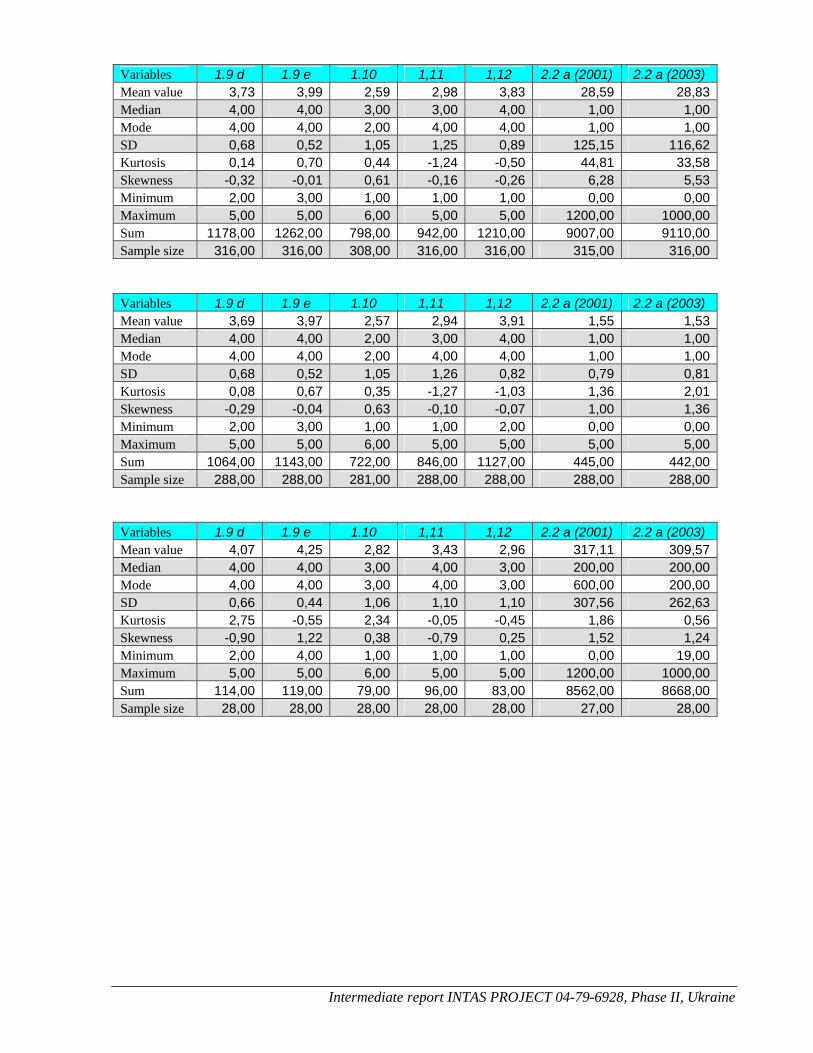
Variables 1.9 d 1.9 e 1.10 1,11 1,12 2.2 a (2001) 2.2 a (2003) Mean value 3,73 3,99 2,59 2,98 3,83 28,59 28,83Median 4,00 4,00 3,00 3,00 4,00 1,00 1,00Mode 4,00 4,00 2,00 4,00 4,00 1,00 1,00SD 0,68 0,52 1,05 1,25 0,89 125,15 116,62Kurtosis 0,14 0,70 0,44 -1,24 -0,50 44,81 33,58Skewness -0,32 -0,01 0,61 -0,16 -0,26 6,28 5,53Minimum 2,00 3,00 1,00 1,00 1,00 0,00 0,00Maximum 5,00 5,00 6,00 5,00 5,00 1200,00 1000,00Sum 1178,00 1262,00 798,00 942,00 1210,00 9007,00 9110,00Sample size 316,00 316,00 308,00 316,00 316,00 315,00 316,00
Variables 1.9 d 1.9 e 1.10 1,11 1,12 2.2 a (2001) 2.2 a (2003) Mean value 3,69 3,97 2,57 2,94 3,91 1,55 1,53Median 4,00 4,00 2,00 3,00 4,00 1,00 1,00Mode 4,00 4,00 2,00 4,00 4,00 1,00 1,00SD 0,68 0,52 1,05 1,26 0,82 0,79 0,81Kurtosis 0,08 0,67 0,35 -1,27 -1,03 1,36 2,01Skewness -0,29 -0,04 0,63 -0,10 -0,07 1,00 1,36Minimum 2,00 3,00 1,00 1,00 2,00 0,00 0,00Maximum 5,00 5,00 6,00 5,00 5,00 5,00 5,00Sum 1064,00 1143,00 722,00 846,00 1127,00 445,00 442,00Sample size 288,00 288,00 281,00 288,00 288,00 288,00 288,00
Variables 1.9 d 1.9 e 1.10 1,11 1,12 2.2 a (2001) 2.2 a (2003) Mean value 4,07 4,25 2,82 3,43 2,96 317,11 309,57Median 4,00 4,00 3,00 4,00 3,00 200,00 200,00Mode 4,00 4,00 3,00 4,00 3,00 600,00 200,00SD 0,66 0,44 1,06 1,10 1,10 307,56 262,63Kurtosis 2,75 -0,55 2,34 -0,05 -0,45 1,86 0,56Skewness -0,90 1,22 0,38 -0,79 0,25 1,52 1,24Minimum 2,00 4,00 1,00 1,00 1,00 0,00 19,00Maximum 5,00 5,00 6,00 5,00 5,00 1200,00 1000,00Sum 114,00 119,00 79,00 96,00 83,00 8562,00 8668,00Sample size 28,00 28,00 28,00 28,00 28,00 27,00 28,00
Intermediate report INTAS PROJECT 04-79-6928, Phase II, Ukraine
Variables 2.2 a (2005)
2.2 b (2001)
2.2 b (2003)
2.2 b (2005)
2.2 c (2001)
2.2 c (2003)
2.2 c (2005)
2.3 (2001
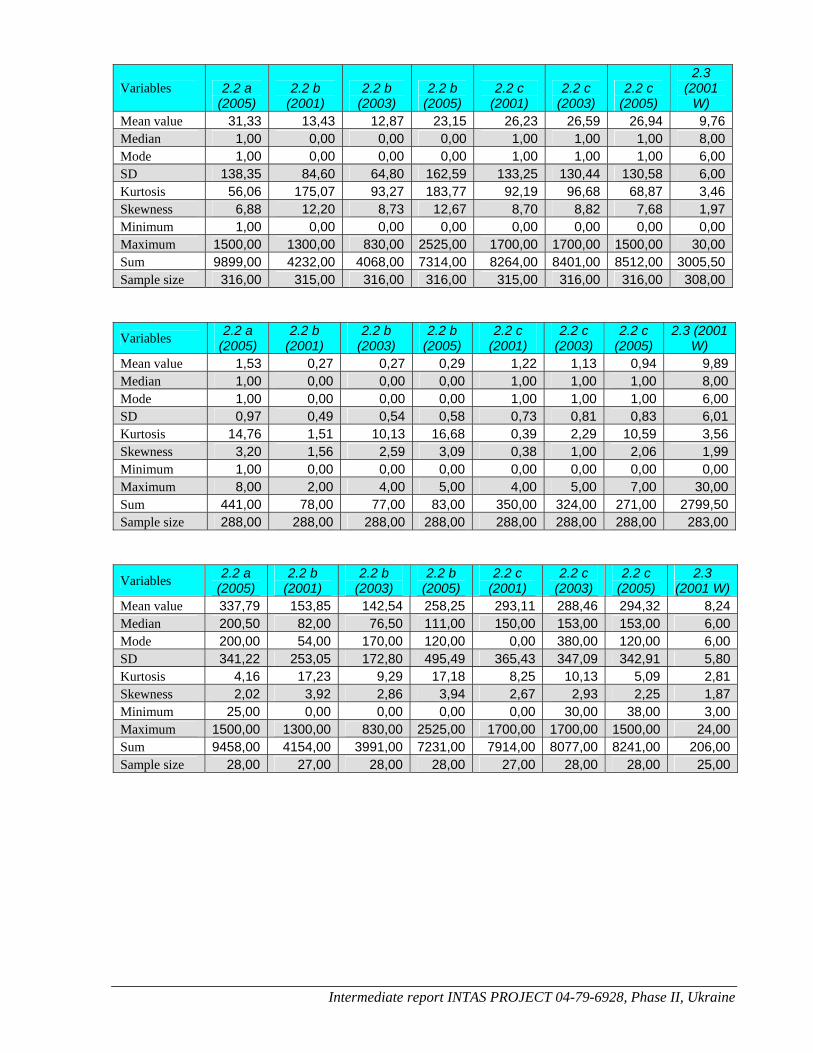
W) Mean value 31,33 13,43 12,87 23,15 26,23 26,59 26,94 9,76Median 1,00 0,00 0,00 0,00 1,00 1,00 1,00 8,00Mode 1,00 0,00 0,00 0,00 1,00 1,00 1,00 6,00SD 138,35 84,60 64,80 162,59 133,25 130,44 130,58 6,00Kurtosis 56,06 175,07 93,27 183,77 92,19 96,68 68,87 3,46Skewness 6,88 12,20 8,73 12,67 8,70 8,82 7,68 1,97Minimum 1,00 0,00 0,00 0,00 0,00 0,00 0,00 0,00Maximum 1500,00 1300,00 830,00 2525,00 1700,00 1700,00 1500,00 30,00Sum 9899,00 4232,00 4068,00 7314,00 8264,00 8401,00 8512,00 3005,50Sample size 316,00 315,00 316,00 316,00 315,00 316,00 316,00 308,00
Variables 2.2 a (2005)
2.2 b (2001)
2.2 b (2003)
2.2 b (2005)
2.2 c (2001)
2.2 c (2003)
2.2 c (2005)
2.3 (2001 W)
Mean value 1,53 0,27 0,27 0,29 1,22 1,13 0,94 9,89Median 1,00 0,00 0,00 0,00 1,00 1,00 1,00 8,00Mode 1,00 0,00 0,00 0,00 1,00 1,00 1,00 6,00SD 0,97 0,49 0,54 0,58 0,73 0,81 0,83 6,01Kurtosis 14,76 1,51 10,13 16,68 0,39 2,29 10,59 3,56Skewness 3,20 1,56 2,59 3,09 0,38 1,00 2,06 1,99Minimum 1,00 0,00 0,00 0,00 0,00 0,00 0,00 0,00Maximum 8,00 2,00 4,00 5,00 4,00 5,00 7,00 30,00Sum 441,00 78,00 77,00 83,00 350,00 324,00 271,00 2799,50Sample size 288,00 288,00 288,00 288,00 288,00 288,00 288,00 283,00
Variables 2.2 a (2005)
2.2 b (2001)
2.2 b (2003)
2.2 b (2005)
2.2 c (2001)
2.2 c (2003)
2.2 c (2005)
2.3 (2001 W)
Mean value 337,79 153,85 142,54 258,25 293,11 288,46 294,32 8,24Median 200,50 82,00 76,50 111,00 150,00 153,00 153,00 6,00Mode 200,00 54,00 170,00 120,00 0,00 380,00 120,00 6,00SD 341,22 253,05 172,80 495,49 365,43 347,09 342,91 5,80Kurtosis 4,16 17,23 9,29 17,18 8,25 10,13 5,09 2,81Skewness 2,02 3,92 2,86 3,94 2,67 2,93 2,25 1,87Minimum 25,00 0,00 0,00 0,00 0,00 30,00 38,00 3,00Maximum 1500,00 1300,00 830,00 2525,00 1700,00 1700,00 1500,00 24,00Sum 9458,00 4154,00 3991,00 7231,00 7914,00 8077,00 8241,00 206,00Sample size 28,00 27,00 28,00 28,00 27,00 28,00 28,00 25,00
Intermediate report INTAS PROJECT 04-79-6928, Phase II, Ukraine
Variables 2.3 (2001 S)
2.3 (2001 - total)
2.3 (2003 W)
2.3 (2003 S)
2.3 (2003 total)
2.3 (2005 W)
2.3 (2005 S)
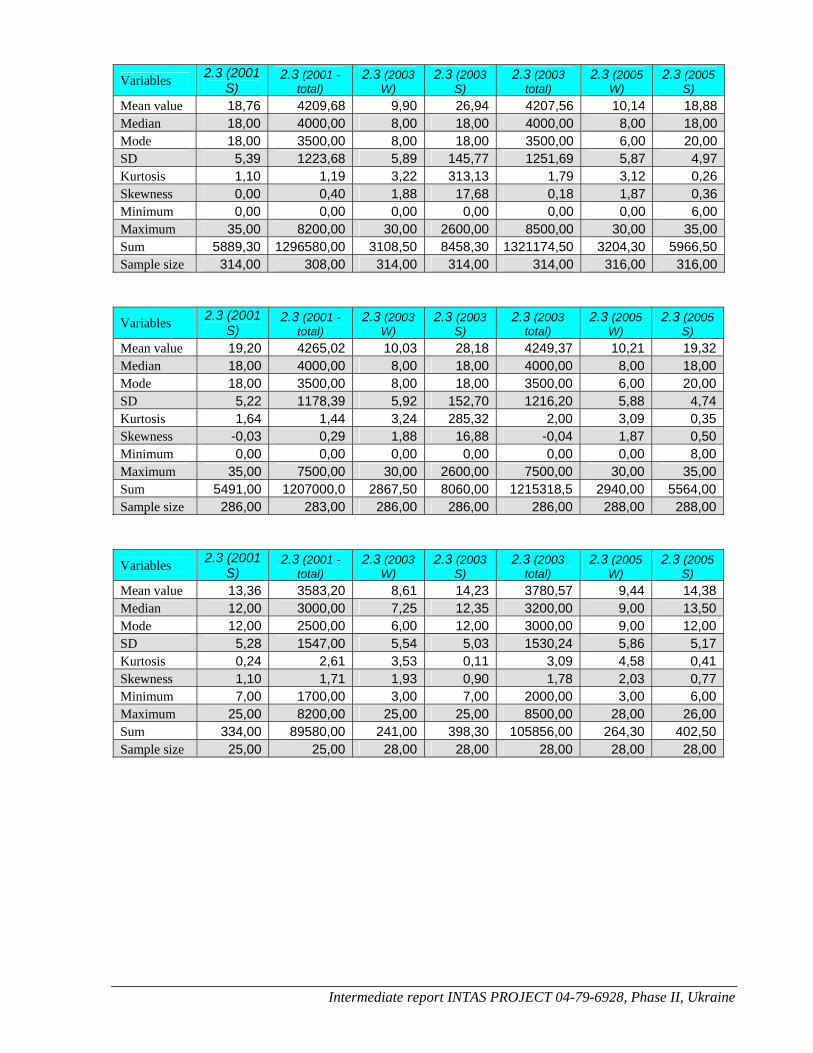
Mean value 18,76 4209,68 9,90 26,94 4207,56 10,14 18,88Median 18,00 4000,00 8,00 18,00 4000,00 8,00 18,00Mode 18,00 3500,00 8,00 18,00 3500,00 6,00 20,00SD 5,39 1223,68 5,89 145,77 1251,69 5,87 4,97Kurtosis 1,10 1,19 3,22 313,13 1,79 3,12 0,26Skewness 0,00 0,40 1,88 17,68 0,18 1,87 0,36Minimum 0,00 0,00 0,00 0,00 0,00 0,00 6,00Maximum 35,00 8200,00 30,00 2600,00 8500,00 30,00 35,00Sum 5889,30 1296580,00 3108,50 8458,30 1321174,50 3204,30 5966,50Sample size 314,00 308,00 314,00 314,00 314,00 316,00 316,00
Variables 2.3 (2001 S)
2.3 (2001 - total)
2.3 (2003 W)
2.3 (2003 S)
2.3 (2003 total)
2.3 (2005 W)
2.3 (2005 S)
Mean value 19,20 4265,02 10,03 28,18 4249,37 10,21 19,32Median 18,00 4000,00 8,00 18,00 4000,00 8,00 18,00Mode 18,00 3500,00 8,00 18,00 3500,00 6,00 20,00SD 5,22 1178,39 5,92 152,70 1216,20 5,88 4,74Kurtosis 1,64 1,44 3,24 285,32 2,00 3,09 0,35Skewness -0,03 0,29 1,88 16,88 -0,04 1,87 0,50Minimum 0,00 0,00 0,00 0,00 0,00 0,00 8,00Maximum 35,00 7500,00 30,00 2600,00 7500,00 30,00 35,00Sum 5491,00 1207000,0 2867,50 8060,00 1215318,5 2940,00 5564,00Sample size 286,00 283,00 286,00 286,00 286,00 288,00 288,00
Variables 2.3 (2001 S)
2.3 (2001 - total)
2.3 (2003 W)
2.3 (2003 S)
2.3 (2003 total)
2.3 (2005 W)
2.3 (2005 S)
Mean value 13,36 3583,20 8,61 14,23 3780,57 9,44 14,38Median 12,00 3000,00 7,25 12,35 3200,00 9,00 13,50Mode 12,00 2500,00 6,00 12,00 3000,00 9,00 12,00SD 5,28 1547,00 5,54 5,03 1530,24 5,86 5,17Kurtosis 0,24 2,61 3,53 0,11 3,09 4,58 0,41Skewness 1,10 1,71 1,93 0,90 1,78 2,03 0,77Minimum 7,00 1700,00 3,00 7,00 2000,00 3,00 6,00Maximum 25,00 8200,00 25,00 25,00 8500,00 28,00 26,00Sum 334,00 89580,00 241,00 398,30 105856,00 264,30 402,50Sample size 25,00 25,00 28,00 28,00 28,00 28,00 28,00
Intermediate report INTAS PROJECT 04-79-6928, Phase II, Ukraine
Variables 2.3 (2005 total) 2,4
2.5 (Min) 2.5 (Ave) 2.5 (Max) 2.6 (Min) 2.6 (Ave) 2.6 (Max)
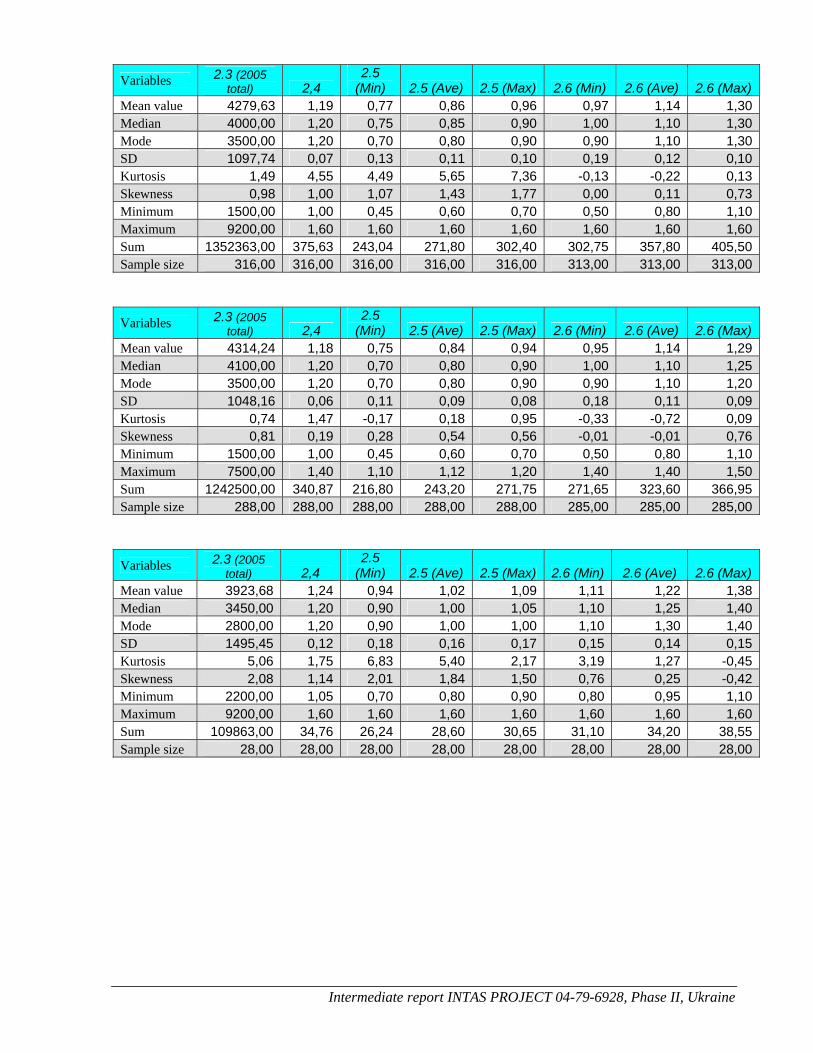
Mean value 4279,63 1,19 0,77 0,86 0,96 0,97 1,14 1,30Median 4000,00 1,20 0,75 0,85 0,90 1,00 1,10 1,30Mode 3500,00 1,20 0,70 0,80 0,90 0,90 1,10 1,30SD 1097,74 0,07 0,13 0,11 0,10 0,19 0,12 0,10Kurtosis 1,49 4,55 4,49 5,65 7,36 -0,13 -0,22 0,13Skewness 0,98 1,00 1,07 1,43 1,77 0,00 0,11 0,73Minimum 1500,00 1,00 0,45 0,60 0,70 0,50 0,80 1,10Maximum 9200,00 1,60 1,60 1,60 1,60 1,60 1,60 1,60Sum 1352363,00 375,63 243,04 271,80 302,40 302,75 357,80 405,50Sample size 316,00 316,00 316,00 316,00 316,00 313,00 313,00 313,00
Variables 2.3 (2005 total) 2,4
2.5 (Min) 2.5 (Ave) 2.5 (Max) 2.6 (Min) 2.6 (Ave) 2.6 (Max)
Mean value 4314,24 1,18 0,75 0,84 0,94 0,95 1,14 1,29Median 4100,00 1,20 0,70 0,80 0,90 1,00 1,10 1,25Mode 3500,00 1,20 0,70 0,80 0,90 0,90 1,10 1,20SD 1048,16 0,06 0,11 0,09 0,08 0,18 0,11 0,09Kurtosis 0,74 1,47 -0,17 0,18 0,95 -0,33 -0,72 0,09Skewness 0,81 0,19 0,28 0,54 0,56 -0,01 -0,01 0,76Minimum 1500,00 1,00 0,45 0,60 0,70 0,50 0,80 1,10Maximum 7500,00 1,40 1,10 1,12 1,20 1,40 1,40 1,50Sum 1242500,00 340,87 216,80 243,20 271,75 271,65 323,60 366,95Sample size 288,00 288,00 288,00 288,00 288,00 285,00 285,00 285,00
Variables 2.3 (2005 total) 2,4
2.5 (Min) 2.5 (Ave) 2.5 (Max) 2.6 (Min) 2.6 (Ave) 2.6 (Max)
Mean value 3923,68 1,24 0,94 1,02 1,09 1,11 1,22 1,38Median 3450,00 1,20 0,90 1,00 1,05 1,10 1,25 1,40Mode 2800,00 1,20 0,90 1,00 1,00 1,10 1,30 1,40SD 1495,45 0,12 0,18 0,16 0,17 0,15 0,14 0,15Kurtosis 5,06 1,75 6,83 5,40 2,17 3,19 1,27 -0,45Skewness 2,08 1,14 2,01 1,84 1,50 0,76 0,25 -0,42Minimum 2200,00 1,05 0,70 0,80 0,90 0,80 0,95 1,10Maximum 9200,00 1,60 1,60 1,60 1,60 1,60 1,60 1,60Sum 109863,00 34,76 26,24 28,60 30,65 31,10 34,20 38,55Sample size 28,00 28,00 28,00 28,00 28,00 28,00 28,00 28,00

Intermediate report INTAS PROJECT 04-79-6928, Phase II, Ukraine
Variables 3.4 (2001) 3.4 (2003) 3.4 (2005) 3,5 Mean value 69,67 80,43 85,03 2,85Median 80,00 90,00 90,00 3,00Mode 95,00 95,00 95,00 3,00SD 32,08 23,48 17,34 0,52Kurtosis 0,12 3,45 2,84 8,80Skewness -1,17 -1,94 -1,81 -3,26Minimum 0,00 0,00 20,00 1,00Maximum 100,00 100,00 100,00 3,00Sum 21806,00 25417,00 26870,00 901,00Sample size 313,00 316,00 316,00 316,00
Variables 3.4 (2001) 3.4 (2003) 3.4 (2005) 3,5 Mean value 67,98 79,46 84,53 3,00Median 80,00 90,00 90,00 3,00Mode 95,00 95,00 95,00 3,00SD 32,59 23,95 17,51 0,00Kurtosis -0,10 3,08 2,29 n/aSkewness -1,08 -1,84 -1,68 n/aMinimum 0,00 0,00 20,00 3,00Maximum 100,00 100,00 100,00 3,00Sum 19578,00 22884,00 24346,00 864,00Sample size 288,00 288,00 288,00 288,00
Variables 3.4 (2001) 3.4 (2003) 3.4 (2005) 3,5 Mean value 89,12 90,46 90,14 1,32Median 95,00 95,00 95,00 1,00Mode 95,00 95,00 95,00 1,00SD 15,67 14,85 14,77 0,67Kurtosis 16,99 20,31 20,23 2,32Skewness -3,92 -4,32 -4,25 1,91Minimum 20,00 20,00 20,00 1,00Maximum 100,00 100,00 100,00 3,00Sum 2228,00 2533,00 2524,00 37,00Sample size 25,00 28,00 28,00 28,00