Embed Size (px)
Citation preview

An Overview of Business An Overview of Business Tendency SurveysTendency Surveys
Richard VincentRichard VincentRichard EvansRichard Evans
Statistics CanadaStatistics Canada
International Conference on Establishment International Conference on Establishment SurveysSurveysMontréalMontréal
June, 2007June, 2007
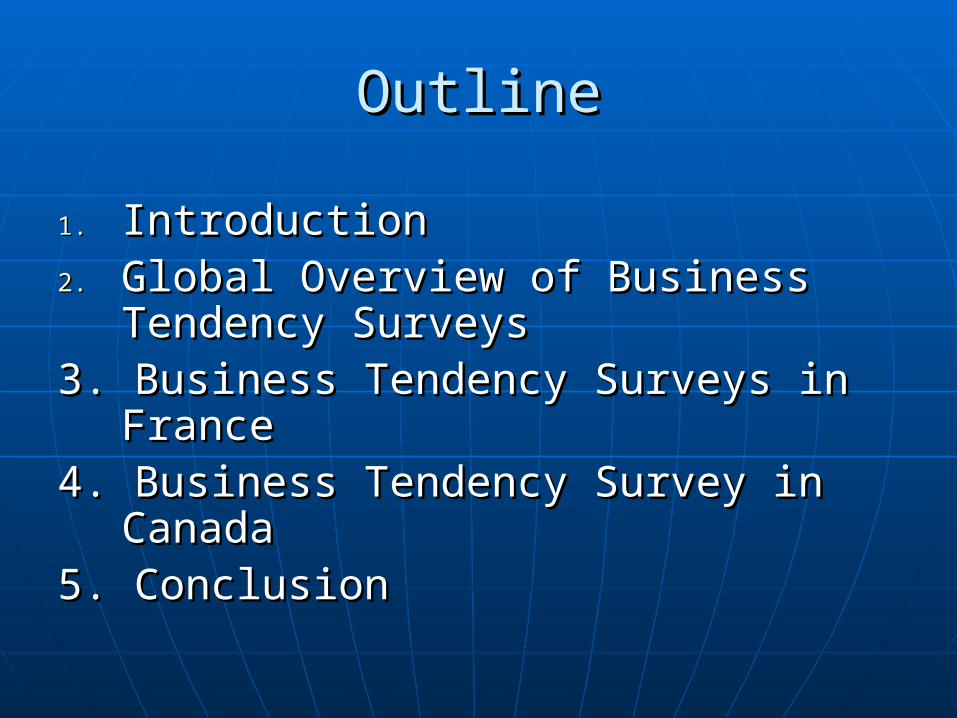
OutlineOutline
1.1. IntroductionIntroduction2.2. Global Overview of Business Global Overview of Business
Tendency SurveysTendency Surveys3. Business Tendency Surveys in 3. Business Tendency Surveys in
FranceFrance4. Business Tendency Survey in 4. Business Tendency Survey in
CanadaCanada5. Conclusion 5. Conclusion

IntroductionIntroduction
Key QuestionKey Question
These surveys have many These surveys have many commonalities, yet there are striking commonalities, yet there are striking differences. differences.
Why?Why?
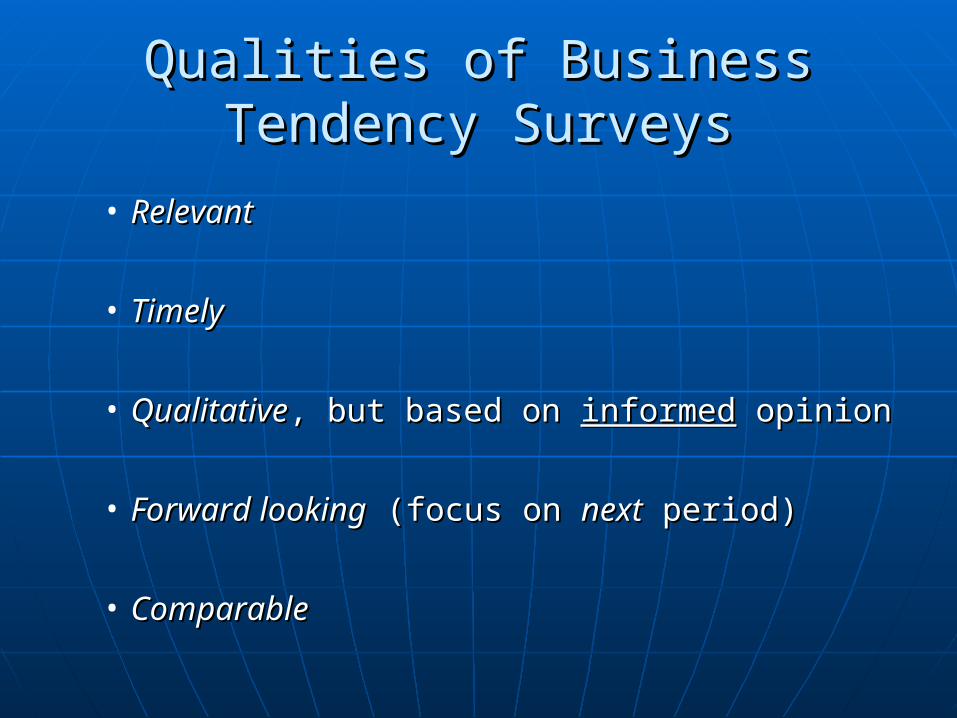
Qualities of Business Tendency Qualities of Business Tendency SurveysSurveys
• RelevantRelevant
• TimelyTimely
• QualitativeQualitative, but based on , but based on informedinformed opinion opinion
• Forward lookingForward looking (focus on (focus on nextnext period) period)
• Comparable Comparable
Global Overview of BTSsGlobal Overview of BTSs
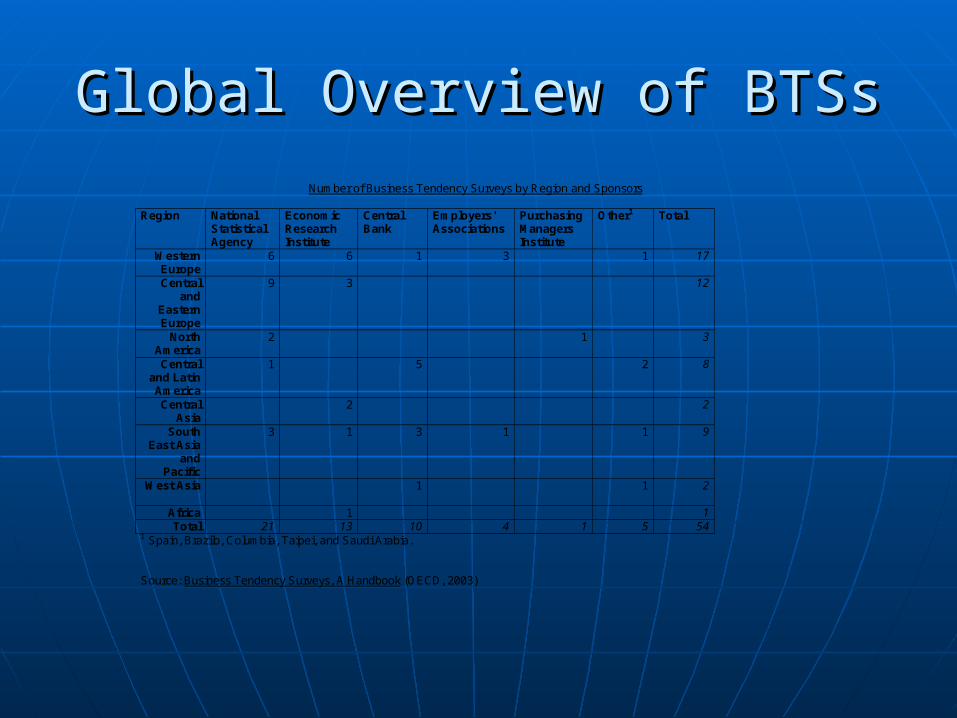
Number of Business Tendency Surveys by Region and Sponsors Region National
Statistical Agency
Economic Research Institute
Central Bank
Employers' Associations
Purchasing Managers Institute
Other1 Total
Western Europe
6 6 1 3 1 17
Central and
Eastern Europe
9 3 12
North America
2 1 3
Central and Latin America
1 5 2
8
Central Asia
2 2
South East Asia
and Pacific
3 1 3 1 1
9
West Asia 1 1
2
Africa 1 1 Total 21 13 10 4 1 5 54
1 Spain, Brazilo, Columbia, Taipei, and Saudi Arabia. Source: Business Tendency Surveys, A Handbook (OECD, 2003)

Global Overview of BTSsGlobal Overview of BTSs
Industrial Coverage of BTSsIndustrial Coverage of BTSs EuropeEurope
• ManufacturingManufacturing• ConstructionConstruction• Retail TradeRetail Trade• Other Service IndustriesOther Service Industries
CanadaCanada• ManufacturingManufacturing• Traveller AccommodationTraveller Accommodation
Purchasing Managers (USA, Europe)Purchasing Managers (USA, Europe)• ManufacturingManufacturing• ServicesServices
Global Overview of BTSsGlobal Overview of BTSs
ContentContent
Future / current business situation re:Future / current business situation re:• ProductionProduction• PricesPrices• Labour marketLabour market
Business Tendency Surveys BTS Business Tendency Surveys BTS in Canadain Canada
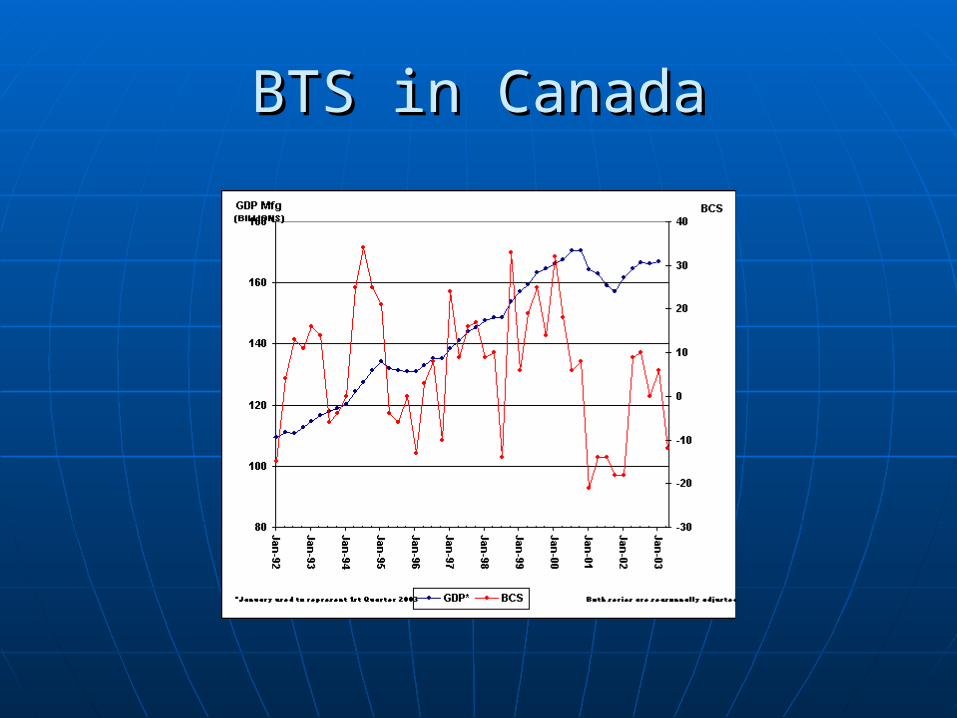
Manufacturing BCSManufacturing BCS Since 1976Since 1976 QuarterlyQuarterly Stratified sample of 10,000 est.Stratified sample of 10,000 est. 2 pages2 pages Three sectionsThree sections
• ImpedimentsImpediments• Current conditions (last quarter)Current conditions (last quarter)• Future conditions (next quarter)Future conditions (next quarter)
BTS in CanadaBTS in Canada
Manufacturing BCSManufacturing BCS Well respected as leading indicatorWell respected as leading indicator Two financial institutions ‘repackage’ Two financial institutions ‘repackage’
manufacturing BCS and releasemanufacturing BCS and release Much media attentionMuch media attention Can influence value of Cdn $Can influence value of Cdn $
BTS in CanadaBTS in Canada
BTS in CanadaBTS in Canada
Manufacturing BTSs and the Canadian Manufacturing BTSs and the Canadian Statistical SystemStatistical System
Not required as input into System of Not required as input into System of National AccountsNational Accounts
Considered during analysis of Considered during analysis of composite leading indicatorscomposite leading indicators
Supported by Department of Finance Supported by Department of Finance and Bank of Canadaand Bank of Canada
BTS in CanadaBTS in Canada Quarterly Business Conditions Survey for the Quarterly Business Conditions Survey for the
Traveller Accommodation industryTraveller Accommodation industry• Developed in partnership with Canadian Tourism Developed in partnership with Canadian Tourism
Commission; Ontario Ministry of Tourism is now key Commission; Ontario Ministry of Tourism is now key supportersupporter
• Released for the first time: May 16, 2005 (Q2)Released for the first time: May 16, 2005 (Q2)• Stratified sample of 2,500 establishmentsStratified sample of 2,500 establishments• 2 pages, qualitative (comparable to Manufacturing BCS)2 pages, qualitative (comparable to Manufacturing BCS)• Garnered much media coverageGarnered much media coverage• Used by National Tourism Indicators; Composite Leading Used by National Tourism Indicators; Composite Leading
IndicatorIndicator Pilot surveys of BCS for Arts, Heritage, & Pilot surveys of BCS for Arts, Heritage, &
RecreationRecreation

BTS in CanadaBTS in Canada
Why a BTS on Traveller AccommodationWhy a BTS on Traveller Accommodation Surrogate for tourism sectorSurrogate for tourism sector Industry suffers from severe slowdowns and Industry suffers from severe slowdowns and
shocks; at the cusp of the business cycleshocks; at the cusp of the business cycle Client interest in:Client interest in:
• forward looking indicators/intelligenceforward looking indicators/intelligence• ImpedimentsImpediments• Evidence based decision making for policy and Evidence based decision making for policy and
marketingmarketing• Advocacy; e.g., media attentionAdvocacy; e.g., media attention• Policy makingPolicy making
Used by National Tourism Indicators; Composite Used by National Tourism Indicators; Composite Leading IndicatorLeading Indicator
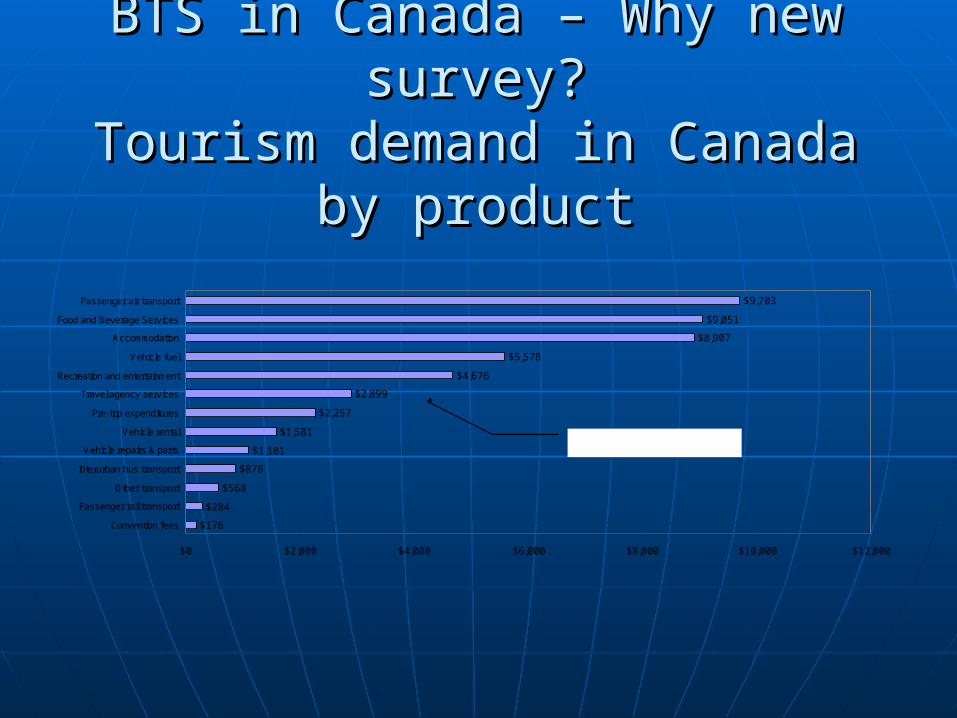
BTS in Canada – Why new survey?BTS in Canada – Why new survey?Tourism demand in Canada by Tourism demand in Canada by
productproduct
$176
$284
$568
$878
$1,101
$1,581
$2,257
$2,899
$4,676
$5,578
$8,907
$9,051
$9,703
$0 $2,000 $4,000 $6,000 $8,000 $10,000 $12,000
Convention fees
Passenger rail transport
Other transport
Interurban bus transport
Vehicle repairs & parts
Vehicle rental
Pre-trip expenditures
Travel agency services
Recreation and entertainment
Vehicle fuel
Accommodation
Food and Beverage Services
Passenger air transport
millions of current dollars

BTS in Canada-- Why new survey?BTS in Canada-- Why new survey?Change in Traveller Change in Traveller
Accommodation Revenues, Yr/YrAccommodation Revenues, Yr/Yr
-6,0%
-4,0%
-2,0%
0,0%
2,0%
4,0%
6,0%
8,0%
10,0%
1999 2000 2001 2002 2003 2004
Annual growth

BTS in CanadaBTS in CanadaWhy new survey?Why new survey?
1
Cyclicity
Structural change, demographics changing
-.05Travel Arrangements
Includes freight.15Scheduled Air
Includes leasing.32Auto. Rental / Lease
.36Heritage Institutions
.70Other Recreation
Includes freight.72Non-scheduled Air
.85Employment Services
.65Accommodation
.62Performing Arts
.55Amusement Parks
NotesPearson’s r
Leading, GDP time t+1
Source: internal calculations, Service Industries Division, STC

BTS in Canada– Results Traveller BTS in Canada– Results Traveller AccommodationAccommodation
Outlook for Occupancy RatesOutlook for Occupancy RatesBalance of Opinion (0=neutral)Balance of Opinion (0=neutral)
-50
-40
-30
-20
-10
0
10
20
2003Q4
2004Q1
2004Q2
2004Q3
2004Q4
2005Q1
2005Q2
2005Q3
2005Q4
2006Q1
2006Q2
2006Q3
2006Q4
2007Q1
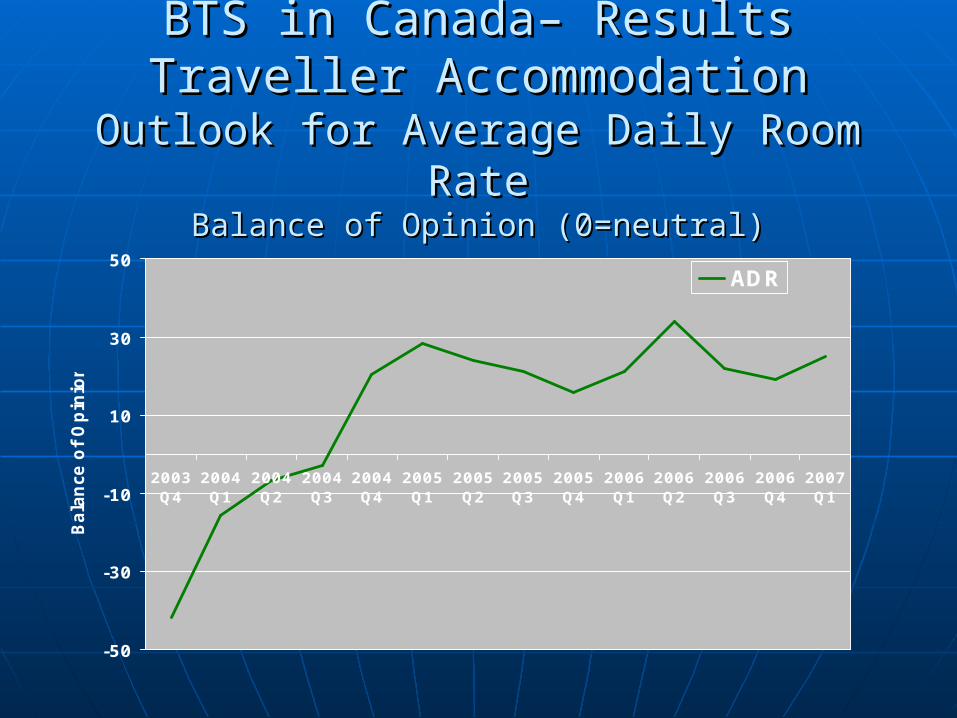
BTS in Canada– Results Traveller BTS in Canada– Results Traveller AccommodationAccommodation
Outlook for Average Daily Room RateOutlook for Average Daily Room RateBalance of Opinion (0=neutral)Balance of Opinion (0=neutral)
-50
-30
-10
10
30
50
2003Q4
2004Q1
2004Q2
2004Q3
2004Q4
2005Q1
2005Q2
2005Q3
2005Q4
2006Q1
2006Q2
2006Q3
2006Q4
2007Q1
Bala
nce
of O
pin
ion
ADR

BTS in Canada– Results Traveller BTS in Canada– Results Traveller AccommodationAccommodation
Business ImpedimentsBusiness ImpedimentsQ4 2006Q4 2006
0
5
10
15
20
25
30
%
Shortage ofunskilledlabour
Excess roomsupply
Shortage ofskilled labour
Lack ofattractions
Canada'sreputation
Generaleconomicconditions
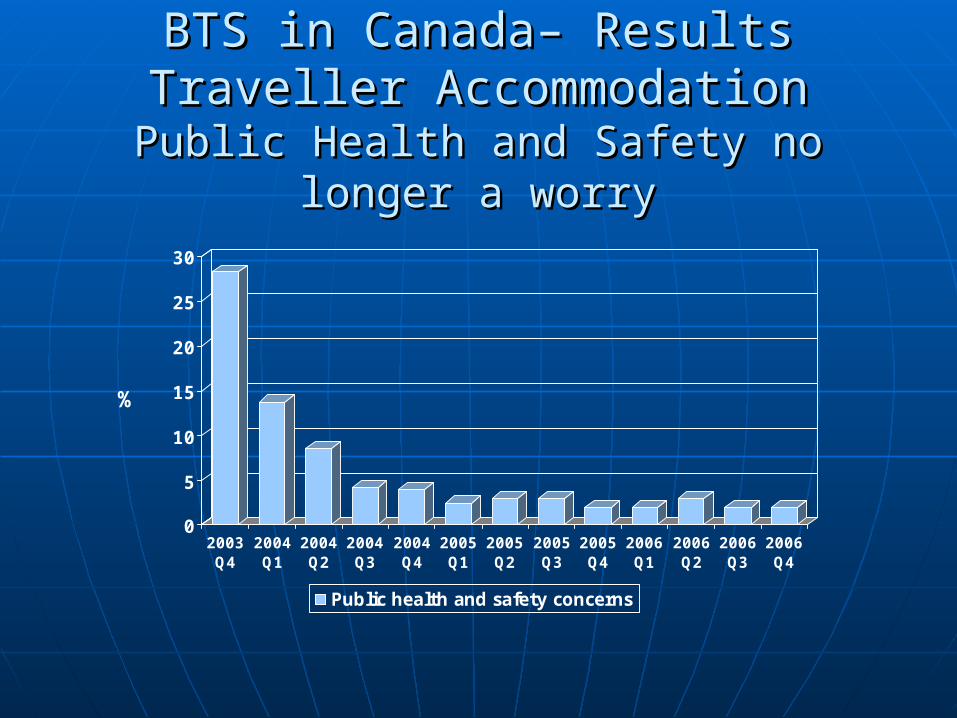
BTS in Canada– Results Traveller BTS in Canada– Results Traveller AccommodationAccommodation
Public Health and Safety no longer a worryPublic Health and Safety no longer a worry
0
5
10
15
20
25
30
%
2003Q4
2004Q1
2004Q2
2004Q3
2004Q4
2005Q1
2005Q2
2005Q3
2005Q4
2006Q1
2006Q2
2006Q3
2006Q4
Public health and safety concerns

BTS in Canada– Results Traveller BTS in Canada– Results Traveller AccommodationAccommodation
‘Canada’s reputation’ increasingly important‘Canada’s reputation’ increasingly important
0
5
10
15
20
25
30
%
2005 Q4 2006 Q1 2006 Q2 2006 Q3 2006 Q4
Canada's reputation as a tourist destination

BTS in FranceBTS in France
Institut national de la statistique et Institut national de la statistique et des etudes economiquesdes etudes economiques (Insee) (Insee)
Extensive array of surveysExtensive array of surveys Since 1952Since 1952

BTS in FranceBTS in FranceSome featuresSome features
1-3 pages1-3 pages 1000 to 5000 respondents1000 to 5000 respondents Results in overall balance of opinion Results in overall balance of opinion
significant to 2 to 3 pointssignificant to 2 to 3 points
BTS in France BTS in France Some features (cont’)Some features (cont’)
Sectoral surveysSectoral surveys Thematic surveysThematic surveys

BTS in FranceBTS in FrancePartial list of SurveysPartial list of Surveys
[LIST HERE][LIST HERE]

BTS in FranceBTS in FranceExamplesExamples
[show very detailed questions on [show very detailed questions on questionnaires]questionnaires]

BTS in FranceBTS in FranceExamples (cont’)Examples (cont’)
[show example of outputs][show example of outputs]

BTS in FranceBTS in FranceExamples (cont’)Examples (cont’)
[show example of European outputs][show example of European outputs]


Main Differences between Main Differences between Canadian and French BTS Canadian and French BTS
programsprograms
Different emphasis on production Different emphasis on production impediments impediments
Better coverage in FranceBetter coverage in France

ConclusionConclusion
Reasons why Canadian and French Reasons why Canadian and French BTS programs are differentBTS programs are different
• Different mandates, client demandDifferent mandates, client demand• Different pressures to harmonizeDifferent pressures to harmonize
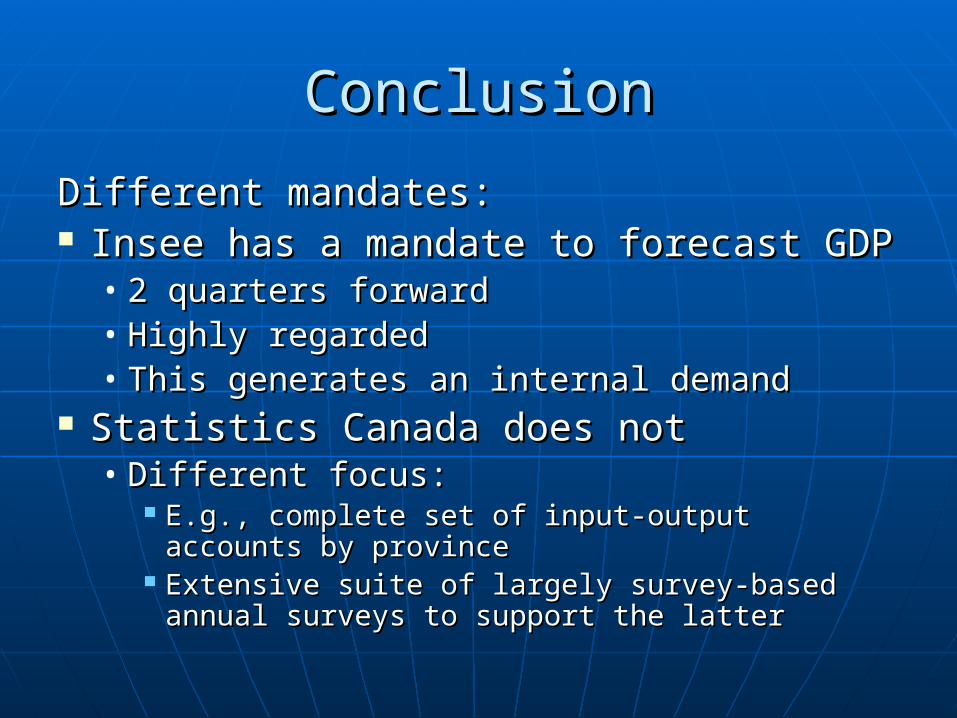
ConclusionConclusion
Different mandates:Different mandates: Insee has a mandate to forecast GDPInsee has a mandate to forecast GDP
• 2 quarters forward2 quarters forward• Highly regardedHighly regarded• This generates an internal demandThis generates an internal demand
Statistics Canada does notStatistics Canada does not• Different focus: Different focus:
E.g., complete set of input-output accounts by E.g., complete set of input-output accounts by provinceprovince
Extensive suite of largely survey-based annual Extensive suite of largely survey-based annual surveys to support the lattersurveys to support the latter
ConclusionConclusion
Different mandates, different prioritiesDifferent mandates, different priorities Canada: surveys that produce best possible Canada: surveys that produce best possible
quantitative current quantitative current indicators for GDPindicators for GDP Survey-basedSurvey-based Less financial pressure to use administrative data Less financial pressure to use administrative data
sourcessources No influential internal client for qualitative BTSNo influential internal client for qualitative BTS However, an external client for its traveler However, an external client for its traveler
accommodation surveyaccommodation survey
ConclusionConclusion
Different mandates, different priorities Different mandates, different priorities (cont’)(cont’)
France: surveys that produce best possible France: surveys that produce best possible qualitative leading qualitative leading indicators for GDP indicators for GDP forecastsforecasts
Influential internal client Influential internal client All survey-basedAll survey-based Mandatory Mandatory Current indicators are comparatively less important, Current indicators are comparatively less important,
greater financial pressures to use administrative data greater financial pressures to use administrative data sourcessources
ConclusionConclusion
Different international pressures to Different international pressures to harmonizeharmonize
Why are such differences “tolerated”?Why are such differences “tolerated”?• No pressures to harmonize in the sense the different No pressures to harmonize in the sense the different
iterations of the SNA 93 have exercised strong iterations of the SNA 93 have exercised strong harmonizing influence since the 1950’sharmonizing influence since the 1950’s
• Perception that BTS are “less important”, especially by Perception that BTS are “less important”, especially by agencies that do not publish forecasts agencies that do not publish forecasts
CIRET’s recommendations are not nearly as CIRET’s recommendations are not nearly as bindingbinding
There are strong pressures from within the EUThere are strong pressures from within the EU• But Canada is not a member!But Canada is not a member!

ConclusionConclusion
The FutureThe Future : what would need to : what would need to change? change?
A change in mandateA change in mandate International will and desire to International will and desire to
“compel” countries to adhere to an “compel” countries to adhere to an international standard (in the manner international standard (in the manner of the SNA)of the SNA)
Client financial commitmentClient financial commitment