Embed Size (px)
Citation preview
Journal Pre-proof
An opinion on the multi-scale nature of Covid-19 type disease spread
Swetaprovo Chaudhuri, Abhishek Saha, Saptarshi Basu
PII: S1359-0294(21)00046-7
DOI: https://doi.org/10.1016/j.cocis.2021.101462
Reference: COCIS 101462
To appear in: Current Opinion in Colloid & Interface Science
Received Date: 9 March 2021
Revised Date: 15 April 2021
Accepted Date: 23 April 2021
Please cite this article as: Chaudhuri S, Saha A, Basu S, An opinion on the multi-scale nature ofCovid-19 type disease spread, Current Opinion in Colloid & Interface Science, https://doi.org/10.1016/j.cocis.2021.101462.
This is a PDF file of an article that has undergone enhancements after acceptance, such as the additionof a cover page and metadata, and formatting for readability, but it is not yet the definitive version ofrecord. This version will undergo additional copyediting, typesetting and review before it is publishedin its final form, but we are providing this version to give early visibility of the article. Please note that,during the production process, errors may be discovered which could affect the content, and all legaldisclaimers that apply to the journal pertain.
© 2021 Elsevier Ltd. All rights reserved.

An opinion on the multi-scale nature of Covid-19 type disease spread
Swetaprovo Chaudhuria,∗, Abhishek Sahab, Saptarshi Basuc,∗
aInstitute for Aerospace Studies, University of Toronto, Toronto, ON M3H 5T6, CanadabDepartment of Mechanical and Aerospace Engineering, University of California San Diego, La Jolla, CA 92093, USA
cDepartment of Mechanical Engineering, Indian Institute of Science, Bengaluru, KA 560012, India
Abstract
Recognizing the multi-scale, inter-disciplinary nature of the Covid-19 transmission dynamics, we discuss some recentdevelopments concerning an attempt to construct a disease spread model from the flow physics of infectious dropletsand aerosols, and the frequency of contact between susceptible individuals with infectious aerosol cloud. Such anapproach begins with the exhalation event specific, respiratory droplet size distribution (both airborne/aerosolized andballistic droplets), followed by tracking its evolution in the exhaled air to estimate the probability of infection and therate constants of the disease spread model. The basic formulations and structure of sub-models, experiments involvedto validate those sub-models are discussed. Finally, in the context of preventive measures, respiratory droplet-facemask interactions are described.
Keywords: Respiratory droplets, aerosols, Covid-19, disease spread model, facemasks
1. Introduction1
At the time of writing this paper, the cumulative num-2
ber of Covid-19 positive cases in the world is close3
to 135 million, with nearly 3 million deaths. How-4
ever, it has been recognized that the actual number of5
cases could be far higher than the reported number. Li6
et al. [1] estimated that in China “86% of all infec-7
tions were undocumented [95% credible interval (CI):8
82–90%] before the 23 January 2020 travel restrictions.”9
A major impediment in the direct estimation of the total10
number of actual positive cases in the Covid-19 pan-11
demic has been the vast number of asymptomatic cases12
[2–5]. Subramanian et al. [5] noted, “Using a model13
that incorporates daily testing information fit to the14
case and serology data from New York City, we show15
that the proportion of symptomatic cases is low, rang-16
ing from 13 to 18%, and that the reproductive number17
may be larger than often assumed.” However, in many18
cases, for predictions, epidemiological models utilize19
the reported/available data to obtain the model (Ordi-20
nary Differential Equations) parameters towards estima-21
tion of the basic reproduction number. The role and22
power of present epidemiological models in determin-23
ing policy and implementation of non-pharmaceutical24
∗Corresponding authors: S. Basu ([email protected]) and S.Chaudhuri ([email protected])
interventions like social distancing, lockdown cannot25
be overemphasized [6–8]. At the same time, the lack26
of availability of actual infection numbers, possible de-27
pendency and sensitivity of the model parameters on28
seasonality [9–11] and mechanism of disease transfer,29
behooves a physics based approach where the model30
parameters are derived from first principle calculations.31
Indeed, such an approach, if possible, is not without32
limitations and uncertainties, and must be reconciled33
with data for practical implementations. More impor-34
tantly, such an approach calls for a detailed mechanis-35
tic understanding of each of the several sub-components36
that spans across scientific disciplines and integration37
of ostensibly decoupled fields like virus kinetics inside38
aerosols, droplet evaporation, turbulent diffusion, hu-39
man mobility, human behavior, their modeling and the40
uncertainties thereof. These sub-components are not41
uniformly at the same level of understanding. Yet, given42
the extremely high stakes - the catastrophe that a res-43
piratory disease pandemic like Covid-19 inflicts (and44
probably will inflict in future) upon billions of human45
beings, such a scientific endeavour is probably required46
more than ever before. It is to be recognized that this47
opinion article is not a comprehensive review of the48
Covid-19 disease spread; it is inherently biased towards49
a physical science based viewpoint of the disease trans-50
mission problem with a focus on the recent experiences51
Preprint submitted to Current Opinion in Colloid and Interface Science April 27, 2021
and works of the authors. We hope the readers will par-52
don such a bias in view of the interdisciplinary connec-53
tions that the approach attempts to achieve: connecting54
an epidemiological model with the science of colloidal55
suspension of virus particles in respiratory liquids along56
with the spatio-temporal interfacial processes of respira-57
tory droplet evaporation and their conversion to droplet58
nuclei. For a comprehensive review of the state of the59
art, the readers can refer to the review article by Pohlker60
et al. [12].61
2. Physics based disease spread model62
Ironically, the first mathematical model for infectious63
disease spread was formulated by mathematician/fluid64
dynamicist Daniel Bernoulli in 1760 [13, 14] leading to65
the Kermack–McKendrick model in 1927 [15]. Since66
then epidemiological models have evolved in great so-67
phistication and complexity [16]. Mean-field compart-68
mental models can lack the heterogeneity information69
in terms of population mobility and density - this has70
led to development of network models [17] and agent71
based models [18] which attempts to model human mo-72
bility using different techniques - complex networks and73
mobile agents, respectively. In parallel to the popula-74
tion dynamics viewpoint, epidemiological model like75
the SEIR model could be viewed as a chemical reaction76
mechanism. Here, the reaction is the infection transmit-77
ting from infected I individuals to susceptible individu-78
als S who are converted to exposed E. Subsequently, E79
can become recovered R or deceasedD.80
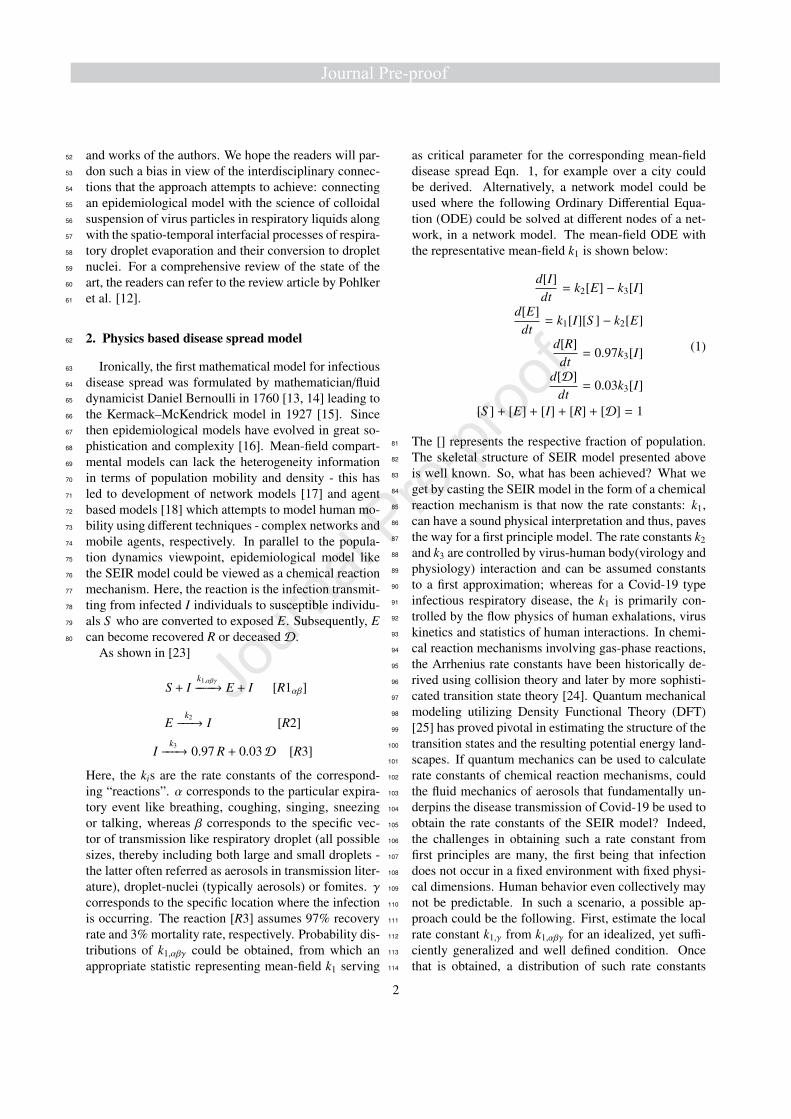
As shown in [23]
S + Ik1,αβγ−−−−→ E + I [R1αβ]
Ek2−−−→ I [R2]
Ik3−−−→ 0.97 R + 0.03D [R3]
Here, the kis are the rate constants of the correspond-ing “reactions”. α corresponds to the particular expira-tory event like breathing, coughing, singing, sneezingor talking, whereas β corresponds to the specific vec-tor of transmission like respiratory droplet (all possiblesizes, thereby including both large and small droplets -the latter often referred as aerosols in transmission liter-ature), droplet-nuclei (typically aerosols) or fomites. γcorresponds to the specific location where the infectionis occurring. The reaction [R3] assumes 97% recoveryrate and 3% mortality rate, respectively. Probability dis-tributions of k1,αβγ could be obtained, from which anappropriate statistic representing mean-field k1 serving
as critical parameter for the corresponding mean-fielddisease spread Eqn. 1, for example over a city couldbe derived. Alternatively, a network model could beused where the following Ordinary Differential Equa-tion (ODE) could be solved at different nodes of a net-work, in a network model. The mean-field ODE withthe representative mean-field k1 is shown below:
d[I]dt
= k2[E] − k3[I]
d[E]dt
= k1[I][S ] − k2[E]
d[R]dt
= 0.97k3[I]
d[D]dt
= 0.03k3[I]
[S ] + [E] + [I] + [R] + [D] = 1
(1)
The [] represents the respective fraction of population.81
The skeletal structure of SEIR model presented above82
is well known. So, what has been achieved? What we83
get by casting the SEIR model in the form of a chemical84
reaction mechanism is that now the rate constants: k1,85
can have a sound physical interpretation and thus, paves86
the way for a first principle model. The rate constants k287
and k3 are controlled by virus-human body(virology and88
physiology) interaction and can be assumed constants89
to a first approximation; whereas for a Covid-19 type90
infectious respiratory disease, the k1 is primarily con-91
trolled by the flow physics of human exhalations, virus92
kinetics and statistics of human interactions. In chemi-93
cal reaction mechanisms involving gas-phase reactions,94
the Arrhenius rate constants have been historically de-95
rived using collision theory and later by more sophisti-96
cated transition state theory [24]. Quantum mechanical97
modeling utilizing Density Functional Theory (DFT)98
[25] has proved pivotal in estimating the structure of the99
transition states and the resulting potential energy land-100
scapes. If quantum mechanics can be used to calculate101
rate constants of chemical reaction mechanisms, could102
the fluid mechanics of aerosols that fundamentally un-103
derpins the disease transmission of Covid-19 be used to104
obtain the rate constants of the SEIR model? Indeed,105
the challenges in obtaining such a rate constant from106
first principles are many, the first being that infection107
does not occur in a fixed environment with fixed physi-108
cal dimensions. Human behavior even collectively may109
not be predictable. In such a scenario, a possible ap-110
proach could be the following. First, estimate the local111
rate constant k1,γ from k1,αβγ for an idealized, yet suffi-112
ciently generalized and well defined condition. Once113
that is obtained, a distribution of such rate constants114
2

120nm 0.5µm – 1mm 2m 20m 16,600 km
SARS-CoV-2
Respiratory droplet
Respiratory sprays: airborne and ballistic droplets
Infectious aerosol dispersion in crowds, people inhale aerosols: Covid-19 is airborne
World-wide spread10s:
Settling time for 100 µm droplet
2 min – 30 hr:Half-life of SARS-CoV-2 virus in aerosols
300 hr+:Settling time for
1µmdroplet
3 months
120 hr: incubation period
Figure 1: Multi-length scale, multi-time scale, multidisciplinary nature of the Covid-19 disease spread. Sub-images adapted from [19–22]
could be obtained for the different situations involved.115
The mean and/or other relevant statistics could be ob-116
tained from the corresponding moments of the resulting117
probability density functions to yield the mean-field k1.118
Covid-19 has been recognized as an airborne disease[26, 27], though the ballistic droplet and fomite routecould provide non-negligible transmissions. There areseveral studies which analyzed large scale transmis-sion events, that would could not have occurred unlessthe virus was airborne. In particular the Skagit Val-ley Chorale superspreading event [28], outbreak in aGuangzhou restaurant [29] and the Diamond PrincessCruiseship [30] are some prominent examples wherethe infected cases were at a sufficient distance from theindex case to be explained by the ballistic droplet orfomite route of transmission. As such, Lednicky et al.[31] could isolate SARS-CoV-2 virus from aerosols col-lected 2 to 4.8 m from Covid-19 positive patients. Oneof the most influential theoretical contributions in esti-mating the probability of indoor infection by airbornedisease is by Riley et al. [32] and is given by the Wells-Riley equation.
P = 1 − e(−I pqt/Q) (2)
Here P is the probability of infection, I is the numberof infected individuals, p being the rate of breathing perperson, q being the quantum (of infection) generationrate by I, t is the exposure time and Q is the volume flow
rate of incoming air. Rudnick and Milton [33] extendedthis further to define
P = 1 − e−µt (3)
Here µ = f Iq/n and f is the average fraction of in-door air that is exhaled as breadth, n being the numberof people present in the space. From this they derivedthe “reproductive number for an infectious disease in abuilding environment” as
R0A = (n − 1)e( f Iqt/n) (4)
This can be readily converted into k1 of Eqn. 1. As119
such this formulation has been extensively used as in120
[34] to estimate the number of new infections and is121
an incredibly powerful tool to estimate infection risks.122
However, inherent in the simplicity, such a formula-123
tion have the following limitations embedded through124
its assumptions. (i) Spatially homogeneous aerosol con-125
centration. While this assumption eliminates the need126
for flow physics considerations, it is a rather restric-127
tive assumption since aerosols are exhaled from specific128
sources (of very small dimensions compared to room129
size) and mostly disperse by progressively weakening130
turbulent diffusion. For continuously periodic activity131
like breathing, even in steady state, it is unlikely that132
the aerosol concentration will be homogeneous in an in-133
door space at any time. Infectious aerosols will be much134
more concentrated close to the infected individual than135
3

in a remote corner of a room. If it were, any necessity of136
social distancing would be meaningless. As such Chen137
et al. [35] emphasized the importance of short range air-138
borne route dominated by small droplets in close contact139
(< 2m) disease transmission (ii) Absence of considera-140
tion of size distribution of aerosols. This also has an im-141
portant bearing since larger sized droplets continuously142
settle, smaller ones remain airborne for longer times,143
the initial size distribution and the local thermal-fluid144
conditions determine the fraction of the originally ex-145
haled aerosol population that will remain airborne after146
a particular time from the exhalation event. (iii) Ab-147
sence of droplet physics and virus kinetics. The SARS-148
CoV-2 virus has half-life that can range from minutes149
to hours, in aerosols, depending on the local thermo-150
dynamic conditions and level of UV irradiation. The151
virus half-life could well be dependent on the chemical152
and/or thermodynamic state of the respiratory droplet153
or the droplet nuclei. (ii) and (iii) could be however ad-154
dressed in modified forms of the Wells-Riley model as155
has been recently done by [36]. An alternative analy-156
sis approach could be to estimate the basic reproduc-157
tion number directly from the flow physics of exhala-158
tions starting from the exhaled respiratory droplet size159
distribution, drawing inspiration from the rate constants160
of chemical reactions. Indeed such an approach is more161
complex, often involves idealizing assumptions and in-162
volves sub-disciplines ranging from turbulent disper-163
sion to virus kinetics in evaporation respiratory droplets.164
More importantly, instead of assuming a dominant path-165
way (aerosols), could an analysis be performed, such166
that the dominant pathway emerges from the analysis167
itself?168
2.1. Analyzing airborne pathways169
Involving several idealizing assumptions and simpli-170
fications, the rate constants required for solving Eq. 1171
and a basic reproduction number estimate starting from172
Duguid’s [37] cough droplet size distribution were ob-173
tained Chaudhuri et al. [23]. Distributions of differ-174
ent parameters were not considered in this work though175
the sensitivity of viral load on the rate constants were176
shown. Here, only the basic ideas are described. Draw-177
ing inspiration from molecular collision theory, the rate178
constants k1,αβ for each exhalation event α (breath,179
cough, sing, sneeze or talk) and transmission vector β180
(droplet, droplet nuclei or fomite as shown in Table 1)181
appearing in Eqns. [R1αβ] could be derived as a func-182
tion of the collision volume, probability of infection and183
concentration of I and S individuals. The following184
paragraph shows how.185
k1,αβ droplet nucleus fomitebreath k1,bd k1,bn k1,b f
cough k1,cd k1,cn k1,c f
sing k1,gd k1,gn k1,g f
sneeze k1,sd k1,sn k1,s f
talk k1,td k1,tn k1,t f
Table 1: Infection rate constants for different expiratory events andmodes of transmission. Adapted from Chaudhuri et al. [23]
Let’s assume that in a unit volume, the number ofinfected and susceptible individuals are nI and nS , re-spectively. Therefore, the number of collisions thatwould occur between the exhaled, infectious gas cloudD (ejected by I) and the susceptible individuals S isVcnInS . Vc is the collision volume, the volume swept bya cylinder of diameter σDS = (σD + σS )/2 in unit time.Here, σS is the diameter of the hemispherical, inhala-tion volumeVb = (1/12)πσ3
S , whereas σD is the diam-eter of the aerosol cloud which grows in time. When theaerosol cloud volume is less than the total volume underconsideration and when the relative velocity between Dand S are non-zero and given by VDS , the frequency ofcollision Z is given by πσ2
DS VDS nInS . However, all col-lisions will not result in infection since the probabilityof infection Pαβ (for expiratory event α and transmis-sion vector β) upon collision between S and D variesbetween 0 and 1. Including that Chaudhuri et al. [23]defined the generalized rate constant by Eqn. 5
k1,αβγ =πntotal,γ
tc
∫ τ
0σ2
DS (t)VDS (t)Pαβ(t)dt (5)
where ntotal,γ is the number density (number/volume) of186
the inhalation volumes at a location γ. Given the varia-187
tion in the height of the susceptible individuals, we as-188
sume the inhalation hemispheres (of volume Vb) are189
uniformly distributed within a given vertical distance190
H . If so, the population density ndensity,γ (number of191
people/area) could be converted to ntotal,γ = ndensity,γ/H .192
This also explains why a collision volume and not col-193
lision area has been considered. tc is the average time194
period between two expiratory events.195
Indeed the rate constant k1,αβγ is location, expiratory196
event specific while the ones required for solving Eqn.197
1 arises from a mean-field approximation. This can be198
addressed by i) considering actual distributions of ntotal,γ199
and other relevant parameters (like viral load) in Eqn. 5200
or ii) by constructing a network model where k1,αβγ is201
calculated at individual locations, after summing it over202
α, β.203
4

Rate constants
and local R0
from collision theory
SEIRD model
Jet/puff aerodynamics
Respiratory droplet/aerosol
model
Virus lifetime, viral
load & dose response
Probability of infection
1 10 100 1000
Ds,0(µm)
Cough droplet size pdf
Figure 2: The overall model structure as an assembly of several interacting sub-models.
In Eqn. 5, probability of infection Pαβ upon cross-ing the droplet cloud D is a key term. Its practical im-portance also cannot be overstated. Most works uti-lized the “quanta” of infectious emissions to estimatethe probability of infection. Approximating Duguid’scough droplet size distribution with a lognormal dis-tribution fα(D) = 1
√2πσD
exp[−(ln(D) − µ)2/2σ2] , thenumber of virions within droplet sizes D1 and D2 isgiven by Nvα =
πρvNtα6
∫ D2
D1D3 fα(D)dD. Incorporat-
ing the virus kinetics for the transmission vector β byψβ(t) = (1/2)
t/tβ 1
2 , Chaudhuri et al. [23] calculated thenumber of virions that would be inhaled from dropletsupon crossing the aerosol cloud D by
Nαd(t) =πρvNtαNbσ
3S (σS + σD(t))ψd(t)
12VDS (t)σ3D(t)
∫ D2(t)
D1(t)D3 fα(D)dD
(6)and the number of virions that would be inhaled fromthe dried droplet nuclei by
Nαn(t) =πρvNtαNbσ
3S (σS + σD(t))ψn(t)
12VDS (t)σ3D(t)
∫ Dn(t)
0D3 fα(D)dD
(7)ρv is the viral load, Ntα is the number of respiratorydroplets ejected. ψβ(t) is the fraction of infectious viri-ons available at time t in the vector β; tβ 1
2being the
corresponding half life of the virus. The limits of theintegrals in Eqns. 6, 7 are the initial droplet diametersthat evaporate and settle at time t, respectively and canbe estimated from a modified Wells’ plot where dropletevaporation and settling times are calculated account-ing from the accompanying warm and moist air jet thatis exhaled. The settling time is obtained from Stokesterminal velocity accounting for droplet size reductiondue to evaporation. The droplet size reduction due to
evaporation and the heat transfer to/from ambient canbe modeled using an energy balance equation. Here,the droplet was assumed to be homogeneous. It hasbeen shown that the effect of solute (nonvolatile compo-nents: mostly salts in respiratory fluids) concentrationin the respiratory droplets are critical in predicting theaccurate droplet lifetime [38]. This was incorporated inthe model by tracking the overall solute concentration inthe droplet. Its effect on evaporation rate was includedby evaluating the suppression of vapor pressure of theevaporating species (water, here) as prescribed by theRaoults law. The translation of the droplet in gas phasewas modeled using 1D drag equation. These approachleads to a set of linear differential equations, which canbe simultaneously solved to estimate the temporal evo-lution of location, size and temperature of the respira-tory droplet. Such approach readily incorporates effectsof ambient condition (temperature, humidity) and ini-tial droplet size on the evaporation rate and final size ofthe nuclei. A detailed version of this model has beendescribed by Chaudhuri et al. [23, 39]. From these thetotal probability of infection for the expiratory event αcould be defined utilizing the dose response model:
Pα(t) = 1 − e−rv∑βNαβ(t) (8)
The above dose response model is inspired by the semi-204
nal work of Haas [40]. The most important highlight of205
the combined system of equations 6-8 is that, here prob-206
ability of infection is directly from the exhaled respira-207
tory droplet size distribution without invoking “quanta”,208
as in previous studies. Of course the individual proba-209
bility of infection by the droplet route d and the dried-210
droplet nuclei route n could be calculated. For a non-211
ventilated large indoor space at typical air-conditioned212
state, the results for a single cough are shown in Fig. 3.213
5

100 101 102 10310-4
10-2
100
(a)
100 10110-4
10-2
100
(b)
Figure 3: Probability of infection Pcβ for droplet route d and drieddroplet nuclei route n, as well as total probability Pβ for (a) as a func-tion time from the instant of the beginning of a single cough (b) asa function of distance from location of the single cough along thecenter of the jet/puff trajectory. Note both d and n routes are es-sentially inhalation routes since large droplets settle in a very shorttime and are unlikely to contribute much in the disease transmission.T∞ = 21.44 oC, RH∞ = 50 %. The bold lines represent ρv = 7 × 10⁶
copies/ml with td 12
= tn 12
= t 12
, where t 12
= 15.25 minutes. The greyshaded region denotes the lower limit tn 1
2= 0.01td 1
2and upper limit
tn 12
= 100td 12
, respectively, with td 12
= t 12
.Adapted from Chaudhuriet al. [23]
Such an analysis can answer three fundamental ques-214
tions, quantitatively with corresponding uncertainty:215
1. Why and how does the probability of infection re-216
duce with time and distance from the source? The217
reason why Pαβ reduces with time and distance218
are due to i) dilution of the aerosol cloud D by219
continuous entrainment of ambient air as captured220
by increasing σD(t) with time ii) droplet settling221
and evaporation if considering droplet route - re-222
ducing range within D1 and D2. But then droplet223
evaporates to produce droplet nuclei which can re-224
main infectious iii) finite lifetime of the virus in225
droplets/droplet nuclei. This is accounted in tβ 12
226
which is a function of temperature, relative humid-227
ity and UV index [41, 42]. Though ventilation is228
not considered, a practical method to reduce infec-229
tion probability is by increasing ventilation which230
would dilute the aerosol cloud even further along-231
side direct removal of the infectious aerosol parti-232
cles.233
2. Which is the most dominant route of transmission?234
Ostensibly from Fig. 3, the airborne droplet route235
has higher yet decaying probability. However,236
what is embedded in the log-log plot is that though237
the droplet nuclei has a much lower probability238
to infect, in absence of ventilation, it has much239
longer persistence. The time scales of its persis-240
tence is long enough and can match well with the241
lifetime of the virus in the aerosols. Summarizing,242
the d-route offers high infection probability over243
shorter time and distance whereas, n-route causes244
lower probability of infection but over longer time245
and distance. These two factors make the airborne246
dried droplet nulcei a very potent agent (possi-247
ble more than the airborne droplets) of transmis-248
sion. The role of droplet nuclei in infectious respi-249
ratory disease transmission was first identified by250
Wells. As shown in [23] the contribution of the251
dried droplet nuclei to the infection rate constant252
and corresponding basic reproduction number is253
much larger than the corresponding droplets. Of254
course this is under the assumption that the virus255
lifetime is same in both the droplet or the dried256
droplet nuclei. This uncertainty is also addressed257
in Fig. 3.258
3. What makes Covid-19 an airborne disease? Of259
course there is a very important biological aspect260
to this question which is beyond the scope of the261
article. In the framework of the analysis presented262
here, the factors that render the disease airborne263
are the following: i) high viral load ρv, this al-264
lows significant number of virions to be present265
within very small droplets/droplet nuclei that can266
float in air for a significant time and can be directly267
inhaled deep into the lungs. The effect of the dif-268
ferent viral loads on the corresponding basic repro-269
duction number R0,c was also shown [23]. ii) rela-270
tively small minimum infectious dose captured by271
rv. For Covid-19 the infectious dose is believed to272
be around 100−1000 copies though an exact num-273
6

ber remains eluding at this time. Based on the dose274
response analysis by Haas [43] in terms of plaque275
forming units, Schijven et al. [44] suggested 1440276
RdRP (RNA-dependent RNA polymerase) copies277
of SARS-CoV are required for infection iii) tβ 12
278
substantially large and of similar order as tsettle for279
small droplets and aerosols. Long half-life of the280
virus inside aerosol particles under most common281
indoor conditions allow the virus to be airborne.282
This is one of the most, if not the most, important283
parameter that qualifies the SARS-CoV-2 virus to284
be transmitted by the airborne route.285
3. Colloid and interfacial science of disease spread286
The previous discussion, has made it amply clear that287
long-term fate of the pathogen in respiratory fluid is crit-288
ical in understanding how long the virus remains po-289
tent airborne and thus how fast the disease spreads. For290
Covid-19 type pandemics, naturally, we ask what hap-291
pens to the pathogen during its transportation through292
respiratory droplets. While a detailed answer involves293
chemical, biological and virological aspects of the294
pathogen, many critical insights can be obtained from295
the interfacial dynamics between the pathogens and car-296
rier droplets. In fact, for a mechanistic understanding of297
the migration of these pathogens, one can assume them298
to be particles with fixed dimensions [45, 46]. The di-299
mension of most pathogens varies between hundreds of300
nm to few µm and their Stokes numbers in water-based301
solutions are small. Thus, their motion is primarily dic-302
tated by the flow patterns in the carrier droplet, the in-303
terfacial interactions, and their own motility, if any.304
As identified before, the respiratory droplets and305
droplet nuclei (including both large droplets and306
aerosols) can adopt three modes of infection transmis-307
sion: airborne, direct impact and fomite. The hydro-308
dynamics, evaporation, and flow structure inside a ses-309
sile droplet (fomite) are very different from an airborne310
moving droplet due to the solid substrate present in the311
former. Such dichotomy in hydrodynamics also creates312
a disparity in the migration of pathogens and their posi-313
tion in desiccated nuclei for these two modes. For ses-314
sile droplets, Deegan et al. [47, 48] explained that the315
very well-known coffee-ring structure formed by par-316
ticles in evaporating sessile droplets, arises from the317
strong evaporation at the pinned contact line, which318
is supported by strong radially outward flow in the319
droplet close to the substrate. However, such evapo-320
rating droplet also houses a couple of other effects in-321
cluding Marangoni and capillary flows, that can inhibit322
the formation of coffee-ring [49, 50]. An evaporating323
sessile droplet with unpinned contact line, on the other324
hand, can produce in general a more homogeneous dis-325
tribution of particles on the substrate [51]. In a recent326
effort, Zhao and Yong [52] used a Lattice Boltzmann327
Method with Brownian dynamics to access the effects of328
nanoparticles at the liquid-vapor interface of an evapo-329
rating sessile droplet. While the number density of par-330
ticles at the interface was found to influence the evap-331
oration rate, the wettability played a strong role in ac-332
cumulating the particles on the substrates. For weakly333
wettable surfaces, the particles were observed to be ag-334
gregated near the apex of the droplet, while for highly335
wettable substrates they were accumulated near the con-336
tact line. A more homogeneous distribution was ob-337
tained for neutral-wetting substrate.338
While the underlined basic mechanism in particle339
deposition in water-based solutions explained in these340
studies can be extended to pathogens, the dynamics341
in respiratory droplets are more involved due to the342
physico-chemical complexities and the resulting varia-343
tion in thermo-physical properties. Vejerano and Marr344
[53] showed that the surrogate respiratory (sessile)345
droplets containing dissolved salts undergo an efflores-346
cence process depending on the ambient relative hu-347
midity, which affects the crystallization process. Us-348
ing fluorescently tagged lipid, they could also isolate the349
virus locations in the drying fomites at various ambient350
conditions. The salt (NaCl) in the respiratory droplets351
crystallize on the substrate while the other components352
(Mucin, DPPC) can form a shell-like structure, encap-353
sulating the virus particles. Fig. 4a shows the possi-354
ble distribution of virus in a drying surrogate respira-355
tory droplet with φ6 virus exposed in an ambient of356
RH=29%. In particular, they highlighted that some357
preferential chemical affinity in available active organic358
and inorganic groups in the solution of water, DPPC and359
NaCl, might expedite the process of shell/layer forma-360
tion. Nevertheless as the evaporation continues, even-361
tually the nucleus of NaCl forms leading to crystal-362
lization. In a more recent effort, Rasheed et al. [54]363
highlighted the effects of substrate characteristics on364
fomites’ crystallization dynamics. They showed that365
dendritic or cruciform-shaped crystals were formed ma-366
jorly for most substrates, but regular cubical crystals367
were observed for machined steel substrates.368
The dynamics of pathogens in an airborne droplet are369
challenging to study experimentally, due to the involved370
complexity in isolating a single droplet in a controlled371
environment. An acoustic levitator, which can suspend372
a droplet by trapping it around a pressure anti-node in373
a standing wave, paved the way for studying isolated374
droplets in container-less environments [56–61]. More375
7

VLPs
(a)
(b) (c)
Figure 4: Drying of surrogate respiratory droplets. (a) Composite flu-orescent image of surrogate respiratory sessile droplet containing φ6virus exposed to 29% relative humidity. The bright green dots approx-imately 1µm in size may indicate the location of the virus. (adaptedfrom [53]). (b and c) Fluorescent VLPs inside crystal formed in dry-ing of surrogate levitated droplet with a (b) two component surro-gate respiratory fluid Compositions: 1% (w/w) aqueous NaCl solu-tion (adapted from [55]) and (c) four component surrogate respiratoryliquid: water, NaCl, DCCP and Mucin.
recently, Basu et al. [55] used such a setup in study-376
ing the surrogate respiratory droplet containing virus-377
like particles. They used 1% (w/w) NaCl aqueous so-378
lution as surrogate respiratory fluid and 100nm fluo-379
rescent particles as a surrogate virus, whose concen-380
tration was modulated from 0.005 to 0.1%. Although381
the chemical and biological signatures cannot be repli-382
cated, these VLPs can mimic the hydrodynamics of the383
SARS-CoV2 virus. The study confirmed that, irrespec-384
tive of the initial droplet diameter, the concentration of385
VLPs, the respiratory droplets evaporate and desiccate386
to form nuclei which are 20-30% of the initial droplet387
diameter in size. Importantly, they identified that at388
50% RH, the desiccated nucleus consists of a single389
NaCl crystal containing the VLPs. The detailed con-390
focal scanning of the crystals located a large portion of391
VLPs is in the crystal’s inner core, while the rest of them392
were distributed in the outer edges and on the surfaces393
on the crystal. The VLPs and NaCl’s relative diffu-394
sivities were compared with the droplet regression rate395
to demonstrate that, while homogeneity in fast-moving396
NaCl concentration was expected in the levitated respi-397
ratory droplet, VLPs were expected to be preferentially398
accumulated. Furthermore, the vortical motion created399
inside either levitated [61–63] or airborne droplets [64],400
induces the preferential distribution of VLPs mentioned401
above. Figures 4b and c show the final precipitates and402
VLP distribution in levitated respiratory droplets at RH403
=50% using two different surrogate droplet recipes. The404
study was then extended to actual human saliva, col-405
lected from various uninfected healthy subjects. While406
the variation of saliva content, arising from the subjects’407
eating, drinking, and physiological habits, resulted in a408
large scatter in the data, the average behavior closely409
followed the trend predicted with surrogate respiratory410
liquid. A similar study for a broader range of ambient411
conditions was reported recently by Lieber et al. [38],412
who also observed similar evaporation dynamics.413
Direct assessment of SARS-CoV-2 virus kinetics (in-414
fectivity) in aerosols and in sessile droplets has been re-415
ported by [41, 65] and in [8], respectively. All stud-416
ies found that SARS-CoV-2 virus stability monotoni-417
cally decreases with increase in temperature. Morris418
et al. [66] reported a U-shaped virus half-life behav-419
ior with ambient relative humidity. They attributed such420
response to the solute concentration in the respiratory421
droplets. Apparently, consistent with previous findings422
by Marr et al. [67], the enveloped viruses like SARS-423
CoV-2 survives well in droplets far from their dried424
state, as well as in the desiccated residue where the virus425
remains in a frozen state. In intermediate relative hu-426
midity levels (40-60%), in partially dried equilibrated427
droplets with highest solute concentration, the virus sur-428
vives for the least time, all other conditions being held429
equal. Indeed, virus survivability within desiccated nu-430
clei enables the virus to be airborne.431
4. Disease prevention: face masks432
Analysis presented in Section 2.1 can be used to un-433
derstand the effect of blocking droplets of different sizes434
on the probability of infection. Starting with Duguid’s435
cough droplet size distribution it has been shown that436
preventing ejection of all droplets above initial size of437
10µm can substantially reduce the probability of infec-438
tion [23]. Furthermore, it was also shown that pre-439
venting ejection of droplets above 5µm could result in440
a two order of magnitude reduction in the R0,c to a441
8

R0,c < 1 even for a very high viral load of ρV = 2.35 ×442
109copies/ml. Large R0,c are characteristics of super-443
spreader events, therefore blocking respiratory droplets444
upto a very small sizes like 5µm could ideally mitigate445
such events. Clearly such physical blockage of respi-446
ratory droplets at the point of source could be accom-447
plished with high quality, well-fitted face masks. Face448
masks provide a physical obstruction to the respiratory449
droplets, and their effectiveness in restricting droplet450
penetration depends on the effective pore size. Among451
the several local and medical-grade options available in452
the market, the N95 masks are proven to be most ef-453
fective. However, for community usage, their scarcity454
and high cost during pandemic have diverted the policy-455
makers to look for other economic and easily accessible456
alternatives like surgical-mask, cotton-mask, or home-457
made face masks. Historically, the usage of the face458
mask has been shown effective in restricting disease459
transmission during pulmonary tuberculosis (aerosol-460
based), Influenza (droplet-based) based illnesses, and461
restricting community transmission in Asian countries462
during the SARS-CoV-1 epidemic [68]. Face masks are463
therefore useful in obstructing the respiratory droplets464
during exhalation and inhalation and must be used ubiq-465
uitously to restrict the transmission of COVID-19.466
Although all face coverings provide some protection,467
their relative efficacy depends on the type of mask used.468
Several studies [69–73] have been carried out in re-469
cent times, focusing on investigating mask efficacy. Fis-470
cher et al. [69] used a laser-based optical measurement471
technique to determine the effectiveness of different lo-472
cally available face coverings (compared to no face-473
covering) in restricting ejected droplets during human474
speech. Home-made substitutes (like cotton masks) had475
equivalent effectiveness as that of surgical face masks,476
and compared to no mask were found to restrict ∼80%477
of the droplets from penetration. At the same time,478
some other substitutes like bandanas or neck gaiters479
have shown low or minimal protection. Hui et al. [74]480
used a high-fidelity human patient simulator (HPS) ly-481
ing at 45o on a hospital bed for investigating the dis-482
tance travelled by cough puffs when HPS was covered483
with no-mask, surgical mask, and N95 face mask. The484
velocities of ejected coughs were varied by controlling485
the flow rate of ejected fluid from 220-650 l/min, which486
resulted in maximum cough velocities of around 8 m/s.487
The turbulent cough flow without a mask was shown488
to traverse up to 70 cm, and the distance travelled re-489
duces by a factor of 2.3 and 4.5 with the usage of sur-490
gical and N95 face masks, respectively. N95 mask ef-491
fectively reduced the translational displacement of the492
ejected cough, but a significant transverse leakage was493
observed. Recently, Khosronejad et al. [75] numerically494
studied the effectiveness of face masks in indoor envi-495
ronments and showed that saliva droplets ejected dur-496
ing coughs in a stagnant environment without a mask497
could reach a distance of 2.62 m, and the same dis-498
tance reduces to 0.48 m and 0.78 m for medical and499
non-medical grade face masks. They also emphasized500
that under the influence of mild unidirectional breeze in501
the outdoor environment, saliva particulates can travel502
long distances in the flow direction in a short period,503
and face mask usage in such situations is necessary for504
preventing the inhalation of these droplets.505
Earlier works on face masks mostly focused on deter-506
mining filtration efficiency, comparing different types of507
medical grade and makeshift masks, and investigating508
the distance traveled by the ejected cough-puff and the509
capability of the face mask in restricting it. These inves-510
tigations were mainly carried out on small-sized cough511
droplets (∼0.1 to 100 µm) that can easily transmit or512
show minimal atomization during their passage through513
the mask layers. It must be noted that droplets (sub-514
micron to millimeters sizes) across a wide size range are515
generated during human coughs. Among these droplets,516
the larger-sized droplets (> 250µm) are lesser in num-517
ber but contribute to 90% of the ejected volume [73].518
Since the viral loading inside the droplet is volumetric,519
considering the fate of such large-sized droplets during520
their impact on the mask surface becomes essential. The521
large-sized droplets usually settle on the ground within522
seconds under the influence of gravity. However, on523
impacting a mask surface above certain thresholds ve-524
locities, these droplets undergo atomization into numer-525
ous tiny daughter droplets, most of which fall under the526
critical regime of aerosolization (< 100µm) [73]. This527
mechanism showed that the risk of infection through528
this route might be higher than what is predicted by529
considering mask filtration efficiencies alone. An ex-530
perimental study in this direction was recently carried531
by Sharma et al. [73], which uncovers the evolution of532
a large-sized cough droplet during its impingement on533
single- or multi-layer face masks. The aspects of droplet534
penetration, atomization mechanism, and final size dis-535
tribution were elucidated using side view shadowgraphy536
imaging, and the experimental results of droplet pene-537
tration and atomization were also validated using exist-538
ing theoretical framework.539
During this study, the primary experiments were con-540
ducted using surrogate cough droplets of size (Di) ∼541
620µm ejected at ∼ 10m/s (typical for a cough droplet)542
and impacting on a single-, double- or triple-layer sur-543
gical face mask. Figure 5a schematically shows the at-544
omization of a virus like particle laden surrogate cough-545
9

Figure 5: Secondary atomization of cough droplets through a face mask. (a) Schematic diagram representing atomization of impacting droplet intonumerous daughter droplets after penetration through the face mask. (b) Experimental images showing the extent of penetration through single-,double- and triple-layer face masks (from top to bottom in sequence). (c) Probability distribution for the diameter of atomized droplets showingmost daughter droplets lies in the critical regime. (figure adapted from Sharma et al. [73])
droplet while impacting the mask surface. Due to high546
impact velocity and Weber number (We = ρwv2i Di/σ ∼547
50 at penetration threshold), the inertia of the droplet548
dominates over surface tension forces, and thus the sur-549
face tension effects on the phenomenon were negligi-550
ble. The impacting droplet penetrates through the mask551
layers if the kinetic energy of the impacting droplet552
overcomes the energy loss due to viscous dissipation553
during liquid flow through the porous network of the554
mask. This penetration criterion was established else-555
where [76] and was validated experimentally for differ-556
ent droplet impact velocities (vi ∼ 2–10m/s) and droplet557
diameters (Di = 250 − 1200µm) [73]. It was shown that558
penetration of droplet through the face mask is indepen-559
dent of the impacting droplet diameter provided the ef-560
fective pore size (ε) of the mask is much smaller than561
the droplet size (Di), i.e., ε << Di, which was indeed the562
case during experiments. The penetration of the droplet563
through the different layered masks is shown in Fig. 5b.564
For a single-layer mask, the impacting droplet extrudes565
through the mask layer in the form of multiple cylin-566
drical ligaments that grow in length over time, because567
of which instabilities in the form of capillary waves are568
formed on the surface of the ligaments. The growth of569
these instabilities leads to the atomization into numer-570
ous tiny droplets. The estimation of droplet size and571
breakup time based on Rayleigh-Plateau Instability cri-572
teria was done and shown to be in good match with the573
experimental data (refer to [73]). Results showed that574
thicker ligaments lead to bigger droplet sizes and longer575
breakup times, and vice versa. During droplet penetra-576
tion through double- or triple-layer mask, the ligament577
formation was not observed due to the obstruction pro-578
vided by the multiple layers of the mask. The extent of579
penetration was lesser through a double-layer mask, and580
no or single droplet penetration was observed through a581
triple-layer mask (see Fig. 5b).582
The size distribution of atomized droplets is shown583
in Fig.1C, and the blue region in this curve indicates the584
droplet sizes < 100µ m, which have a higher aerosoliza-585
tion tendency and is referred to as a critical regime. The586
majority of atomized droplets lies in a critical regime587
for both single (∼ 60%) and double layer (∼ 80%)588
face mask. Each experimental run resulted in penetra-589
tion of ∼ 110 and ∼ 20 droplets (which corresponds to590
∼ 65% and ∼ 5% of the initial volume) for single and591
double-layer masks. Even though the number counts592
of penetrated droplets differ for single and double-layer593
masks, the probability distribution of atomized droplets594
remains similar for both masks. To consider the dif-595
ference in fluid properties of DI water droplet and ac-596
tual cough droplet (containing dissolved salt and pro-597
teins), experiments were also done with surrogate respi-598
ratory fluid. Similar results of droplet size distribution599
and penetration volume percentage were observed for600
this case (refer to [73]). This indicates that the pene-601
tration and atomization of high impact velocity droplets602
through the face mask is independent of the fluid proper-603
ties. Additional experiments result with variable impact604
velocities (3-10m/s) and impact angles (45o and 60o)605
were also demonstrated to bolster further this study’s606
relevance with droplet atomization scenarios during hu-607
man coughs. It was shown that at higher impact veloc-608
ities (7-10m/s) and different impact angles, no signifi-609
10

cant difference in the daughter droplet size distribution610
and penetrated volumes were observed (refer to [73]).611
In conclusion, a single layer mask that restricts 30%612
of the droplet volume was shown least effective in the613
study. A double-layer mask was more effective and ob-614
struct ∼ 91% of droplet volume, but 27.7% of trans-615
mitted volume fall in the critical regime, and at least a616
triple-layer mask is recommended for which only single617
or no droplet penetration was observed. It must also be618
noted that any face covering, even a single layer face619
mask provides some resistance to the exhaled respira-620
tory droplets during human coughs and, as such, should621
be used whenever required and mandated by the policy-622
makers.623
5. Conclusions624
In this article, we have provided an opinion on the625
need and the possible approach to develop a multi-scale626
physics based disease spread model from first princi-627
ples. This is an ambitious goal and an ongoing en-628
deavor. Such an effort is inherently multidisciplinary629
in that one has to combine expertise of aerosol scien-630
tists, fluid dynamicists, virologists, interfacial scientists631
under one common umbrella to develop such models632
that can be used for any respiratory disease transmis-633
sion for any viral outbreak. We have shown in details634
that chemical kinetics based pandemic model can be635
coupled with droplet level physics inclusive of evapo-636
ration, dispersion and precipitation to devise a hitherto637
new methodology to predict the infection spread in the638
context of COVID-19. In particular we also showed639
how the model can be improved by incorporating viral640
load distribution and kinetics by using novel experimen-641
tal techniques. Furthermore, the model can consummate642
new physics derived from social prevention measures643
like masks and social distancing. On a related topic,644
unique atomization pathways of cough droplets in sin-645
gle or double layer masks were investigated. We lastly646
harp the importance of a first principle model well vali-647
dated by experiments as a cornerstone of any pandemic648
macroscale model in the near future.649
6. Acknowledgements650
The authors thank Dr Prasenjit Kabi and Mr. Shub-651
ham Sharma for help with figures and some writeups.652
Comments and suggestions by Prof. Prasad Kasibhatla653
from Duke University is gratefully acknowledged. S.C.654
gratefully acknowledges the Heuckroth Distinguished655
Faculty Award in Aerospace Engineering from UTIAS.656
S.B. gratefully acknowledges the funding received from657
the DST-Swarnajayanti Fellowship and DRDO Chair658
Professorship awards. A.S. gratefully acknowledges659
funding received through UCSD’s internal grants.660
[1] R. Li, S. Pei, B. Chen, Y. Song, T. Zhang, W. Yang, J. Shaman,661
Substantial undocumented infection facilitates the rapid dissem-662
ination of novel coronavirus (sars-cov-2), Science 368 (2020)663
489–493. doi:10.1126/science.abb3221.664
[2] M. Gandhi, D. S. Yokoe, D. V. Havlir, Asymptomatic transmis-665
sion, the achilles’ heel of current strategies to control covid-19,666
2020.667
[3] G. Pullano, L. Di Domenico, C. E. Sabbatini, E. Valdano,668
C. Turbelin, M. Debin, C. Guerrisi, C. Kengne-Kuetche,669
C. Souty, T. Hanslik, T. Blanchon, P.-Y. Boelle, J. Figoni,670
S. Vaux, C. Campese, S. Bernard-Stoecklin, V. Colizza, Under-671
detection of covid-19 cases in france threatens epidemic control,672
Nature (2020). URL: https://doi.org/10.1038/s41586-673
020-03095-6. doi:10.1038/s41586-020-03095-6.674
[4] J. Shaman, An estimation of undetected covid cases in france,675
https://www.nature.com/articles/d41586-020-03513-9, 2020.676
[5] R. Subramanian, Q. He, M. Pascual, Quantifying asymptomatic677
infection and transmission of covid-19 in new york city using678
observed cases, serology, and testing capacity, Proceedings of679
the National Academy of Sciences 118 (2021).680
[6] A. L. Bertozzi, E. Franco, G. Mohler, M. B. Short, D. Sledge,681
The challenges of modeling and forecasting the spread of covid-682
19, arXiv preprint arXiv:2004.04741 (2020).683
[7] D. Adam, Special report: The simulations driving the world’s684
response to covid-19., Nature 580 (2020) 316.685
[8] C. J. E. Metcalf, D. H. Morris, S. W. Park, Mathematical models686
to guide pandemic response, Science 369 (2020) 368–369.687
[9] M. Moriyama, W. J. Hugentobler, A. Iwasaki, Seasonality of688
respiratory viral infections, Annual review of virology 7 (2020).689
[10] D. N. Fisman, Seasonality of infectious diseases, Annu. Rev.690
Public Health 28 (2007) 127–143.691
[11] J. Shaman, M. Kohn, Absolute humidity modulates influenza692
survival, transmission, and seasonality, Proceedings of the Na-693
tional Academy of Sciences 106 (2009) 3243–3248.694
[12] M. L. Pohlker, O. O. Kruger, J.-D. Forster, W. Elbert,695
J. Frohlich-Nowoisky, U. Poschl, C. Pohlker, G. Bagheri, E. Bo-696
denschatz, J. A. Huffman, et al., Respiratory aerosols and697
droplets in the transmission of infectious diseases, arXiv698
preprint arXiv:2103.01188 (2021).699
[13] D. Bernoulli, Essai d’une nouvelle analyse de la mortalite700
causee par la petite verole, et des avantages de l’inoculation701
pour la prevenir, Histoire de l’Acad., Roy. Sci.(Paris) avec Mem702
(1760) 1–45.703
[14] K. Dietz, J. Heesterbeek, Daniel bernoulli’s epidemiological704
model revisited, Mathematical biosciences 180 (2002) 1–21.705
[15] W. O. Kermack, A. G. McKendrick, A contribution to the math-706
ematical theory of epidemics, Proceedings of the royal society707
of london. Series A, Containing papers of a mathematical and708
physical character 115 (1927) 700–721.709
[16] M. J. Keeling, P. Rohani, Modeling infectious diseases in hu-710
mans and animals, Princeton University Press, 2011.711
[17] R. Pastor-Satorras, C. Castellano, P. Van Mieghem, A. Vespig-712
nani, Epidemic processes in complex networks, Reviews of713
modern physics 87 (2015) 925.714
[18] N. M. Ferguson, D. A. Cummings, S. Cauchemez, C. Fraser,715
S. Riley, A. Meeyai, S. Iamsirithaworn, D. S. Burke, Strate-716
gies for containing an emerging influenza pandemic in southeast717
asia, Nature 437 (2005) 209–214.718
[19] National Institute of Health (NIH), Novel coronavirus719
structure reveals targets for vaccines and treatments,720
11

https://www.nih.gov/news-events/nih-research-matters/novel-721
coronavirus-structure-reveals-targets-vaccines-treatments,722
2020.723
[20] Proceedings of National Academy of Science (PNAS), Fluid dy-724
namics work hints at whether spoken word can spread covid-725
19, http://blog.pnas.org/2020/04/fluid-dynamics-work-hints-at-726
whether-spoken-word-can-spread-covid-19, 2020.727
[21] Fortune, Mapping a contagion: How the coronavirus may728
spread around the world, https://fortune.com/longform/how-729
coronavirus-spread-map, 2020.730
[22] L. Bourouiba, Turbulent Gas Clouds and Respiratory Pathogen731
Emissions: Potential Implications for Reducing Transmission of732
COVID-19, JAMA 323 (2020) 1837–1838. **733
** This recent review describes the trajectory of respiratory734
droplets and droplet-cloud after violent expiratory events. The735
work highlights that the droplet could initially behaves like a736
turbulent jet and subsequently, transforms to a turbulent puff.737
[23] S. Chaudhuri, S. Basu, A. Saha, Analyzing the dominant sars-738
cov-2 transmission routes toward an ab initio disease spread739
model, Physics of Fluids 32 (2020) 123306. **740
** This work is probably the first attempt to develop a disease741
spread model from the flow physics of transmission. This is done742
by analyzing the relative importance of evaporating respiratory743
droplets and their dried droplet nuclei as function of distance744
and time from the subject, in the transmission of disease.745
[24] C. K. Law, Combustion Physics, Cambridge University Press,746
2006. doi:10.1017/CBO9780511754517.747
[25] P. Hohenberg, W. Kohn, Inhomogeneous electron gas, Physical748
review 136 (1964) B864.749
[26] K. A. Prather, L. C. Marr, R. T. Schooley, M. A. McDiarmid,750
M. E. Wilson, D. K. Milton, Airborne transmission of sars-cov-751
2, Science 370 (2020) 303–304. *752
* This is an important recent article which highlights proper def-753
inition of aerosol when it comes to respiratory droplet. The pa-754
per suggests that the respiratory droplets smaller than 100 mi-755
cron should be called ”aerosols” since these droplets can remain756
airborne for much longer time and travel to long distances com-757
pared to the larger droplets.758
[27] L. Morawska, D. K. Milton, It is time to address airborne trans-759
mission of coronavirus disease 2019 (covid-19), Clinical Infec-760
tious Diseases 71 (2020) 2311–2313.761
[28] S. L. Miller, W. W. Nazaroff, J. L. Jimenez, A. Boerstra, G. Buo-762
nanno, S. J. Dancer, J. Kurnitski, L. C. Marr, L. Morawska,763
C. Noakes, Transmission of sars-cov-2 by inhalation of respi-764
ratory aerosol in the skagit valley chorale superspreading event,765
Indoor air 31 (2021) 314–323.766
[29] Y. Li, H. Qian, J. Hang, X. Chen, P. Cheng, H. Ling, S. Wang,767
P. Liang, J. Li, S. Xiao, et al., Probable airborne transmission768
of sars-cov-2 in a poorly ventilated restaurant, Building and769
Environment (2021) 107788.770
[30] P. Azimi, Z. Keshavarz, J. G. C. Laurent, B. Stephens, J. G.771
Allen, Mechanistic transmission modeling of covid-19 on the772
diamond princess cruise ship demonstrates the importance of773
aerosol transmission, Proceedings of the National Academy of774
Sciences 118 (2021).775
[31] J. A. Lednicky, M. Lauzard, Z. H. Fan, A. Jutla, T. B.776
Tilly, M. Gangwar, M. Usmani, S. N. Shankar, K. Mohamed,777
A. Eiguren-Fernandez, et al., Viable sars-cov-2 in the air of a778
hospital room with covid-19 patients, International Journal of779
Infectious Diseases 100 (2020) 476–482. *780
* This work provides the most important proof that Covid-19781
is an airborne disease. Virus collected from significant distance782
from Covid-19 patients were successfully cultured.783
[32] E. Riley, G. Murphy, R. Riley, Airborne spread of measles in a784
suburban elementary school, American journal of epidemiology785
107 (1978) 421–432.786
[33] S. Rudnick, D. Milton, Risk of indoor airborne infection trans-787
mission estimated from carbon dioxide concentration, Indoor788
air 13 (2003) 237–245.789
[34] G. Buonanno, L. Stabile, L. Morawska, Estimation of airborne790
viral emission: quanta emission rate of sars-cov-2 for infection791
risk assessment, Environment International (2020) 105794.792
[35] W. Chen, N. Zhang, J. Wei, H.-L. Yen, Y. Li, Short-range air-793
borne route dominates exposure of respiratory infection during794
close contact, Building and Environment (2020) 106859.795
[36] H. Parhizkar, K. Van Den Wymelenberg, C. Haas, R. Corsi, A796
quantitative risk estimation platform for indoor aerosol trans-797
mission of covid-19, medRxiv (2021).798
[37] J. Duguid, The numbers and the sites of origin of the droplets799
expelled during expiratory activities, Edinburgh Medical Jour-800
nal 52 (1945) 385.801
[38] C. Lieber, S. Melekidis, R. Koch, H.-J. Bauer, Insights into the802
evaporation characteristics of saliva droplets and aerosols: Lev-803
itation experiments and numerical modeling, Journal of aerosol804
science (2021) 105760.805
[39] S. Chaudhuri, S. Basu, P. Kabi, V. R. Unni, A. Saha, Model-806
ing the role of respiratory droplets in covid-19 type pandemics,807
Physics of Fluids 32 (2020) 063309.808
[40] C. N. HAAS, Estimation of risk due to low doses of microor-809
ganisms: a comparison of alternative methodologies, American810
journal of epidemiology 118 (1983) 573–582.811
[41] M. Schuit, S. Ratnesar-Shumate, J. Yolitz, G. Williams,812
W. Weaver, B. Green, D. Miller, M. Krause, K. Beck, S. Wood,813
et al., Airborne sars-cov-2 is rapidly inactivated by simulated814
sunlight, The Journal of Infectious Diseases (2020).815
[42] U. S. Department of Homeland Security, Estimated Air-816
borne Decay of SARS-CoV-2; https://www.dhs.gov/science-817
and-technology/sars-airborne-calculator, Technical Report, ????818
URL: https://www.dhs.gov/science-and-technology/819
sars-airborne-calculator.820
[43] C. Haas, Action levels for sars-cov-2 in air: A preliminary ap-821
proach (2020).822
[44] J. Schijven, L. C. Vermeulen, A. Swart, A. Meijer, E. Duizer,823
A. M. de Roda Husman, Quantitative microbial risk assessment824
for airborne transmission of sars-cov-2 via breathing, speaking,825
singing, coughing, and sneezing, Environmental health perspec-826
tives 129 (2021) 047002.827
[45] P. C. Mushenheim, R. R. Trivedi, H. H. Tuson, D. B. Weibel,828
N. L. Abbott, Dynamic self-assembly of motile bacteria in liquid829
crystals, Soft Matter 10 (2014) 88–95.830
[46] E. Lauga, Bacterial hydrodynamics, Annual Review of Fluid831
Mechanics 48 (2016) 105–130.832
[47] R. D. Deegan, O. Bakajin, T. F. Dupont, G. Huber, S. R. Nagel,833
T. A. Witten, Capillary flow as the cause of ring stains from834
dried liquid drops, Nature 389 (1997) 827–829.835
[48] R. D. Deegan, O. Bakajin, T. F. Dupont, G. Huber, S. R. Nagel,836
T. A. Witten, Contact line deposits in an evaporating drop, Phys-837
ical review E 62 (2000) 756.838
[49] H. Hu, R. G. Larson, Marangoni effect reverses coffee-ring839
depositions, The Journal of Physical Chemistry B 110 (2006)840
7090–7094.841
[50] P. J. Yunker, T. Still, M. A. Lohr, A. Yodh, Suppression of the842
coffee-ring effect by shape-dependent capillary interactions, Na-843
ture 476 (2011) 308–311.844
[51] R. G. Larson, Transport and deposition patterns in drying sessile845
droplets, AIChE Journal 60 (2014) 1538–1571.846
[52] M. Zhao, X. Yong, Modeling evaporation and particle assembly847
in colloidal droplets, Langmuir 33 (2017) 5734–5744.848
[53] E. P. Vejerano, L. C. Marr, Physico-chemical characteristics849
of evaporating respiratory fluid droplets, Journal of The Royal850
12

Society Interface 15 (2018) 20170939. **851
** This work describes a pioneering experiment to image and852
understand virus distribution inside dried droplet nuclei.853
[54] A. Rasheed, S. Sharma, P. Kabi, A. Saha, S. Chaudhuri, S. Basu,854
Insights into the precipitation dynamics of surrogate respira-855
tory sessile droplets leading to possible fomites, Under Review856
(2021).857
[55] S. Basu, P. Kabi, S. Chaudhuri, A. Saha, Insights on drying and858
precipitation dynamics of respiratory droplets from the perspec-859
tive of covid-19, Physics of Fluids (2020).860
[56] A. Yarin, M. Pfaffenlehner, C. Tropea, On the acoustic levitation861
of droplets, Journal of Fluid Mechanics 356 (1998) 65–91.862
[57] A. Yarin, G. Brenn, O. Kastner, D. Rensink, C. Tropea, Evap-863
oration of acoustically levitated droplets, Journal of Fluid Me-864
chanics 399 (1999) 151–204.865
[58] A. Saha, S. Basu, C. Suryanarayana, R. Kumar, Experimental866
analysis of thermo-physical processes in acoustically levitated867
heated droplets, International Journal of Heat and Mass Transfer868
53 (2010) 5663 – 5674.869
[59] A. Saha, S. Basu, R. Kumar, Effects of acoustic-streaming-870
induced flow in evaporating nanofluid droplets, Journal of Fluid871
Mechanics 692 (2012) 207–219.872
[60] Y. Wei, Y. Yang, J. Zhang, S. Deng, S. Liu, C. K. Law, A. Saha,873
Atomization of acoustically levitated droplet exposed to hot874
gases, Applied Physics Letters 116 (2020) 044101.875
[61] K. Hasegawa, Y. Abe, A. Kaneko, Y. Yamamoto, K. Aoki, Vi-876
sualization measurement of streaming flows associated with a877
single-acoustic levitator, Microgravity Science and Technology878
21 (2009) 9–14.879
[62] A. Saha, S. Basu, R. Kumar, Particle image velocimetry and880
infrared thermography in a levitated droplet with nanosilica sus-881
pensions, Experiments in Fluids 52 (2012) 795–807.882
[63] A. Saha, S. Basu, R. Kumar, Velocity and rotation measure-883
ments in acoustically levitated droplets, Physics Letters A 376884
(2012) 3185–3191.885
[64] W. A. Sirignano, Fluid Dynamics and Transport of Droplet and886
Sprays, Cambridge University Press, 2010.887
[65] K. Lin, L. C. Marr, Humidity-dependent decay of viruses, but888
not bacteria, in aerosols and droplets follows disinfection ki-889
netics, Environmental Science & Technology 54 (2019) 1024–890
1032. *891
* This is another very important work that provides fundamen-892
tal insights on how virus half-life is a non-monotonic function893
of relative humidity.894
[66] D. H. Morris, K. C. H. Yinda, A. Gamble, F. W. Rossine,895
Q. Huang, T. Bushmaker, R. J. Fischer, M. J. Matson, N. van896
Doremalen, P. J. Vikesland, et al., The effect of temperature897
and humidity on the stability of sars-cov-2 and other enveloped898
viruses, bioRxiv (2020).899
[67] L. C. Marr, J. W. Tang, J. Van Mullekom, S. S. Lakdawala,900
Mechanistic insights into the effect of humidity on airborne in-901
fluenza virus survival, transmission and incidence, Journal of902
the Royal Society Interface 16 (2019) 20180298. **903
**This is an important publication that discusses effects of am-904
bient humidity and temperature on air-borne virus lifetime. The905
paper also shows that relative humidity, not absolute humidity906
controls the evaporation rate of droplets and as such dictates907
virus lifetime.908
[68] S. Esposito, N. Principi, C. C. Leung, G. B. Migliori, Univer-909
sal use of face masks for success against covid-19: evidence910
and implications for prevention policies, European Respiratory911
Journal 55 (2020).912
[69] E. P. Fischer, M. C. Fischer, D. Grass, I. Henrion, W. S. Warren,913
E. Westman, Low-cost measurement of face mask efficacy for914
filtering expelled droplets during speech, Science Advances 6915
(2020) eabd3083. **916
** A critical paper in assessing efficacy of various quality of917
facemasks used during COVID-19. The study develops a sim-918
pler measurement system to quantify the blockage ratio for a919
wide range of mask-types.920
[70] T. Dbouk, D. Drikakis, On respiratory droplets and face masks,921
Physics of Fluids 32 (2020) 063303.922
[71] S. Verma, M. Dhanak, J. Frankenfield, Visualizing the effec-923
tiveness of face masks in obstructing respiratory jets, Physics of924
Fluids 32 (2020) 061708.925
[72] S. Kumar, H. P. Lee, The perspective of fluid flow behavior926
of respiratory droplets and aerosols through the facemasks in927
context of sars-cov-2, Physics of Fluids 32 (2020) 111301.928
[73] S. Sharma, R. Pinto, A. Saha, S. Chaudhuri, S. Basu, On sec-929
ondary atomization and blockage of surrogate cough droplets in930
single- and multilayer face masks, Science Advances 7 (2021).931
doi:10.1126/sciadv.abf0452, *932
*This is a recent investigation on fate of cough droplets as they933
impact single- and multi-layer masks. The paper clearly iden-934
tifies that a high momentum, large cough droplet penetrates935
single and double-layer facemasks producing many smaller936
aerosolized droplets.937
[74] D. S. Hui, B. K. Chow, L. Chu, S. S. Ng, N. Lee, T. Gin, M. T.938
Chan, Exhaled air dispersion during coughing with and without939
wearing a surgical or n95 mask, Plos one 7 (2012) e50845.940
[75] A. Khosronejad, C. Santoni, K. Flora, Z. Zhang, S. Kang,941
S. Payabvash, F. Sotiropoulos, Fluid dynamics simulations show942
that facial masks can suppress the spread of covid-19 in indoor943
environments, AIP Advances 10 (2020) 125109.944
[76] R. P. Sahu, S. Sinha-Ray, A. Yarin, B. Pourdeyhimi, Drop im-945
pacts on electrospun nanofiber membranes, Soft Matter 8 (2012)946
3957–3970.947
13

Authors declare No Conflicts of Interest
Journ
al Pre-
proof